Article

Research on the Impact of Polycentric City Network on Economic Growth in the Yangtze River Delta Urban Agglomeration

1
School of Management Engineering, Anhui Institute of Information Technology, Wuhu 020205, China
2
Department of Economic and Management, Anhui Polytechnic University, Wuhu 241000, China
*
Author to whom correspondence should be addressed.
Sustainability 2025, 17(7), 3267; https://doi.org/10.3390/su17073267
Submission received: 5 February 2025 / Revised: 20 March 2025 / Accepted: 29 March 2025 / Published: 7 April 2025

Abstract

:
The Yangtze River Delta region is facing the demand for high-quality economic development, and the study of urban network as a manifestation of the interaction between cities is becoming increasingly important. This study focused on the node structure of the urban network in the Yangtze River Delta urban agglomeration from 2010 to 2021, used the modified gravity model to construct a polycentric city network from the perspective of economic flow, used the spatial Durbin model for spatial econometric analysis, and identified the conduction path through the two-step method of causal stepwise regression mediating effect test. The results show that Shanghai, as the core node city, has significantly promoted the economic development of Hangzhou, Nanjing, Hefei, and other cities and formed a metropolitan network structure characterized by “one core and five circles”. Under different spatial weight matrices, the polycentric city network has a significant positive impact on economic growth, and its impact is not only related to the economic level of the city itself but also closely related to the economic status of its neighboring cities. The polycentric city network significantly enhances economic growth by accelerating the flow of regional factors, promoting regional industrial division of labor and cooperation, and enhancing regional innovation capabilities.

1. Introduction

The Yangtze River Delta region is confronted with the imperative of high-quality economic development. The report of the 20th National Congress emphasized the need to focus on promoting high-quality development as the overarching theme. It called for efforts to enhance the quality and effectiveness of economic growth while ensuring reasonable quantitative expansion. The economic development of the Yangtze River Delta region plays an important role in the overall regional development strategy of the country. It is not only a key power source for promoting national economic growth but also an important link to achieving the goal of socialist modernization. At the same time, the development of the Yangtze River Delta urban agglomeration is increasingly showing a multi-center network situation. With the rapid development of transportation and communication technology and the rise of network society, regional “flow space” has begun to replace the traditional “local space” [1]. The transformation of urban network structure from a single central place hierarchy system to a multi-center and multi-level network system not only promotes the in-depth study of urban networks but also provides new opportunities for the cooperation and development of cities. The development of urban network research has witnessed the evolution of urban planning and regional development theories. As early as the 1930s, Western scholars had begun to explore early theories of urban networks. Among them, Christalle’s central place theory was a landmark achievement. It interpreted the spatial system of regions and countries as the interrelationship between different levels of central places and their peripheral hinterlands, laying a foundation for later research on urban networks. Over time, especially into the 1950s, the rise of urban groupings led to the upsurge of research on urban agglomerations and urban architecture. Research in this period began to focus on the interactions and network connections between cities, providing a new perspective for understanding the complexity of urban networks [2]. In 1973, Richardson incorporated the change of regional internal spatial structure and its impact on regional growth into the discussion of neoclassical growth theory, further enriching the theoretical depth of urban network research. Castells’ theory reveals how interregional flow interactions promote inter-city economic growth through network effects, thereby driving changes in regional spatial organization. In general, the development of urban network research reflects the trend of changing from a single central place model to a network model [3].
“Agglomeration shadow” and “borrowed size” are important concepts in regional and urban economics that have garnered widespread attention in urban network studies in recent years [4,5]. Agglomeration shadow describes the negative externalities that the spatial agglomeration of economic activities imposes on surrounding areas. When a region attracts a large amount of resources and enterprises due to agglomeration economies (such as economies of scale, knowledge spillovers, and specialization), surrounding areas may lag behind in development due to resource outflow and industrial hollowing out [6]. Meanwhile, the concept of borrowed size provides a new perspective for understanding the economic linkages between cities. Borrowed size describes the economic growth of smaller cities through proximity to larger cities, sometimes even surpassing the larger cities themselves [7]. Research has shown that the impact of urban network linkages on economic growth varies with urban functional differences. The existence of network externalities (such as borrowed size and agglomeration shadow) breaks through the limitations of traditional agglomeration theories and offers a more comprehensive explanation of urban economic dynamics [8]. Le Chen’s research constructs a theoretical framework that considers both intracity and intercity agglomeration, verifying the impact of borrowed size and agglomeration shadow on urban economic growth. The study found that the borrowed size effect is more pronounced in Chinese cities, with a positive impact on economic growth that outweighs the agglomeration shadow [9].
The study of urban networks has become one of the focuses of space science in China in recent years [10,11,12,13]. Referring to the research methods of Western scholars, domestic scholars have carried out in-depth empirical studies on the linkages between enterprises, transportation infrastructure, social activities, innovative development, and other dimensions and made key progress in three aspects of network identification and spatiotemporal evolution, structural characteristics and influencing factors, external effects, and spatial differences [14,15,16,17]. These studies provide solid empirical support for urban network research and contribute perspective and empirical experience with Chinese characteristics to the construction of urban network theory. Because the imbalance of regional development is prominent in China, the role of urban network in regional economic growth has become the focus of domestic academic circles. Cao W and Han L [18] conducted a multi-regional in-depth analysis of 285 cities and ten major urban agglomerations nationwide and found that the agglomeration shadow effect of network externalities was more significant nationwide, and network externalities had a significant positive impact on urban production efficiency in both urban agglomerations and non-urban agglomerations. Improving traffic conditions and enhancing the complementarity of urban functions can positively regulate the relationship between network externality and production efficiency. Liu and Zhao [19] identified the cyberspace characteristics of the three major urban agglomerations along the Yangtze River Economic Belt and found that the level of networking was positively correlated with the spatial spillover effect and the level of coordinated development of urban agglomerations. Zhang and Xiang [20] quantitatively measured the transport networks of the top ten urban agglomerations in China and proposed that the integration level of the transport networks of urban agglomerations can promote urban economic growth by promoting the integration of the commodity market and the labor market of urban agglomerations.
The development of urban networks marks a major shift in the regional development pattern [21]. It breaks through the limitations of traditional geographical space, builds a new type of economic connection through efficient transportation facilities and factor flow, and forms a broader economic interaction and cooperation platform [22]. The construction of an urban network quantifies the inter-city dependency and provides a perspective for evaluating the integration degree and connectivity of the urban system [23]. “Network” refers to the connection between cities, and “network” refers to nodes where cities act as connection points. In modern society, urban networks are the basis for understanding urban economic efficiency and functional specialization [24]. The driving influence of the evolution of urban network structure on the coordinated development of the regional economy cannot be separated from the core transmission links such as factors, industry, and innovation. The improvement of the quality of regional economic growth is usually closely related to the allocation of factor resources [25], the development of innovative technologies, and the upgrading of industrial structure in the region [26]. The existence of polycentric city network can improve the flow relationship of factors, optimize the industrial division of labor and cooperation, and enhance the ability of technological innovation. Therefore, the improvement of the centrality of the node city network is bound to have an important impact on economic growth [27].
The development of multi-center systems and networks based on the interrelation and interaction between cities has become an important trend in the evolution of urban spatial structure at home and abroad, and the relevant research paradigm has also changed from the city level to city network [28]. However, at present, the study of two key issues still need to be expanded upon and deepened. First, in theory, most of the relevant literature has focused on conceptual analysis and structural analysis, and it is urgent to analyze the driving mechanism and transmission mechanism of the multi-center city network’s impact on regional economic growth in depth. Second, the empirical tests for examining the urban network structure based on typical regions and fully considering the spatial effect are relatively insufficient, and further supplementation is needed.
Therefore, based on existing studies, this paper will explore the relationship between polycentric city network and regional economic growth from theoretical and empirical dimensions. By constructing the theoretical framework and econometric model, the paper aims to reveal the complex influence mechanism of the urban network on regional economic development. At the same time, this paper will also discuss how to optimize the urban network structure to promote the balanced and sustainable development of the regional economy and provide strategic suggestions for realizing the long-term stable growth of the regional economy.

2. Theoretical Analysis and Research Hypothesis

2.1. Polycentric City Network and Economic Growth

From the macro process perspective, agglomeration economies promote urban economic growth by increasing the unit cost of labor, improving the urban consumption environment, and creating a “learning effect” in the city [29,30]. From the microcosmic process perspective, agglomeration economies affect urban economic growth through sharing, matching, and learning [31].
Compared with agglomeration economy, the externality of the urban network does not depend on the geographical proximity of cities but on the connections in the network and produces trans-spatial spillover effects [32,33]. This complementarity helps to prevent the negative effects of excessive concentration, harmonize individual development with regional interests, and achieve inclusive growth [34]. Cities’ embeddedness in networks at different levels is becoming increasingly important to their performance [35]. Cities can obtain development factors from larger cities through their favorable position in urban networks, and there is also the possibility of accelerating the loss of factors due to inter-city connections [36]. The “borrowing scale” and “agglomeration shadow” effects in urban network may exist simultaneously. When the “agglomeration shadow” effect is stronger than the “borrowing scale” effect, the externality of the urban network has a significant negative correlation with production efficiency [37,38].
Based on this, this paper puts forward hypothesis 1: the multi-center city network in the Yangtze River Delta region promotes urban economic growth, and the phenomenon of borrowing scale is obvious.

2.2. Regional Factor Flow Conduction Path

The position of cities in the urban network depends on their competitiveness, providing a strategic environment for the movement of labor, capital, goods, and services. Many studies have focused on the impact of factor flow and other indicators on economic growth [39,40]. The flow of production factors at the micro level underlies the relationship between urban spatial form and economic growth; that is, the urban network constitutes a factor pool that breaks geographical boundaries in terms of consumer market and infrastructure [41,42]. Decentralized enterprises in the urban network can establish cross-space connections with each other through cooperation and transactions, which means that the externality of the urban network can replace the agglomeration economy to a certain extent and further expand the spatial scope of factors, commodity flows, and knowledge spillovers [43].
Based on this, this paper proposes hypothesis 2: the polycentric city network promotes economic growth by accelerating regional factor flow.

2.3. Transmission Path of the Industrial Division of Labor Cooperation

The fuzziness of urban boundaries and the network of urban connections promote the optimization of spatial patterns [44,45,46]. For one, the essence of the process of the agglomeration of production factors to cities is urbanization [47], and it is the transfer of primary industry to secondary and tertiary industries, which can promote the agglomeration of secondary and tertiary third industries in cities [48]. For another, the free flow of factors and regional agglomeration increase the opportunities for face-to-face communication, improves the possibility of knowledge spillover and dissemination, and promotes the optimization and upgrading of industrial structure [49]. Therefore, urban agglomeration externalities can affect regional economic growth by changing the regional labor skill structure. The specialized division of labor and cooperation with complementary functions can be formed within urban agglomerations.
Based on this, this paper proposes hypothesis 3: Given the influence of a polycentric city network on economic growth, economic growth can be enhanced by promoting the industrial division of labor and cooperation.

2.4. Transmission Path of Innovation Ability Improvement

By establishing the supply-and-demand relationship and the flow rules of factors, the city network reduces the cost of knowledge and technology transaction, has more innovation advantages than does a single city, and changes the previous one-way, stepped transmission of innovation results from the core city to the secondary city [50]. With the help of network externalities, cities can break through the limitation of spatial distance, benefit from knowledge spillover, and realize innovative development [51]. Urban networks will facilitate the exchange of information among innovation agents and complement the traditional role of agglomeration economy in promoting experience sharing, factor matching, knowledge learning, etc.
Based on this, this paper proposes hypothesis 4: Based on the impact of the multi-center city network on economic growth, improving urban innovation ability can promote economic growth.

3. Research Design

3.1. Model Setting and Data Description

3.1.1. Model Setting

The production function describes how input factors are transformed into output factors, which can be applied at different levels from individual firms to entire industries and even the entire economy [52]. This paper adopts the generalized Cobb–Douglas regional production function, which considers the traditional production factors and integrates the spatial structure factors of the polycentric urban network to explain the regional output changes more comprehensively. The form is as follows:
Y = A ( N e t , P o l y ) K α L β G λ I γ
where Y represents output; A(Net, Poly) is the efficiency term of the model, which represents the influence of spatial structure factors of the polycentric urban network, including the strength of network connection (Net) and spatial structure characteristics (Poly)’ K is physical capital; L is human capital; G is government spending; and I is the other factors that affect output.
Take the logarithm of both sides of the formula and convert it to a linear form as follows:
ln Y = α 0 + θ ln N e t + μ ln P o l y + α ln K + β ln L + λ ln G + γ ln I
To conduct an in-depth analysis of the influence of urban network on regional production, this study concretized the concepts of urban network connection and polycentrality into spatial weight matrix and urban degree centrality and quantified the degree of agglomeration and status of each city in the network. The spatial Durbin model with general characteristics and full consideration of spatial effects is adopted as follows:
p l i i t = α 0 + ρ j = 1 N w i j p l i j t + β 1 deg it + β 2 X i t + θ 1 j = 1 N w i j deg jt + θ 2 j = 1 N w i j X j t + v i + μ t + ε i t
wherein, subindex ij represents the city, t represents the year, explained variable pli represents the level of urban economic growth in the Yangtze River Delta region, wij represents the element of row i and column j of N × N non-negative spatial weight matrix w, core explanatory variable deg represents the degree centrality of each city in the multi-center network, and X represents other explanatory variables. With human capital, material capital, government expenditure, etc., being included ρ, β and θ are the parameters to be estimated; ρ represents the spatial spillover effect of the explained variable in other regions to the explained variable in this city; θ1 represents the spatial spillover effect of the degree centrality of other cities to the explained variable in this city; and vi, μt, and εit represent the individual effect, time effect, and random disturbance term, respectively.
In the original data, the natural logarithm is taken for most explanatory variables in the empirical study to eliminate the difference of heteroscedasticity and the order of magnitude of variables. All explanatory variables in the model are applied with values with a one-stage lag to eliminate potential endogenous effects.
Spatial weight matrix is used for the interrelation of spatial objects and can solve the problem of digital representation of geospatial structure. A spatial weight matrix satisfying the requirements of exogeneity is constructed to capture the spatial structure characteristics of regional urban network. Given the the economic development level and geographical spatial distribution of the cities in the Yangtze River Delta urban agglomeration, adjacent spatial weight matrix w1, second-order inverse distance spatial weight matrix w2, and economic spatial weight matrix w3 are constructed from geographical and economic characteristics, respectively. The specific construction formula is as follows:
w 1 = 1 ,   i   is   adjacent   to   j 0 ,   i   and   j   are   not   adjacent
w 2 = 1 d i j 2
w 3 = 1 G i G j ,   i j 0 ,   i = j

3.1.2. Data Description

The explained variable is the level of economic growth (pli), which is represented by the average brightness value of night lights [53]. The core explanatory variable is network node centrality (deg), represented by degree centrality. The inter-city economic connection matrix is constructed by using the indicators of the urban resident population, regional gross product, and geographical distance, and the social network analysis method is used to measure the degree centrality of each urban node. The variable value’s size represents the city’s central power in the network. The greater the degree of centrality is, the more the city is in the core position in the network
Based on previous studies, 8 control variables were selected for this paper. (1) The first is human capital (stu). According to the new growth theory, the accumulation of knowledge and specialized human capital is the driving force for sustained economic growth, and the education level of workers is a more accurate indicator for measuring human capital, which is limited by the availability of data and expressed by the proportion of college students in the total population. (2) The second variable is physical capital (fai). Fixed capital is an important driving force for economic growth, and based on existing studies, is measured by the proportion of fixed asset investment to regional GDP. (3) The third variable is government expenditure (fin). The economic participation of local governments and officials “competing for growth” has an impact on local economic development that cannot be ignored, and this is expressed as the proportion of government fiscal expenditure to the gross regional product. (4) The fourth variable is openness to the outside world (ftd). The level of a city’s openness to the outside world represents the close degree of the city’s economic ties with foreign countries, and economic growth can be improved by introducing advanced foreign technologies. Here, foreign trade dependence measures openness to the outside world. (5) The fifth variable is infrastructure (inf). This reflects the city’s transportation infrastructure level and is expressed by the per capita road area of the municipal district. (6) The sixth variable is urbanization rate (urb). The difference of city level reflects the difference in economic development stage while affecting the level of economic growth. This is expressed by the proportion of urban population in the total population of the region and mainly used to control the difference of urban development stage. (7) The seventh variable is innovation and entrepreneurship (inn). This reflects the entrepreneurial vitality and performance of each city and is expressed by the regional innovation and entrepreneurship index via the Peking University Open Research Data Platform. (8) The eighth variable is industrial structure (ind). Given the actual production activities, the regional industrial structure will have an important impact on regional economic growth, and the introduction of secondary and tertiary industry output value can account for the proportion of total output value. The descriptive statistics of each variable are shown in Table 1.
ArcGIS 10.7 software drew the network node centrality and economic growth level of the Yangtze River Delta urban agglomerations in 2010, 2014, 2018, and 2021. With 2010 serving as the base period, the natural breakpoint method was used to visualize the strength of the two urban agglomerations. The size of the city point represents the degree center, and the different colors of the administrative area represent the strength of the night light.

3.2. Network Construction, Data Acquisition, and Research Methods

3.2.1. Construction of the Multi-Center City Network

Based on the spatial interaction theory, it is more convincing to construct the measurement index of urban network according to the gravity model, combine urban network with economic growth, and explore the role of urban network on economic growth. Its expression is as follows:
c o n i j = k i j P i G i P j G j d i j α ,   k i j = G i G i + G j
In the above formula, conij represents the intensity of economic ties between city i and city j; Pi and Pj represent the permanent population of city i and city j, respectively; Gi and Gj represent the gross regional product of city i and city j, respectively; dij represents the Euclidean distance between city i and city j, calculated by ArcGIS; kij is the correction coefficient representing the economic contribution of city i to city i and city j; and α represents the friction coefficient between the two places, generally set to 2.

3.2.2. Night Light Data Acquisition

The study used satellite remote sensing night light data provided by the National Geophysical Data Center, updated periodically from 1992 to 2013 and covering 22 years of DMSP/OLS data sets captured by multiple satellites in different years. Since 2011, the NPP satellite-mounted VIIRS has operated, providing more sensitive capture of city, ocean, and road lights, higher-quality image data, and effective supplementation of DMSP/OLS data in cell maturation and low resolution.
Firstly, DMSP/OLS data were preprocessed, stable bright spot pixels were extracted, continuous correction was carried out to overcome the problem of insufficient accuracy and saturation value of DMSP/OLS data, and more accurate and reliable night light data were obtained. Secondly, NPP/VIIRS data were preprocessed to identify and eliminate data outliers and carry out continuity correction to ensure the time series consistency of data. Finally, DMSP/OLS and NPP/VIIRS data from 2013 were used for regression analysis, and a power function model was constructed to construct long-term night light data.
As shown in Figure 1, it is not difficult to find that cities with a high degree centrality tend to have high night light values, and the area with high night light values is constantly spreading around the center of Shanghai.

3.2.3. Methods of Social Network Analysis

The urban network matrix constructed according to the gravity model uses the social network analysis software UCINET 6.186 where the value above the mean is 1 and that below the mean is 0. With the help of spatial and social network analysis methods, the multi-center city network of Yangtze River Delta urban agglomeration is described from the individual node level. Nodes are usually measured by degree centrality, which indicates the extensive communication between nodes and other nodes, reflecting the status and influence of each city in the urban network.

4. Network Node Characteristics and Spatial Distribution Characteristics of Economic Growth

4.1. Urban Network Structure Characteristics

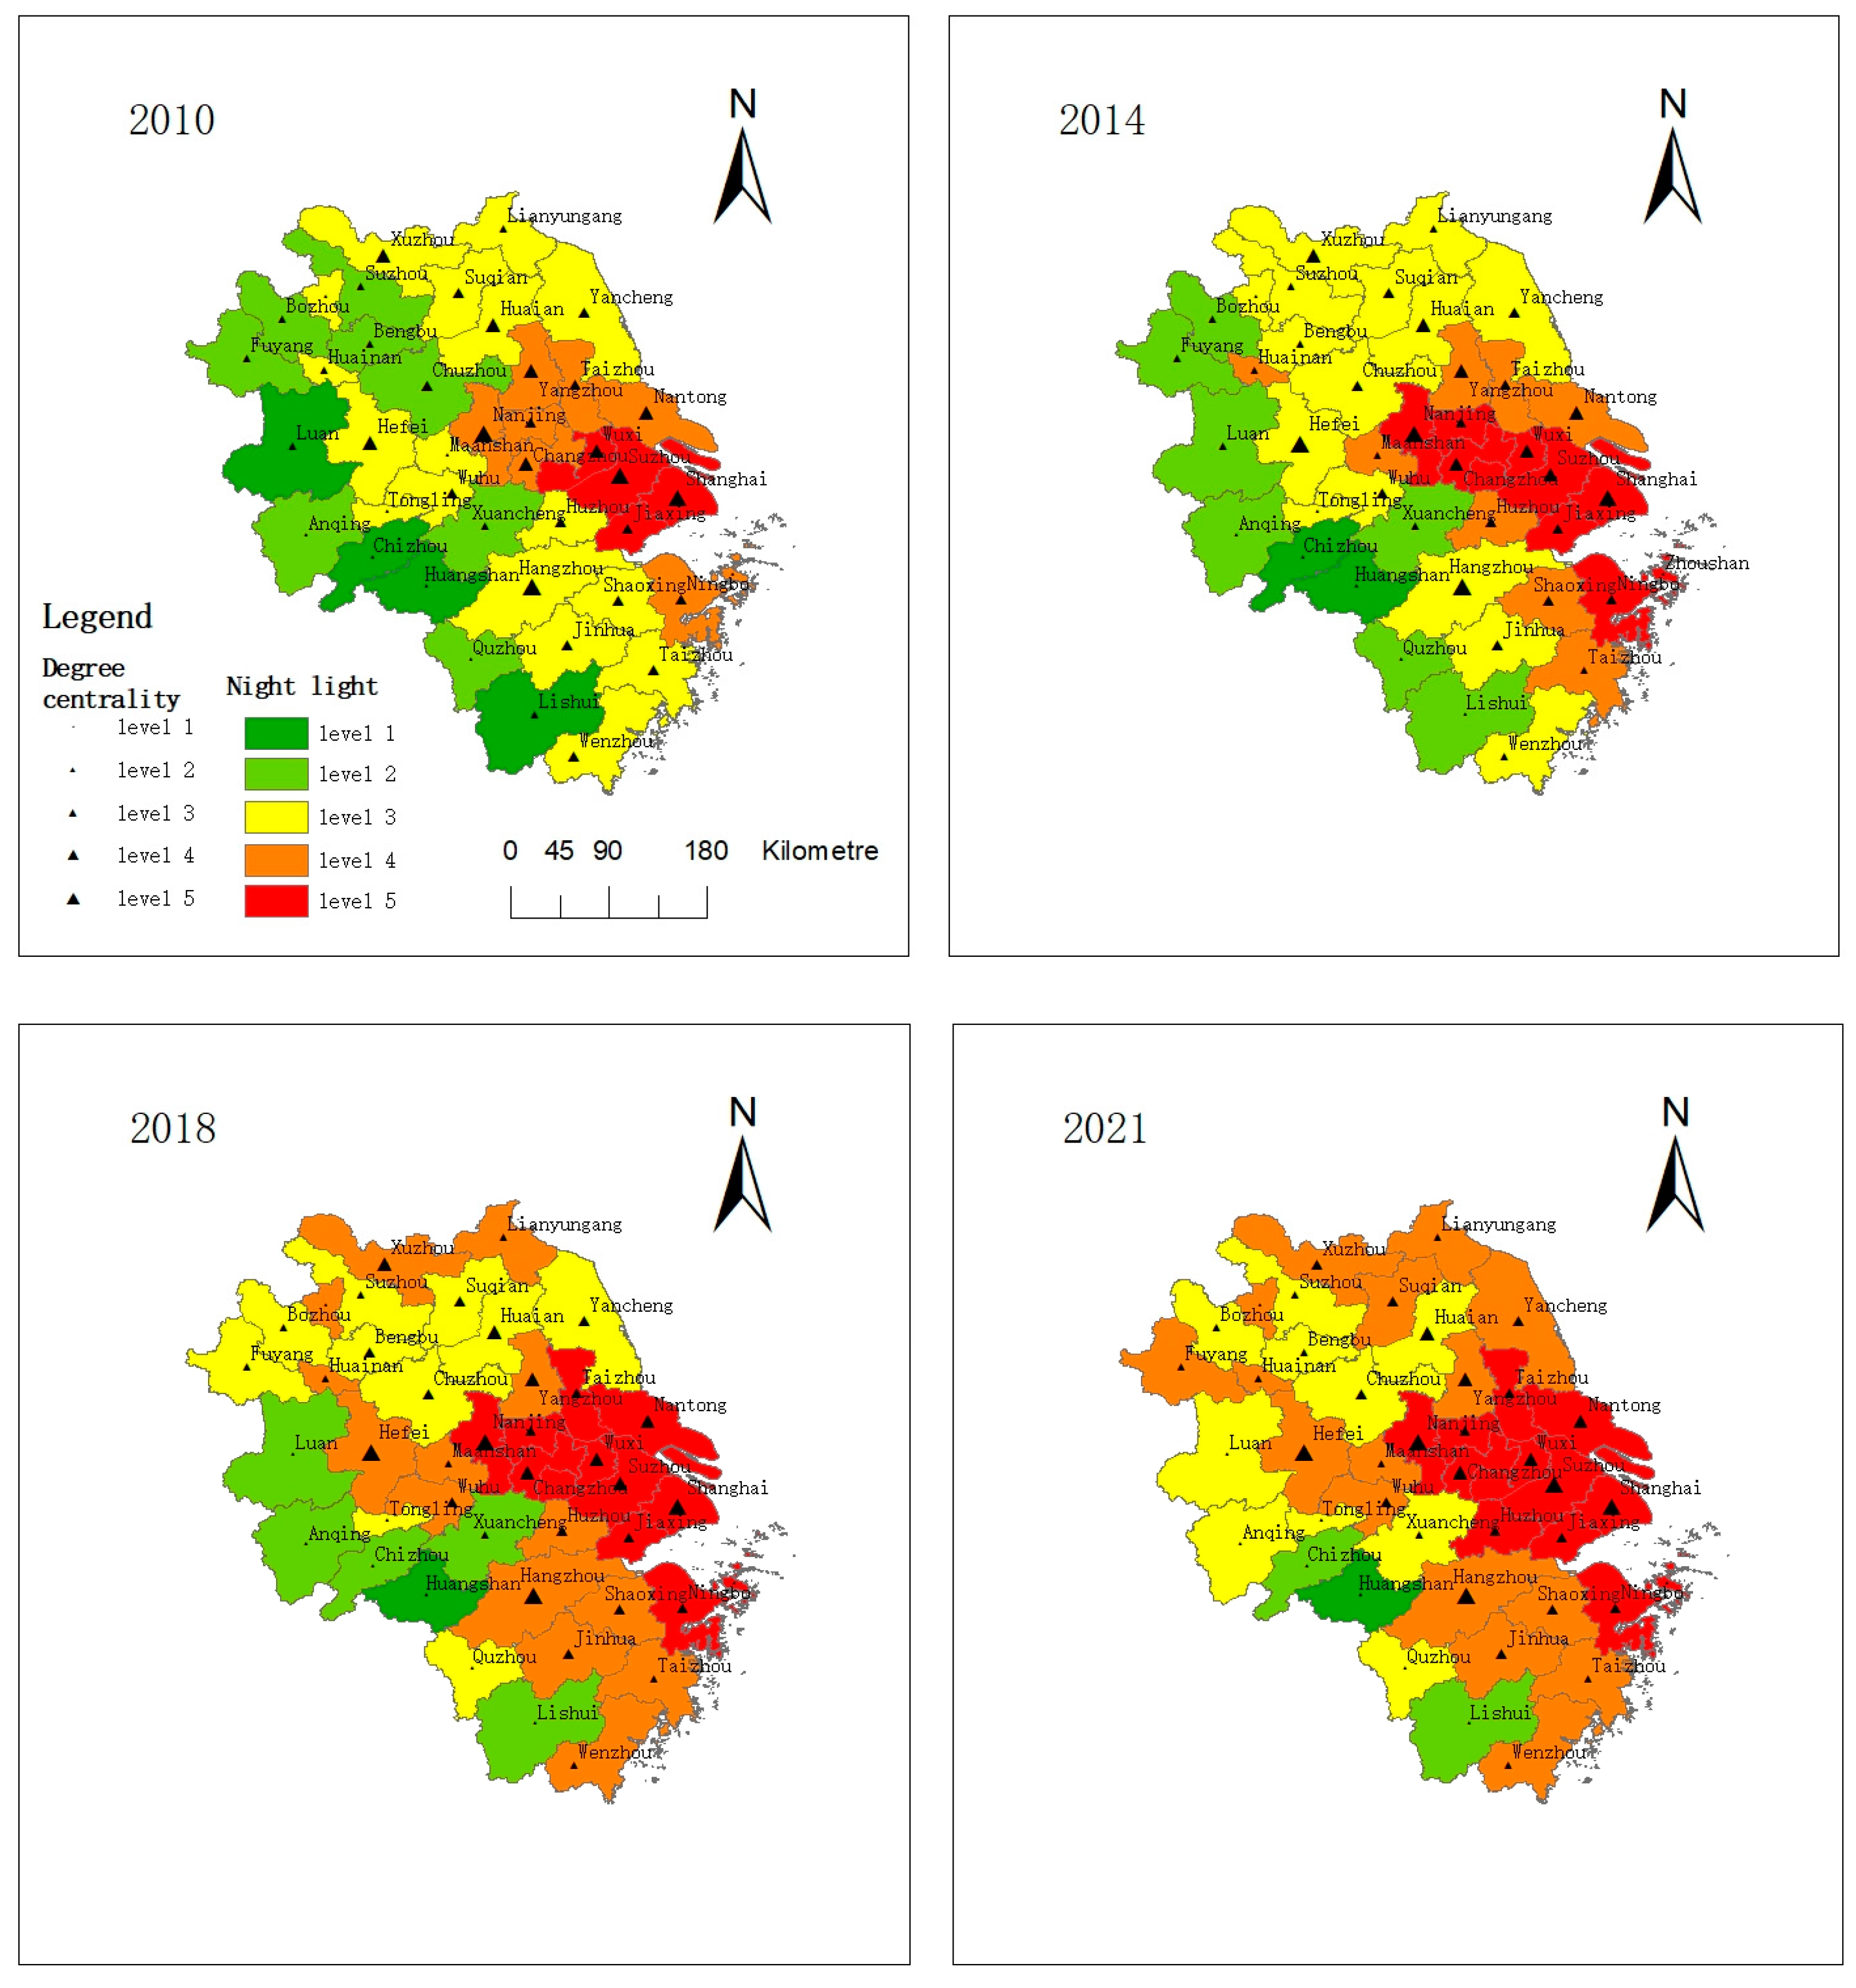
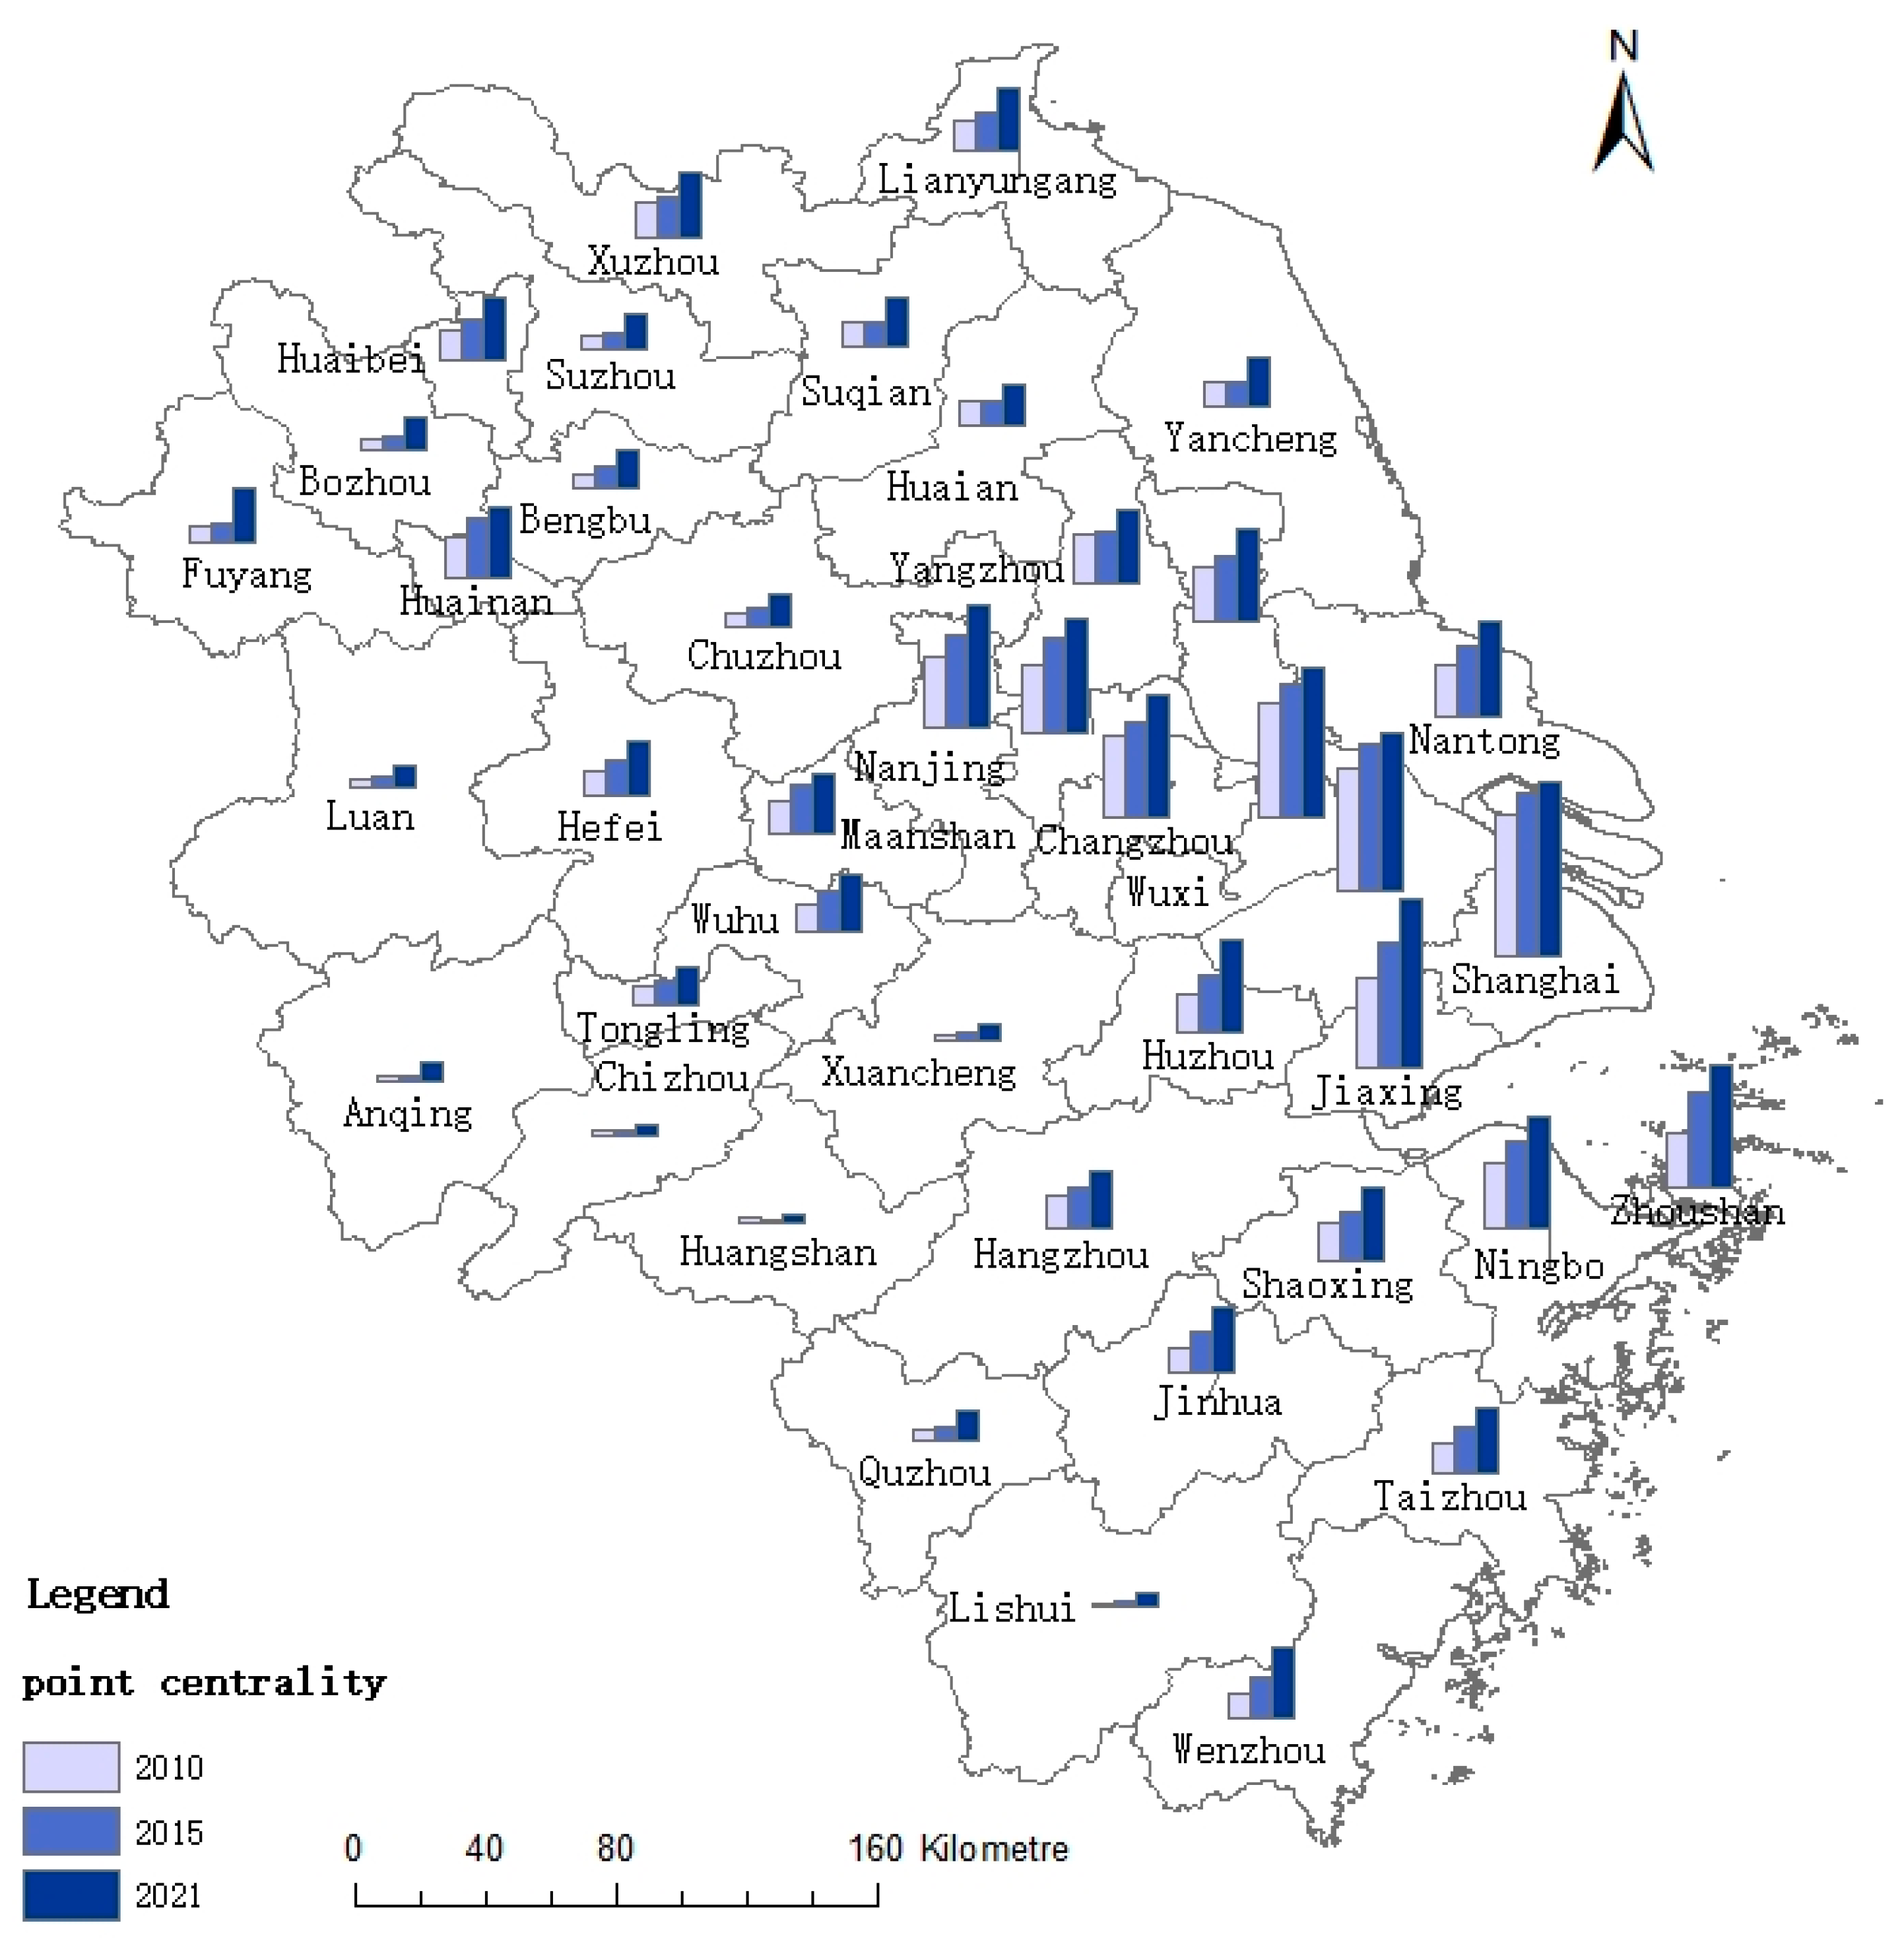
The degree centrality of each city in 2010, 2015, and 2021 is shown in Figure 2. The results show that Shanghai, Nanjing metropolitan area, Hangzhou metropolitan area, Hefei metropolitan area, Suxi-Xi-Chang metropolitan area, and Ningbo metropolitan area have a higher degree of urban centrality, and the network pattern of “one core and five circles” is obvious in the Yangtze River Delta region. The degree centrality of cities in the Yangtze River Delta urban agglomerations varies greatly. Shanghai, has the highest degree of centrality, with a value of more than 12 times that of the city with the lowest degree of centrality. Among the cities, the degree centrality of Chizhou City, Huangshan City, Chizhou City, Lu’an City, and Lishui City are lower. The degree centrality of the western Anhui, western Zhejiang, and northern Jiangsu regions is relatively low, indicating that the polarization phenomenon in the Yangtze River Delta urban agglomeration is relatively serious, and the degree centrality of the central region is generally higher than that of the surrounding areas. The degree of centrality of different cities presents different rules. Overall, the degree centrality of cities in the upper and right half of the Yangtze River Delta urban agglomeration has a significant growth trend, while the degree centrality of individual cities in the southwest is not obvious, indicating that the network status of each city node in the Yangtze River Delta multi-center urban network is generally improved. The network status of regional multi-center nodes is constantly improving.
This paper uses the following five indicators to comprehensively measure the centrality of urban network degrees and to determine the centrality trend of urban networks in the Yangtze River Delta.
First, the primacy index, which originally refers to the proportion of the largest city’s population in the city’s total population, ranges from 0 to 1 and is used to describe the relative scale of the first city. In this paper, it is defined as the proportion of the degree centrality value of the largest city in the degree centrality of the entire urban network. The second is the 10 city index, which is used to describe the proportion of the sum of the maximum city degree value of the first 10 degrees to the sum of the degree center degree of the whole network. The third is the Geef index, whose formula is as follows: degi represents the degree centrality of city i, C represents the constant term, and ranki represents the ranking of degree centrality value of city i within the urban agglomeration. By regression of this formula, coefficient q, the single center index, can be obtained. When q > 1, it indicates that the central city in the urban agglomeration is dominant. The spatial structure of a single center is presented. When q < 1, the degree centrality distribution in an urban agglomeration is relatively dispersed, showing a typical polycentric spatial structure. Fourth, under the least square method, the Pareto index fits the city’s rank and size. The formula is size is the population size of a city, and rank is the city rank ranked by size. This index often appears in the literature, being used to test whether the population size distribution in the independent functional area aligns with Zipf’s rule. The fifth is the Herfindahl index, which is defined in this paper as the proportion of the degree centrality of Shanghai, Hefei, Nanjing, and Hangzhou in the total degree centrality of the urban agglomeration to measure the degree centrality concentration of the municipalities directly under the central government and the provincial capital cities.
The EF index of urban degree centrality in 2010 and 2021 is 0.76 and 0.71, both of which are less than 1, indicating that the degree centrality in the Yangtze River Delta urban agglomeration is relatively dispersed, and the urban network of the Yangtze River Delta presents a polycentric spatial structure. From 2010 to 2021, the five concentration indicators of urban network degree centrality decreased by 0.72%, 0.68%, 5.34%, 11.24%, and 5.80%, respectively. Urban network node cities’ status and regulatory functions are becoming more centralized, and cities with high network degree centrality are no longer limited to municipalities directly under the central government and provincial capitals but have gradually spread to other levels of the city.

4.2. Spatial Distribution Characteristics of Economic Growth

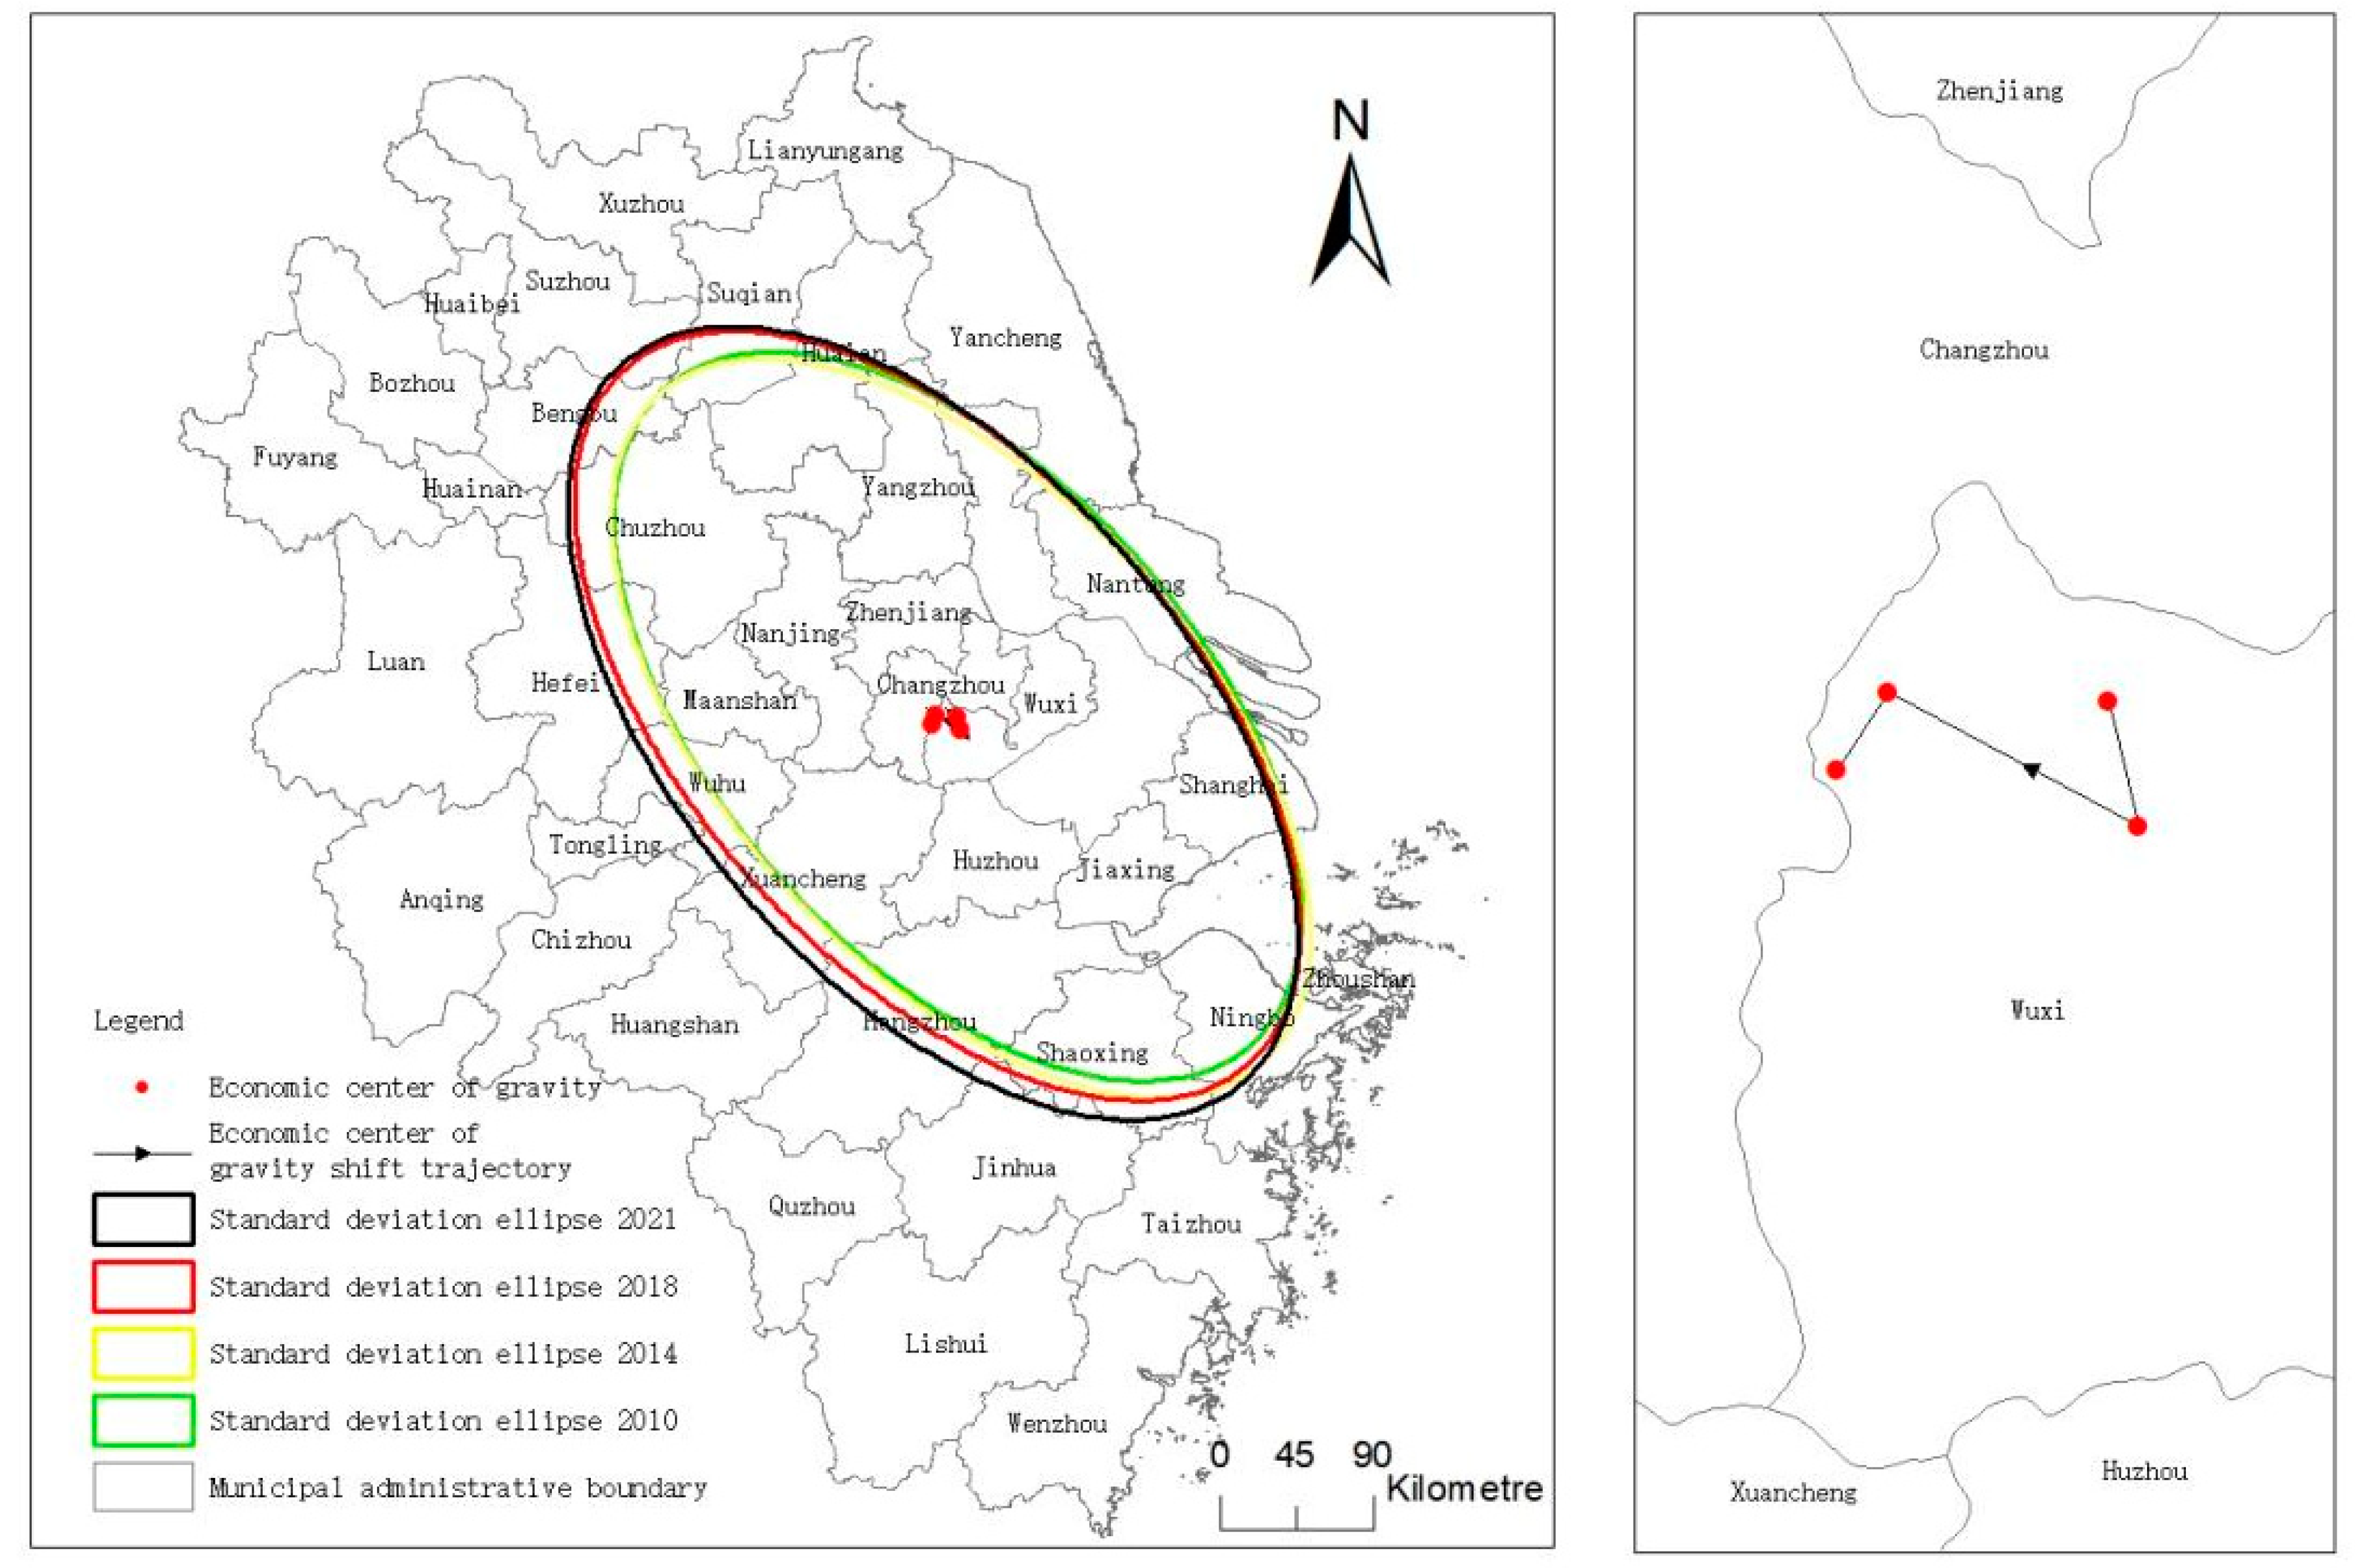
A standard deviation ellipse is an analytical tool used to reveal the characteristics of spatial distribution, which can quantify the central trend, direction, and morphological characteristics of night light distribution in the Yangtze River Delta region. In this analysis framework, the ellipse’s center point represents the data’s spatial center of gravity, the long axis indicates the main distribution direction of the data, and the short axis reflects the distribution width of the data. For the oblateness of the ellipse, the greater the difference between the long and short axes is, the more significant the spatial directivity of the data. By comparing the standard deviation ellipses of different years, we can track the time series change and development trend of night light distribution. In addition, the changes of the center coordinates and area of the ellipse provide an intuitive explanation for understanding the expansion direction and agglomeration degree of the city scale in geographical space.
In Figure 3, through the analysis of the standard deviation ellipse of urban economic growth level in 2010, 2014, 2018, and 2021, it can be found that the standard deviation ellipse is distributed in the direction of northwest to southeast as a whole, indicating that the development direction of the urban agglomeration in the Yangtze River Delta region is stable. From 2010 to 2021, the spatial range of the standard deviation ellipse expanded, and the long and short axes appear increased. From 2010 to 2014, the center of gravity coordinates of the ellipse shifted from 119.72° E~31.52° N to 119.75° E~31.45° N in the southeast direction, and the Yangtze River Delta urban agglomeration developed toward the southeast cities. From 2014 to 2018, the center of gravity coordinates of the ellipse shifted from 119.75° E~31.45° N to 119.61° E~31.52° N in the northwest direction, with little change in the overall spatial range. From 2018 to 2021, the center of gravity coordinates of the ellipse shifted from 119.61° E~31.52° N to 119.58° E~31.48° N in the southwest direction, the space range of the standard deviation ellipse became significantly larger, and both the long and short axes increased, indicating that the Yangtze River Delta urban agglomeration developed to the southwest Anhui region during this period.

5. An Empirical Analysis of the Influence of the Polycentric City Network on Economic Growth

5.1. Common Panel Regression Estimation

Ordinary panel regression of mixed OLS, individual-fixed effect, time-fixed effect, and individual time double-fixed effect were carried out on the data, respectively, and the results are shown in Table 2. R2 represents the overall fitting values of the model, which are 0.658, 0.944, 0.701, and 0.971, respectively. The fitting results of different effects are all ideal. The fitting effect of the individual time double-fixed effect is the best. General panel regression can only briefly analyze the relationship between variables, and further analysis is needed to explore whether there is a spatial effect between cities.

5.2. Spatial Autocorrelation Test

Based on different spatial matrices, the spatial autocorrelation of economic growth in the Yangtze River Delta region is tested by calculating the global Moran index of economic growth level and network node centrality from 2010 to 2021. As shown in Figure 4, there is a significant spatial positive correlation between economic growth level and network node centrality in the adjacency weight matrix, the second-order inverse distance weight matrix, and the global Moran value in the economic matrix, which supports the adoption of a spatial econometric model.

5.3. Test and Analysis of the Spatial Econometric Model

The test idea for selecting the specific spatial measurement models is as follows: First, the LM test is carried out on the residual of the OLS model to determine whether there is a spatial effect. Second, the Hausman test is used to judge the random or fixed effects. Then, the LR test is used to judge the individual-fixed, time-fixed, or double-fixed effects. Finally, whether the spatial Durbin model degenerates into a spatial lag model or a spatial error model is tested.
As shown in Table 3, according to the results of LM test, the p-value of LM-error is 0.243 only in the perspective of adjacency based spatial weight matrix, LM test rejects the spatial error model, and the other p-values are significant; that is, spatial effects exist in different spatial weight matrix perspectives, so the spatial Durbin model was chosen to be established. The time-fixed, individual-fixed, and double-fixed models are compared and analyzed through Hausman and LR tests, and the spatial Durbin model with time-individual-double fixed is selected. For further determining the applicability of the spatial Durbin model, the p-value of the test result is significant. That is, it refuses to degenerate into the spatial lag and error models.

5.4. Spatial Durbin Model Effect Decomposition

Due to the existence of a spatial lag term, the empirical analysis should combine the explanatory variables in the model, adopt the partial differential matrix method, decompose the total marginal effect into direct and indirect effects, conduct a comprehensive investigation, and further analyze the relationship between various factors, as shown in Table 4.
From the perspective of direct effect, the node centrality of cities in the network passes the significance level of 1% under the three matrices, and the influence coefficients are 0.133, 0.133, and 0.127, respectively, which proves that the degree centrality has a significant positive effect on the improvement of the urban economic growth level in the region. It can be seen from the observation that the influence coefficient under the economic matrix is 0.127, which is the smallest value among the three matrices, indicating that the adjacency and geographical distance between cities increase the promotion effect of degree centrality on economic growth. As Fujinta and Krugman (1995) state, the siphon effect exists between cities. Instead of being subjected to a spillover effect due to a proximity to big cities, small- and medium-sized cities face competition from neighboring big cities and comparable cities far away, which limits their development and makes their growth lower than the expectation of corresponding scale, resulting in an “agglomeration shadow”.
From the perspective of indirect effects, the spatial spillover effect of node centrality is significantly positive in the adjacency matrix and the second-order inverse distance matrix and positive but not significant in the economic matrix. Considering that geographical location has a certain promotion effect on the economic growth level of surrounding cities, small cities near big cities can “borrow” the economic benefits of agglomeration of big cities, and the “diffusion” effect is greater than the “echo” effect [54]. It shows that the enhancement of urban degree polycentricity in the polycentric city network in the Yangtze River Delta region can not only form the “borrowing scale” and direct agglomeration growth effect but also improve the economic growth level of the city. The positive spillover effect can help improve the economic level of the surrounding cities and gradually realize the shared growth of economic benefits in the Yangtze River Delta region [55]. However, only considering the economic difference has no significant effect on the economic growth of the surrounding cities, which indicates that the enhancement of the node centrality of the city in the network has a growth effect on its economic level but has no significant effect on the economic growth of other economically neighboring cities [56].

5.5. Heterogeneity Test

5.5.1. Spatial Durbin Panel Quantile Model

In this paper, regarding the estimation steps of the instrumental variable method for general quantile regression proposed by Chernozhukov and Hansen, along with and Su and Yang’s instrumental variable quantile estimation method, the spatial lag term of explanatory variables was selected as the instrumental variable to test the significance of the regression coefficient of spatial lag variables. The significant coefficient indicates spatial interaction effects in the model, and the influencing factors of economic growth are reasonable, ensuring the accuracy of the estimates obtained by quantile regression. With this approach, we can more accurately capture and interpret the spatial dynamics of economic growth.
Table 5 reports the results of spatial Durbin panel quantile regression estimation under the adjacency weight matrix, second-order inverse distance weight matrix, and economic weight matrix and lists the regression coefficients at the 10th, 25th, 50, 75, and 90 subpoints.
Under the adjacency weight matrix based on geographical location and the second-order inverse distance weight matrix, there is a positive correlation between the centrality of nodes in the urban network and urban economic growth, and this relationship is significant when the urban economic level is medium or above. Specifically, the effect of node centrality on economic growth is more significant in cities with higher economic levels (75 and 90 points) than in cities with medium economic levels (50 points), indicating that centrality is more effective in improving the economic level of large cities. In the consideration of the spatial weight matrix based on economic linkages, node centrality positively and significantly affects economic growth at each economic level sub-point (25, 50, 75, and 90 sub-points). However, in all types of spatial weight matrices, the node centrality’s effect is insignificant in the cities with the lowest economic growth level (10 points), which means that the polycentric city network has no significant positive effect on the growth of economically weaker cities.
The spatial quantile regression estimation results for the spatial weight matrix based on geography and the spatial weight matrix based on economy are similar. Compared with the 50th and 90th subpoint regression coefficients, each subpoint’s regression coefficients is significantly higher than those at the low subpoints. Moreover, the regression coefficients of each sub-site under the weight matrix based on geography are higher than those under the weight matrix based on economy. This shows that node centrality has a more significant impact on the economic growth level of geographically adjacent cities and increases with the increase in urban economic growth level. The impact of a polycentric city network on economic growth is not only related to the economic growth level of the city itself but also the economic level of its geographically adjacent cities.

5.5.2. Heterogeneity of Cities Along G60 Science and Innovation Corridor

The G60 Science and Innovation Corridor is one of the regions with the most dynamic economy and the highest level of urbanization in China, and the construction of the Science and Innovation Corridor is conducive to leading the new momentum of regional economic development. The nine cities in the corridor, including Shanghai, Jiaxing, Hangzhou, Jinhua, Suzhou, Huzhou, Xuancheng, Wuhu, and Hefei, are each performing well economically, but the study’s results show that their multi-center urban networks do not significantly contribute to overall economic growth.
As shown in Table 6, for cities along the G60, although these cities usually have a strong economic foundation and a high level of development, empirical results show that the polycentric city network between them has not produced the expected significant impact on economic growth. Taking Shanghai as an example, as an international metropolis, its economic strength and scientific and technological innovation ability have an important position in the country and even the world [57]. However, while Shanghai has strong economic and technological ties with other cities along the route, such as Suzhou and Hangzhou, these ties have not significantly impacted economic growth. This may be because the economic activities of the cities along the route have been highly developed, and the complementarity and synergistic effect between the cities are relatively weak [58]. In addition, cities along the route may face fierce internal competition, which may lead to inefficient allocation of resources, thus affecting the overall economic impetus of the urban network.
In contrast, the urban network of non-route cities shows a significant positive economic impact. For example, Nantong City in Jiangsu Province, although not on the G60 Science and Technology Innovation Corridor, has effectively promoted the development of the local economy through close cooperation with neighboring cities, such as industrial docking and resource sharing with Shanghai. Similarly, Lishui City in Zhejiang Province has also achieved positive effects of economic growth by developing characteristic industries and strengthening economic ties with surrounding cities. These cities may have achieved regional economic synergy through closer cooperation and resource sharing [59]. The positive effects of non-route city networks may stem from the fact that they pay more attention to internal resource integration and industrial upgrading in the development process and attract external investment and technology through inter-city cooperation, thus effectively promoting economic growth.

5.6. Endogeneity Test and Robustness Test

5.6.1. Endogeneity Test

To further ensure the reliability of the research findings, this study employs the Ming Dynasty post stations as an instrumental variable for urban network status. The regions where these post stations were established possessed significant advantages in terms of transportation geography, political and military affairs, and economic and cultural development. As historical data from several centuries ago, these post stations have no direct causal link with modern economic growth, thereby satisfying the relevance and exogeneity requirements of an instrumental variable. The instrumental variable estimation is conducted using a two-step approach [60].
Specifically, the first column in Table 7 shows that the regression coefficient is significantly positive, with both the LM test and Wald test statistics being significant at the 1% level. This indicates that the instrumental variable does not suffer from model under-identification or weak instrument problems, thus validating its relevance. In the second column, the regression coefficient remains significantly positive, suggesting that the positive effect of urban network status on economic growth still holds after controlling for endogeneity. In the third column, the regression coefficient for the instrumental variable is positive but not significant, which further indicates that the instrumental variable satisfies the exclusion restriction well. Overall, these results strongly demonstrate the robustness of the estimation results in this study.

5.6.2. Robustness Test

The lag phase of each variable is substituted into the model for re-estimation, which is limited in space and does not consider the effect decomposition. The estimation results in Table 8 show that the estimated values of the degree centrality of the city only change in size, and the positive and negative signs and significance remain unchanged, indicating the reliability of the results in this paper.
Different spatial weight matrices are constructed. Based on the modified gravity model, the economic distance spatial weight matrix is derived by using the average resident population, average gross regional product, and geographical distance in the sample period. The results show in Table 9 that the effect of degree centrality on economic growth is still significant, which confirms the robustness of the estimated results in this paper.
The index of degree centrality is replaced and re-estimated by the city center degree. The results in Table 10 show that the estimated value of the center degree of the city only changes in size, and the positive and negative signs and significance remain unchanged, which further proves the robustness of the estimation results in this paper.

6. Research on the Transmission Path of Regional Economic Growth Driven by the Multi-Center City Network

This paper only applies the two steps of the causal step-to-step regression test method to put forward the intermediary variables at the theoretical level according to previous research on the transmission path of urban network and economic growth and then only looks at the impact of explanatory variables on the intermediary variables to avoid distinguishing whether there are unexplained direct effects [61].
The functional mechanism is tested from three paths: regional factor flow, industrial division of labor and cooperation, and innovation ability improvement. The following models are used for mechanism verification:
p l i i t = α 0 + ρ j = 1 N w i j p l i j t + β 1 deg it + β 2 X i t + θ 1 j = 1 N w i j deg jt + θ 2 j = 1 N w i j X j t + v i + μ t + ε i t
M i t = α 1 + ρ 1 j = 1 N w i j M j t + β 3 deg it + β 4 X i t + θ 3 j = 1 N w i j deg jt + θ 4 j = 1 N w i j X j t + v i + μ t + ε i t
Among them, M mainly introduces the urban flow intensity (m1) reflecting the flow of factors at the city level, the location quotient (m2) reflecting the industrial division of labor, and the amount of patent authorization (m3) reflecting the innovation ability. To avoid possible endogenous interference, a strictly exogenous second-order inverse distance spatial weight matrix is adopted to conduct spatial Durbin regression test. When β1 is significant, it indicates that the urban network impacts economic growth, and when β3 is significant, it indicates that the urban network will affect the intermediary variable.
The transmission path of regional factor flow focuses on identifying whether or to what extent the multi-center city network drives regional economic growth by accelerating regional factor flow [62]. This paper constructs an urban flow model, takes labor flow as the key point, and quantitatively analyzes the urban functional efficiency, outward functional quantity, and inter-urban flow intensity of different cities from the two dimensions of city and industry. Relevant studies have usually adopted the perspective of location quotient to build the urban flow intensity model. The basic steps and formulas are as follows. First, the location quotient of each industry in city i is measured, L q i j = G i j / G j G j / G . Gij is the number of employees in industry j of city i, Gi is the total number of employees in industry j of city i, Gj is the number of employees in industry J of the whole country, and G is the number of employees in the whole country. For various industries here, 18 industrial categories under the second and third industries are selected. That is, the urban flow intensity is calculated based on these 18 industrial categories. Second, external functional capacity Eij is calculated based on location quotient. When the location quotient is less than 1, the outward functional quantity of industry j in city i is E i j = G i j G i ( G j / G ) . Finally, the urban flow model is established, and its formula is F i = N i × E i = G D P i × E i P i , where the functional efficiency of city i is N i = G D P i P i .
As shown in column (2) of Table 11, when urban flow intensity m1 is taken as the explained variable, the effect of network node centrality is significantly positive, indicating that the improvement of urban network node centrality will help regional factors converge to local areas and generate positive spillover effects, making the flow of factors multi-directional and realizing the optimal allocation of resources. Compared with the traditional hierarchical urban system, the polycentric urban network in the Yangtze River Delta region effectively integrates vertical and horizontal cooperation and strengthens the connection and node function between cities. This allows small- and medium-sized cities to leverage their professional strengths or act as information hubs to integrate into wider regional networks [63]. In this network effect, the importance of urban nodes no longer depends solely on size. The more frequent and efficient flow of resources, information, and technology in this multidimensional network facilitates knowledge accumulation and added value. Meanwhile, time, space, and network relations, as the core channels of knowledge transmission, not only have local characteristics but also are influenced by interregional trade and cooperation networks.
As shown in column (3) of Table 11, when location quotient m2 is taken as the explained variable, the effect of network node centrality is significantly positive, indicating that the improvement of urban node centrality is conducive to promoting industrial division of labor and cooperation. Through industrial association and collaboration, cities are embedded into production networks and inter-regional division systems led by multiple central or sub-central cities, which contributes to the integration and improvement of regional functions beyond spatial proximity and across geographical boundaries [64]. Metcalfe’s rule states that the value of nodes in a network increases with the number of nodes. With the expansion of the network, regional functions and collaborative relationships are integrated, and cities achieve economies of scale and synergies through cooperation, thus improving the efficiency of division of labor and production flexibility.
With the popularization of modern information technology, industrial competition has expanded from simple products and services to a wider range of fields. The external network economy emphasizes the role of network centers and nodes, promotes the flow of resources between regions according to market demand rather than administrative instructions, and enhances nodes’ market resource allocation ability. Cities can use their position in the network, synergies, and external connections to achieve flexible division of labor within industries, industrial chains, and products and establish new cooperation models such as remote networked manufacturing and services, network alliances, and platform economy. This is conducive to the orderly connection of the industrial chain in the region, promoting the upgrading of the value chain and the development of high-end industry. This process enables smaller, developing cities to shift from one-way dependence to equal cooperation by joining the multi-center regional network and to achieve a win-win situation and inclusive growth of large, medium, and small cities in the industrial division of labor.
As shown in column (4) of Table 11, when m3 of patent grants is taken as the explained variable, the effect of centrality of network nodes is significantly positive, indicating that the improvement of centrality of nodes in urban networks can not only promote information exchange among innovation subjects but can also effectively reduce transaction costs and accelerate the flow and interaction of knowledge, thus injecting new impetus into regional economic growth. The existence of a network advantage has greatly promoted the spread of innovative thinking, advanced technology, and new knowledge. Through the establishment of R&D cooperation, R&D chain, and other forms of network relations, the rapid spatial diffusion of knowledge and technology can be realized, and the knowledge reserve in the region can be formed. This dynamic not only reduces the segregation of geographical space but also helps to remove hidden barriers and drive economic integration between different regions. The enhancement of centrality is particularly important in the urban network with complementary and synergistic functions . It not only enhances the connectivity between cities but also helps enhance innovative subjects’ learning ability and absorption capacity. Improving this capability enables cities to complete the informal transaction process of heterogeneous knowledge assets more effectively, which is of great significance for the optimal allocation of innovation resources and improvement of innovation efficiency. This synergistic effect of urban network can not only promote the development of local economy but also drive the economic growth of surrounding areas through the knowledge spillover effect and realize the overall improvement of regional economy.
In addition, improving the centrality of urban network nodes can also attract more investment and talents, forming a strong economic magnetic field. This not only brings more development opportunities for the city but also provides a broader market and more abundant resources for enterprises in the region. In such a dynamic economic environment, enterprises can more easily find partners and realize resource sharing and risk sharing, thus improving the overall competitiveness and innovation capacity.

7. Conclusions and Discussion

7.1. Conclusions

In this paper, the gravity model is used to construct the Yangtze River Delta urban network from the perspective of economic flow from 2010 to 2021, and the spatial Durbin model is established to conduct spatial econometric analysis and to explore the spillover effect of node cities in the polycentric urban network beyond geographical neighbors, especially the connecting hub role and the organizing and distributing function of node cities. The identification test of the conduction path was carried out through the two steps of the causal stepwise regression test method. The findings are as follows: (1) the metropolitan area network of “one core and five circles” has taken shape, and Shanghai, as the core node city, has driven Hangzhou, Nanjing, Hefei, and other cities to radiate around. (2) Under different spatial weight matrices, the Yangtze River Delta’s polycentric urban network can significantly impact urban economic growth. Specifically, under the perspective of spatial weight matrix based on geographical proximity, the enhancement of node centrality of the urban network can not only form a direct agglomeration growth effect but also improve the economic growth level of the city. Moreover, it can form a positive spatial spillover effect and promote the economic level of the surrounding cities. (3) The influence of polycentric city network on the economic growth level of geographically adjacent cities is more significant, and it will increase with the increase of the economic growth level of cities. The influence is not only related to the economic growth level of cities themselves but also to the economic level of their geographically adjacent cities. (4) With the support of the three transmission paths of accelerating regional factor flow, promoting regional industrial division of labor and cooperation, and improving regional innovation capability, the influence of polycentric city network on economic growth can play a greater role. Therefore, hypotheses 1, 2, 3, and 4 have all been validated.

7.2. Discussion

Based on the above suggestions, this paper draws the following recommendations.
The first is recommendation to build a multi-center city network of “one core, five circles and four belts” to strengthen regional integration. In accordance with the development plan for the Yangtze River Delta urban agglomeration, efforts will be made to foster the formation of multi-level and multi-type development axes. A network spatial pattern of “one core, five circles, and four belts” will be constructed. The plan also aims to coordinate and build an efficient multi-center urban network system in the Yangtze River Delta. This will involve strengthening cooperation and linkages among cities within the region. Additionally, the plan seeks to smooth the market network of the Yangtze River Delta. By facing the world and the future, the plan aims to enhance the urban level and core competitiveness of Shanghai. Leveraging the comparative strengths of Jiangsu, Zhejiang, and Anhui should be continued to prevent urban contraction and avoid a “downward spiral”. In line with the development trend of the Yangtze River Delta Economic Zone in Shanghai, Jiangsu, Zhejiang, and Anhui in depth, the layout principle of “north to south, west to east, expansion” should be adhered to, the regional spatial layout optimized, and a fan spatial structure built with Shanghai as the center.
The second recommendation is to give full play to core cities’ leading role, strengthen node city networks’ embeddedness, and promote balanced regional economic growth. The impact of the polycentric city network on urban economic growth has an obvious spatial spillover effect. When formulating local policies, local governments should comprehensively evaluate the degree of their embeddedness in the regional city network and, on this basis, actively strengthen economic interaction and cooperation with neighboring cities. This will strengthen its connections with core cities such as Shanghai, Hangzhou, Nanjing, Hefei, Wuxi, and Suzhou and improve the degree of embeddedness in the multi-center city network. Core cities need to further play their leading role in driving the economic development of surrounding cities through industrial transfer, technology diffusion, and talent flow. In policy-making, we should consider city differences and adopt targeted development strategies to achieve balanced regional growth.
The third recommendation is to accelerate the construction of the G60 Science and Innovation Corridor and the construction of innovation enclaves and related parks and develop new quality productivity. We will expedite the development of the G60 Science and Innovation Corridor and through policy support and capital investment, we will encourage enterprises to ramp up their R&D efforts and gain mastery over key core technologies in critical fields. Furthermore, it is necessary to concentrate on the introduction and training of high-level talents, through establishing academician (expert) workstations, cooperating with universities and research institutions, attracting and training innovative talents, and providing intellectual support for scientific and technological innovation. Strengthening the infrastructure construction within the region, improving logistics efficiency, reducing transaction costs, and promoting economic interaction and cooperation within the region are also critical. We also need to fully implement the national strategy for the integrated development of the Yangtze River Delta, promote coordinated development and close cooperation among the innovation enclaves of the Yangtze River Delta and their related parks, and strive to reach the highest global standards by leveraging the organizational strengths of the Yangtze River Delta Development Zone Collaborative Development Alliance. It is also important to take the lead in formulating standards for constructing a business environment; building a comprehensive, coordinated, and sustainable industrial innovation and spatial governance system; and promoting the coordinated development of innovation enclaves in the Yangtze River Delta.
The findings presented in this paper are based on data from the Yangtze River Delta urban agglomeration over the period of 2010 to 2021. While this study offers valuable insights into the relationship between urban networks and economic growth within this specific context, several avenues for future research emerge when considering broader temporal and spatial scopes. Firstly, extending the time frame and expanding the spatial coverage beyond the Yangtze River Delta could reveal more complex dynamics. For instance, a larger dataset might uncover non-linear or threshold effects of multi-centered urban networks on city economic growth. Such effects may not be fully captured within the limited scope of this study. Secondly, as analyzed in this paper, when the “agglomeration shadow” effect outweighs the “borrowing of scale” effect, the externalities of urban networks can have a significant negative correlation with production efficiency. Future research could explore the conditions under which this balance shifts, potentially identifying tipping points or critical thresholds that determine whether urban networks enhance or hinder economic growth. Thirdly, future studies could investigate the role of policy interventions in mitigating the negative externalities of urban networks. For example, regional development policies aimed at promoting balanced growth or improving infrastructure connectivity might alter the dynamics between agglomeration shadows and borrowing of scale. Lastly, incorporating additional dimensions such as technological innovation, environmental sustainability, and social equity into the analysis could provide a more comprehensive understanding of the multifaceted impacts of urban networks on regional development.
In summary, while this study offers a solid foundation, future research should consider broader datasets, explore non-linear dynamics, and examine the role of policy and additional factors to further elucidate the complex relationship between urban networks and economic growth.

Author Contributions

Conceptualization, Y.G. and S.C.; methodology, Y.G.; software, Y.G.; validation, S.C. and Y.G.; formal analysis, S.C.; investigation, S.C.; resources, S.C.; data curation, Y.G.; writing—original draft preparation, Y.G.; writing—review and editing, S.C.; visualization, Y.G.; supervision, S.C.; project administration, S.C.; funding acquisition, S.C. All authors have read and agreed to the published version of the manuscript.

Funding

This work was supported by the 2023 Outstanding Scientific Research and Innovation Team of Philosophy and Social Sciences in Anhui Universities’ “Yangtze River Delta Integration and High-quality Industrial Development” (2023AH010014), the General Project of the National Social Science Fund: Research on the Mechanism, Path, and Guiding Strategy of Regional Economic Growth Driven by the Multi-center City Network (22BJL064), and the Anhui University Natural Science (or Humanities and Social Science) Research Project, Anhui Institute of Information Technology Youth Research Fund Project (24QNJJSK002).

Institutional Review Board Statement

Not applicable.

Informed Consent Statement

Not applicable.

Data Availability Statement

The data used to support the findings of this study are available from the corresponding author upon request.

Conflicts of Interest

The authors declare no conflicts of interest.

References

  1. Alonso, W. Location and Land Use. Toward a General Theory of Land Rent. Econ. Geogr. 1964, 42, 11–26. [Google Scholar]
  2. Capello, R.; Camagni, R. Beyond optimal city size: An evaluation of alternative urban growth patterns. Urban Stud. 2000, 37, 1479–1496. [Google Scholar]
  3. Li, B.; Cao, G. Structural resilience change of China’s marine economic network based on the data of sea-related a-share listed companies. Prog. Geogr. 2022, 41, 945–955. [Google Scholar] [CrossRef]
  4. Smith, A.; Johnson, B. Identifying agglomeration shadows: Long-run evidence from ancient ports. J. Reg. Sci. 2021, 61, 345–367. [Google Scholar]
  5. Wang, L.; Zhang, X. Do new urbanization policies promote sustainable urban development? Evidence from China. Urban Stud. 2022, 59, 891–912. [Google Scholar]
  6. Meijers, E.J.; Burger, M.J. The geography of borrowed size: Exploring spatial distributions for German urban regions. Tijdschr. Voor Econ. En Soc. Geogr. 2023, 114, 234–256. [Google Scholar]
  7. Li, Y.; Liu, Z. Borrowed size and urban economic growth: Evidence from China’s urban agglomerations. Econ. Geogr. 2024, 40, 123–145. [Google Scholar]
  8. Capello, R.; Nijkamp, P. Agglomeration shadows and borrowed size in urban networks: A review. Reg. Stud. 2023, 57, 789–801. [Google Scholar]
  9. Chen, L.; Wang, X.; Hao, Y.; Yin, J.; Chen, D. Population agglomeration, borrowed size and urban economic growth in China. Cities 2024, 155, 105491. [Google Scholar]
  10. Kou, L.; Zhao, H. Regional resilience assessment based on city network risk propagation and cooperative recovery. Cities 2024, 147, 104856. [Google Scholar]
  11. Li, J.; Nie, W.; Zhang, M.; Wang, L.; Dong, H.; Xu, B. Assessment and optimization of urban ecological network resilience based on disturbance scenario simulations: A case study of Nanjing city. J. Clean. Prod. 2024, 438, 140812. [Google Scholar] [CrossRef]
  12. Wei, M.; Xu, J. Assessing road network resilience in disaster areas from a complex network perspective: A real-life case study from China. Int. J. Disaster Risk Reduct. 2024, 100, 104167. [Google Scholar] [CrossRef]
  13. Zhou, J.; Ju, K.; Zhou, D.; Wei, X.; Liu, H.; Zhang, C. Marine economic network in China’s coastal regions: Static characteristics and resilience under attacks. Appl. Econ. 2024, 1–15. [Google Scholar] [CrossRef]
  14. Chen, W.; Zou, S.; Qiu, C.; Dai, J.; Zhang, M. Invulnerability analysis of nuclear accidents emergency response organization network based on complex network. Nucl. Eng. Technol. 2024, 56, 2923–2936. [Google Scholar] [CrossRef]
  15. El Maissi, A.M.; Argyroudis, S.A.; Kassem, M.M.; Nazri, F.M. Integrated seismic vulnerability assessment of road network in complex built environment toward more resilient cities. Sustain. Cities Soc. 2023, 89, 104363. [Google Scholar] [CrossRef]
  16. Rodríguez-Alarcón, R.; Lozano, S. A complex network analysis of groundwater wells in and around the Doñana Natural Space, Spain. J. Hydrol. 2024, 644, 132079. [Google Scholar] [CrossRef]
  17. Sui, Z.; Wen, Y.; Huang, Y.; Zhou, C.; Du, L.; Piera, M.A. Node importance evaluation in marine traffic situation complex network for intelligent maritime supervision. Ocean Eng. 2022, 247, 110742. [Google Scholar] [CrossRef]
  18. Cao, W.; Han, L. Industrial agglomeration externality, urban network externality and urban production efficiency: A multi-regional scale analysis based on 285 cities and ten major urban agglomerations in China. West. Forum 2022, 32, 16–33. [Google Scholar]
  19. Liu, M.; Zhao, X. Spatial structure and coordinated economic development of urban agglomerations: A comparative analysis of the three major urban agglomerations in the Yangtze River Economic Belt. Explor. Econ. Issues 2019, 09, 100–111. [Google Scholar]
  20. Zhang, Y.; Xiang, B. Siphon or diffusion: The impact of transportation network integration in urban agglomerations on urban economic growth: Empirical evidence from China’s top ten urban agglomerations. Bus. Res. 2022, 29, 112–121. [Google Scholar]
  21. Lu, R.; Yang, Z. Analysis on the structure and economic resilience capacity of China’s regional economic network. Appl. Econ. 2024, 56, 3920–3938. [Google Scholar] [CrossRef]
  22. Chai, D.; Du, J.; Yu, Z.; Zhang, D. City network mining in china’s yangtze river economic belt based on “two-way time distance” modified gravity model and social network analysis. Front. Phys. 2022, 10, 1018993. [Google Scholar]
  23. Shutters, S.T.; Waters, K. Inferring Networks of Interdependent Labor Skills to Illuminate Urban Economic Structure. Entropy 2020, 22, 1078. [Google Scholar] [CrossRef] [PubMed]
  24. Van Meeteren, M.; Neal, Z.P.; Derudder, B. Disentangling agglomeration and network externalities: A conceptual typology. Pap. Reg. Sci. 2016, 95, 61–81. [Google Scholar]
  25. Glawe, L.; Mendez, C. Harmonized luminosity and economic activity across provinces in China: Cross-sectional differences, regional time series, and inequality dynamics. Appl. Econ. 2024, 1–17. [Google Scholar] [CrossRef]
  26. Wang, J.; Wang, J.; Yu, S.; Zhang, Y. Financial centrality and the quality of economic growth from the perspective of urban network: Effect and mechanism. Stat. Inf. Forum 2020, 35, 69–76. [Google Scholar]
  27. Huang, L.; Wang, J.; Cheng, H. Spatiotemporal changes in ecological network resilience in the Shandong Peninsula urban agglomeration. J. Clean. Prod. 2022, 339, 130681. [Google Scholar]
  28. Zhou, J.; Du, M.; Chen, A. Multimodal urban transportation network capacity model considering intermodal transportation. Transp. Res. Rec. 2022, 2676, 357–373. [Google Scholar]
  29. Glaeser, E.L.; Kolko, J.; Saiz, A. Consumer City; Harvard Institute of Economic Research Working Papers; Harvard Institute of Economic Research: Cambridge, MA, USA, 2001; pp. 27–50. [Google Scholar]
  30. Glaeser, E.L.; Albert, S. The Rise of the Skilled City; NBER Working Papers; National Bureau of Economic Research: Cambridge, MA, USA, 2003. [Google Scholar]
  31. Duranton, G. Agglomeration Effects in Colombia. J. Reg. Sci. 2016, 56, 210–238. [Google Scholar] [CrossRef]
  32. Su, Y.; Yan, Y. The influence of the two-tier network of a regional innovation system on knowledge emergence. J. Knowl. Manag. 2023, 27, 2526–2547. [Google Scholar]
  33. Francoso, M.S.; Vonortas, N.S. Gatekeepers in regional innovation networks: Evidence from an emerging economy. J. Technol. Transf. 2023, 48, 821–841. [Google Scholar] [CrossRef]
  34. Araki, M.E.; Bennett, D.L.; Wagner, G.A. Regional innovation networks & high-growth entrepreneurship. Res. Policy 2024, 53, 104900. [Google Scholar]
  35. Zhang, J.; Sheng, K.; Wang, C. Spatial evolution and underlying factors of the urban financial network in China. Trop. Geogr. 2022, 42, 928–938. [Google Scholar]
  36. Jiang, J.; Lu, J.; Ge, D.; Sun, D. Research on Spatial-temporal evolution characteristics of urban economic networks in Yangtze River Delta. Resour. Environ. Yangtze Basin 2023, 32, 24–39. [Google Scholar]
  37. Meng, B.; Zhang, J.; Zhang, X. Detecting the Spatial Network Structure of the Guanzhong Plain Urban Agglomeration, China: A Multi-Dimensional Element Flow Perspective. Land 2023, 12, 563. [Google Scholar] [CrossRef]
  38. Windzio, M. The network of global migration 1990—2013:using ERGMs to test theories of migration between countries. Soc. Netw. 2018, 53, 20–29. [Google Scholar]
  39. Chen, M.; Chen, Y.; Xu, Y.; An, Q.; Min, W. Population flow based spatial-temporal eigenvector filtering modeling for exploring effects of health risk factors on COVID-19. Sustain. Cities Soc. 2022, 87, 104256. [Google Scholar]
  40. Chen, J.; Chen, Y. The impact of digitalization on the efficiency of innovation factor allocation: From the perspective of factor flow. Appl. Econ. 2024, 1–17. [Google Scholar] [CrossRef]
  41. Davis, D.R.; Dingel, J.I. A Spatial Knowledge Economy. Am. Econ. Rev. 2012, 109, 153–170. [Google Scholar] [CrossRef]
  42. Otsuka, A. A new approach to inter-regional network externalities in Japan. Reg. Sci. Policy Pract. 2020, 13, 1051–1068. [Google Scholar] [CrossRef]
  43. Wang, B.; Liu, Y. Calculating regional innovation efficiency and factor allocation in China: The price signal perspective. Appl. Econ. 2024, 56, 2451–2469. [Google Scholar] [CrossRef]
  44. Meijers, E.J.; Burger, M.J.; Hoogerbrugge, M.M. Borrowing size in networks of cities: City size, network connectivity and metropolitan functions in Europe. Pap. Reg. Sci. 2016, 95, 181–198. [Google Scholar] [CrossRef]
  45. Li, C.; Duan, X. Exploration of Urban Interaction Features Based on the Cyber Information Flow of Migrant Concern: A Case Study of China’s Main Urban Agglomerations. Int. J. Environ. Res. Public Health 2020, 17, 4235. [Google Scholar] [CrossRef]
  46. Van Derpol, J. Introduction to network modeling using exponential random graph model(ERGM):theory and an application using R-project. Comput. Econ. 2019, 54, 845–875. [Google Scholar]
  47. De Andrade Silva, A.M.; Lazaro, L.L.B.; Andrade, J.C.S.; Prado, A.F.R.; Ventura, A.C.; Campelo, A.; Tridello, V. Examining the urban resilience strategy of Salvador, Bahia, Brazil: A comparative assessment of predominant sectors within the resilient cities network. J. Urban Plan. Dev. 2022, 148, 5022002. [Google Scholar]
  48. Kim, H.; Chung, J.K.; Lee, M.H. Social network analysis of the Jangwi Urban Regeneration Community. Sustainability 2019, 11, 4185. [Google Scholar] [CrossRef]
  49. Berger, T.; Engzell, P. Industrial automation and intergenerational income mobility in the United States. Soc. Sci. Res. 2022, 104, 102686. [Google Scholar] [CrossRef] [PubMed]
  50. Ballestar, M.T.; Díaz-Chao, Á.; Sainz, J.; Torrent-Sellens, J. Knowledge, robots and productivity in SMEs: Explaining the second digital wave. J. Bus. Res. 2020, 108, 119–131. [Google Scholar] [CrossRef]
  51. Jiang, N.; Jiang, W. How does regional integration policy affect urban resilience? Evidence from urban agglomeration in China. Environ. Impact Assess. Rev. 2024, 104, 107298. [Google Scholar] [CrossRef]
  52. Gibson, J.; Olivia, S.; Boe-Gibson, G.; Li, C. Which night lights data should we use in economics, and where? J. Dev. Econ. 2021, 149, 102602. [Google Scholar]
  53. Adamides, E.; Karacapilidis, N. Information technology for supporting the development and maintenance of open innovation capabilities. J. Innov. Knowl. 2020, 5, 29–38. [Google Scholar]
  54. Sun, Y.; Chen, D.; Geng, Z. The coordination of technological and financial innovation concepts on the marine economy and its ecological development. J. Sea Res. 2024, 197, 102468. [Google Scholar]
  55. Thompson, C.; Ortmann, A.C.; Makhalanyane, T.; Thompson, F. Leveraging marine biotechnology for an All-Atlantic sustainable blue economy. Trends Biotechnol. 2024, 42, 939–941. [Google Scholar]
  56. Zhao, W.; Ding, F.; Qiu, M. Can the spatial structure of a metropolitan area bring regional economic benefits?—A case study of melbourne. Appl. Econ. 2024, 57, 425–440. [Google Scholar]
  57. Wu, J.; Xu, H.; Tang, K. Industrial agglomeration, CO2 emissions and regional development programs: A decomposition analysis based on 286 Chinese cities. Energy 2021, 225, 120239. [Google Scholar]
  58. Feng, Y.; Lee, C.; Peng, D. Does regional integration improve economic resilience? Evidence from urban agglomerations in China. Sustain. Cities Soc. 2023, 88, 104273. [Google Scholar]
  59. Huang, Q.; Yu, Y.; Zhang, S. Internet development and productivity growth in manufacturing industry: Internal mechanism and China experiences. China Ind. Econ. 2019, 8, 1019581. [Google Scholar]
  60. Lu, H.; Zhang, C.; Jiao, L.; Wei, Y.; Zhang, Y. Analysis on the spatial-temporal evolution of urban agglomeration resilience: A case study in Chengdu-Chongqing Urban Agglomeration, China. Int. J. Disaster Risk Reduct. 2022, 79, 103167. [Google Scholar]
  61. Zhang, Y.; Chen, Z.; Tang, B.; Sun, H. Analysis of spatio-temporal characteristics of urban economic resilience and influencing factors in Guangdong-Hong Kong-Macao Greater Bay Area. Front. Public Health 2022, 10, 922096. [Google Scholar]
  62. Chen, Q.; Bi, Y.; Li, J. Spatial disparity and influencing factors of coupling coordination development of economy–environment–tourism–traffic: A case study in the middle reaches of yangtze river urban agglomerations. Int. J. Environ. Res. Public Health 2021, 18, 7947. [Google Scholar] [CrossRef]
  63. Mazur, L.; Suesse, T.; Krivitsky, P.N. Investigating foreign portfolio investment holdings: Gravity model with social network analysis. Int. J. Financ. Econ. 2022, 27, 554–570. [Google Scholar]
  64. Zhang, X.; Ma, W.; Sheng, S. Understanding the structure and determinants of economic linkage network: The case of three major city clusters in Yangtze River Economic belt. Front. Environ. Sci. 2023, 10, 1073395. [Google Scholar]
Figure 1. Evolution of the urban degree centrality and night light sequence in the Yangtze River Delta.
Sustainability 17 03267 g001
Figure 2. Time series evolution diagram of city point degree center degree in the Yangtze River Delta.
Sustainability 17 03267 g002
Figure 3. Analysis chart of standard deviation ellipse in the Yangtze River Delta region.
Sustainability 17 03267 g003
Figure 4. The Moran index chart.
Sustainability 17 03267 g004
Table 1. Descriptive statistical analysis of each variable.
VariableSample SizeMean ValueStandard DeviationMinimum ValueMaximum Value
pli41014.6011.350.7949.56
deg41026.1116.681.0072.50
stu4100.590.800.026.24
lnfai41011.940.8210.1113.54
fin41011.6510.640.6861.41
lnftd4102.931.120.066.70
inf41021.347.1044.0446.40
lnurb4104.050.233.334.50
lninn4104.310.283.194.60
ind4100.940.050.750.99
Table 2. General panel regression estimation results.
VariableMixed OLSIndividual Fixation EffectTime-Fixed EffectTime-Fixed Effect
deg0.094 ***0.109 *0.180 ***0.055
(3.37)(1.66)(6.31)(4.11)
stu−1.970 ***−2.797 ***−0.969 *0.384
(−3.79)(−6.43)(−1.89)(1.01)
lnfai−2.013 **1.310 **−4.000 ***0.549
(−2.19)(2.33)(−4.13)(1.20)
fin−1.8795.725 ***−9.314 **2.191
(−0.45)(2.79)(−2.29)(1.44)
lnftd13.195 ***−12.442 ***15.609 ***−4.130 ***
(10.85)(−8.29)(13.12)(−3.19)
inf0.217 ***0.0100.086 *−0.016
(4.22)(0.19)(1.68)(−0.41)
lnurb34.923 ***36.238 ***19.587 ***2.832
(9.19)(12.66)(4.75)(0.88)
lninn−4.608−2.759−17.098 ***−5.411 ***
(−1.12)(−1.22)(−4.05)(−3.10)
ind−29.676 ***−34.408 ***−12.780−27.456 ***
(−2.80)(−4.01)(−1.24)(−4.15)
_cons19.65859.934 *59.067 *179.674 ***
(0.54)(1.90)(1.70)(7.56)
N492492492492
R20.6580.9440.7010.971
Note: ***, **, and * correspond to the significance levels of 1%, 5%, and 10%, respectively; the corresponding statistics are in parentheses.
Table 3. The results of spatial econometric model testing and analysis.
Adjacency MatrixSecond-Order Inverse Distance MatrixEconomic Matrix
LM-lag57.231 ***34.905 ***12.649 ***
LM-error0.77889.648 ***39.850 ***
Hausman37.839 ***60.007 ***64.502 ***
Irtest both time150.764 ***23.860 ***40.237 ***
Irtest both ind1154.840 ***965.873 ***969.735 ***
Irtest sdm sar83.604 ***48.603 ***75.830 ***
Irtest sdm sem89.006 ***64.860 ***79.943 ***
Note: ***, **, and * correspond to the significance levels of 1%, 5%, and 10%, respectively.
Table 4. Spatial Durbin model effect decomposition.
VariableAdjacency MatrixSecond-Order Inverse Distance MatrixEconomic Matrix
Direct EffectIndirect EffectTotal EffectDirect EffectIndirect EffectTotal EffectDirect EffectIndirect EffectTotal Effect
deg0.133 ***−0.192 **0.140 ***0.133 ***−0.2210.139 ***0.127 ***−0.5040.134 ***
(3.29)(−2.10)(3.51)(3.29)(−0.70)(3.49)(3.01)(−0.77)(3.26)
stu0.700 **3.279 ***0.557 *0.039−1.5740.1010.64611.5970.469
(2.36)(3.78)(1.86)(0.11)(−0.42)(0.34)(1.59)(1.27)(1.40)
lnfai1.148 ***−1.825 **1.195 ***0.723**−8.921 **0.983 ***0.256−30.840 **0.722 *
(3.18)(−2.00)(3.09)(2.00)(−2.19)(2.69)(0.55)(−2.41)(1.94)
fin0.004−4.9650.2354.184 ***43.532 **2.742 **3.342 *56.8052.380 *
(0.00)(−1.29)(0.20)(2.68)(2.29)(2.17)(1.76)(1.34)(1.65)
lnftd−1.121−17.607 ***−0.277−3.437 ***−89.732 ***−0.451−5.373 ***−183.878 ***−2.328 **
(−1.07)(−6.06)(−0.26)(−2.74)(−3.88)(−0.44)(−2.63)(−2.68)(−2.10)
inf−0.046−0.033−0.045−0.0340.309−0.0450.0241.725 *−0.005
(−1.42)(−0.36)(−1.45)(−0.97)(0.79)(−1.49)(0.55)(1.67)(−0.16)
lnurb1.802−34.979 ***3.32910.931 ***84.717 *8.021 ***7.018 *48.5386.067 *
(0.67)(−4.57)(1.29)(3.17)(1.86)(3.00)(1.71)(0.53)(1.94)
lninn0.0931.8620.0690.62711.9230.3081.10430.4800.677
(0.06)(0.48)(0.05)(0.41)(0.84)(0.22)(0.65)(0.97)(0.45)
ind−25.766 ***20.382−27.023 ***−26.423 ***−16.348−26.201 ***−21.720 ***75.807−23.290 ***
(−4.65)(1.40)(−5.15)(−4.40)(−0.30)(−5.14)(−3.38)(0.67)(−4.22)
rho0.259 ***0.632 ***0.508 ***
(4.10)(8.66)(4.07)
N492492492
R20.7210.7850.803
Note: ***, **, and * correspond to the significance levels of 1%, 5%, and 10%, respectively; the corresponding statistics are in parentheses.
Table 5. Estimation results of the spatial Durbin panel quantile model.
10%25%50%75%90%
Adjacency matrix0.0180.0430.257 ***0.388 ***0.289 *
(0.04)(0.05)(0.06)(0.09)(0.15)
Second-order inverse distance matrix0.0490.0540.217 ***0.209 **0.298 **
(0.04)(0.04)(0.08)(0.08)(0.11)
Economic matrix0.0470.089 **0.219 ***0.208 **0.304 **
(0.03)(0.05)(0.08)(0.07)(0.11)
Control variablecontrolcontrolcontrolcontrolcontrol
Number of observations492492492492492
Time-fixed effectcontrolcontrolcontrolcontrolcontrol
Individual fixation effectcontrolcontrolcontrolcontrolcontrol
Note: ***, **, and * correspond to the significance levels of 1%, 5%, and 10%, respectively; the corresponding statistics are in parentheses.
Table 6. Heterogeneity of cities along G60 Science and Innovation Corridor.
Cities Along the RouteNon-Route City
Direct EffectIndirect EffectDirect EffectIndirect Effect
deg0.041−0.0980.076 *0.496
(0.55)(−0.33)(1.85)(1.10)
stu−2.328 **−7.387 *2.178 ***9.87 **
(−2.56)(−1.73)(5.39)(2.33)
lnfai−5.314 ***−19.23 ***0.573−12.89 *
(−3.50)(−3.39)(0.84)(−1.67)
fin−0.001 *−0.0000.000−0.001
(−1.84)(−0.35)(0.11)(−0.89)
lnftd−1.290 **−7.127 **−1.309 ***−8.084 *
(−2.36)(−2.21)(−2.59)(−1.67)
inf−0.325 ***−0.2900.0370.037
(−2.59)(−0.80)(0.96)(0.08)
lnurb21.109−47.062−11.165 ***−27.403
(1.62)(−0.94)(−4.50)(−0.87)
lninn10.37213.093.057 ***21.54 **
(1.62)(0.66)(3.38)(2.11)
ind−0.2891.109−0.269 **−0.137
(−0.66)(0.77)(−2.15)(−0.12)
rho0.234 *0.687 ***
(1.67)(9.88)
N108384
R20.7950.806
Note: ***, **, and * correspond to the significance levels of 1%, 5%, and 10%, respectively; the corresponding statistics are in parentheses.
Table 7. Endogenetic analysis.
degplipli
deg 0.139 ***0.074 ***
(3.49)(3.07)
z0.023 *** 0.004
(3.41) (0.67)
control variableyesyesyes
LM test12.424 ***
Wald test12.354 ***
Note: ***, **, and * correspond to the significance levels of 1%, 5%, and 10%, respectively; the corresponding statistics are in parentheses.
Table 8. The robustness test results of the second lag phase.
Adjacency MatrixSecond-Order Inverse Distance MatrixEconomic Matrix
Delayed second-phase0.102 ***0.068 *0.085 **
(2.78)(1.77)(1.85)
control variablecontrolcontrolcontrol
rho0.497 ***0.659 ***0.590 ***
(8.85)(11.89)(5.90)
Note: ***, **, and * correspond to the significance levels of 1%, 5%, and 10%, respectively; the corresponding statistics are in parentheses.
Table 9. Replacement for the robustness test results of the spatial weight matrix.
First-Order Inverse Distance Matrix
Degree centrality0.009 ***
(7.56)
Control variablecontrol
rho0.218 **
(2.26)
Note: ***, **, and * correspond to the significance levels of 1%, 5%, and 10%, respectively; the corresponding statistics are in parentheses.
Table 10. Replacement for the results of the robustness test for explanatory variables.
Adjacency MatrixSecond-Order Inverse Distance MatrixEconomic Matrix
intermediate centrality0.113 ***0.069 *0.109 **
(2.79)(1.84)(2.37)
control variablecontrolcontrolcontrol
rho0.376 ***0.684 ***0.583 ***
(8.04)(10.50)(6.17)
Note: ***, **, and * correspond to the significance levels of 1%, 5%, and 10%, respectively; the corresponding statistics are in parentheses.
Table 11. The mediation mechanism tests for the estimated results.
plim1m2m3
(1)(2)(3)(4)
deg0.139 ***0.005 **0.037 *0.445 ***
(3.49)(2.23)(1.90)(4.10)
stu0.101−0.029−0.1270.299 ***
(0.34)(0.82)(−0.66)(3.50)
lnfai0.983 ***0.0331.107 ***0.157
(2.69)(0.60)(3.98)(0.34)
fin2.742 **0.001−0.0000.002 ***
(2.17)(0.15)(−0.32)(6.10)
lnftd−0.451−0.179 ***−0.112−0.178 **
(−0.44)(−4.80)(−1.22)(−2.25)
inf−0.0450.010 ***0.034 **−0.371 ***
(−1.49)(2.70)(2.23)(−3.29)
lnurb8.021 ***0.1299.801 ***−0.099 **
(3.00)(0.71)(8.23)(−2.20)
lninn0.3080.155 *1.114 ***0.157
(0.22)(1.69)(3.09)(1.23)
ind−26.201 ***−0.029 ***0.489 ***−0.520
(−5.14)(−3.70)(12.90)(−0.19)
rho0.632 ***0.268 **0.668 *0.310 ***
(8.66)(2.39)(1.79)(2.88)
N492492492492
R20.7850.7900.8030.793
Note: ***, **, and * correspond to the significance levels of 1%, 5%, and 10%, respectively; the corresponding statistics are in parentheses.
Disclaimer/Publisher’s Note: The statements, opinions and data contained in all publications are solely those of the individual author(s) and contributor(s) and not of MDPI and/or the editor(s). MDPI and/or the editor(s) disclaim responsibility for any injury to people or property resulting from any ideas, methods, instructions or products referred to in the content.

