Article

How Does the Perception of Climate Change Affect Residents’ Choices of Green Assets?

1
School of Economics and Management, Zhejiang Sci-Tech University, Hangzhou 310018, China
2
Institution for Green and Low-Carbon Development, Zhejiang Sci-Tech University, Hangzhou 310018, China
*
Author to whom correspondence should be addressed.
Sustainability 2025, 17(7), 3263; https://doi.org/10.3390/su17073263
Submission received: 21 February 2025 / Revised: 26 March 2025 / Accepted: 1 April 2025 / Published: 7 April 2025

Abstract

:
Residents’ choices of green assets typically involve investing in or selecting environmentally beneficial products. How does climate change affect these choices? This study empirically finds that residents’ perception of climate change significantly enhances their adoption of green assets. This positive effect is particularly pronounced among women and residents who are familiar with ESG (Environmental, Social, and Governance) principles. Moreover, residents’ ecological values (i.e., their willingness to spend more on environmental protection) mediate all hypothesized relationships. Focusing on green assets in the context of green consumption, this study reveals patterns in residents’ green asset choices across different quantiles. Furthermore, it integrates ecological values into the research framework and provides reusable instrumental variables for future studies. Finally, tailored policy recommendations are proposed based on population heterogeneity to encourage the adoption of green assets.

1. Introduction

Climate change poses a significant threat to sustainable socioeconomic development and human survival [1,2]. Human activities are the primary driver of climate change. They have significantly contributed to the acceleration of global temperature increases through greenhouse gas emissions [3]. Moreover, environmental degradation has also exerted a negative effect on household financial conditions [4]. The Central Committee of the Communist Party of China and the State Council issued a notice at the end of July 2024 calling for the comprehensive advancement of the Beautiful China initiative. The notice emphasized the acceleration of modernization that promotes harmony between humans and nature. It also stressed the need to drive the greening and low-carbon development of the economy and society. This policy orientation not only requires a significant reduction in carbon dioxide emissions through technological innovation [5] but also aims to drive systemic social change through daily green consumption and investment behaviors of residents. It is based on this practical need that green assets, as a key link between individual actions and ecological sustainability, are increasingly valued strategically. These assets guide residents in allocating funds to environmentally friendly products and services, which can effectively promote the transition to a green and low-carbon economy and strengthen the foundation for individual action in coping with climate change [6,7,8,9]. Therefore, this study defines green assets as investment decisions and product choices made by residents based on environmental benefits [10]. Their aim is to achieve an organic unity between environmental protection and individual economic actions through market-oriented means.
A review of the relevant literature suggests that public climate concerns can impact asset pricing [11,12] and the extent of corporate ESG disclosure [13]. From the perspective of air pollution, when pollution reaches a certain threshold, people tend to choose low-carbon emission products [14,15,16], and their investment sentiment is also linked to the stability of the financial market [17,18,19]. In addition, several surveys of the public in Europe, India, and Malaysia have revealed that their subjective norms, attitudes, and financial performance affect their asset selection preferences [20,21,22,23].
However, the response of Chinese residents’ green asset choices to their perceptions of climate change has rarely been studied, and the impact between them is uncertain. Although some scholars have argued that concern for the climate can increase the demand for green assets [24], another view suggests that there is no significant relationship between environmental concern and investors’ choices of green assets [21]. Our study seeks to determine which view is valid.
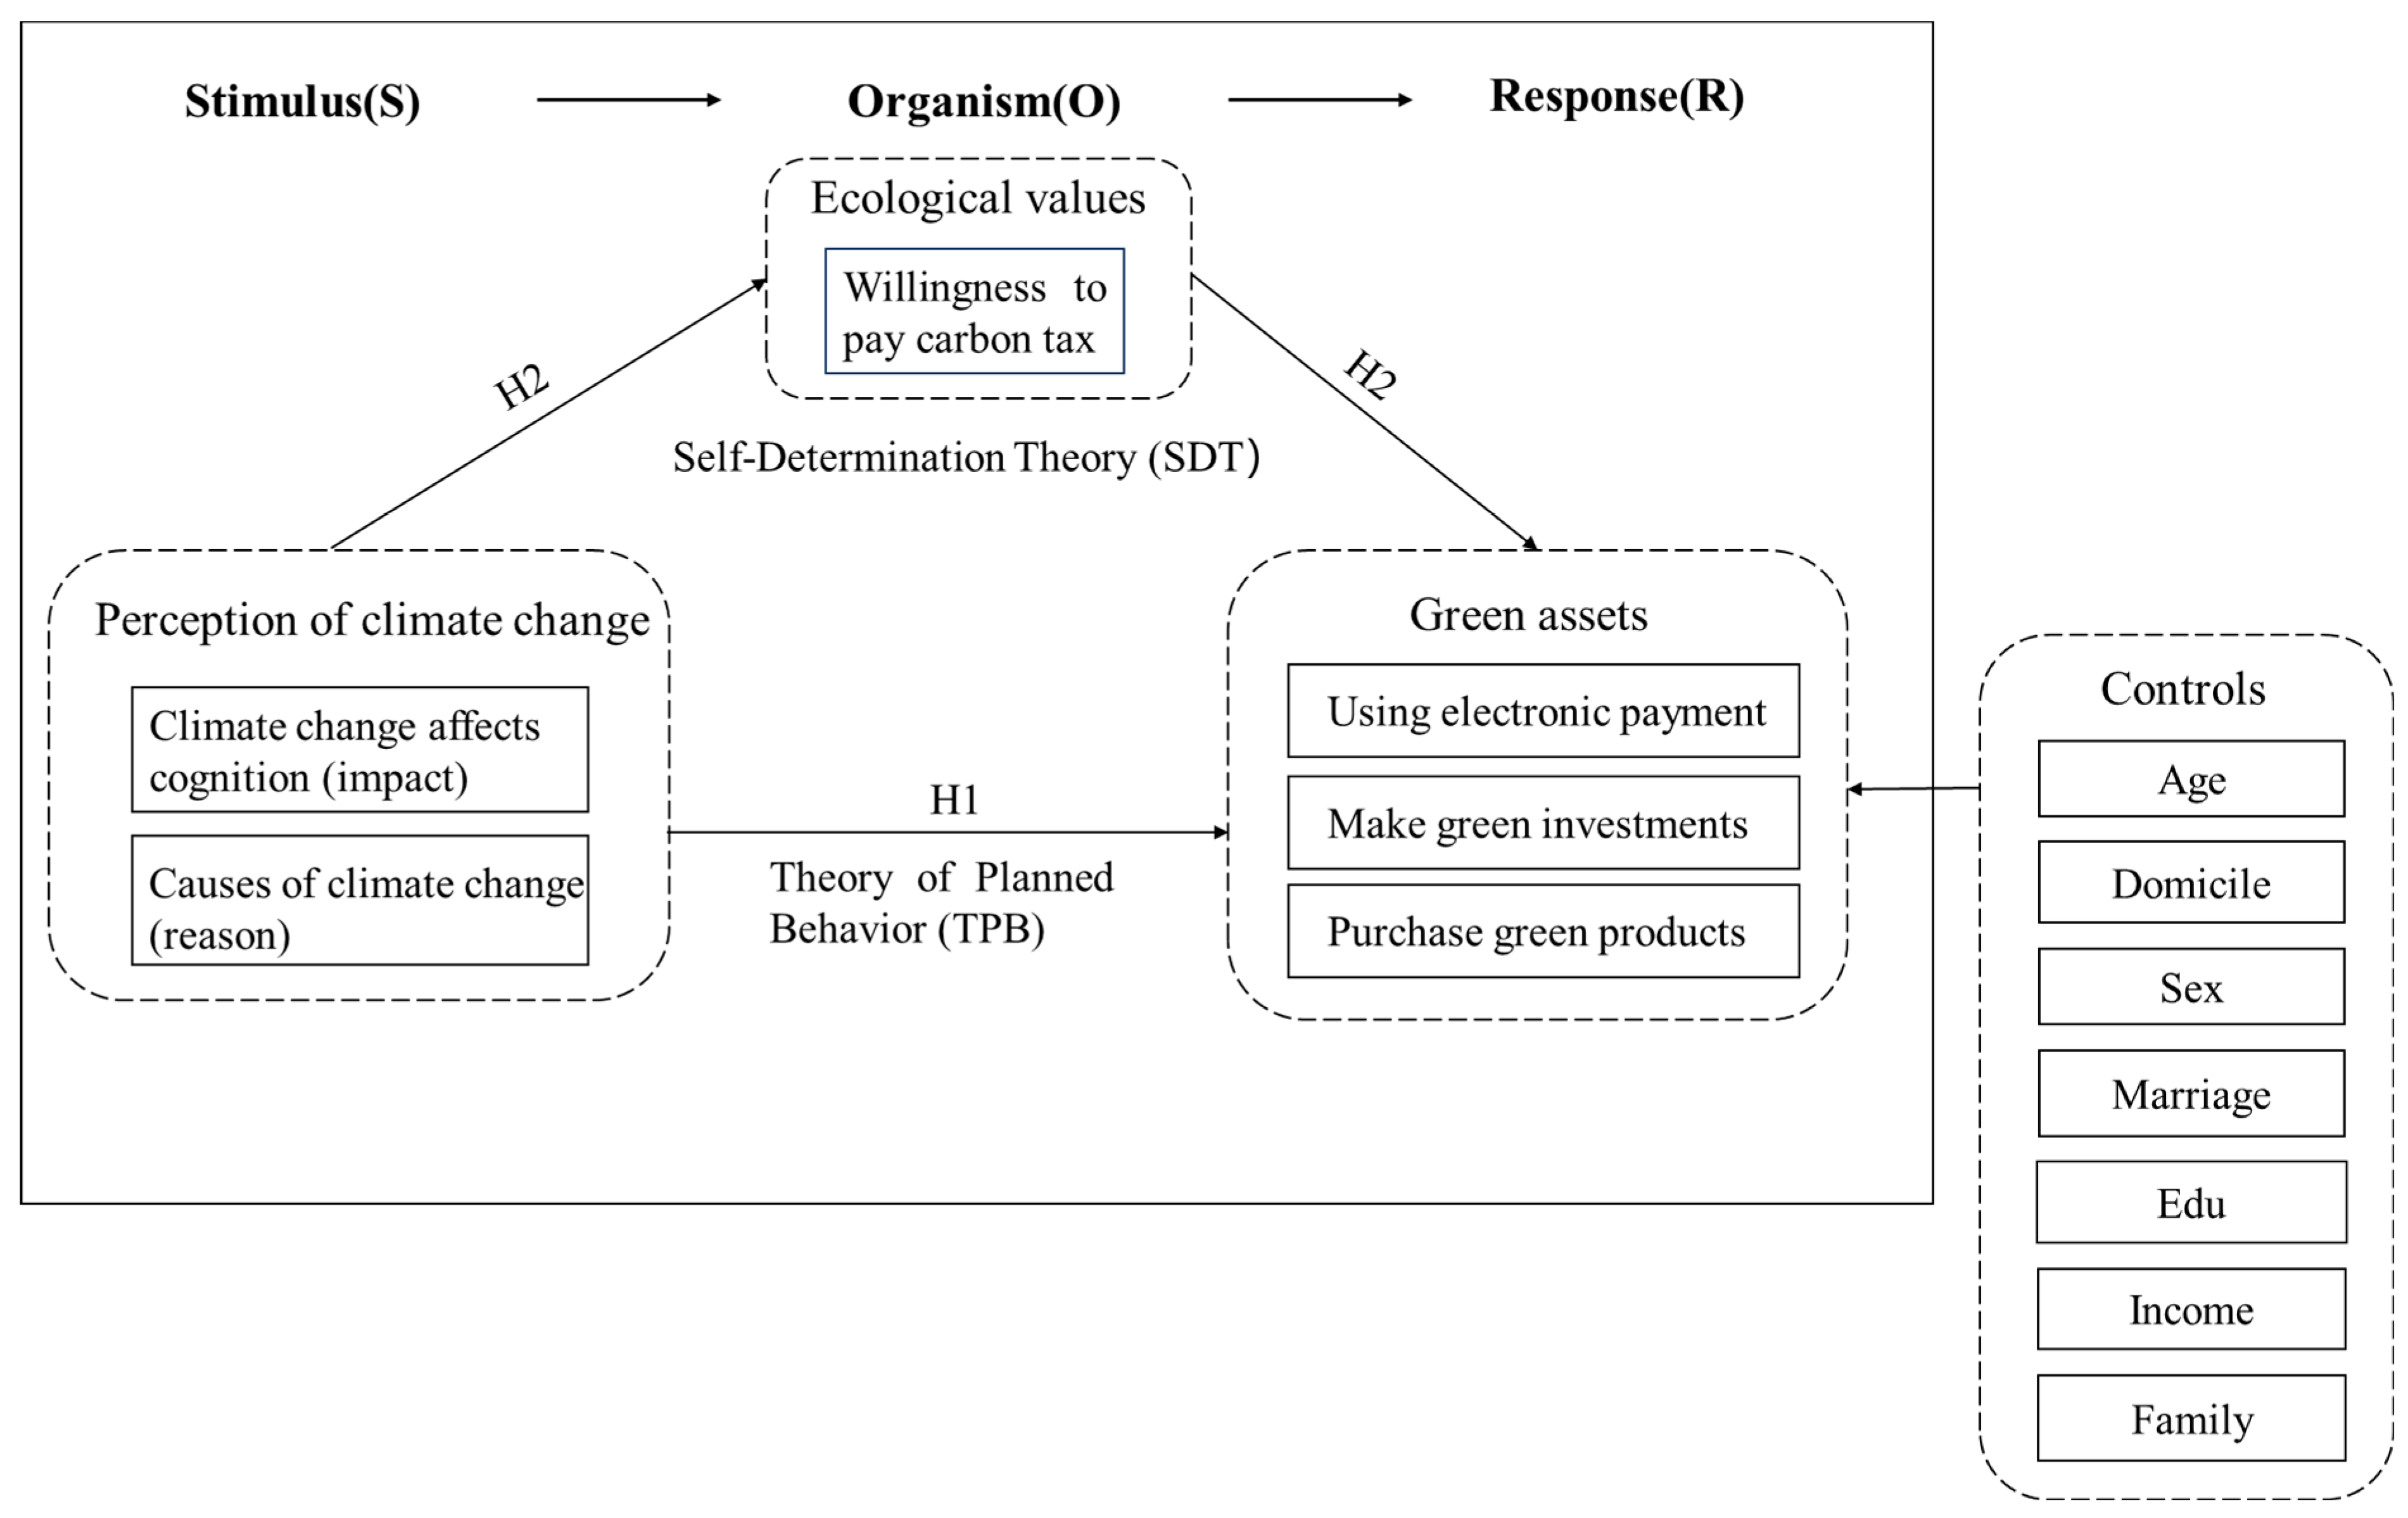
This paper aims to investigate the relationship between residents’ perceptions of climate change and their choices of green assets. The findings will be compared with results from other countries. This study also aims to assess the varying sensitivity to climate change perceptions among different groups of green asset investors. Additionally, it will verify the intermediary role of ecological values. We used questionnaires to elicit responses and applied multiple linear regression, multivariate ordered probit models, and quantile regression to analyze the survey results. This study categorizes the selection of green assets into three aspects: purchasing green products, engaging in green investments, and using electronic payments. This enriches and clarifies the research landscape.
The present study makes three contributions to the field. First, this study introduces a quantile regression model to address the issue of heterogeneous behavior distribution in traditional analytical frameworks. Most existing research analyzes average effects but fails to explain why identical perceptions of climate change lead to different behavioral responses across groups. This paper demonstrates that low-quantile groups are far more sensitive to climate change perceptions than high-quantile groups, thereby enriching the existing body of literature. Next, our study examines the mediating role of ecological values, offering a distinct theoretical framework for value-driven policies that is separate from the path of religious ethics. While existing research confirms the significant impact of religious values on green investment, it overlooks the broader role of ecological values. This research quantifies the transmission efficiency of ecological values between perceptions of climate change and green asset choices. Finally, this paper provides new instrumental variables for future research.
The rest of this article is structured as follows: Section 2 introduces the theoretical framework and reviews the relevant literature. Section 3 describes the sample sources, elucidates the variable design, and explains the specific model used. Section 4 presents the empirical results, discusses endogeneity, provides robustness checks, and conducts heterogeneity analysis. Section 5 provides a comprehensive discussion of the research findings. The final section summarizes the article’s conclusions and provides policy recommendations.

2. Theoretical Framework and Literature Review

2.1. Theoretical Framework

This study adopts the Stimulus–Organism–Response (SOR) theoretical framework. It integrates Self-Determination Theory (SDT) and the Theory of Planned Behavior (TPB) to systematically investigate how residents’ perceptions of climate change influence their choices of green assets. The analysis explicitly emphasizes the mediating role of ecological values. Existing research has primarily focused on the Theory of Planned Behavior (TPB) [20,21,23], examining how attitudes, subjective norms, and perceived behavioral control influence decision-making. Some studies analyze attitudes as mediators using SDT [25]. However, these works largely overlook the broader role of values in connecting consumer perceptions and behaviors.
According to SOR theory, individual behavioral decision-making follows a three-stage conduction pathway of external stimulus, internal mental state, and behavioral response [26]. When residents have a deeper understanding of climate change through personal experiences with climate issues or relevant climate education, this external stimulus will promote the formation of an individual’s value orientation to protect the environment and trigger the dynamic adjustment of their internal psychological mechanisms, enhancing their recognition of values such as biosphere conservation and sustainable use of resources [27]. This internal psychological motivation will enable consumers to fully consider the impact of their behavior on the environment and ecology when making decisions and then achieve synergy between their personal goals and environmental goals by purchasing green products or participating in carbon emission reduction investments. This mechanism is highly consistent with the research content of this paper, making it appropriate to apply this theory for analysis. At the same time, SDT and the TPB are also incorporated into the analysis framework, demonstrating the direct and indirect impact of climate change perception on green asset selection through the cross-validation of multidimensional theories, and determining the transmission efficiency of ecological values. Figure 1 shows the theoretical framework of this paper.

2.2. Literature Review

2.2.1. Green Assets

Economic incentives derived from choosing green products are a key factor influencing consumer decision-making [21,22,28]. When consumers face high costs or negative return expectations for green products, they may deviate from eco-friendly choices [20,29]. This impact is seen not only in the cost difference between green and traditional products but is also influenced by policy and climate risks. Policy uncertainty makes people risk-averse when choosing, reducing their willingness to select green assets [30]. However, climate risk has a dual effect on green assets. On one hand, it positively affects returns and boosts purchase intentions [19]. On the other hand, it increases return volatility, adding investment risks [31]. Therefore, governments offer consumption vouchers or subsidies to encourage green consumption. Yet, according to Self-Determination Theory (SDT) [32], consumer behavior is driven by both internal and external motivations. So, relying solely on external economic incentives is insufficient for long-term sustainable development. For instance, public transport is more environmentally friendly than private transport, but people often choose the latter when prioritizing personal benefits [33].
Notably, internal motivations (attitudes, subjective norms, environmental concern, etc.) have stronger explanatory power on consumer behavior choices [28]. Table 1 presents relevant research conducted by scholars from various countries. Cross-nationally, scholars have generally noted the significant promoting effect of attitudes and subjective norms on green product choices. For example, an empirical study based on Indian investors has shown that individuals’ environmental attitudes, subjective norms, and collectivist tendencies can positively predict their intention to adopt green products [21,25]. This result is cross-nationally generalizable. Similar effects have been confirmed in studies in Malaysia, the US, and Taiwan [20,34].
However, the role of environmental concern is still disputed [21,28]. Some scholars argue that public climate concern can indirectly influence green behavior through economic incentives and attitude. Public climate concern influences the pricing and returns of green assets [35,36], and higher returns can encourage the public to opt for green assets [20,30,37], thereby creating a virtuous cycle for green investment and environmental protection. Yet, opposing views suggest that the link between environmental concern and actual actions might be overrated. For example, Rajdeep Kumar Raut et al. found no significant relationship between environmental concern and green behavior using the TRA model [21]. Therefore, further analysis is needed on how residents’ environmental or climate concerns affect their behavioral choices from different international perspectives.
Moreover, most research focuses on investors’ responses to green bonds or green stock markets, overlooking the impact of internal motivations on green choices in different situations. Thus, this study broadens the analysis to three more expansive behavioral areas: green product purchasing, green investment decisions, and e-payment usage.

2.2.2. Perceptions of Climate Change and Selection of Green Assets

Residents’ perceptions of climate change have a significantly positive impact on their willingness to choose green assets [38]. This is because cognition is the basis of behavior. According to the Theory of Planned Behavior [39], residents’ perception of climate change affects their understanding of environmental issues and support for climate policies, which in turn influences their selection of green assets [40]. Especially when people are in abnormally high-temperature environments, they gain a deeper understanding of the hazards of climate change. This enhanced awareness prompts investors to focus more on environmental protection and sustainability in asset selection [41]. Moreover, individuals with stronger climate perception and adaptation abilities can more effectively predict future adaptability and potential risks, leading to more proactive choices in green consumption [36,42,43]. Meanwhile, asset prices are determined by supply and demand. An increase in demand raises the returns on invested green products [35], creating a virtuous cycle of “investment returns”. As can be seen, enhancing residents’ climate change perception can boost green consumption on the demand side. It also makes the green asset market more active, attracting more capital to green industries. This accelerates green economic development and drives society toward sustainability.
Nevertheless, some scholars believe that the degree of residents’ awareness of climate and environmental issues has little impact on their selection of green assets [21]. Rui He et al. note that even if people recognize the significance of green consumption, a gap may still exist between awareness and action [44]. This could be attributed to residents’ position as non-core stakeholders, resulting in insufficient autonomy and an endogenous driving force in green consumption [45]. Additionally, there are disparities in perceptions of climate change and behavioral adjustments among residents of different nations. Compared to residents of developed countries, Chinese residents have a less comprehensive understanding of climate change, with more limited behavioral adjustments. Therefore, translating awareness into action is essential. Both Xin Qiu et al. and Christoph Herrmann et al. posit that for this behavioral transformation to occur, residents must be convinced that their actions can foster sustainable development [46,47]. Still, how to effectively bolster such confidence and ensure the sustainability of behavioral change amid individual differences in complex socioeconomic settings remains a vital topic for future research.

2.2.3. Mediation of Ecological Values

Perception of climate change strengthens individuals’ ecological values. Sander van der Linden developed the Climate Change Risk Perception Model (CCRPM), demonstrating that British residents’ knowledge of climate change impacts positively influences their perceptions of risk [48]. When individuals’ climate cognition is enhanced through media or experiencing extreme climate events, abstract climate threats become concrete ecological responsibilities [27,49], fostering deeper ecological values.
Ecological values directly influence individuals’ choices of green products in consumption and investment. John Magnus Roos et al. note that different values lead to different consumption habits and behaviors [50]. People with ecological values prioritize a product’s environmentally friendliness, putting the well-being of society before their own, so their choices are not swayed solely by economic costs [51]. They are more inclined to make eco-friendly choices [52], pay a premium for green products, and favor environmentally friendly assets, thereby forming stable green consumption preferences.
The transmission mechanism among perception, value, and behavior follows a “perception–value–behavior” dynamic path. According to the SOR theory, when residents recognize the challenges of climate change, their intrinsic motivation to protect the environment is activated, leading them to choose a green lifestyle more often [53]. However, if an individual combines their perception of climate change with a hedonic value orientation, it may weaken their green behavior [54]. In other words, the more firmly residents hold ecological values, the higher their demand for green assets [41,55]. For example, Linda Steg et al. [56] developed the Integrated Framework for Environmental Psychology (IFEP) to examine the drivers of residents’ green consumption behavior, highlighting the crucial role of individual values in shaping behavior. Similarly, Aijun Guo et al. [27] found that ecological values enhance the positive impact of climate change perception on sustainable behavior, as observed in a study of farmers in a typical arid area of China.
Nonetheless, most current studies are based on the Theory of Planned Behavior (TPB) or the Value–Belief–Norm theory (VBN), overlooking the role of ecological values in transmitting cognition to behavior. Moreover, Lanting Liu and Grace R. Tobias [57] argue that residents’ awareness of environmental responsibility and environmental behavior skills are more important than environmental values in promoting green consumption. Therefore, this paper explicitly treats ecological values as a mediating variable to examine changes in consumer behavior.
Based on the literature review, this paper posits that residents’ perceptions of climate change significantly influence their choice of green assets. Higher perception levels mean a greater, more significant likelihood of positive green-behavior attitudes. Ecological values also play a key role in driving green asset choice behaviors. Consequently, this paper proposes the following hypotheses:
Hypotheses 1:
Residents’ perception of climate change has a positive effect on the selection of green assets.
Hypotheses 2:
Ecological values play a mediating role in the impact of residents’ perceptions of climate change on their selection of green assets.

3. Research Methodology

3.1. Data Sources and Sample Selection

The data used in this study were collected from a questionnaire survey conducted among residents in 11 prefecture-level cities in Zhejiang Province in 2024. During the questionnaire design phase, the authors considered the study’s unique aspects and drew upon relevant theories and prior research. Following the principles of functionality, reliability, efficiency, and maintainability, the authors made a preliminary design. Then, by distributing 100 questionnaires and conducting expert interviews, the author revised repetitive, ambiguous, or ineffective questions, aiming for concise and clear wording and consistent understanding between respondents and investigators. The final questionnaire consists of three parts: the first two cover residents’ perceptions of climate change and their green asset choices, and the third collects respondents’ personal information.
The field survey employed a three-stage mixed sampling technique. First, the sample size and regional economic development levels were determined based on the population proportion of each city. Stratified sampling using Neyman allocation was then applied to select county-level administrative regions. Second, residents were sampled from each street and township using the probability proportional to size (PPS) sampling method. Third, residents were randomly selected for the questionnaire survey based on gender. The sampling results are presented in Table 2.
We conducted a field survey of 700 residents and excluded responses with incomplete information. A total of 656 valid responses were used for further analysis, with an effective response rate of 93.71%. Figure 2 shows the number of usable questionnaires collected in each prefecture-level city in Zhejiang Province. The distribution of these numbers is similar to the sampling design results, indicating that the data in this study are authentic and valid.
Additionally, the reliability of the questionnaire was assessed, yielding a Cronbach’s alpha coefficient of 0.796, which indicates satisfactory reliability. The validity was also examined using the KMO test, which yielded a coefficient of 0.760 (greater than 0.5), and Bartlett’s test of sphericity, with a chi-square statistic and a significance probability (p-value) of less than 0.05. These results confirm the structural validity of the questionnaire. Furthermore, we conducted multicollinearity tests for all the variables. The average variance inflation factor (VIF) was 1.37, well below 10, suggesting that the model is valid. The above test results are shown in Table 3.

3.2. Data Processing Methods

We conducted a preliminary analysis of the survey sample’s demographic data. The results are summarized in Table 4. The proportion of male respondents was slightly higher than that of female respondents, and the sample distribution was close to the male–female ratio in the province. The age distribution is generally between 16 and 40 years. The average annual household income is approximately CYN 100,000 to 300,000, which is basically in line with the average household wage level of CYN 128,825 in Zhejiang Province. A total of 67.08% have a bachelor’s degree or above. Most of the registered residences are urban. And the main occupations are students and business leaders or employees. A comparison of the distributions of population characteristics in Zhejiang Province revealed that this study deviates from the actual sample in terms of age distribution. This may be due to factors such as a low interest in the questionnaire survey among the older resident population, limited education level, and incorrect answers, which led to the questionnaire being excluded. In summary, the demographic indicators of the survey sample show a wide range of distribution characteristics, laying a solid foundation for further in-depth data processing and detailed analysis.
Each variable in the questionnaire was assigned a value before data input, with the intention of enhancing the normalization and reliability of the data. For the gender and marital status variables, 1 = male or married, and 0 = female or unmarried. Variables such as climate change perception was assigned the following values: 1 = strongly disagree, 2 = disagree, 3 = agree, 4 = somewhat agree, and 5 = strongly agree.

3.3. Model

3.3.1. OLS Regression

Model (1) is employed to investigate the influence of residents’ perceptions of climate change on their selection of green assets.
G r e e n a s s e t s = β 0 + β 1 i m p a c t i j + β 2 r e a s o n i j + β j c o n t r o l i j + ε i
In the formula, G r e e n a s s e t s represents the average score of green assets. i m p a c t i j represents how climate change affects cognition. r e a s o n i j represents the cause of climate change. c o n t r o l i j represents the control variable, which includes age, income, sex, marriage, family, domicile, and education. ε i is a random disturbance item.
In addition, because the three secondary indicators of the dependent variables in this paper are all measured on a 7-level Likert scale, when used as dependent variables, they are ordered dependent variables, which are suitable for estimation by the Ologit and Oprobit models. Therefore, these two models are applied in the following sections.

3.3.2. Quantile Regression Model

In the preliminary stage of this study, we opted for the OLS regression method to estimate the model in Equation (1). However, OLS can only estimate conditional mean effects. The willingness to choose green assets is often skewed to the right. Mean regression overestimates the representation of high-willingness groups, underestimates the policy sensitivity of tail groups, and overlooks the asymmetry in the distribution of residents’ behavior. Additionally, the same level of climate change perception may elicit different behavioral responses due to variations in values and living environments, thereby masking the driving mechanisms of group heterogeneity. Fortunately, quantile regression offers a solution. It analyzes the differential effects of independent variables on different points of the dependent variable’s conditional distribution, such as low, medium, and high percentiles. In this way, it can reveal the asymmetric mechanism of climate change perception on green asset choice behavior and inform the design of tiered policies. Based on this, we establish the following quantile regression model:
Q u a n t θ G r e e n a s s e t s i X i = β θ X i
In the equation, X i is the independent variable in Equation (1), β θ is a coefficient vector, and Q u a n t θ G r e e n a s s e t s i X i represents the conditional quantile of G r e e n a s s e t s i corresponding to the quantile θ (0 < θ < 1) given for X. The coefficient vector β θ corresponding to θ is achieved by minimizing the absolute deviation (LAD), that is
β θ = a r g m i n i , G r e e n a s s e t s Y X i β θ G r e e n a s s e t s i X i β + i , G r e e n a s s e t s Y < X i β 1 θ G r e e n a s s e t s i X i β .

3.4. Variable Definition

Dependent variable: Green asset selection. This article examines the influence of residents’ perceptions of climate change on their selection of green assets. However, current research on green assets often focuses more on companies and financial institutions, with little consideration given to residents’ perceptions and behaviors [58]. Therefore, from the residents’ perspective, this study measures three aspects of green asset selection: purchasing green financial products, making green investments, and making electronic payments.
Independent variable: The perception of climate change. After drawing on Endre Tvinnereim et al.’s and Jianchi Tian et al.’s research [59,60], this article measures residents’ perceptions of climate change based on the two dimensions: Climate change affects cognition, which is based on the calculation of the average score of four questions: the impact of using coal, oil, and natural gas on climate change; the effect on people’s happiness; the impact on food supply and future society; and causes of climate change (where reason = 1 represents human factors and reason = 0 represents non-human factors).
Controls: This study includes age, income, sex, marriage, family, domicile, and education. Table 5 shows the specific variable definitions.

3.5. Descriptive Statistics

Table 6 provides the general descriptive statistical results. The average value of the selected green assets is 4.613, indicating significant differences in green consumption among residents. The mean cognitive value of residents’ understanding of the impact of climate change in the sample is 4.101, which is greater than the median of 4. The mean cognitive value of residents’ knowledge of the causes of climate change is 0.680, indicating that most respondents have a particular understanding of climate change.
The questionnaire data were then sorted and analyzed. Figure 3a shows that more than 60% of the respondents are willing to purchase green financial products. This reflects an improvement in residents’ environmental awareness and their confidence in green financial products, as well as an increased sense of social responsibility. In addition, Figure 3b presents the results of an interactive analysis of residents’ educational levels, income levels, and their choice of green assets. Significant differences in green consumption behavior were observed across different groups. This may be due to the higher cognitive flexibility and greater interest in, as well as ability to acquire, knowledge among residents with higher education and income levels [61].

4. Empirical Results

4.1. Benchmark Result Analysis

Table 7 presents the benchmark regression results for Model (1). In column (1), all control variables are excluded. Only the independent variables—causes of climate change and climate change impacts cognition—are considered concerning the dependent variable, i.e., green asset selection. The regression coefficients for both variables are significantly positive at the 1% statistical level, with values of 0.593 and 0.478, respectively. Column (2) shows the estimation results after all control variables are included. In column 3, the bootstrap autonomous sampling method is employed to enhance the effectiveness and consistency of the parameter estimation results through parameter estimation. Columns (4) and (5) present the results after the regions and occupations are clustered. The regression results are significantly positive at the 1% level. These findings indicate that residents’ perceptions of climate change positively influence their choice of green assets. Residents’ perceptions of climate change have increased their willingness to choose green assets, driving their purchasing or investment behavior in relation to green financial products. Hypothesis 1 has received preliminary validation.
The selection of green assets is then divided into green product purchases, green investment, and electronic payments. Multiple-ordered logit regression and multiple-ordered probability regression analyses were conducted, and the results are shown in Table 8. The regression results indicate that residents’ perceptions of climate change have a positive effect on their choice of green assets, particularly electronic payments. This suggests that the popularization of electronic payments as a financial service is conducive to reducing transaction costs and service barriers, promoting the growth of a green economy [62].

4.2. Quantile Regression

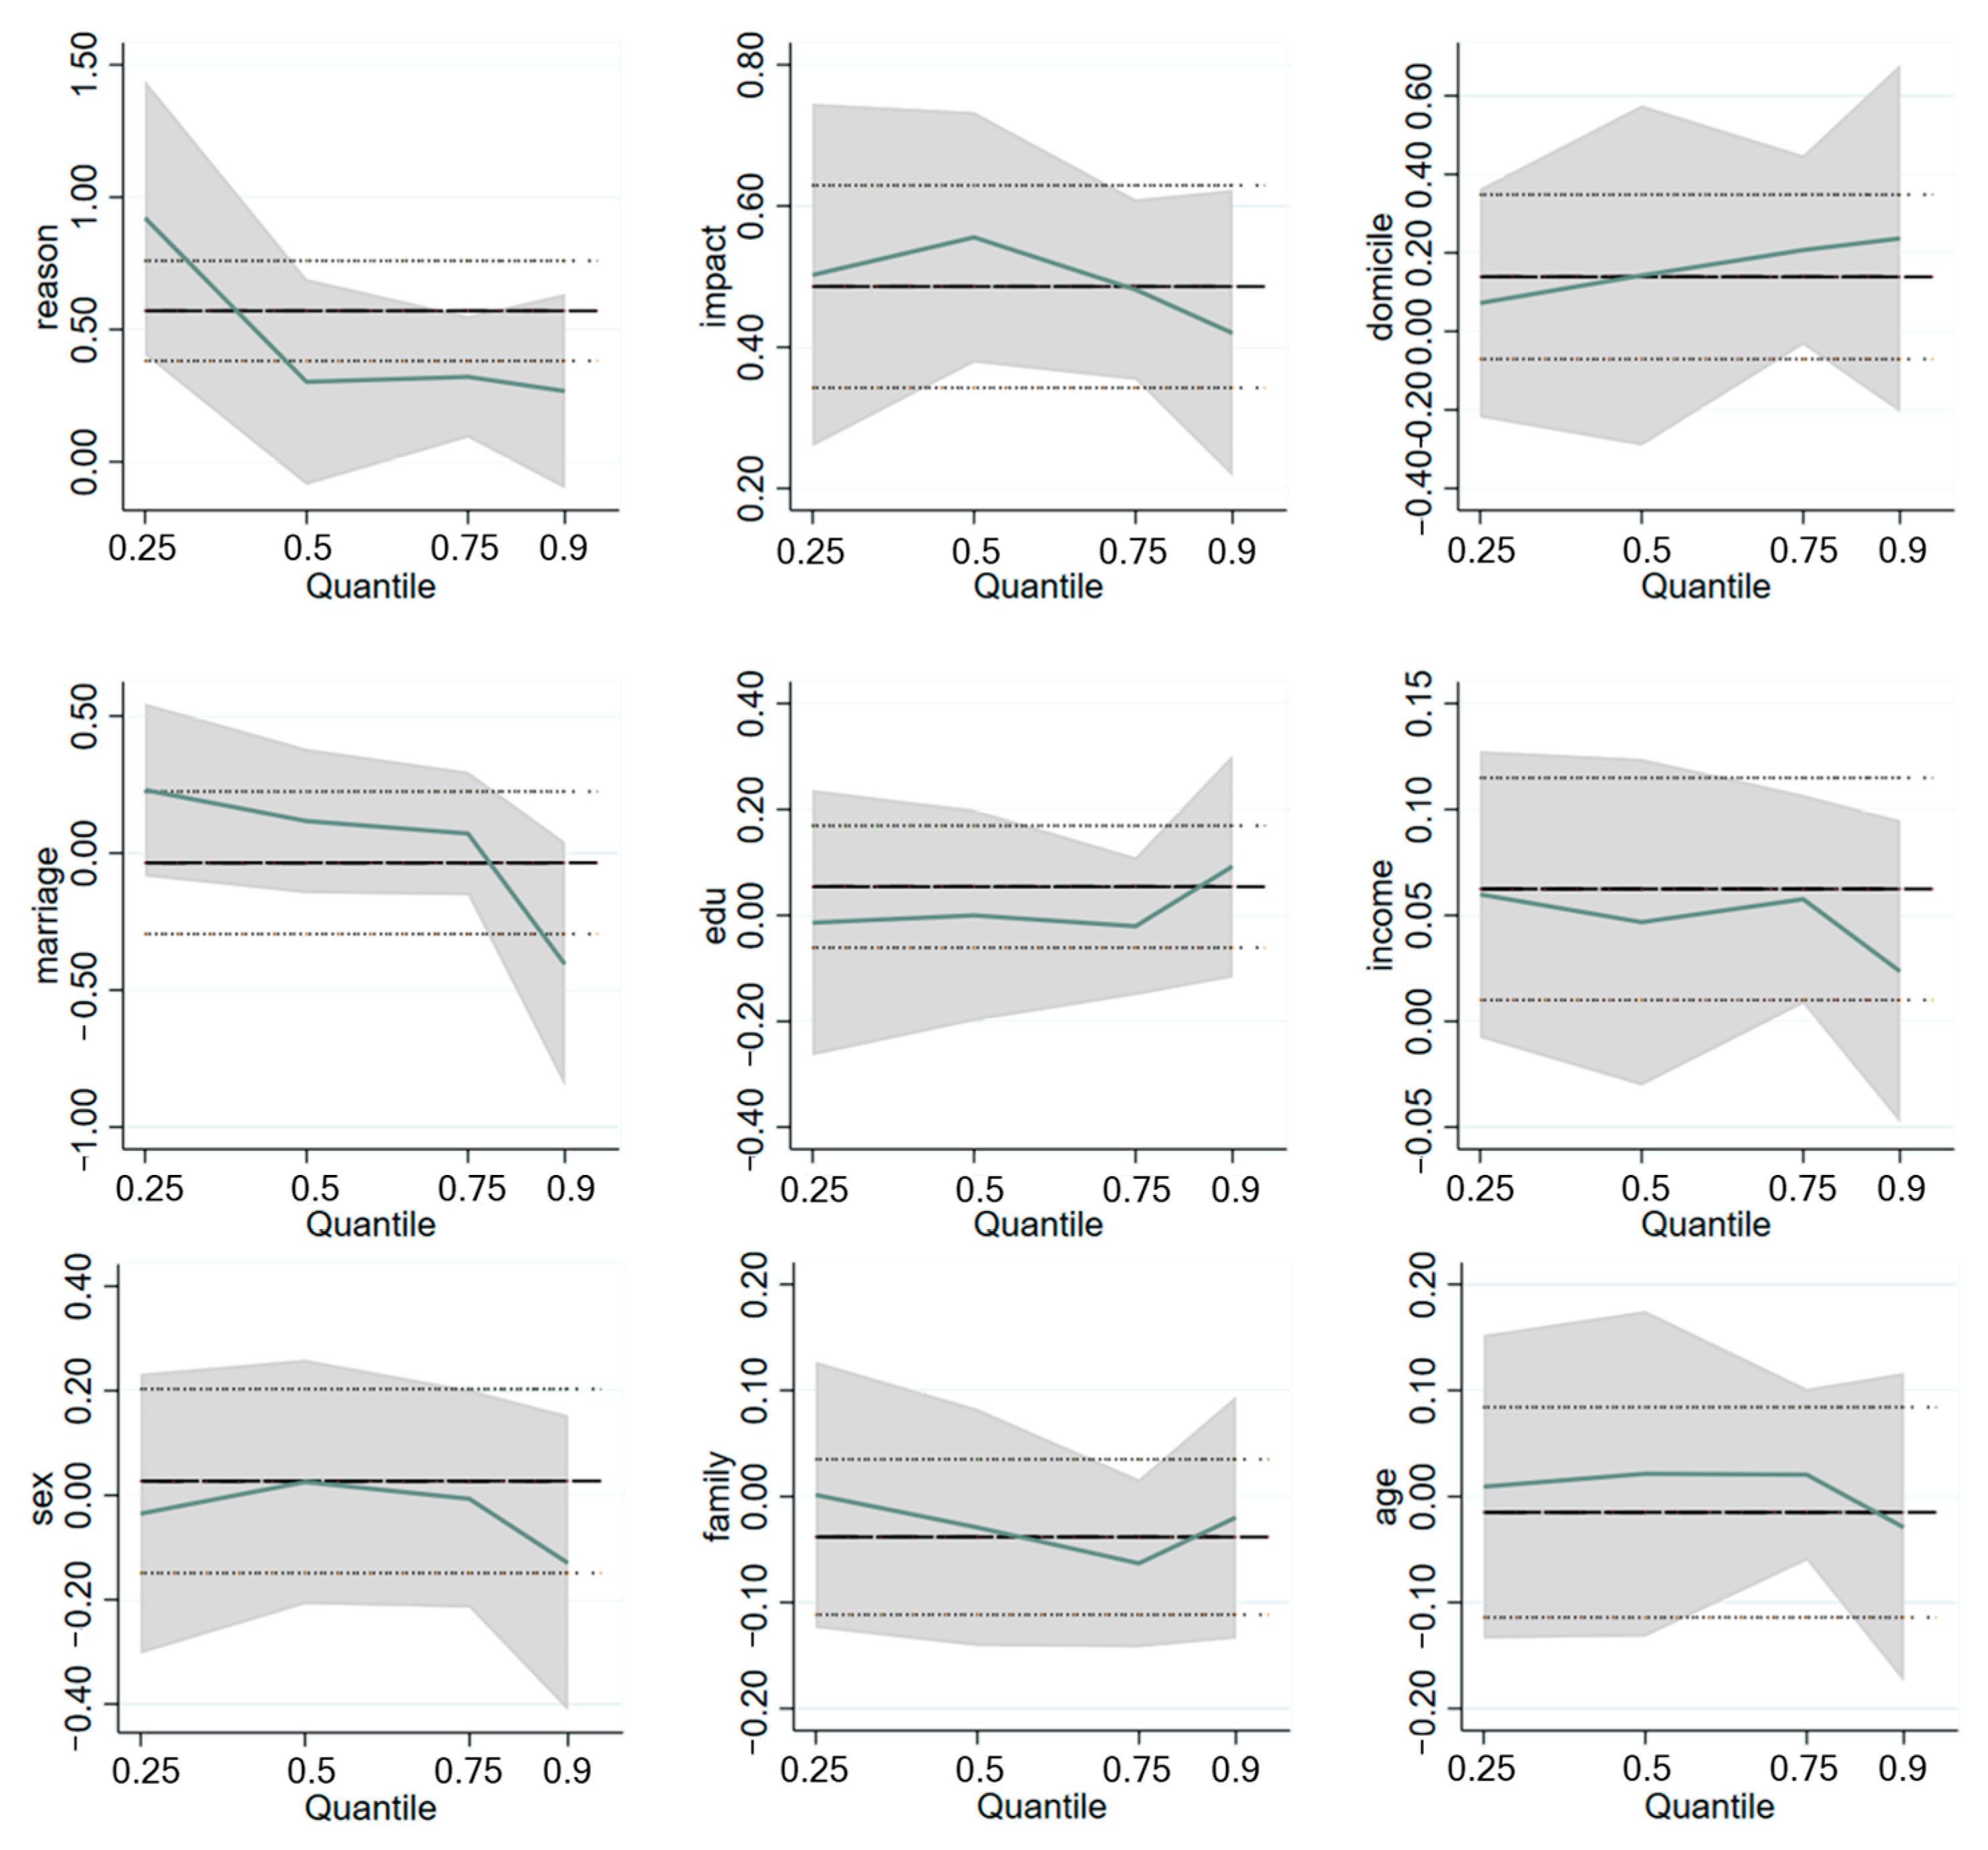
We conducted quantile regression to investigate the effect of residents’ green asset choices on different quantiles. The regression results are shown in Table 9 and Figure 4. The graph shows that the factors affecting residents’ choice of green assets vary, and the impact coefficients of each factor on residents’ choice of green assets vary significantly across quantiles, which are reflected in the following two observations.
On the one hand, the impact of climate change awareness on individual green asset choices initially decreases, then increases, and finally decreases again as the quantile of residents’ green asset selection behavior increases. This finding suggests that enhancing climate change awareness among individuals with a low willingness to choose green assets and those in the 50th to 70th percentiles of green asset selection behavior can more effectively increase demand for green assets. On the other hand, the influence of climate change impact perceptions on the choice of green assets increases continuously up to the 50th percentile and then shows a downward trend. This also suggests the need to raise climate change awareness among groups with low intentions to choose green assets.

4.3. Endogeneity Discussion

The measurement of the effects of climate change on people’s cognition proposed in this article may have inevitable errors, and a more accurate method of identifying it is still needed. In addition, although this study attempted to control variables that affect the selection of green assets as much as possible, there may still be omitted variables. Potential measurement errors and omitted variables may have affected our empirical results. There may be inevitable endogeneity issues in the regression results. Therefore, we adopted the instrumental variable method to reduce the bias caused by endogeneity issues.
In this study, we select the degree of residents’ trust in the climate information provided by the government (gov) and the frequency of natural disasters in the area where residents live (disaster) as instrumental variables for regression. In terms of relevance, the higher the residents’ trust in the climate information provided by the government, the better their understanding of climate change. Residents in areas prone to natural disasters can more acutely feel the challenges of climate change, so the correlation is valid. Regarding exogeneity, there is no evidence that trust or natural disasters are directly linked to residents’ choices of green assets. The regression results are presented in Table 10 as instrumental variable estimates.
The first column in the table presents the regression results of the first stage. The positive impacts of gov and disaster on climate change perception are significant at the 1% level, aligning with prior analyses. The first-stage F-statistic of 15.595, exceeding 10, confirms the validity of the instrumental variables. Column (2) shows the second-stage regression results. The Hansen-J statistic, above 0.1, indicates no over-identification, proving the exogeneity of the instrumental variables. Thus, the effectiveness of the instrumental variables is established. The coefficient of climate change perception is more significant than in the benchmark regression, indicating some endogeneity in the model. The positive effect of climate change perception on green asset choice is more potent than in the benchmark regression.

4.4. Robustness Test

Our study uses the model averaging method to address the uncertainty of the model [63]. The estimated results of the model averages are reported in columns 1 to 4 of Table 11. We conducted multiple regressions again to evaluate the AIC, BIC, AICC, and NOIC. The results indicate that there is no significant difference in the sign and significance of the coefficients compared with those of the baseline regression and that the results are robust. The fifth column represents a re-estimation of the sample after excluding individuals aged 60 and above from the population. The results still indicate that the greater a resident’s perception of climate change, the more likely they are to choose green assets, suggesting that the conclusion is robust.
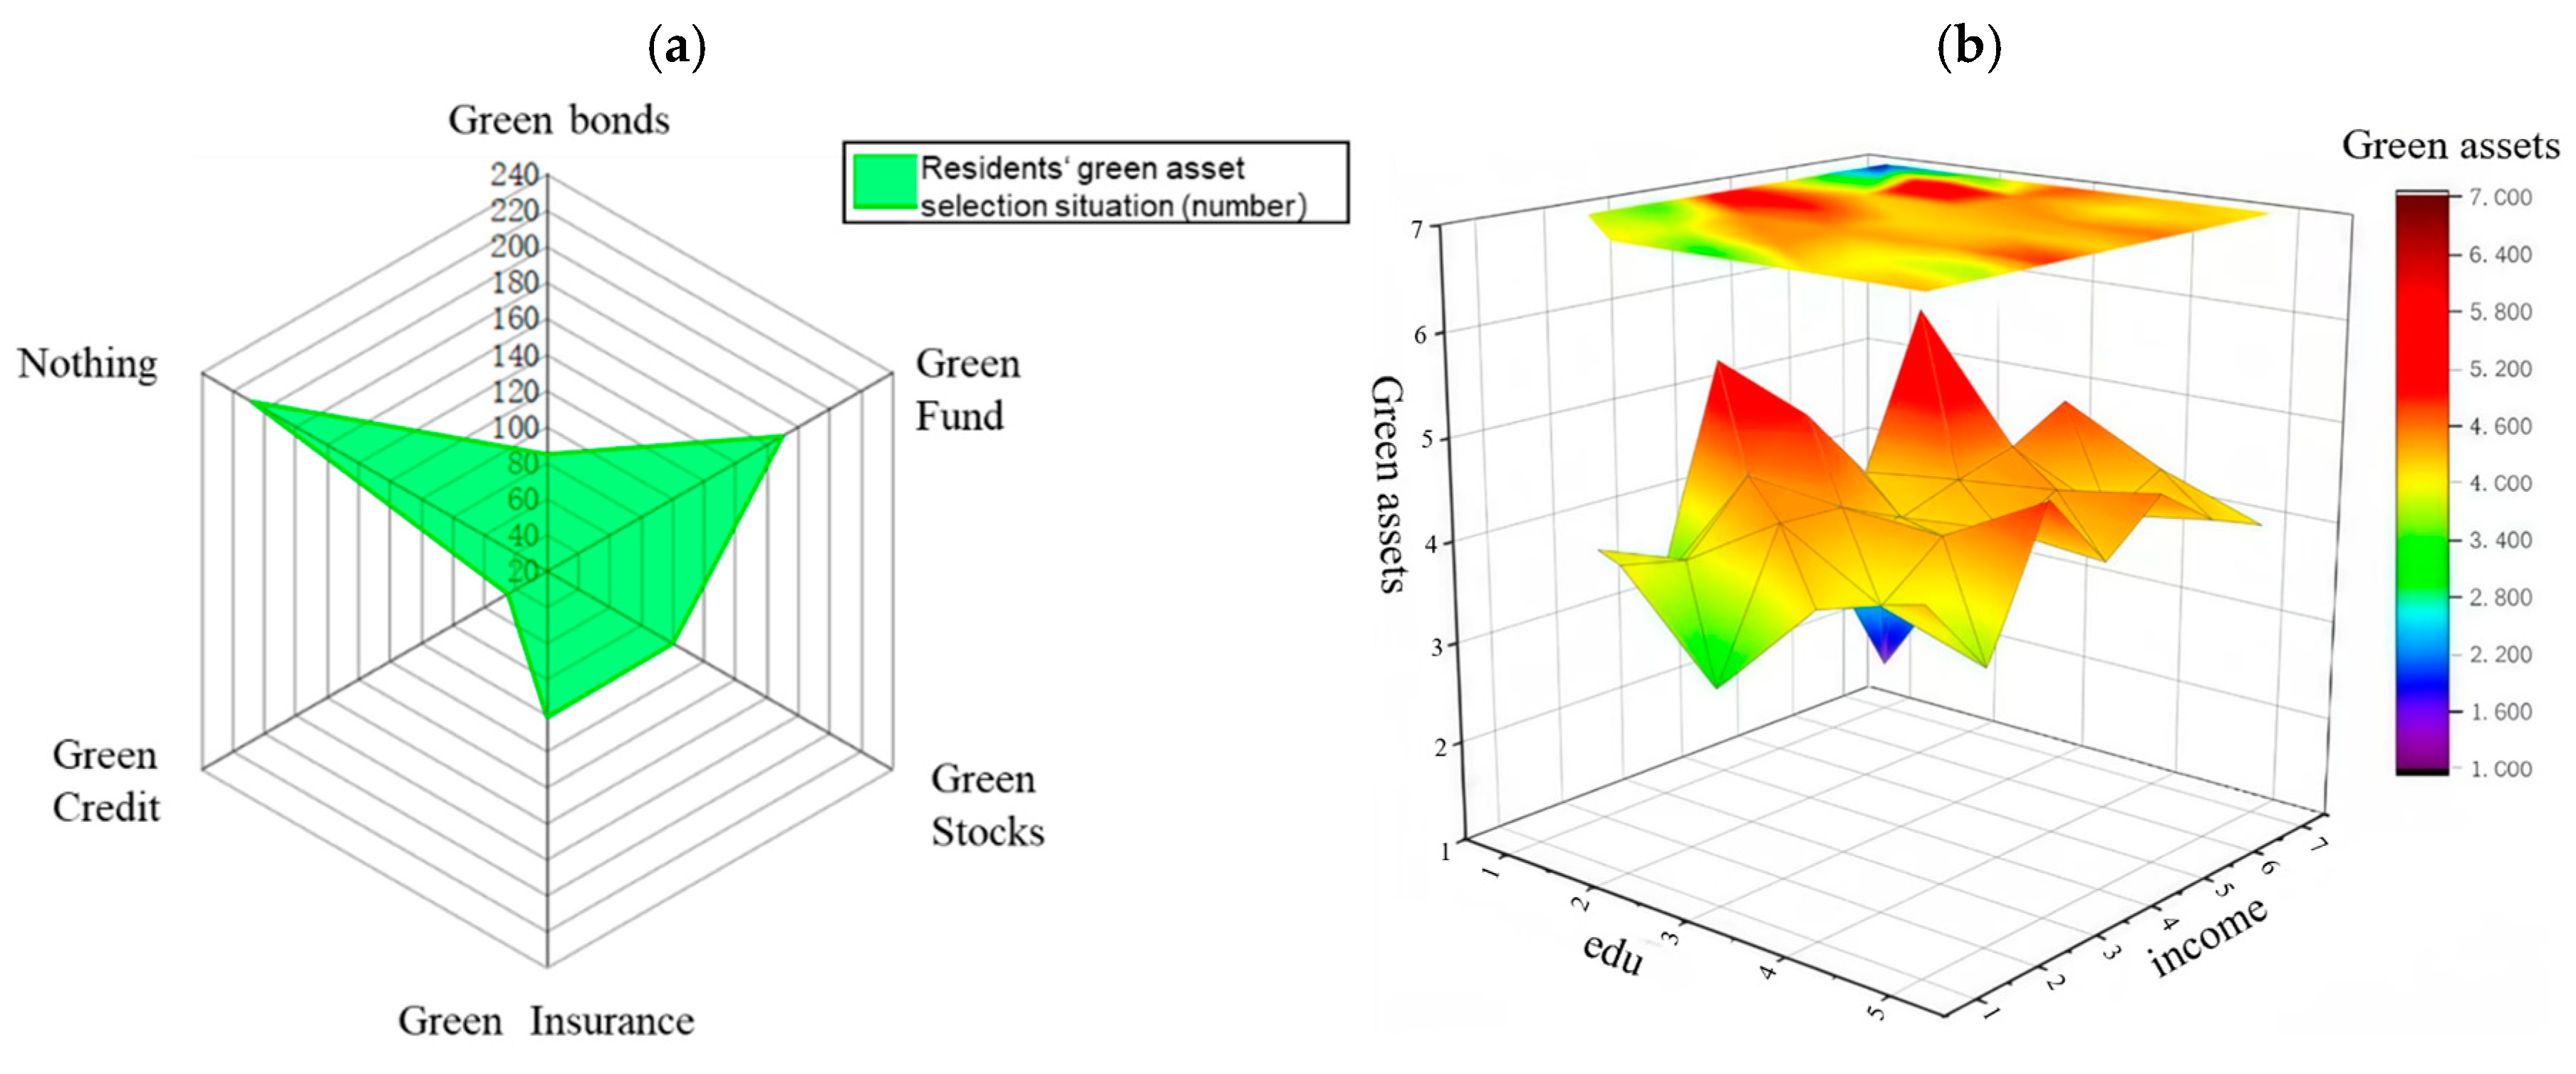
In addition, robustness tests were conducted by replacing the regression model and the dependent variable. We assessed residents’ choice behaviors concerning green assets by asking whether they had ever purchased green financial products, including green funds, stocks, credit, bonds, and insurance. A value of 1 was assigned if a resident had made such a purchase, and 0 otherwise.
This study employs logit and probit regression models for analyzing data with a binary dependent variable. The specific results are presented in Table 12. The first and third columns display the regression results without controlling for control variables, while the second and fourth columns show the results after controlling for all variables. Both findings suggest that climate change perception has a positive impact on the selection of green assets, underscoring the robustness of our results.

4.5. Examination of the Mediating Effect

In this section, we explore the mediating effects of values. In addition to the increased demand for green assets due to rising climate risk [31], financial factors influence individuals’ choice of green assets. The imposition of a carbon tax affects household budget constraints and increases the relative price of green assets [64]. If residents are still more willing to pay, this indicates more significant environmental concern and a stronger ecological value orientation. Like Yin Bai et al. [65] and Sakari Tolppanen et al. [54], we employed a five-level Likert scale to assess whether residents are willing to accept a carbon tax as a standard measure of ecological value.
The second column of Table 13 reports the regression results of residents’ perceptions of climate change on their values. The cognitive impact of climate change on residents is significantly positive at the 1% level, indicating that the mental effects of climate change can shape the formation of individual values. The regression results for values on green asset selection are presented in column 3 of Table 13. The value coefficient is also significantly positive at the 1% level, indicating that residents with higher ecological values are more likely to choose green assets. Hypothesis 2 is thus validated.

4.6. Heterogeneity Analysis

The impact of residents’ perceptions of climate change on green asset choice varies across different groups. Some scholars argue that women tend to exhibit stronger intentions for green consumption and are more likely to hold risky financial assets, such as green stocks [66,67,68]. However, Jianchi Tian et al. [59] argue that men are more likely to consume green products than women. In addition, different ESG performances have varying impacts on green asset selection [69]. Therefore, this study further explores the effects of gender and residents’ ESG awareness on green asset selection.
A heterogeneity analysis was performed after assigning a value of 1 to males and 0 to females. 
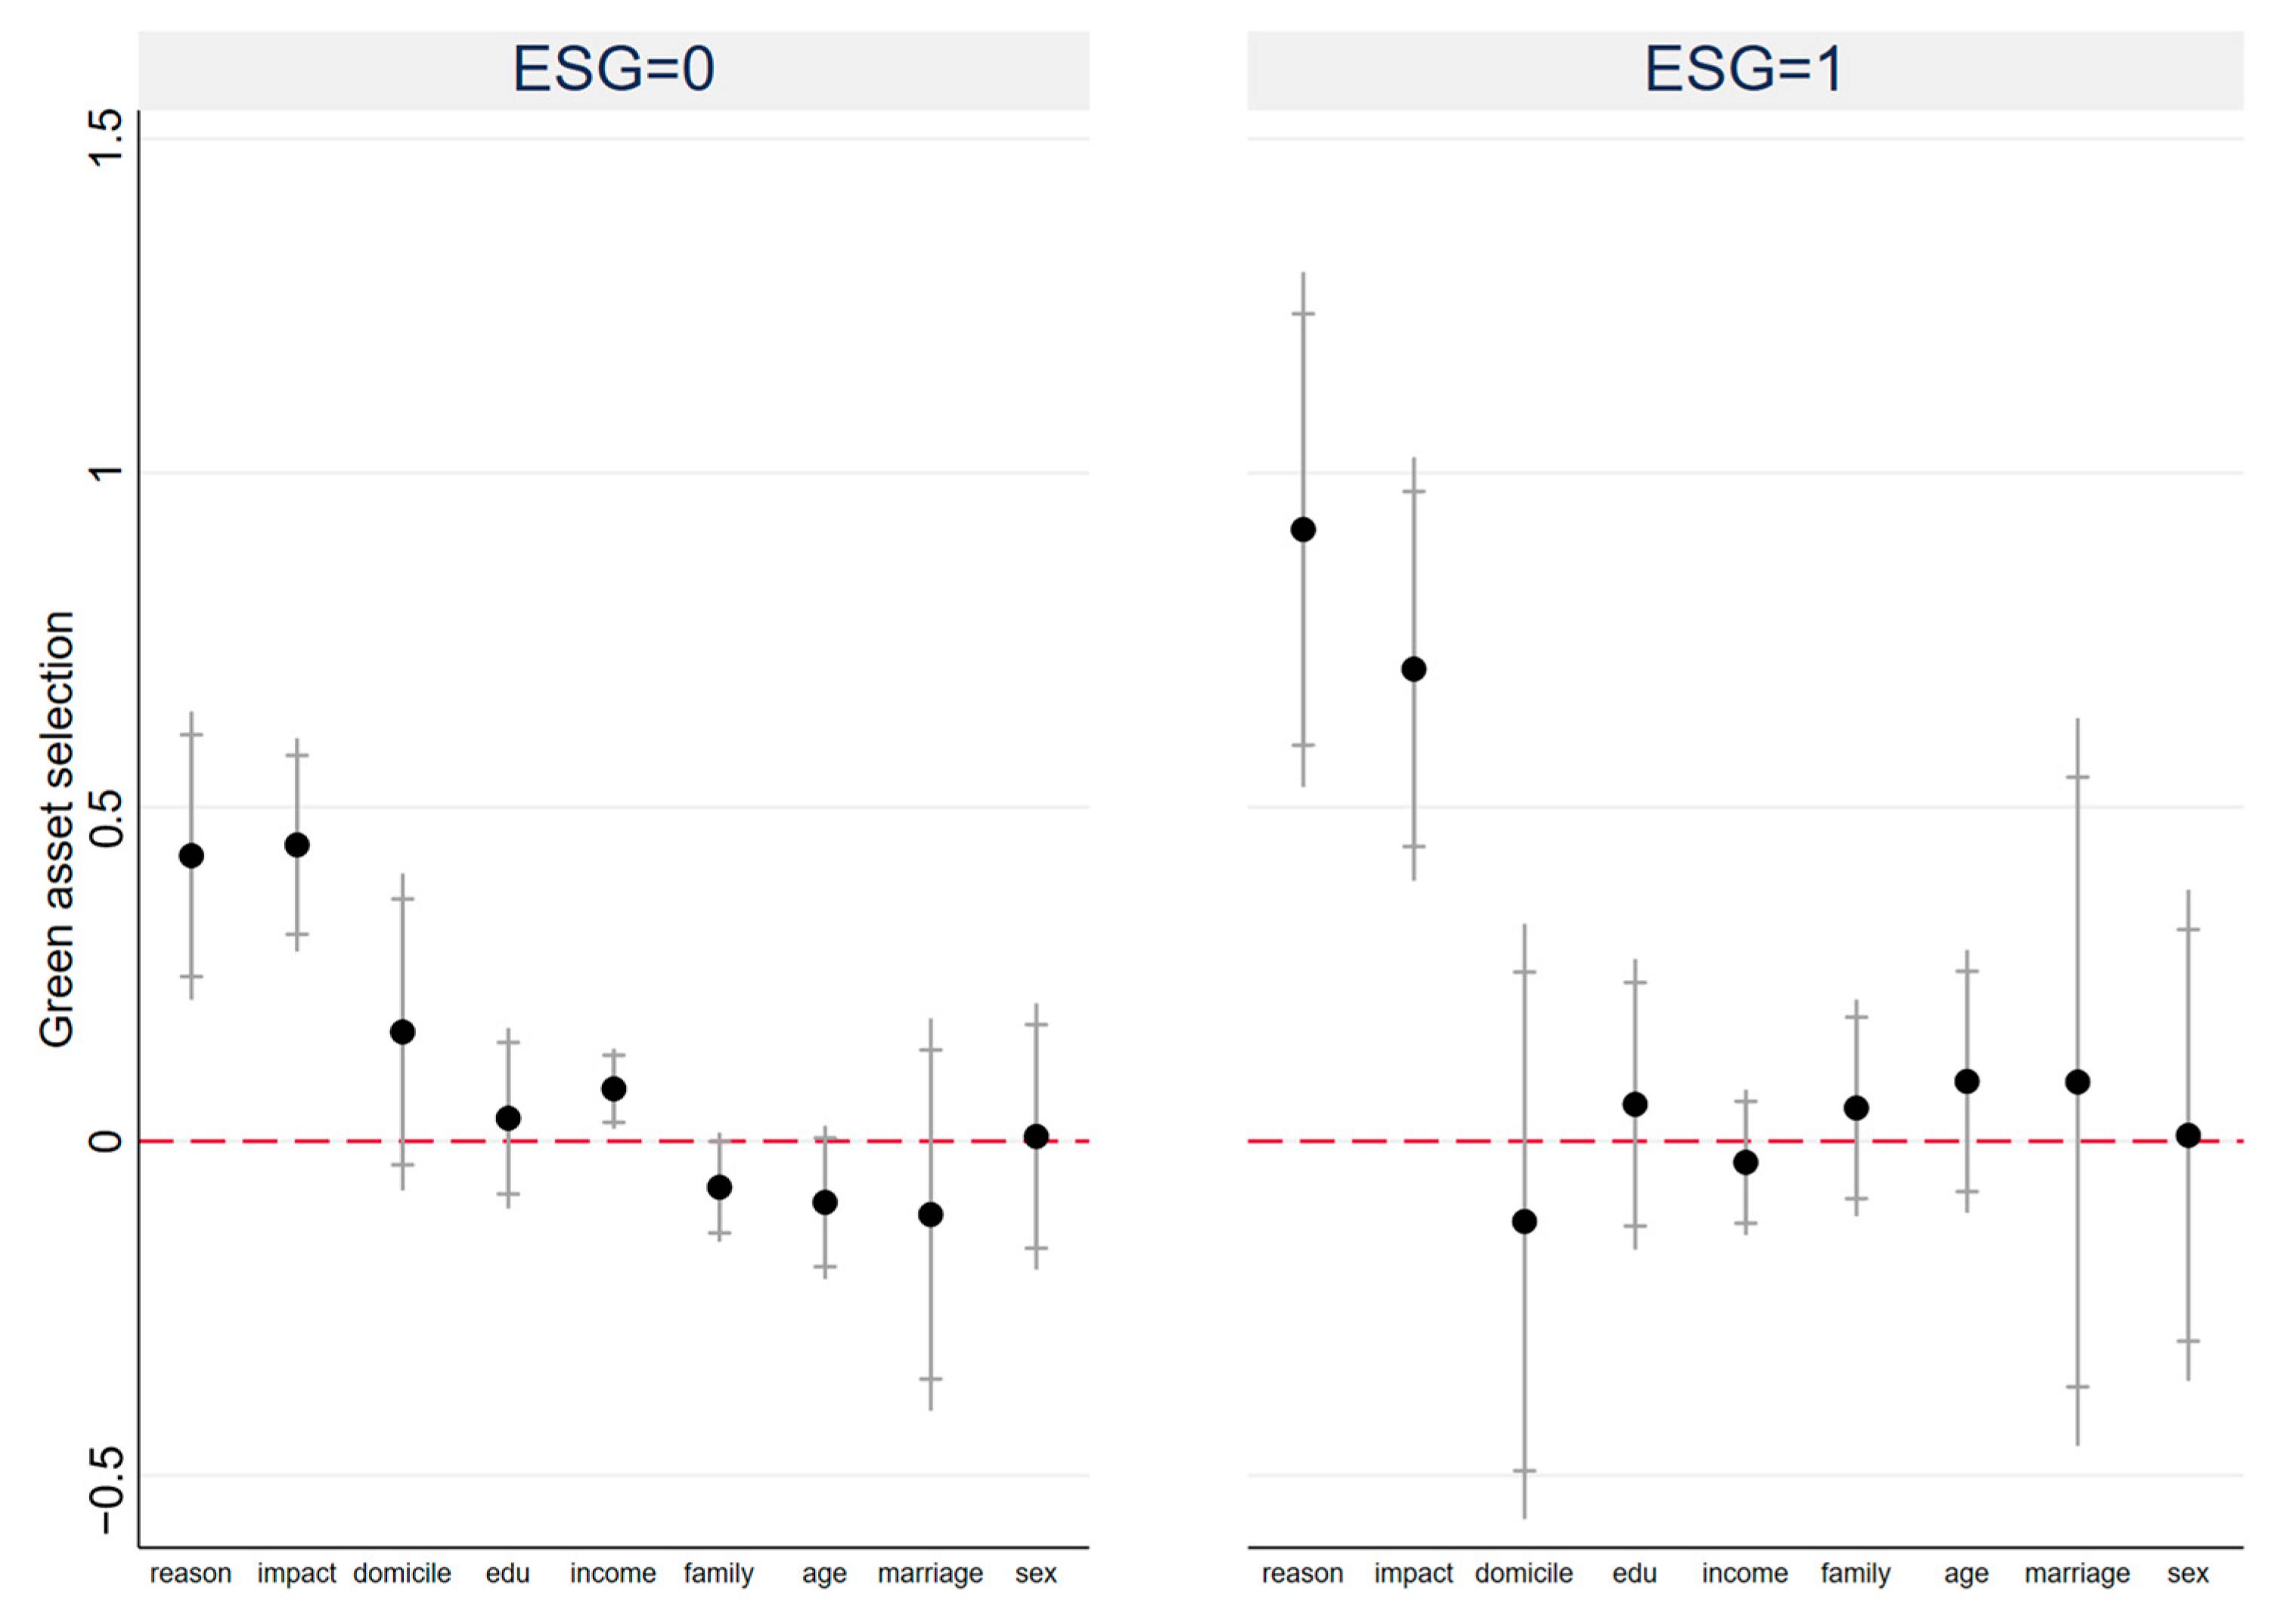
Table 14 shows that there is not much difference in the impact of climate change cognition on green asset selection among different gender groups. However, the effect of climate change cognition on males is significantly lower than that on females by 0.652, indicating that the promotion effect of cognition related to climate change on green asset selection is more pronounced in females, which is consistent with Cynthia Assaf et al.’s [68] conclusion. In addition, people who are “completely unaware of ESG” and those with “little understanding of ESG” are classified as the “not aware of ESG” group. “Slightly familiar” and “very familiar” are classified as the “ESG understanding” group. The results in columns (3) and (4) of Figure 5 and Table 14 indicate that residents who are not aware of ESG principles have a significantly lower impact of climate change perceptions on green asset selection compared with residents who are aware of ESG principles. This is because, in the process of understanding ESG principles, residents increase their awareness of and sense of responsibility for environmental protection, forming a concept of sustainable consumption. As a result, they pay more attention to the environmental impact of their asset choices in their daily lives. However, few residents are familiar with ESG principles, so it is necessary to increase its awareness and promote its adoption.
In addition, this article categorizes temperature into five classes based on climate reports and related documents published by meteorological departments and relevant agencies (0–10 °C is cold, 11–21 °C is warm, 22–30 °C is hot, 31–34 °C is extremely hot, 35–39 °C is bizarre hot), and a heterogeneity analysis is conducted.
As shown in Table 15, residents living in highly high-temperature environments significantly increase their selection of green assets due to their heightened perception of the causes of climate change. This may be attributed to the direct and frequent exposure of such residents to extreme weather events caused by climate change, such as prolonged heatwaves and droughts. These personal experiences profoundly reinforce their understanding of the reality and urgency of climate change. Furthermore, when residents recognize the strong link between climate change and human activities (e.g., fossil fuel combustion and deforestation), they are more inclined to examine and adjust their behaviors to reduce environmental impacts, thereby actively embracing a green lifestyle [70]. In addition, the sample distribution reveals a notable trend: the highest proportion of residents live in extremely high-temperature areas. This reflects the severity of rising temperatures in China and signals the increasing frequency of extreme weather events. In this context, promoting a green lifestyle to combat climate change has become an urgent social necessity.

5. Discussion

Green assets are essential for sustainable development and climate change mitigation [7]. Our study finds that residents’ perceptions of climate change positively impact their selection of green assets, consistent with Aijun Guo et al. [27] and Shivam Azad et al. [28]. Notably, this positive effect is more potent in Zhejiang Province than in the US, UK, and India [22,28,34]. This could be because Zhejiang’s high per capita disposable income allows residents to pursue environmental values through green consumption or investment after meeting basic needs. In contrast, Indian investors may face economic constraints that hinder the conversion of environmental awareness into payment actions. Additionally, collectivism in Chinese culture makes individuals more responsive to socially advocated green transition goals, while the link between environmental awareness and individual behavior is looser in individualistic Western cultures. To maximize this positive impact across different countries, location-specific policies are crucial. For instance, low-income countries could establish micro-green financial ecosystems through mobile payment networks, integrating climate action into basic survival needs (e.g., clean cookstove rentals that offset medical expenses). High-income countries, such as the US and the UK, could link green consumption points to carbon-trading markets, turning personal carbon reductions into inheritable digital assets. They could also incorporate climate contributions into social platforms to influence rankings and personal credit systems.
Additionally, the quantile regression analysis reveals that the bottom 25% of individuals, in terms of willingness to choose green assets, exhibit a response elasticity to climate change perception that is 1.9 times greater than that of the high-quantile group. This discrepancy may arise from differential risk exposure. Low-quantile groups (e.g., low-income, low-education residents), who are often directly exposed to climate risks (e.g., extreme droughts in agriculture-dependent areas), have survival security closely linked to climate change. When perceiving climate threats, the marginal utility of behavioral adjustment for these groups is significantly higher than for high-willingness groups with established green behavior inertia [70]. Furthermore, disparities in information acquisition costs exacerbate sensitivity differences [61]. Low-quantile groups, reliant on fragmented social media information, may experience a short-term increase in climate change awareness when sudden climate events trigger an algorithm-based information bombardment.
Ultimately, ecological values serve as a mediating factor in residents’ perceptions of climate change, influencing their decisions regarding green asset choices. When residents perceive climate change threats, their re-evaluation of ecosystems, triggered by environmental risk awareness, forms a deep-seated value orientation toward human–nature coexistence [27]. This ecological perspective enables individuals to view green consumption as a means of self-actualization, not just an economic decision. They can thus overcome short-term cost barriers to prioritize sustainable products and fulfill their environmental responsibilities. This finding has dual implications for policy optimization. Traditional, economically incentive-based intervention models, such as consumption subsidies, have limitations. While stimulating green consumption in the short term, this approach can lead to dependence on economic incentives, resulting in unsustainable behavior after the policy is implemented and potentially intensifying the conflict between economic interests and environmental goals. In contrast, a value-driven mechanism, by cultivating individuals’ endogenous environmental responsibility, enables them to maintain low-carbon behaviors without external incentives, holding greater strategic value for long-term governance. Therefore, policy design should incorporate value cultivation.

6. Conclusions

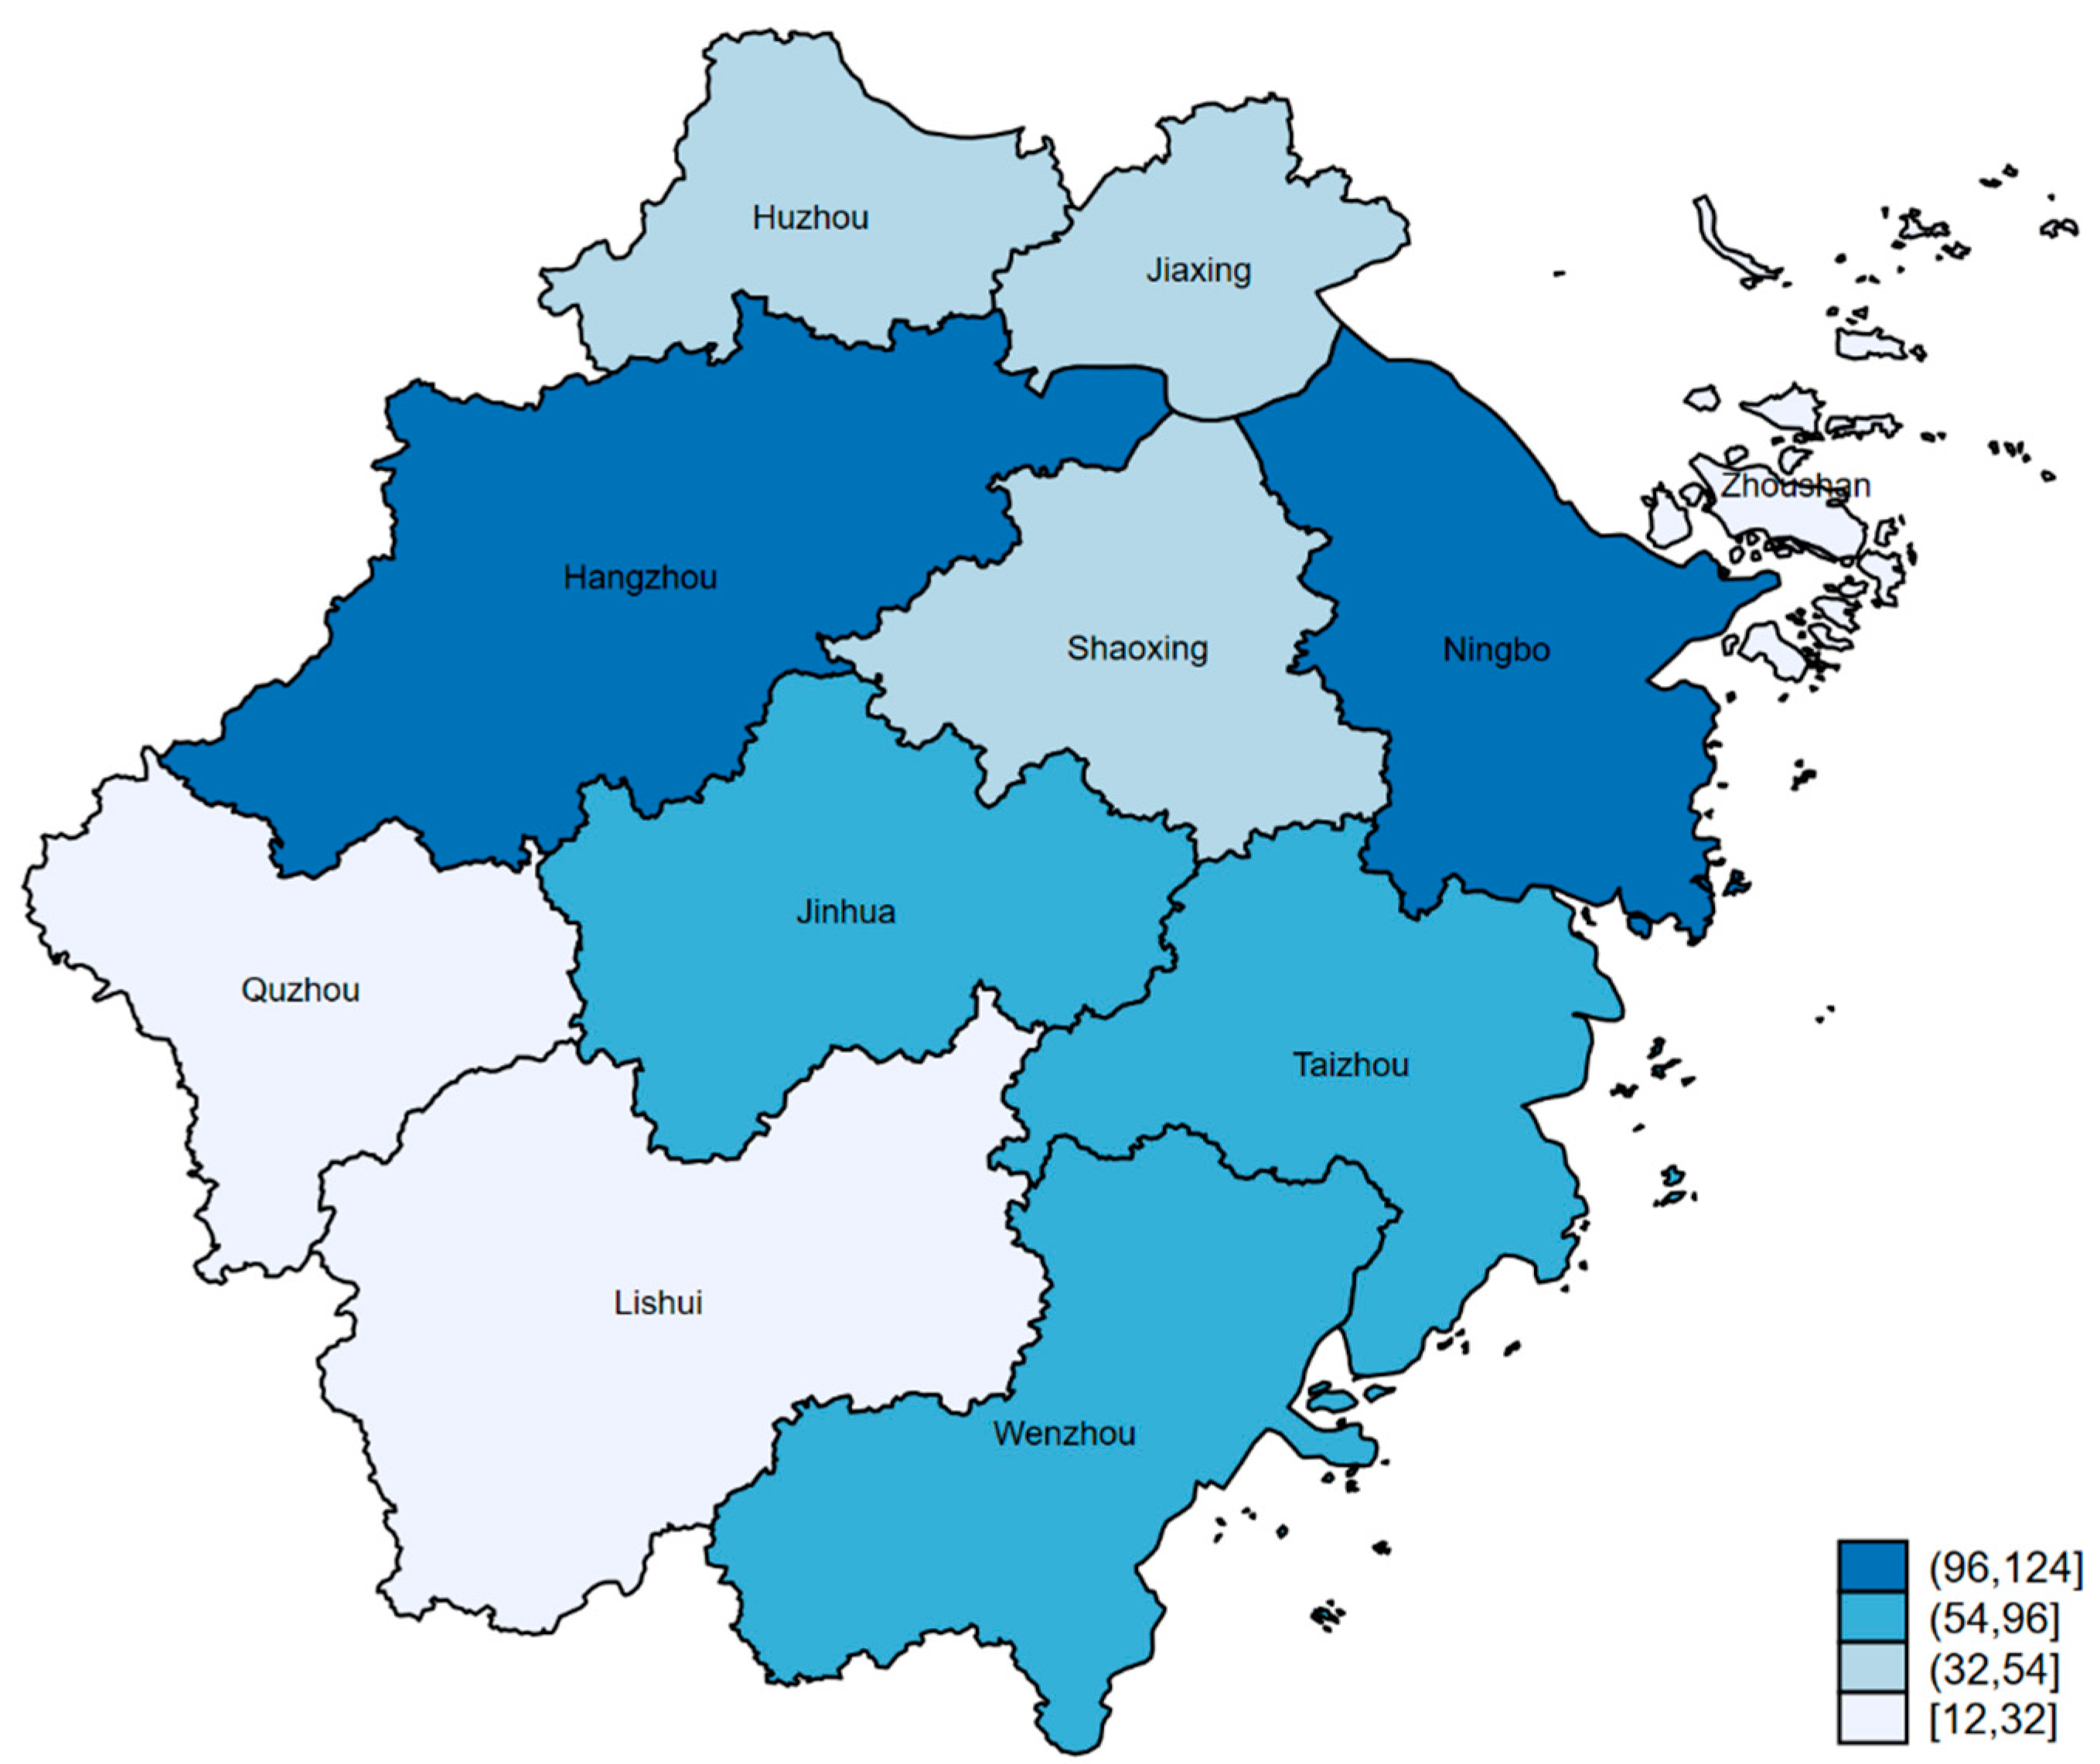
This paper utilized questionnaire data from a survey of residents in Zhejiang Province, conducted from January to August 2024. Building on a review of the relevant literature and theoretical foundations, we carried out an empirical analysis. The aim was to investigate the direct and indirect relationships between residents’ perceptions of climate change and their choices regarding green assets in Zhejiang Province, China.
Firstly, the higher the residents’ perception of climate change, the more likely they are to choose green assets. Therefore, to further strengthen residents’ choice of green assets, climate change education should be enhanced through media, the internet, and other channels. This can be achieved by using vivid visual presentations and diversified dissemination methods, such as VR technology simulations, to enhance residents’ understanding of climate change and popularize ESG-related knowledge. Simultaneously, a personal green behavior points system can be embedded in government service apps. This system would convert consumption data, such as the purchase of energy-saving appliances and the use of new energy vehicles, into carbon points that can be exchanged for public service discounts, allowing residents to experience the benefits of green consumption tangibly.
Secondly, the quantile regression analysis indicates that the lower-quantile group (those with green asset choice willingness at or below the 25th percentile) exhibits a significant marginal sensitivity to enhanced climate change perception, with a higher behavioral response elasticity compared to the middle- and high-quantile groups. This suggests that policymakers should abandon the broad-based approach and instead adopt a stratified policy-making approach. For the lower-quantile group, it is necessary to strengthen their realistic perception through high-frequency and low-threshold intervention means. For instance, binding electronic payment scenarios with climate impact data to display carbon emissions from consumption behaviors in real time and linking them to local extreme weather cases (such as the frequent super-high temperatures in Zhejiang in recent years) can transform abstract climate risks into concrete economic losses. Additionally, designing an immediate feedback mechanism for behavior benefits is an option, for example, issuing electronic consumption vouchers or carbon points to residents who purchase green financial products for the first time, with these points exchangeable for public transport discounts or priority in community public services. For the middle- and high-quantile groups, the focus should be on long-term institutional incentives. For example, consumers who consistently participate in green investments or hold environmentally friendly products for an extended period can be included on a green credit whitelist. Individuals can enjoy tax reduction policies for new energy vehicle purchases, and commercial banks can provide a green channel and interest rate discounts for their housing loan applications. Meanwhile, linking the sustainable consumption records of these groups to the acquisition of public service resources, such as establishing a green behavior points exchange mechanism in areas like public resource allocation and children’s education, can form a positive feedback loop across various fields.
Thirdly, ecological values mediate the impact of residents’ perceptions of climate change on their decisions regarding green assets. This intrinsic motivation drives more sustainable green behavior. Therefore, environmental education should be incorporated into the national education system, from kindergarten to university, to cultivate ecological awareness and responsibility through curricula and activities. For example, primary and secondary schools could offer nature experience courses and organize tree-planting and waste classification activities to instill the habit of respecting and protecting nature from a young age. Moreover, a green default option can be embedded in financial infrastructure. For instance, the default investment ratio for pension accounts could lean toward ESG funds, leveraging the default effect to encourage participation in environmentally responsible behaviors. A system for visualizing the ecological impact of individual choices in real time could also be designed on consumption pages, showing the potential contribution of these choices to ecosystem services. Supporting the generation of ecological behavior milestone badges that can be shared across platforms could utilize social network effects to create a positive feedback loop reinforcing values. At the social mobilization level, it is crucial to leverage peer effects. For example, in areas prone to extreme heat waves, families affected by climate disasters could be invited to serve as green-living ambassadors. They could share their transformation stories, from climate disaster victims to low-carbon activists, on short video platforms, triggering imitative behaviors through emotional resonance.
This study makes three key theoretical contributions. First, in Zhejiang Province, China, residents’ perception of climate change-related knowledge shows a stronger positive impact on green asset choice ( β r e a s o n = 0.571, β i m p a c t = 0.486) than in the USA ( β U S A = 0.419), the UK ( β U K = 0.2), and India ( β I n d i a = 0.022). This suggests that the influence of climate change perception on green asset choice has been underestimated in prior research. Our study confirms the importance of enhancing climate change awareness among Chinese residents and proposes differentiated policy recommendations that take into account the heterogeneity among various groups. Second, using quantile regression, we find that the behavioral malleability of low-quantile groups is significantly higher than expected. This highlights the potential of tail-driven policies and offers a new theoretical perspective on resource allocation. Third, the mediating effect of ecological values confirms the “cognition–values–behavior” chain transmission path, providing a theoretical basis for value-driven policies.
Future research can investigate the long-term effects of policy interventions and incorporate additional influential factors into the research framework. It can also focus on how the dynamic evolution of climate change cognition interacts with green financial innovation to shift green asset choices from self-interest to social norms.

Author Contributions

Conceptualization, X.Q.; methodology, Y.Y.; software, J.L.; validation, X.Q.; formal analysis, J.L.; investigation, J.L.; data curation, X.Q.; writing—original draft preparation, J.L.; writing—review and editing, Y.Y.; visualization, J.L.; supervision, J.L.; project administration, Y.Y.; funding acquisition, Y.Y. All authors have read and agreed to the published version of the manuscript.

Funding

This research was funded by the Science and Technology Innovation Activity Plan of College Students in Zhejiang Province (2024R406A050), the National Statistical Science Research Project (2024LY081), and the National College Students’ Innovative Entrepreneurial Training Program of China (202410338039).

Institutional Review Board Statement

The questionnaire of this survey has been thoroughly discussed in the early stage, and the ethics and moral department and responsible person of our school are also aware of the progress of this research. Everyone believes that this questionnaire and research do not involve ethical and moral issues. We confirm that this study does not need ethical approval.

Informed Consent Statement

Informed consent for participation was obtained from all subjects involved in the study.

Data Availability Statement

The data are available on request from the authors.

Acknowledgments

We greatly appreciate the help of Jia Zheng, Weitong Wang, Shulei Lin, and Haonan Lin of Zhejiang Sci-Tech University in collecting data.

Conflicts of Interest

The authors declare no conflicts of interest. The funders had no role in the design of the study; in the collection, analyses, or interpretation of data; in the writing of the manuscript; or in the decision to publish the results.

References

  1. Liu, X.; Zhang, L.; Hao, Y.; Yin, X.; Shi, Z. Increasing Disparities in the Embedded Carbon Emissions of Provincial Urban Households in China. J. Environ. Manag. 2022, 302, 113974. [Google Scholar] [CrossRef] [PubMed]
  2. Abbasi, K.R.; Zhang, Q.; Alotaibi, B.S.; Abuhussain, M.A.; Alvarado, R. Toward Sustainable Development Goals 7 and 13: A Comprehensive Policy Framework to Combat Climate Change. Environ. Impact Assess. Rev. 2024, 105, 107415. [Google Scholar] [CrossRef]
  3. Montzka, S.A.; Dlugokencky, E.J.; Butler, J.H. Non-CO2 Greenhouse Gases and Climate Change. Nature 2011, 476, 43–50. [Google Scholar] [CrossRef]
  4. Zang, X.; Feng, J.; Song, M. The Impact of Air Pollution on Household Vulnerability to Poverty: An Empirical Study from Household Data in China. Econ. Anal. Policy 2024, 82, 1369–1383. [Google Scholar] [CrossRef]
  5. Wang, T.; Shen, B.; Springer, C.H.; Hou, J. What Prevents Us from Taking Low-Carbon Actions? A Comprehensive Review of Influencing Factors Affecting Low-Carbon Behaviors. Energy Res. Soc. Sci. 2021, 71, 101844. [Google Scholar] [CrossRef]
  6. Deng, W.; Zhang, Z. Environmental Regulation Intensity, Green Finance, and Environmental Sustainability: Empirical Evidence from China Based on Spatial Metrology. Environ. Sci. Pollut. Res. 2023, 30, 66228–66253. [Google Scholar] [CrossRef]
  7. Cen, Y.; Yin, J. Navigating Climate Challenges: Focusing on the Effectiveness of Natural Resource Rents, Fintech, Green Finance, Environmental Quality, and Digitalisation. Resour. Policy 2024, 95, 105102. [Google Scholar] [CrossRef]
  8. Shen, M.; Ma, N.; Chen, Q. Has Green Finance Policy Promoted Ecologically Sustainable Development under the Constraints of Government Environmental Attention? J. Clean. Prod. 2024, 450, 141854. [Google Scholar] [CrossRef]
  9. Pham, S.D.; Nguyen, T.T.T.; Do, H.X. Impact of Climate Policy Uncertainty on Return Spillover among Green Assets and Portfolio Implications. Energy Econ. 2024, 134, 107631. [Google Scholar] [CrossRef]
  10. Pástor, Ľ.; Stambaugh, R.F.; Taylor, L.A. Dissecting Green Returns. J. Financ. Econ. 2022, 146, 403–424. [Google Scholar] [CrossRef]
  11. Jung, H.; Song, C.-K. Managerial Perspectives on Climate Change and Stock Price Crash Risk. Financ. Res. Lett. 2023, 51, 103410. [Google Scholar] [CrossRef]
  12. Zhao, D.; Wang, Y.; Fang, Y. Greenium and Public Climate Concerns: Evidence from China. Financ. Res. Lett. 2024, 69, 106091. [Google Scholar] [CrossRef]
  13. Chen, S.; Mao, Z.; Li, Y.; Kang, J. The Effect of China’s Public Climate Concern on ESG Disclosure. Financ. Res. Lett. 2024, 62, 105132. [Google Scholar] [CrossRef]
  14. Teng, M.; He, X. Air Quality Levels, Environmental Awareness and Investor Trading Behavior: Evidence from Stock Market in China. J. Clean. Prod. 2020, 244, 118663. [Google Scholar] [CrossRef]
  15. He, X.; Xu, Z.; Shi, J. Air Pollution Levels Enhance Green Bond Investment: Green Preference and Environmental Perception Thresholds. J. Environ. Plan. Manag. 2024, 1–23. [Google Scholar] [CrossRef]
  16. He, X.; Xie, Z. The Impact of Air Pollution on Green Investments: Green Preference and Investor Sentiment. J. Environ. Manag. 2024, 366, 121824. [Google Scholar] [CrossRef]
  17. Song, Y.; Ji, Q.; Du, Y.-J.; Geng, J.-B. The Dynamic Dependence of Fossil Energy, Investor Sentiment and Renew. Energy Stock Markets. Energy Econ. 2019, 84, 104564. [Google Scholar] [CrossRef]
  18. Pham, L.; Cepni, O. Extreme Directional Spillovers between Investor Attention and Green Bond Markets. Int. Rev. Econ. Financ. 2022, 80, 186–210. [Google Scholar] [CrossRef]
  19. Wu, R.; Liu, B.-Y. Do Climate Policy Uncertainty and Investor Sentiment Drive the Dynamic Spillovers among Green Finance Markets? J. Environ. Manag. 2023, 347, 119008. [Google Scholar] [CrossRef]
  20. Adam, A.A.; Shauki, E.R. Socially Responsible Investment in Malaysia: Behavioral Framework in Evaluating Investors’ Decision Making Process. J. Clean. Prod. 2014, 80, 224–240. [Google Scholar] [CrossRef]
  21. Raut, R.K.; Kumar, R.; Das, N. Individual Investors’ Intention towards SRI in India: An Implementation of the Theory of Reasoned Action. SRJ 2021, 17, 877–896. [Google Scholar] [CrossRef]
  22. Sangiorgi, I.; Schopohl, L. Why Do Institutional Investors Buy Green Bonds: Evidence from a Survey of European Asset Managers. Int. Rev. Financ. Anal. 2021, 75, 101738. [Google Scholar] [CrossRef]
  23. Mishra, A.K.; Bansal, R.; Maurya, P.K. Investing for a Better Tomorrow: Values-Driven Antecedents of Investment in Socially Responsible Equity Funds by Indian Retail Investors. J. Clean. Prod. 2023, 420, 138441. [Google Scholar] [CrossRef]
  24. Pham, L.; Luu Duc Huynh, T. How Does Investor Attention Influence the Green Bond Market? Financ. Res. Lett. 2020, 35, 101533. [Google Scholar] [CrossRef]
  25. Garg, A.; Goel, P.; Sharma, A.; Rana, N.P. As You Sow, so Shall You Reap: Assessing Drivers of Socially Responsible Investment Attitude and Intention. Technol. Forecast. Soc. Chang. 2022, 184, 122030. [Google Scholar] [CrossRef]
  26. Mehrabian, A.; Russell, J.A. An Approach to Environmental Psychology; MIT Press: Cambridge, MA, USA, 1974. [Google Scholar]
  27. Guo, A.; Wei, Y.; Zhong, F.; Wang, P. How Do Climate Change Perception and Value Cognition Affect Farmers’ Sustainable Livelihood Capacity? An Analysis Based on an Improved DFID Sustainable Livelihood Framework. Sustain. Prod. Consum. 2022, 33, 636–650. [Google Scholar] [CrossRef]
  28. Azad, S.; Tulasi Devi, S.L.; Mishra, A.K. Investing in Our Planet: Examining Retail Investors’ Preference for Green Bond Investment. Bus. Strategy Environ. 2024, 33, 5151–5173. [Google Scholar] [CrossRef]
  29. Kaenzig, J.; Wüstenhagen, R. The Effect of Life Cycle Cost Information on Consumer Investment Decisions Regarding Eco-Innovation. J. Ind. Ecol. 2010, 14, 121–136. [Google Scholar] [CrossRef]
  30. Petrovich, B.; Carattini, S.; Wüstenhagen, R. The Price of Risk in Residential Solar Investments. Ecol. Econ. 2021, 180, 106856. [Google Scholar] [CrossRef]
  31. Dutta, A.; Bouri, E.; Rothovius, T.; Uddin, G.S. Climate Risk and Green Investments: New Evidence. Energy 2023, 265, 126376. [Google Scholar] [CrossRef]
  32. Deci, E.L.; Ryan, R.M. The General Causality Orientations Scale: Self-Determination in Personality. J. Res. Personal. 1985, 19, 109–134. [Google Scholar] [CrossRef]
  33. Steg, L. Can public transport compete with the private car? IATSS Res. 2003, 27, 27–35. [Google Scholar] [CrossRef]
  34. Chen, M.-H.; Chen, B.H.; Chi, C.G. Socially Responsible Investment by Generation Z: A Cross-Cultural Study of Taiwanese and American Investors. J. Hosp. Mark. Manag. 2019, 28, 334–350. [Google Scholar] [CrossRef]
  35. Aliano, M.; Galloppo, G.; Paimanova, V. People and Investor Attention to Climate Change. Eur. J. Financ. 2023, 29, 2107–2127. [Google Scholar] [CrossRef]
  36. Ahmed, W.M.A. Attention to Climate Change and Eco-Friendly Financial-Asset Prices: A Quantile ARDL Approach. Energy Econ. 2024, 136, 107696. [Google Scholar] [CrossRef]
  37. Madaleno, M.; Dogan, E.; Taskin, D. A Step Forward on Sustainability: The Nexus of Environmental Responsibility, Green Technology, Clean Energy and Green Finance. Energy Econ. 2022, 109, 105945. [Google Scholar] [CrossRef]
  38. Rahmani, A.; Mashayekh, J.; Aboojafari, R.; Bonyadi Naeini, A. Determinants of Households’ Intention for Investment in Renew. Energy Projects. Renew. Energy 2023, 205, 823–837. [Google Scholar] [CrossRef]
  39. Ajzen, I. The Theory of Planned Behavior. Organ. Behav. Hum. Decis. Process. 1991, 50, 179–211. [Google Scholar] [CrossRef]
  40. Yang, Y.; Yang, B.; Xin, Z. Green Finance Development, Environmental Attention and Investment in Hydroelectric Power: From the Perspective of Environmental Protection Law. Financ. Res. Lett. 2024, 69, 106167. [Google Scholar] [CrossRef]
  41. Liu, H.; Zhang, W.; Zhang, X.; Li, D. Abnormal Temperature and Retail Investors’ Trading Behavior. Financ. Res. Lett. 2023, 55, 103944. [Google Scholar] [CrossRef]
  42. Wang, C.; Geng, L.; Rodríguez-Casallas, J.D. How and When Higher Climate Change Risk Perception Promotes Less Climate Change Inaction. J. Clean. Prod. 2021, 321, 128952. [Google Scholar] [CrossRef]
  43. Filippini, M.; Leippold, M.; Wekhof, T. Sustainable Finance Literacy and the Determinants of Sustainable Investing. J. Bank. Financ. 2024, 163, 107167. [Google Scholar] [CrossRef]
  44. He, R.; Jin, J.; Qiu, X.; Zhang, C.; Yan, J. Rural Residents’ Climate Change Perceptions, Personal Experiences, and Purchase Intention–Behavior Gap in Energy-Saving Refrigeration Appliances in Southwest China. Environ. Impact Assess. Rev. 2023, 98, 106967. [Google Scholar] [CrossRef]
  45. Guo, S.; Chen, L. Why Is China Struggling with Waste Classification? A Stakeholder Theory Perspective. Resour. Conserv. Recycl. 2022, 183, 106312. [Google Scholar] [CrossRef]
  46. Herrmann, C.; Rhein, S.; Sträter, K.F. Consumers’ Sustainability-Related Perception of and Willingness-to-Pay for Food Packaging Alternatives. Resour. Conserv. Recycl. 2022, 181, 106219. [Google Scholar] [CrossRef]
  47. Qiu, X.; Jin, J.; He, R.; Mao, J. The Deviation between the Willingness and Behavior of Farmers to Adopt Electricity-Saving Tricycles and Its Influencing Factors in Dazu District of China. Energy Policy 2022, 167, 113069. [Google Scholar] [CrossRef]
  48. van der Linden, S. The Social-Psychological Determinants of Climate Change Risk Perceptions: Towards a Comprehensive Model. J. Environ. Psychol. 2015, 41, 112–124. [Google Scholar] [CrossRef]
  49. Mach, K.J.; Siders, A.R. Reframing Strategic, Managed Retreat for Transformative Climate Adaptation. Science 2021, 372, 1294–1299. [Google Scholar] [CrossRef]
  50. Roos, J.M.; Jansson, M.; Gärling, T. A Three-Level Analysis of Values Related to Socially Responsible Retirement Investments. J. Sustain. Financ. Investig. 2024, 14, 327–343. [Google Scholar] [CrossRef]
  51. Rahman, I.; Reynolds, D. Predicting Green Hotel Behavioral Intentions Using a Theory of Environmental Commitment and Sacrifice for the Environment. Int. J. Hosp. Manag. 2016, 52, 107–116. [Google Scholar] [CrossRef]
  52. Haws, K.L.; Winterich, K.P.; Naylor, R.W. Seeing the World through GREEN-Tinted Glasses: Green Consumption Values and Responses to Environmentally Friendly Products. J. Consum. Psychol. 2014, 24, 336–354. [Google Scholar] [CrossRef]
  53. Song, Y.; Zhang, L.; Zhang, M. Research on the Impact of Public Climate Policy Cognition on Low-Carbon Travel Based on SOR Theory—Evidence from China. Energy 2022, 261, 125192. [Google Scholar] [CrossRef]
  54. Tolppanen, S.; Kang, J. The Effect of Values on Carbon Footprint and Attitudes towards Pro-Environmental Behavior. J. Clean. Prod. 2021, 282, 124524. [Google Scholar] [CrossRef]
  55. Yang, Y.; Guo, Y.; Luo, S. Consumers’ Intention and Cognition for Low-Carbon Behavior: A Case Study of Hangzhou in China. Energies 2020, 13, 5830. [Google Scholar] [CrossRef]
  56. Steg, L.; Bolderdijk, J.W.; Keizer, K.; Perlaviciute, G. An Integrated Framework for Encouraging Pro-Environmental Behaviour: The Role of Values, Situational Factors and Goals. J. Environ. Psychol. 2014, 38, 104–115. [Google Scholar] [CrossRef]
  57. Liu, L.; Tobias, G.R. The Impact of Environmental Literacy on Residents’ Green consumption: Experimental Evidence from China. Clean. Responsible Consum. 2024, 12, 100165. [Google Scholar] [CrossRef]
  58. Ante, L. The Scope of Green Finance Research: Research Streams, Influential Works and Future Research Paths. Ecol. Econ. 2024, 224, 108302. [Google Scholar] [CrossRef]
  59. Tian, J.; Sun, M.; Gong, Y.; Chen, X.; Sun, Y. Chinese Residents’ Attitudes toward Consumption-Side Climate Policy: The Role of Climate Change Perception and Environmental Topic Involvement. Resour. Conserv. Recycl. 2022, 182, 106294. [Google Scholar] [CrossRef]
  60. Tvinnereim, E.; Fløttum, K. Explaining Topic Prevalence in Answers to Open-Ended Survey Questions about Climate Change. Nat. Clim. Chang. 2015, 5, 744–747. [Google Scholar] [CrossRef]
  61. Ma, A.T.H.; Wong, G.K.L.; Cheung, L.T.O.; Lo, A.Y.; Jim, C.Y. Climate Change Perception and Adaptation of Residents in Hong Kong. J. Clean. Prod. 2021, 288, 125123. [Google Scholar] [CrossRef]
  62. Lee, C.-C.; Chen, P.-F.; Chu, P.-J. Green Recovery through Financial Inclusion of Mobile Payment: A Study of Low- and Middle-Income Asian Countries. Econ. Anal. Policy 2023, 77, 729–747. [Google Scholar] [CrossRef]
  63. Steel, M.F.J. Model Averaging and Its Use in Economics. J. Econ. Lit. 2020, 58, 644–719. [Google Scholar] [CrossRef]
  64. Dunz, N.; Naqvi, A.; Monasterolo, I. Climate Sentiments, Transition Risk, and Financial Stability in a Stock-Flow Consistent Model. J. Financ. Stab. 2021, 54, 100872. [Google Scholar] [CrossRef]
  65. Bai, Y.; Liu, Y. An Exploration of Residents’ Low-Carbon Awareness and Behavior in Tianjin, China. Energy Policy 2013, 61, 1261–1270. [Google Scholar] [CrossRef]
  66. Liao, L.; Xiao, J.J.; Zhang, W.; Zhou, C. Financial Literacy and Risky Asset Holdings: Evidence from China. Account. Financ. 2017, 57, 1383–1415. [Google Scholar] [CrossRef]
  67. Zhu, T.; Xiao, J.J. Consumer Financial Education and Risky Financial Asset Holding in China. Int. J. Consum. Stud. 2022, 46, 56–74. [Google Scholar] [CrossRef]
  68. Assaf, C.; Monne, J.; Harriet, L.; Meunier, L. ESG Investing: Does One Score Fit All Investors’ Preferences? J. Clean. Prod. 2024, 443, 141094. [Google Scholar] [CrossRef]
  69. Liu, M.; Xia, C.; Lan, H.; Gao, Z.; Yu, X.; Wang, L.; Liang, X.; Wu, Y. Driving toward Sustainable Cities: The Interplay between Chinese Emerging Corporate ESG Performance and Climate Finance in Achieving Low-Carbon Development. Urban Clim. 2024, 55, 101918. [Google Scholar] [CrossRef]
  70. Gao, X.; Wang, C.; Sun, M.; Wang, X. Research on the Driving Factors of Rural Residents’ pro-Environmental Behavior under the Background of Frequent Heat Waves. Glob. Ecol. Conserv. 2024, 51, e02893. [Google Scholar] [CrossRef]
Figure 1. Theoretical framework diagram.
Sustainability 17 03263 g001
Figure 2. Actual number of available questionnaires in various prefecture-level cities in Zhejiang Province.
Sustainability 17 03263 g002
Figure 3. (a) Purchase of green assets by residents. (b) Green asset selection under interaction of education and income levels.
Sustainability 17 03263 g003
Figure 4. Quantile regression plot. Note: ① The thick black dotted line in the figure represents the OLS regression estimate of each variable, and the region between the two thin dotted lines represents the confidence interval of the OLS regression estimate (confidence level 0.95); The solid green lines are quantile regression estimates for each variable; The shaded part is the confidence interval for the quantile regression estimate (confidence 0.95). ② In the figure, the horizontal axis represents the different points of green asset selection, and the vertical axis represents the regression coefficient of each variable.
Sustainability 17 03263 g004
Figure 5. Heterogeneity analysis of ESG grouping.
Sustainability 17 03263 g005
Table 1. Determinants and relationships of green behavior or intention in previous studies.
Author(s)DistrictDeterminantsRelationship
Adam et al., 2014 [20] Malaysia Attitude +0.38
Intention +0.56
Subjective norm +0.28
Moral norms +0.24
Perceived behavioral control No significant effect
Chen et al., 2019 [34] United States and Taiwan Pro-social attitudes +0.419
Raut et al., 2021 [21] Indian Attitude +0.42
Subjective norm +0.43
Moral norms +0.33
Financial performance +0.52
Environmental concern No significant effect
Sangiorgi et al., 2021 [22] UK Green credentials post issuance +0.2
Pricing +0.31
Guo et al., 2022 [27] China Climate change perception +0.168
Ecological value +0.284
Garg et al., 2022 [25]Indian Biospheric values +0.193
Attitude +0.137
Collectivism +0.302
Mishra et al., 2023 [23]Indian Religiosity +0.453
Perceived behavioral control +0.186
Azad et al., 2024 [28]Indian Perceived risk −0.021
Environmental concern +0.022
Table 2. Sample results.
Prefectural-Level Cities in Zhejiang ProvinceExtract the Number of County-Level Administrative Regions (Phase I)Extract the Number of Streets and Towns (Phase II)Extract the Number of Individual Residents (Phase III)
Hangzhou34114
Ningbo2290
Jinhua2266
Quzhou2221
Zhoushan1111
Wenzhou3390
Jiaxing2252
Taizhou2262
Huzhou1132
Lishui1123
Shaoxing2250
Total2122611
Table 3. Scale validation and multicollinearity assessment.
VariableVIF1/VIF
age2.530.394623
marriage2.270.439847
edu1.210.823898
sex1.070.936909
reason1.090.921065
impact1.070.934550
family1.050.948460
income1.050.950347
domicile1.020.977533
Mean VIF1.37
Cronbach’s alpha0.796
KMO0.760
BartlettApproximate chi-square1868.254
Df28
p-value0.000
Table 4. General descriptive statistics.
ProjectIndexSample QuantitySample PercentageActual Percentage
sexMale36755.95%50.1%
Female28944.05%49.9%
marriageMarried39159.6%75.4%
Unmarried26540.4%17.9%
age16–2018528.2%66.3%
21–3021432.62%
31–4011717.84%
41–507210.98%
51–60477.16%
60 or above213.20%24.7%
incomeBelow 50,000 497.47%/
50,000 to 100,0009915.09%
100,000 to 200,000 15623.78%
200,000 to 300,00017126.07%
300,000 to 400,000659.91%
400,000 to 500,000558.38%
Over 500,000 619.30%
eduElementary school and below71.07%27.1%
Middle school507.62%33.5%
High school/vocational school/technical school15924.24%23.6%
Undergraduate36755.95%40.8%
Master degree or above7311.13%11.3%
domicileResident51778.81%73.4%
Farmer13921.19%27.6%
family1–327541.92%82.4%
4–636655.79%17.0%
7–10152.27%1.65%
occupationPublic officials of national institutions527.93%1.24%
Public officials in public institutions659.91%3.51%
Professional technicians (such as doctors, teachers)568.54%2.7%
Enterprise leaders or employees (or individual business owners)9814.94%16.14%
Freelancers (such as writers, photographers)456.86%/
On campus students27942.53%52.3%
Other619.30%/
Note: Sample percentage data are the percentage of the number of samples of the indicator in the project. The percentage data were calculated and collated from the Zhejiang Provincial Bureau of Statistics, the National Bureau of Statistics, and the seventh population census.
Table 5. Explanation of questionnaire variables.
CategoryVariable NameA Brief Explanation of the ProblemScale Reference
Dependent variableGreen assetsYou will frequently purchase green financial products supported by environmental protection policies in the financial sector.Adam et al., 2014 [20]; Mishra et al., 2023 [23]
There are more green finance products and services that you will consider investing in.
You use electronic payments more often than cash.
Independent variableCauses of climate change (reason)Is climate change caused by human activities.Tvinnereim et al., 2015 [60]; Tian et al., 2022 [59]
Climate change impacts cognition
(impact)
Our use of coal, oil, or natural gas can affect climate change.
Climate change will affect people’s sense of happiness.
Drought caused by climate change will have an impact on food supply.
Climate change has a harmful impact on China’s future economic development.
ControlssexMale = 1; Female = 0Raut et al., 2021 [21]; Garg et al., 2022 [25]; Mishra et al., 2023 [23]
marriageMarried = 1; Unmarried = 0
age1 = 16–20; 2 = 21–30; 3 = 31–40; 4 = 41–50; 5 = 51–60; 6 = 60 or above
edu1 = Primary school and below; 2 = Junior high school; 3 = High school/vocational school/technical school; 4 = Bachelor’s degree; 5 = Master’s degree or above
income1 = less than CYN 50,000, 2 = CYN 50,000–100,000, 3 = CYN 100,000 to 200,000, 4 = CYN 200,000–300,000, 5 = CYN 300,000 to 400,000, 6 = CYN 400,000–500,000, and 7 = Over CYN 500,000
familyNumber of family members
domicileCity = 1; Rural = 0
Table 6. Descriptive statistical analysis.
VariableObsMeanSDMinMedianMax
green assets6564.6131.1931.0004.6677.000
reason6560.6800.4670.0001.0001.000
impact6564.1010.6111.6674.0005.000
domicile6560.7880.4090.0001.0001.000
sex6560.5590.4970.0001.0001.000
marriage6560.5960.4910.0001.0001.000
edu6563.6840.8101.0004.0005.000
income6563.7821.6561.0004.0007.000
family6563.9131.1861.0004.00010.000
age6562.4591.3601.0002.0006.000
Table 7. Benchmark results.
(1)(2)(3)(4)(5)
VariablesRobustRobustBootstrapCluster1Cluster2
reason0.593 ***0.571 ***0.571 ***0.571 ***0.571 ***
(0.107)(0.107)(0.104)(0.0734)(0.116)
impact0.478 ***0.486 ***0.486 ***0.486 ***0.486 ***
(0.0778)(0.0766)(0.0781)(0.121)(0.128)
ControlNOYESYESYESYES
Constant2.248 ***1.879 ***1.879 ***1.879 **1.879 **
(0.317)(0.473)(0.484)(0.673)(0.691)
Observations656656656656656
R-squared0.1420.1560.1560.1560.156
Note: Columns (1) and (2) report robust standard errors in the parentheses, column (3) reports bootstrap standard errors in the parentheses, and columns (4) and (5) report cluster robust standard errors in the parentheses. *** and ** mean passing the significance test at 1% and 5%, respectively.
Table 8. Regression analysis of different green asset selection behaviors.
VariablesOlogitOprobit
(1)(2)(3)(4)(5)(6)
ProductInvestPaymentProductInvestPayment
reason0.589 ***0.608 ***0.682 ***0.339 ***0.336 ***0.450 ***
(0.165)(0.176)(0.172)(0.0931)(0.0973)(0.100)
impact0.460 ***0.455 ***0.841 ***0.261 ***0.252 ***0.476 ***
(0.125)(0.136)(0.154)(0.0730)(0.0774)(0.0841)
ControlYESYESYESYESYESYES
Observations656656656656656656
Pseudo R20.02070.01930.05660.02040.01860.0594
Wald43.42 ***39.86 ***84.21 ***42.77 ***37.9 ***98.75 ***
Note: Robust standard errors are in parentheses. *** means passing the significance test at 1%.
Table 9. Quantile regression of green asset selection.
Variables(1)(2)(3)(4)
q25q50q75q90
reason0.524 ***0.1520.276 **0.200
(0.195)(0.175)(0.115)(0.189)
impact0.286 **0.545 ***0.476 ***0.392 ***
(0.133)(0.114)(0.0828)(0.108)
domicile0.1430.1820.212 *0.259
(0.188)(0.163)(0.115)(0.174)
sex−0.0476−0.0303−0.00535−0.171
(0.174)(0.138)(0.102)(0.129)
marriage0.2620.1820.0677−0.371
(0.205)(0.212)(0.125)(0.228)
edu0.09520.0303−0.01960.0992
(0.0904)(0.0978)(0.0643)(0.0951)
income0.07140.03030.0570 **0.0232
(0.0457)(0.0420)(0.0276)(0.0383)
family0.0238−0.0303−0.0642−0.0338
(0.0578)(0.0588)(0.0393)(0.0487)
age−1.53 × 10−70.03030.0232−0.0316
(0.0849)(0.0942)(0.0503)(0.0700)
Constant1.357 *2.000 ***3.130 ***4.065 ***
(0.779)(0.764)(0.533)(0.616)
Observations656656656656
Note: ① The estimated value is obtained through 1000 iterations of the bootstrap method. ② Robust standard errors are in parentheses. ***, **, and * represent significance at the 1%, 5%, and 10% levels, respectively.
Table 10. Estimation results of Method IV.
VariablesFirst Stage
Impact
Second Stage
Green Assets
impact 1.072 ***
(0.3680)
reason0.2925 ***0.3760 **
(0.0531)(0.1543)
gov0.0698 ***
(0.0144)
disaster0.1326 ***
(0.0448)
ControlYESYES
Observations656656
F test of excluded instruments15.595
Kleibergen–Paap rk LM statistic 25.675
p-value (0.0000)
Kleibergen–Paap rk Wald F statistic 15.595
Hansen J statistic 1.423
p-value (0.2329)
Note: Robust standard errors are in parentheses. *** and ** mean passing the significance test at 1% and 5%, respectively.
Table 11. Estimation results of model average.
Variables(1)(2)(3)(4)(5)
AICBICAICCNOICAge < 60
reason0.579 ***0.588 ***0.579 ***0.579 ***0.553 ***
(6.03)(6.14)(6.03)(6.02)(0.107)
impact0.482 ***0.480 ***0.482 ***0.482 ***0.504 ***
(6.62)(6.57)(6.62)(6.60)(0.0762)
Constant1.939 ***2.118 ***1.940 ***2.014 ***1.758 ***
(5.00)(6.19)(5.01)(4.83)(0.474)
ControlYESYESYESYESYES
Observations656656656656635
R-squared0.0640.0640.0640.0640.160
Note: The t statistic in columns (1) to (4) is reported in parentheses. The robust standard error in column (5) is reported in parentheses. *** means passing the significance test at 1%.
Table 12. Estimated results of logit and probit regression.
VariablesLogitProbit
(1)(2)Marginal Effect(3)(4)Marginal Effect
RobustRobustRobustRobust
reason0.798 ***0.757 ***0.153 ***0.493 ***0.462 ***0.155 ***
(0.179)(0.191)(0.111)(0.115)
impact0.575 ***0.622 ***0.126 ***0.349 ***0.376 ***0.126 ***
(0.148)(0.156)(0.0888)(0.0914)
Constant−2.331 ***−4.174 *** −1.414 ***−2.534 ***
(0.597)(0.950) (0.357)(0.566)
ControlNOYES NOYES
Observations656656 656656
Note: Robust standard errors are in parentheses. *** means passing the significance test at 1%.
Table 13. Mediating effects of values.
Variables(1)(2)(3)(4)
Green AssetsValueGreen AssetsGreen Assets
reason0.571 ***0.1450.676 ***0.544 ***
(0.0963)(0.109)(0.0939)(0.0943)
impact0.486 ***0.347 *** 0.422 ***
(0.0730)(0.0825) (0.0724)
value 0.217 ***0.184 ***
(0.0345)(0.0341)
Direct effect0.2204 ***
Indirect effect0.0793 ***
Constant1.879 ***2.152 ***2.989 ***1.482 ***
(0.466)(0.527)(0.393)(0.462)
ControlYESYESYESYES
Observations656656656656
R-squared0.1560.0610.1500.192
Note: ① The direct and indirect effects were obtained through 1000 iterations of the bootstrap method. ② Standard errors are in parentheses. *** means passing the significance test at 1%.
Table 14. Gender heterogeneity analysis.
Variables(1)(2)(3)(4)
MaleFemaleESG = 1ESG = 0
reason0.245 **0.897 ***0.915 ***0.427 **
(2.00)(5.88)(4.69)(3.89)
impact0.515 ***0.474 **0.707 ***0.443 **
(5.43)(4.24)(4.40)(5.46)
ControlYESYESYesYes
Observations367289167489
difference between groups (reason)−0.652 ***0.488 **
difference between groups (impact)0.0420.263 **
R-squared0.0700.1140.2330.122
Note: The t statistic is reported in parentheses. *** and ** mean passing the significance test at 1% and 5%, respectively.
Table 15. Temperature heterogeneity.
Variables(1)(2)(3)(4)(5)
0–10 °C11–21 °C22–30 °C31–34 °C35–39 °C
reason0.508 **0.457 *0.2690.03630.904 ***
(0.237)(0.246)(0.326)(0.266)(0.152)
impact0.514 ***0.467 **0.555 **0.406 *0.557 ***
(0.163)(0.183)(0.217)(0.204)(0.118)
domicile0.3280.160−0.552 *0.731 **0.0383
(0.224)(0.304)(0.304)(0.310)(0.182)
sex−0.0673−0.261−0.159−0.02590.0381
(0.226)(0.237)(0.255)(0.270)(0.143)
marriage0.01280.134−0.0452−0.307−0.210
(0.302)(0.297)(0.375)(0.429)(0.220)
edu0.326 **0.1390.1600.126−0.0990
(0.129)(0.180)(0.157)(0.193)(0.0963)
income−0.04500.160 **0.1090.165 **0.0241
(0.0692)(0.0681)(0.0729)(0.0794)(0.0436)
family−0.0119−0.101−0.1580.000364−0.0250
(0.0845)(0.0960)(0.108)(0.108)(0.0603)
age0.08550.1570.125−0.170−0.115
(0.128)(0.145)(0.125)(0.169)(0.0821)
Constant0.8901.3121.9941.9482.325 ***
(1.133)(1.300)(1.254)(1.369)(0.735)
Observations119948689268
R-squared0.2020.1950.1920.1900.233
Note: Robust standard errors are in parentheses. ***, **, and * mean passing the significance test at 1%, 5%, and 10%, respectively.
Disclaimer/Publisher’s Note: The statements, opinions and data contained in all publications are solely those of the individual author(s) and contributor(s) and not of MDPI and/or the editor(s). MDPI and/or the editor(s) disclaim responsibility for any injury to people or property resulting from any ideas, methods, instructions or products referred to in the content.

