Article

Impact of Window Size Modification on Energy Consumption in UK Residential Buildings: A Feasibility and Simulation Study

1
Department of Architecture and Built Environment, University of Nottingham, Nottingham NG7 2RD, UK
2
Southwest Research Institute for Hydraulic and Water Transport Engineering, Chongqing Jiaotong University, Chongqing 400016, China
*
Author to whom correspondence should be addressed.
Sustainability 2025, 17(7), 3258; https://doi.org/10.3390/su17073258
Submission received: 9 February 2025 / Revised: 21 March 2025 / Accepted: 3 April 2025 / Published: 6 April 2025
(This article belongs to the Special Issue Sustainable Architecture: Energy Efficiency in Buildings)

Abstract

:
This study investigates window renovation strategies for a detached building in Belper, UK, analyzing double- and triple-glazed, vacuum, and low-E vacuum windows with varying gas fillings, pillar radii, and spacing. The results reveal that increasing glass layers reduces energy consumption, while a larger pillar radius decreases efficiency. More pillars improve window performance. For windows with the same U-value, a higher SHGC enhances energy efficiency by maximizing solar heat gain, particularly in colder climates. Conversely, reducing the U-value while maintaining a constant SHGC enhances insulation and minimizes heat loss. The study emphasizes the necessity of balancing U-value and SHGC for optimal window performance in different climates. The most effective strategy involves using a low-E vacuum window with a 0.25 mm pillar radius and 40 mm spacing while doubling the south-facing window area, leading to a 7.01 GJ heating load reduction—a 27.9% improvement over modifying the window type alone. Additionally, a key ratio, SHGC/(UwindowUwall), is introduced to assess window size modifications. The results indicate that enlarging windows is beneficial when solar heat gain surpasses additional heat loss, underscoring the importance of balancing heat conduction and solar energy utilization in energy-efficient building design.

1. Introduction

As the UK strives to achieve net-zero carbon emissions by 2050, energy conservation and emission reduction have become national priorities across various sectors [1,2,3]. Buildings, accounting for approximately 40% of the UK’s total energy consumption, represent a crucial area for improving energy efficiency. Among the various strategies to reduce building energy consumption, optimizing window performance has been widely studied.
As the core component of a building, the importance of windows is often overlooked. However, windows play a key role in the overall energy consumption of a building while providing natural light and ventilation. When designing or selecting buildings, it is necessary to fully consider the configuration of windows to achieve the goals of environmental protection and energy saving [4,5,6,7]. Too many windows are like opening too many holes in a building’s insulation, causing massive heat loss and problems with air circulation inside the building. This makes it difficult to control the indoor temperature, increasing the energy consumption of heating and cooling. Conversely, too few windows result in poor indoor air circulation and poor indoor air quality, negatively impacting the health and comfort of occupants [8,9,10,11,12]. Therefore, a balance should be found that can make full use of the natural light and ventilation brought by the windows while effectively controlling energy consumption. This requires careful design and adjustment of window size and placement. For example, south-facing windows can be enlarged to increase the illuminated area and maximize natural daylight. At the same time, the size of the windows on the north side can be reduced to reduce the intrusion of cold wind and the loss of heat [13,14].
In addition, the selection of the window is equally important. Window materials with good thermal and acoustic properties, such as double or triple glazing, can be selected to improve the building’s energy efficiency further [15,16,17].
In general, through the careful design of the size and location of windows and the selection of appropriate materials, not only can the energy consumption of buildings be reduced, the energy performance of buildings can be improved, but also a significant contribution can be made to the improvement of the living environment [18,19].
Optimizing the thermal efficiency of windows is a key factor in improving overall building energy efficiency. In different climate conditions, the proper selection of glass types, infill materials, and window-to-wall ratios can significantly reduce building cooling and heating loads [20,21,22]. In this project, a typical detached building in the UK was used as the research object, with multi-story glass windows filled with different types of gases and vacuum windows with different spacing and radius as a pillar. Different types of windows were selected for testing. The window on the south side of the building was expanded to double its original size to observe the impact of the expanded window area on the building’s energy consumption.
A study by Ismail, K.A.R.; Salinas, C.T.; etc. revealed that, in tropical climates, double-glazed windows filled with gases that possess a strong ability to absorb infrared radiation demonstrated enhanced thermal efficiency when compared to naturally ventilated double-glazed windows [23]. As a result, this led to a significant reduction in cooling loads. Through the utilization of a data-driven approach, Damilola Onatayo and Rahul Aggarwal et al. revealed that double-glazed windows, when infused with argon gas ranging from 75% to 95%, exhibited superior thermal performance, resulting in a decrease in heating demand [24]. Also, by using simulations, Gasparella, A.; Pernigotto, G.; etc. examined different window systems during winter and summer, revealing that triple-glazed windows with low solar transmittance can decrease summer cooling loads. Nevertheless, it is important to consider that their usage might result in higher heating energy consumption in winter [25]. These studies enhance window performance and reduce building energy consumption by utilizing double- or triple-glazed windows and incorporating various insulating gases to improve thermal efficiency. In this project, both double-glazed and triple-glazed windows were utilized, with interlayer spaces filled with different gases, including air, argon, krypton, and xenon.
Additionally, some studies on windows focus on the characteristics of various types of windows, such as the U-factor and the Solar Heat Gain Coefficient (SHGC). According to a study, the heating loads of a building are significantly influenced by the U-value and SHGC of its windows [26]. An analysis was conducted to examine the effects of different window geometries and thermal properties on cooling efficiency, focusing on Mediterranean regions. The study also provided design recommendations to save energy [27]. By properly selecting window types, glass materials, and window-to-wall ratios, buildings can significantly reduce heating and cooling loads and achieve substantial energy savings. The investigation into various window parameters and their impact on buildings has provided valuable insights and guidance for selecting window types for this project. This study analyzes how different window configurations influence building energy consumption through modeling and simulation, considering their respective parameters.
There are also some studies on the impact of the window-to-wall ratio (WWR) on building energy consumption. Changes in the WWR have a significant impact on building energy consumption and thermal comfort, particularly under different climates and building types [18,19,28]. Regardless of the climate conditions, be it the cold climate in Harbin or the mild climate in Chengdu, a study conducted across multiple regions in China demonstrated that changes in WWR had similar effects on the cooling and heating loads. They recommended adjusting the WWR within the 30–40% range to optimize energy consumption [29]. An examination focusing on office buildings in the United States demonstrated a direct correlation between an elevated WWR and a significant increase in energy consumption for cooling, lighting, and ventilation needs. However, in actual buildings, the impact was less pronounced than in simulation results [30]. Through the use of simulations, a study conducted in Turkey showcased that modifications in WWR exhibited a particularly significant impact on the thermal performance of buildings lacking insulation, while the influence was less pronounced in insulated structures [31]. This study highlights the importance of considering the thermal insulation performance of walls when modifying the window-to-wall ratio (WWR). According to a study examining hot-summer and cold-winter regions in China, the east–west window-to-wall ratio (WWR) was found to have the most substantial influence on energy consumption. This impact was further amplified by the implementation of low-emissivity glass, which effectively decreased energy usage [18]. Debby Veillette conducted a thorough simulation analysis employing Monte Carlo simulations, which demonstrated that window-to-wall ratio (WWR) had a notable impact on heating demand and thermal comfort, especially in buildings characterized by high WWR [32]. In addition, an examination was carried out to evaluate the effects of WWR on air conditioning energy consumption in diverse residential modes in Guangzhou. The results indicated a notable rise in air conditioning energy consumption as WWR increased in fully mechanical modes [28].
Some of the literature studies the optimal value of window–wall ratio for buildings in the European climate. Although the optimal wall–window ratio exists for office buildings for every climate and orientation, most of the ideal values can be found within a relatively narrow range (0.30 < WWR < 0.45). Total energy use may increase by 525% when the worst wall–window ratio is used, while energy efficiency is highest when the best wall–window ratio is used [33]. Some of the literature shows that the optimal WWR of office buildings in cold areas is 0.35, 0.3, 0.3, and 0.25, respectively, in the south, north, east, and west. In general, the maximum energy-saving value of the south window wall ratio of the building in the cold area is relatively more significant. At the same time, the north should be appropriately reduced under the allowed lighting and ventilation conditions [34]. The paper also simulates the office building model, and the results show that the cooling energy use increases by 5.67% on average for every 10% increase in WWR. In addition, more than 20% of WWR buildings fail to provide comfortable temperatures [35]. These values can be used as a reference to study the optimal window–wall ratio of British buildings. There are also studies pointing out that for the university gymnasium in cold areas, the window design should use side windows, with north and south lighting as the main and east and west lighting as the auxiliary [36]. This is because buildings in the northern hemisphere receive the most daylight from their southern windows, while buildings in the southern hemisphere get the most daylight from their northern windows. On the other hand, both the eastern and western surfaces are exposed to light in the morning or afternoon. In this project, Britain is in the northern hemisphere, and most of its energy consumption comes from heating buildings in winter. The influence of solar energy on building energy consumption should also be considered when designing the window–wall ratio. More sunlight reduces the building’s heat load accordingly.
From the above studies, it can be concluded that the window-to-wall ratio (WWR) has a significant impact on building energy consumption and thermal comfort. A higher WWR usually increases building energy consumption, especially in buildings with poor insulation [37,38]. In addition, in hot summer and cold winter climate zones, the east–west WWR has the greatest impact on energy consumption. Overall, WWR is closely related to heating demand and thermal comfort and needs to be reasonably optimized to balance energy consumption and comfort [39]. Building upon these insights, this study aims to further explore the potential of modifying window types and sizes to reduce building energy consumption in the UK residential sector. Previous studies on the window-to-wall ratio (WWR) have primarily focused on modifying the WWR of existing buildings to determine the most suitable ratio for a given structure by simulating its energy consumption. However, these studies have not explicitly identified the conditions under which increasing or decreasing window size can effectively reduce building energy consumption.
In this project, different types of windows with varying parameters were incorporated into the building model, and their sizes were systematically expanded to observe the corresponding changes in energy consumption. Additionally, theoretical knowledge of heat transfer between windows and walls was integrated to provide further insights. Based on this approach, the study identifies three key parameters to consider when modifying window size: the window U-factor, the Solar Heat Gain Coefficient (SHGC), and the wall U-factor. The ratio SHGC/(UwindowUwall) is proposed as a critical indicator of whether a given window–wall combination is suitable for increasing window size to enhance solar heat gain, thereby reducing heating energy demand during winter.
The annual heat gain and heat loss of the windows were calculated by EnergyPlus 9.1.0, and by comparing the magnitude of heat gain and heat loss, the windows’ positive or negative impact on the building’s energy consumption was determined. This was performed to find the windows on the south side of the building that have the most significant impact on the building’s energy consumption, to reduce the building’s energy consumption by increasing the area of the windows. This conclusion can be helpful for the renovation of UK buildings in terms of windows, and the same method can be used for other types of residential buildings to find suitable value to optimize the energy consumption of the building.

2. Materials and Methods

2.1. Explanation and Introduction of Research Methods

In the energy consumption simulation analysis of buildings, the process begins with modeling the building based on its basic information, followed by modifications to the window structure. The original double-glazed window is replaced with other types of windows. Energy consumption simulations are then conducted to assess the impact of different window retrofit technologies on the building’s energy consumption, quantifying the reduction in energy use associated with these window modifications. Furthermore, by analyzing the SHGC and U-factor of various windows, the relationship between these parameters and the building’s energy consumption is explored. Through a detailed analysis of the thermal performance of the windows and applying relevant formulas, it is possible to determine how adjusting the window size—considering the interplay of window U-value, wall U-value, and SHGC—can effectively reduce the building’s energy consumption under specific conditions.

2.1.1. Windows Energy Consumption

Total Heat Gain Through Windows

The total heat gain through windows consists of several components, including conductive heat transfer, solar heat gain, infiltration heat gain, and other factors. It can be represented by the following equation:
Total heat gain (Q):
Q t o t a l = Q c o n d u c t i v e + Q s o l a r + Q i n f i l t r a t i o n + Q c o n v e c t i v e + Q r a d i a t i o n + Q f r a m e
where Qtotal is the total heat transfer through the window, including Qconductive for conduction through the glazing and frame, Qsolar for solar heat gain, Qinfiltration for heat exchange due to air leakage, Qconvective for convective heat transfer with the surrounding air, radiation for long-wave radiation exchange with surrounding surfaces, and Qframe for heat transfer specifically through the window frame.
Conductive heat gain (Qconductive):
Heat transfer through the window due to the temperature difference between indoor and outdoor air. The formula is as follows:
Q c o n d u c t i v e = U × A × ( T i n d o o r T o u t d o o r )
where U is the window’s U-value (thermal transmittance), measured in W/m2·K; A is the window area, in m2; Tindoor and Toutdoor are the indoor and outdoor temperatures, in °C.
Solar heat gain (Qsolar):
Heat gains through the window from solar radiation. The formula is as follows:
Q s o l a r = S H G C × A × I s o l a r
where SHGC is the Solar Heat Gain Coefficient, A is the window area in m2, and Isolar is the solar irradiance (solar radiation intensity) in W/m2.
Infiltration heat gain (Qinfiltration):
Heat gain or loss due to air leakage through the window is influenced by the air infiltration rate. The formula is as follows:
Q i n f i l t r a t i o n = ρ × V × C a i r × ( T i n d o o r T o u t d o o r )
where ρ is the density of air in kg/m³, V is the air infiltration rate (airflow volume) in m3/s, Cair is the specific heat capacity of air in J/kg·K, Tindoor and Toutdoor are the indoor and outdoor temperatures in °C.
Convective heat gain (Qconvective):
The temperature difference between indoor air and the window surface influences heat transfers due to air convection near the window. The formula is as follows:
Q C o n v e c t i o n = h c o n v e c t i o n × A × ( T i n d o o r T w i n d o w   s u r f a c e )
where hconvective is the convective heat transfer coefficient in W/m2·K, A is the window area in m2, and Twindow surface is the temperature of the window’s surface.
Radiative heat gain (Qradiation):
Heat transfer through long-wave radiation between the window and its surroundings (e.g., sky or ground). The formula is as follows:
Q R r a d i a t i o n = ϵ × σ × A × ( T w i n d o w   s u r f a c e T s k y )
where ϵ is the emissivity of the window glass (e.g., for low-emissivity windows), σ is the Stefan–Boltzmann constant 5.67 × 10⁻⁸ W/m2·K4, and Twindow surface and Tsky are the window surface and sky temperatures, respectively, in K.
Frame and edge heat gain (Qframe):
Heat loss through the window frame and edge areas can be significant depending on the frame material. The formula is as follows:
Q f r a m e = U f r a m e × A f r a m e × ( T i n d o o r T o u t d o o r )
where Uframe is the U-value of the window frame, and Aframe is the frame area.
When retrofitting windows, changes in window type significantly affect both the U-factor and SHGC. Among the various modes of heat loss through windows, conductive heat transfer and solar heat gain substantially impact the building’s overall energy consumption. Python 2022.3.2 scripts were utilized to batch-process simulation files to systematically analyze these two parameters’ influence on building energy performance. This approach enabled the quantification of the relative impact of the U-factor and SHGC on energy consumption, providing critical insights for optimizing the selection of window types in retrofitting strategies. By identifying the parameters with the greatest influence, this method supports selecting window types that maximize energy efficiency while balancing heat loss and solar gain.

2.1.2. Window Modification of This Project

This project considers double-glazed windows filled with different gas and vacuum windows with or without low-e film.
Three inert gases, argon, krypton, and xenon, were considered in this research. They were added to double and triple-glazing windows, respectively, to simulate energy consumption. Additionally, the original gas in the base case is air. The base case window is a normal double-glazed window filled with air. Table 1 shows the parameters of 4 different gases selected to be filled into windows, and the parameters of the vacuum windows are shown in Table 2 (calculated by WINDOW 7.8 software).

2.1.3. Change Window Size

When remodeling the window size, in addition to analyzing the thermal performance of the window and wall, other effects of the window area should also be comprehensively considered. Increasing the window area means reducing the wall area and involves multiple factors such as heat conduction and solar radiation heat gain. The heat exchange of windows is mainly achieved through heat conduction and solar radiation heat gain, while the heat exchange of walls is primarily achieved through conduction. Therefore, the combined effects of these three heat transfer mechanisms must be fully considered when determining window size modifications.
Taking south-facing windows as an example, since south-facing windows receive more solar radiation during the day in winter, especially in winter, the heat gain from solar radiation is more significant, so south-facing windows have become ideal objects for renovation research. Increasing the area of south-facing windows leads to an increase in conductive heat dissipation from the windows. Still, it also increases solar radiation heat gain; as the wall area decreases, the heat dissipation from the wall decreases. In this case, it is necessary to compare the difference between the heat gain from solar radiation, the increase in heat dissipation from windows, and the decrease in heat dissipation from walls. Suppose the increase in solar radiation heat gain is greater than the increase in window heat dissipation, and the reduction in wall heat dissipation is greater than the increase in window heat dissipation. In that case, this positively impacts building energy efficiency; increasing heat gain and reducing heat dissipation helps reduce energy consumption in winter.
In addition, increasing the window area also has the advantage of improving the indoor light environment and introducing more natural light, thereby reducing reliance on artificial lighting and lighting energy consumption. This is also an important consideration in improving the overall energy efficiency of the building. At the same time, from a construction perspective, increasing the window area is usually more straightforward in wall modification and is easier to achieve than reducing the window area.
However, it should be noted that in most cases, the heat transfer coefficient (U value) of walls is much lower than that of windows, and windows also increase heat dissipation through air infiltration and other channels. Therefore, the thermal performance of windows is usually lower than that of walls, and only in rare cases is the thermal performance of windows better than that of walls. Therefore, window size changes must be judged based on the balance between increased solar radiation heat gain and heat dissipation. If solar heat gain increases, enlarging the window area will help reduce energy consumption; however, if heat dissipation increases more significantly, the positive effect of solar radiation heat gain may be offset by heat dissipation. Therefore, these factors need to be reasonably evaluated to achieve optimal building energy efficiency improvements when carrying out window size modifications.
Figure 1 explains the influence of window size change on building energy consumption, focusing on the energy balance between the additional heat loss caused by window enlargement and solar heat gain. Changing the window size means increasing the window area ΔA and reducing the wall area ΔA. If the U-factor of the window is greater than that of the wall, assuming that ΔT is the hourly average, then the building conducts additional conduction in the unit period Δt. The original window size represented by the yellow area, while the red area indicates the expanded portion of the window, which corresponds to the difference in area (ΔA) between the enlarged window and the original one.
The amount of heat lost can be calculated by the following formula:
Δ Q 0 1 = U w i n d o w U w a l l Δ A * Δ T * Δ t
So ΔQtotal in the total period is as follows:
Δ Q t o t a l = U w i n d o w U w a l l Δ A * 1 n Δ T Δ t
The additional solar heat gain from windows can be calculated using the following formula:
Δ Q s o l a r = S H G C * Δ A * 1 n I s o l a r Δ t
To make ΔQsolar greater than ΔQtotal,
S H G C * Δ A * 1 n I s o l a r Δ t > U w i n d o w U w a l l Δ A * 1 n Δ T Δ t
Because the indoor temperature is equal to the setpoint in the same model, the change in outdoor temperature is consistent, so the ΔT per unit time is also consistent, so 1 n Δ T Δ t and 1 n Δ t are both fixed values. For the original building, increasing the area of the windows from 1.1 times to 1.2 times to 2 times is observed, and increasing the size of the windows has little effect on the energy consumption of the building. Even if the area is doubled, the increase is only close to 0. Currently, when ΔQsolar = ΔQtotal, the heating load of the building is unchanged.
S H G C * Δ A * 1 n I s o l a r Δ t = U w i n d o w U w a l l * Δ A * 1 n Δ T Δ t
So,
S H G C ( U w i n d o w U w a l l ) = 1 n Δ T Δ t 1 n I s o l a r Δ t
It could be calculated that
1 n Δ T Δ t 1 n I s o l a r Δ t = S H G C ( U w i n d o w U w a l l ) = 0.76 2.932 1.766 = 0.65
Total extra heat gain: ΔQ = ΔQsolar − (ΔQwindow − ΔQwall)
Δ Q = S H G C * Δ A * 1 n I s o l a r Δ t U w i n d o w U w a l l * Δ A * 1 n Δ T Δ t
When the SHGC is the same, if the U-value of the window is greater than that of the wall, the value of S H G C ( U w i n d o w U w a l l ) is positive. As this value increases, it indicates that the window’s U-value is getting closer to that of the wall, resulting in a more significant difference in heat transfer (ΔQ).
Conversely, if the U-value of the window is lower than that of the wall, the value of S H G C ( U w i n d o w U w a l l ) is negative. As this value increases, it indicates a more significant difference between the U-value of the window and the wall, which also results in a more substantial difference in heat transfer (ΔQ).
The S H G C ( U w i n d o w U w a l l ) = 1 n Δ T Δ t 1 n I s o l a r Δ t represents a critical value at which the positive solar heat gain from increased window area equals the additional heat loss caused by the lower thermal performance of windows compared to walls. This critical point indicates that expanding the window area would not yield further energy savings, as the increased heat dissipation fully offsets the solar heat gain.
Every building has a specific value for this ratio because the solar irradiance, Isolar is relatively constant for a given location. This means the thermal performance comparison between windows and walls can be evaluated through direct calculation or simulation. When a simulation shows that increasing the window area reduces the building’s overall energy consumption, it implies that the positive gain from solar radiation exceeds the heat loss caused by the lower thermal resistance of the windows. In such a case, the ratio S H G C ( U w i n d o w U w a l l ) is less than the critical value calculated for the specific building and conditions, suggesting that the window’s solar gain outweighs its heat loss.
Thus, by calculating the S H G C ( U w i n d o w U w a l l ) for a new window configuration, if this ratio is lower than the critical value identified for the building, it indicates the potential for further reducing energy consumption by increasing the window area. This approach provides a method for assessing the viability of window size modifications without needing to compute the fixed critical value for each scenario directly. Instead, a comparative analysis of different window configurations can approximate whether an expansion of window area will result in net energy savings. In essence, if the new window configuration yields a lower S H G C ( U w i n d o w U w a l l ) than the identified threshold, it suggests that the positive effects of solar heat gain will dominate, and thus, increasing window size can potentially reduce the building’s overall energy consumption.

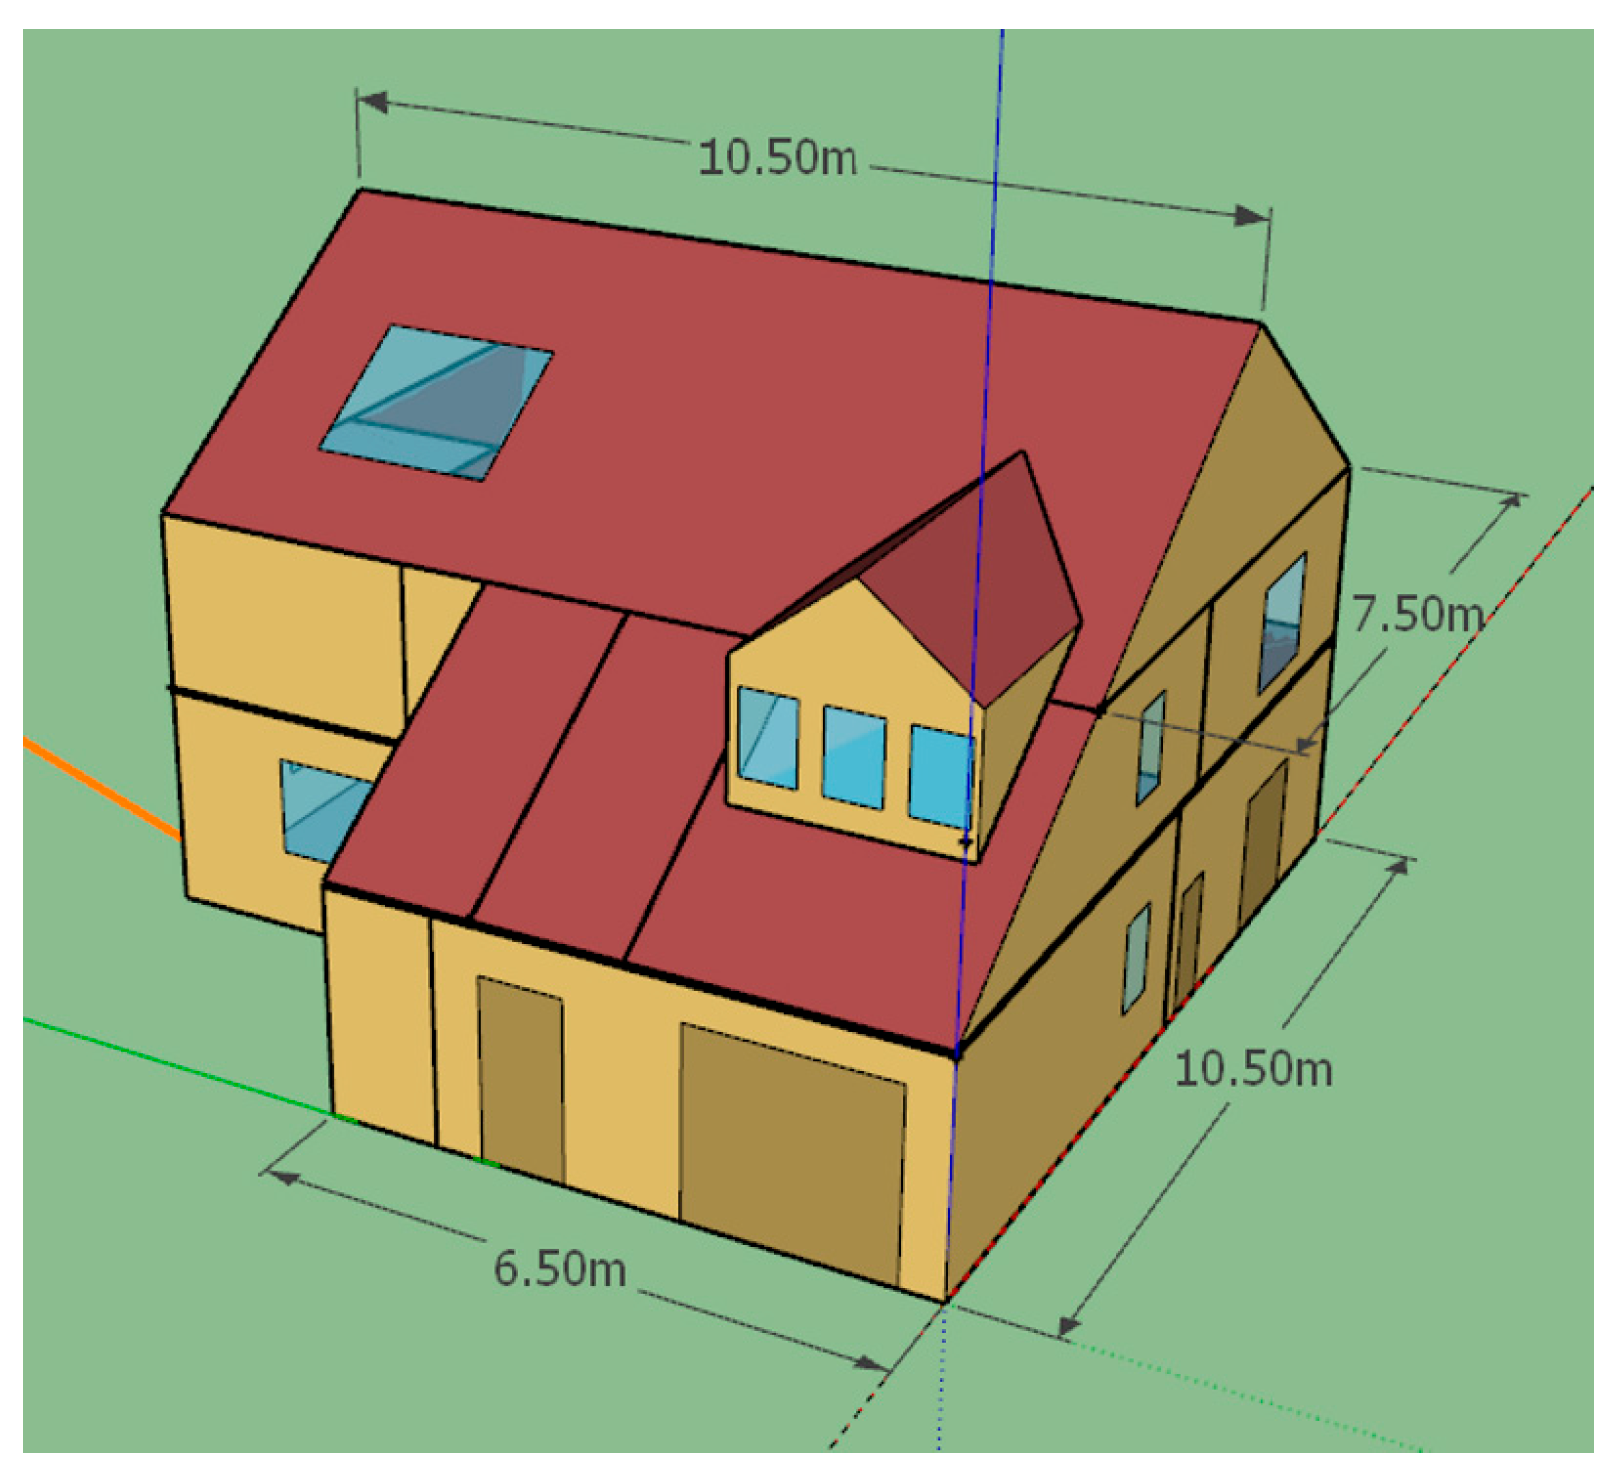
2.2. Description of the Base Case Building

This study focuses on a detached residence located in Belper, Derbyshire, England. Geographically positioned at a latitude of 53°01′07.8″ and a longitude of 1°30′08.9″, the structure is a two-story building. The architectural design incorporates windows on all facets to ensure ample natural lighting.
Figure 2 shows the information on the base case building. The model is built in SketchUp 2017 and Openstudio software 2.8.0, and some of the technical retrofitting was made through EnergyPlus 9.1.0 and Windows 7.8 software. The geometry of the building was first created in SketchUp, and then thermal zones were added. In openstudio, the weather files, constructions, schedules, and HVAC system can be set step by step. The orange lines in the image represent the north, and the building is 20° west of North. The light yellow part is the external wall of the building, the blue part is the window, and the brown part is the door.
  • Weather File
Watnall is the closest weather station, and the weather file GBR_ENG_Nottingham.Watnall.033540_TMYx.epw are downloaded from the EnergyPlus weather file network.
  • Occupancy and Load Scheduling
The building’s operational schedules, including occupancy, lighting, and equipment, are customized to the lifestyle of the retired owner and his wife. They select the schedules for different parts of the building based on personal preference, aiming to manage the electricity loads for lighting and equipment to approximately 1 gigajoule (GJ).
People: The building accommodates two residents, with a fraction radiant of 0.3 and a carbon dioxide generation rate of 0.000038 L/s·W.
Lights and Equipment: The defined electric loads are 4 W/m2 for lighting and 2 W/m2 for electrical equipment, facilitating energy conservation.
Ventilation and Infiltration: Adequate ventilation is ensured with an outdoor airflow rate of 9.44 L/s per person. Infiltration is controlled at a flow rate of 0.000226568 m/s per exterior surface area, maintaining indoor air quality and thermal comfort.
This structured approach to detailing the construction and operational specifications of the building highlights the precision in balancing comfort with energy efficiency according to the owner’s preferences.
  • Tested Scenarios
Ground Floor: The ground floor consists of 22 mm ceramic floor tiles in the kitchen and utility room, offering a conductivity range of 0.6–1.7 W/mK. This is supported by a 50 mm reinforced sand/cement screed and a 50 mm polystyrene insulation, both providing good thermal resistance, with conductivities of 1.05 and 0.035 W/mK, respectively. A 100 mm concrete slab forms the base, topped with a 20 mm damp-proof membrane and 150 mm stone hardcore with sand blinding.
First Floor: The first floor features 22 mm softwood floorboards over 220 mm × 50 mm timber joists with low conductivity (0.12 and 0.025 W/mK, respectively). The ceiling is made from 9.5 mm plasterboard with a 3 mm skim, achieving a conductivity of 0.51 W/mK.
Roof: The roof is constructed from 165 mm × 265 mm clay tiles over 50 mm Sarking felt, 100 × 50 treated timber rafters, and purlins. Between the 100 mm × 50 mm treated timber ceiling joists, there is 100 mm of glass wool insulation, providing excellent thermal resistance.
Walls (3-layer original wall): External walls consist of 100 mm natural sandstone with a conductivity of 1 W/mK. This is complemented by a 100 mm cavity and 100 mm lightweight concrete block layers, with one of the cavities filled with shell-blown polystyrene bead insulation for enhanced insulation properties.
Windows: The windows installed between 1981 and 2012 use double-glazed units with 4 mm glass on both the outer and inner sides, separated by an 8 mm air gap, optimizing thermal and acoustic insulation.
Glass Specifications: J WINDOW glass, utilized in the building’s windows, is characterized by a spectral average optical data type and a thickness of 0.004 m. It boasts high solar and VT (visible transmittance) rates at normal incidence, contributing to the building’s energy efficiency.
Figure 3a illustrates the total electricity consumption of the building from 1985 to 2021 in gigajoules (GJ), with the horizontal axis representing the year and the vertical axis indicating energy consumption. The data reveal a general increase in electricity consumption from 1985 to 2001, particularly between 1995 and 2001, when it peaked at nearly 12 GJ. Following 2001, electricity consumption declined, reaching its lowest point of approximately 4 GJ in 2009. Since 2010, consumption has gradually recovered, stabilizing at a relatively consistent level of around 6–8 GJ between 2013 and 2021. Similarly, Figure 3b presents the total natural gas consumption of the building from 1983 to 2021 in gigajoules (GJ), with the horizontal axis representing the year and the vertical axis showing natural gas consumption. From 1983 to 2000, natural gas consumption exhibited a generally fluctuating upward trend, remaining relatively stable at around 80 GJ. However, from 2001 to 2005, significant fluctuations occurred, peaking at approximately 100 GJ in 2005 before gradually declining. Between 2006 and 2011, consumption continued to decline with fluctuations, reaching a low of about 60 GJ in 2011. From 2012 to 2021, natural gas consumption stabilized at around 60 GJ with minimal variation.
Energy consumption: The building is a detached residential building with two elderly residents. The information about the gas load and electricity load is provided by the owner, John Chilton. Since the three-layer wall (original wall) in the UK is not very common, this study changes the wall into a common double-layer cavity wall. Table 3 shows the measurement of building energy consumption, original simulation energy consumption, and modified base case energy consumption.

3. Results

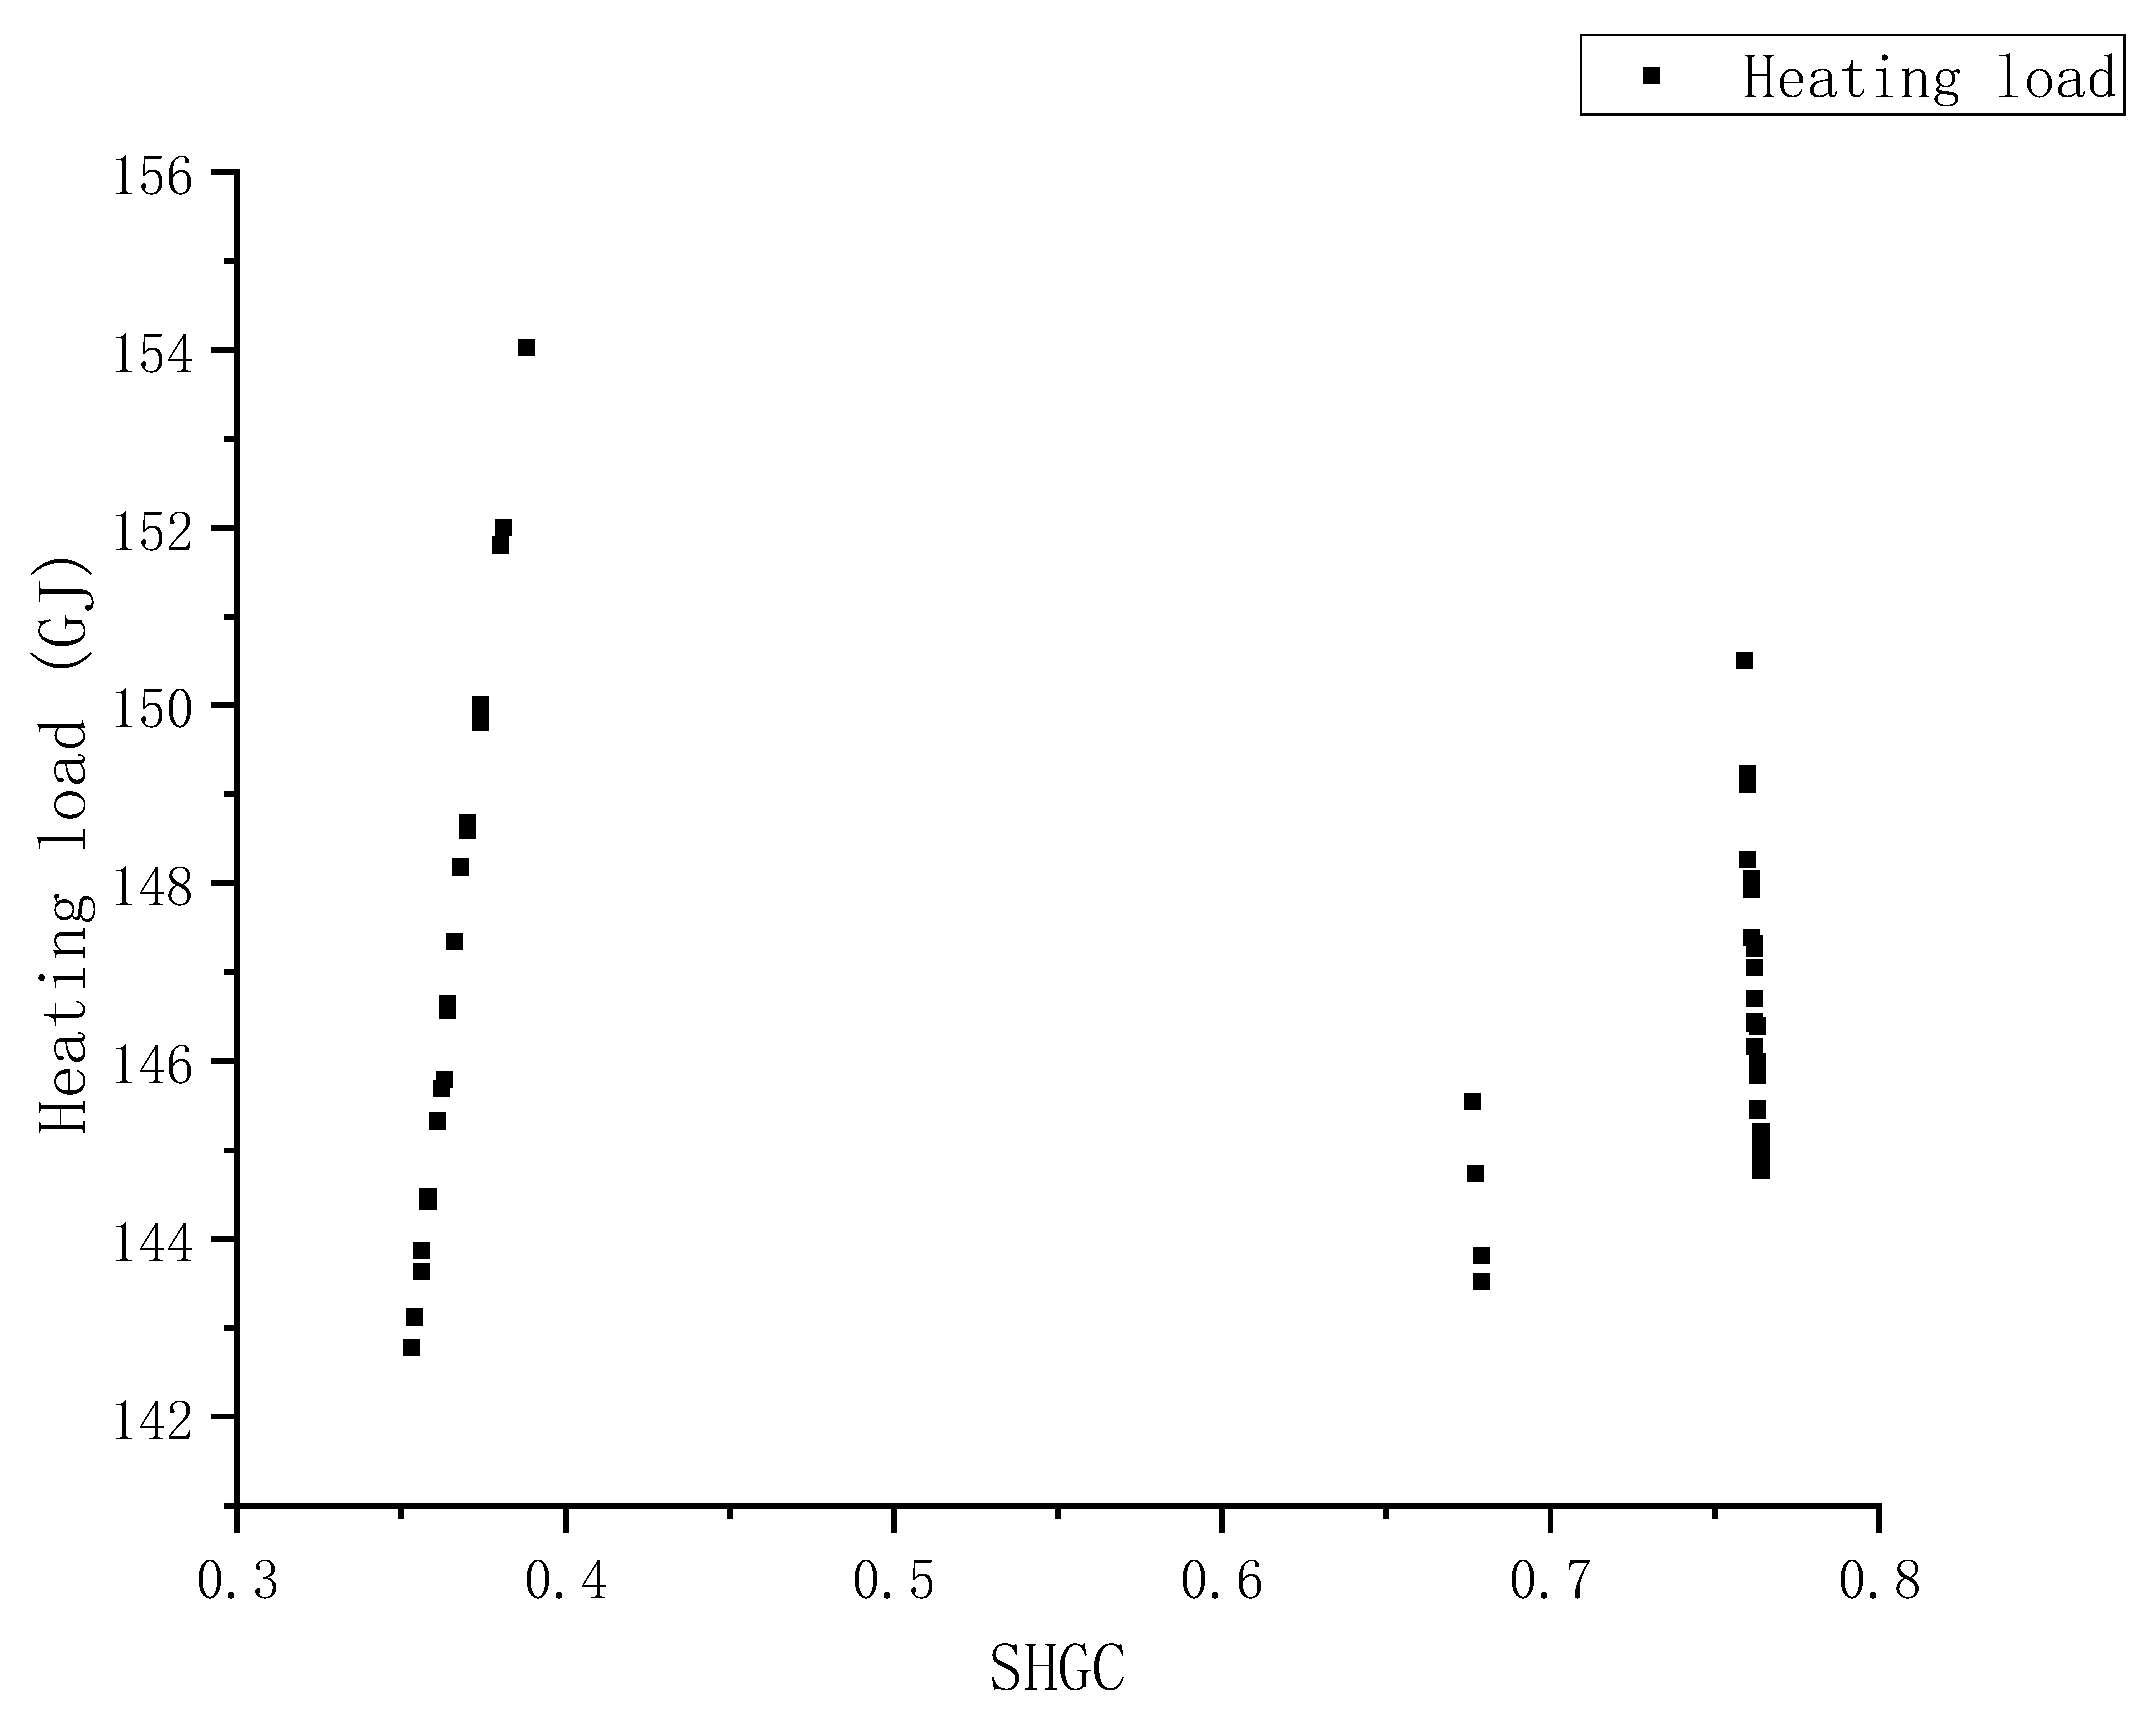
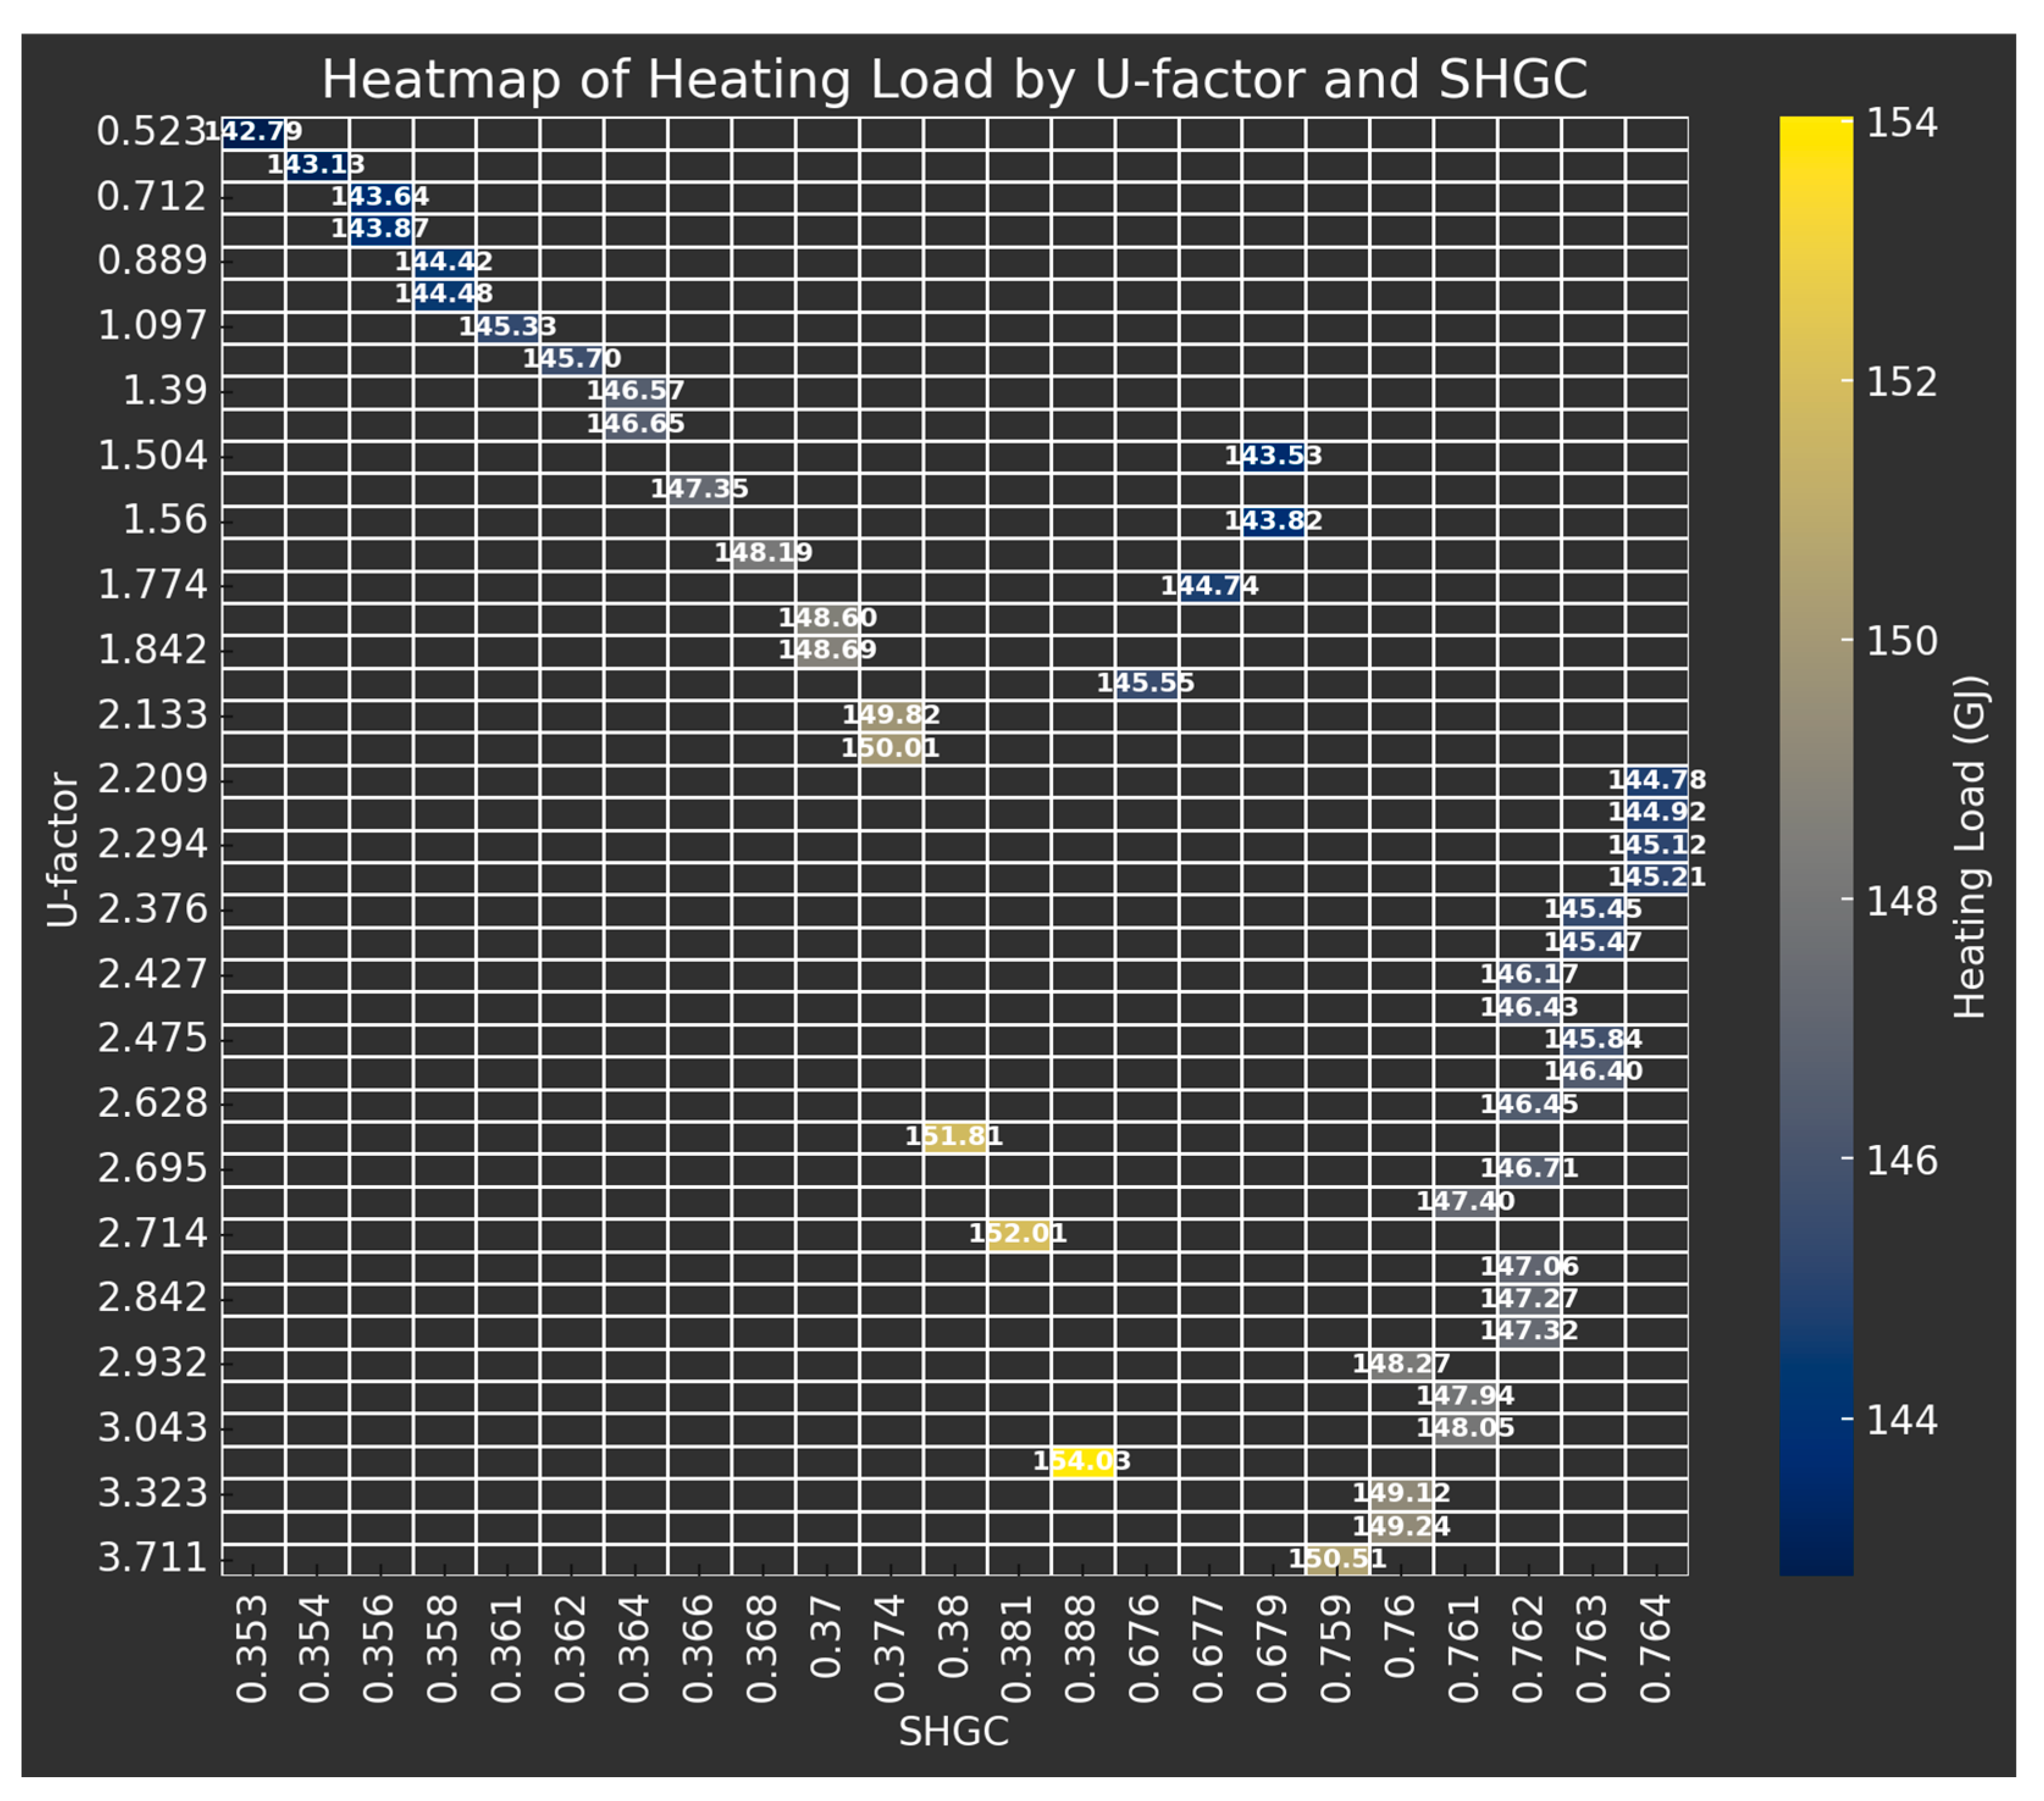
3.1. Windows Energy Consumption Analysis

Table 4 presents the results of heating load simulations for the building after replacing its windows with various glazing systems, comparing key performance parameters such as SHGC/(UwindowUwall) and the corresponding heating load under different window configurations. These factors collectively reflect the thermal and optical performance of the windows and their impact on the building’s heating energy demand in winter conditions. The heating load is evaluated under two scenarios: Heating load 1 represents the energy required to maintain indoor comfort with the original south-facing window size, while Heating load (2) corresponds to the heating demand when the window area is doubled. The difference value, calculated as Heating load 1 − Heating load 2, indicates the reduction in heating energy demand due to window enlargement, where a positive value suggests that increasing the window size reduces heating demand through higher solar heat gain, whereas a negative value implies an increase in heating demand, likely due to excessive heat loss. The table includes various glazing types, such as double and triple-glazed windows filled with different gases (air, argon, krypton, and xenon), as well as vacuum-insulated glazing with varying spacing configurations, some of which incorporate low-emissivity (low-e) coatings to further enhance thermal performance.
The thermal performance of gas-filled layers in windows varies significantly between double-pane and triple-pane designs. Compared to air-filled glazing, argon-filled windows provide better insulation, while krypton and xenon fillings further enhance thermal performance. This gas layering effectively reduces the heat transfer coefficient (U-value) and improves overall energy efficiency. Triple-pane windows demonstrate a more substantial reduction in energy consumption compared to double-pane ones, primarily because the additional gas-filled and glass layers further minimize heat transfer, significantly enhancing insulation and improving the overall building energy efficiency.
For vacuum-insulated glazing, the typical structure consists of a 4 mm transparent glass layer + vacuum layer + 4 mm transparent glass layer, with pillar radii of 1.5 cm and pillar spacing ranging from 20 mm to 40 mm in 5 mm increments. This design optimizes vacuum layer structural integrity and thermal performance by adjusting pillar spacing. From an energy consumption perspective, increasing the pillar spacing significantly reduces heating demand, as fewer pillars per unit area minimize thermal bridging and enhance insulation performance.
A key parameter introduced in this study, SHGC/(UwindowUwall), determines whether enlarging window size leads to reduced heating energy demand. The baseline value is 0.65. The results show that when SHGC/(UwindowUwall) > 0.65 or <0, increasing window size reduces heating load, which aligns with theoretical expectations. This is observed in Triple Air (3.23), Triple Argon (84.62), and vacuum low-e radius 0.5 mm, spacing 20 mm (4.87), where heating loads decrease as window size doubles. Similarly, Triple Krypton (−3.30), Triple Xenon (−2.59), and vacuum low-e radius 1.5 mm, spacing 40 mm (−1.61) also exhibit energy savings when the window area is increased, further validating this theory.
The reduction in heating load when the window size is doubled (difference value) confirms this trend. For example, Triple Air (1.3 GJ), Triple Argon (1.42 GJ), Triple Krypton (1.54 GJ), and Triple Xenon (1.61 GJ) all exhibit significant reductions in heating load. Vacuum low-e radius 0.5 mm, spacing 20 mm (0.66 GJ) and vacuum low-e radius 1.5 mm, spacing 40 mm (0.85 GJ) also demonstrate improved energy efficiency as the window size increases. In contrast, windows that do not meet the SHGC/(UwindowUwall) condition show smaller reductions in heating demand when the window size is doubled, such as Double Air (0.96 GJ) and Double Argon (1.07 GJ).
Low-e coatings play a crucial role in further reducing heating loads. For instance, vacuum low-e radius 0.25 mm, spacing 40 mm has a difference value of 1.53 GJ, whereas the non-low-e vacuum radius 0.25 mm, spacing 40 mm achieves only 1.27 GJ, proving that low-e coatings significantly reduce indoor heat loss and improve building energy performance.
In summary, windows that meet the SHGC/(UwindowUwall) > 0.65 or < 0 condition show significant heating load reductions when the window size is increased, confirming the theoretical framework proposed in this study. Triple-pane gas-filled windows (Triple Xenon, Triple Krypton) and vacuum low-e windows (vacuum low-e radius, 0.25 mm spacing 40 mm) perform best, achieving the greatest heating load reductions when the window size is doubled. In contrast, double-pane windows offer limited energy savings, even with inert gas fillings. Moreover, the use of low-e coatings further enhances energy efficiency, making them a critical component in high-performance glazing design. Thus, vacuum low-e windows with optimized pillar spacing represent the most effective strategy for improving building energy efficiency.
Figure 4 below shows the scatter plot of U-values and heating load. The U-value is shown on the X-axis, while the Y-axis represents the corresponding heating load.
Figure 4 illustrates the relationship between the U-factor and heating load, as shown in the previous table. The U-factor on the X-axis represents the thermal transmittance of different window types, while the Y-axis displays the corresponding heating load required to maintain indoor comfort. The plot demonstrates a clear positive relationship between these two variables, indicating that as the U-factor increases, the heating load also rises. This correlation suggests that windows with higher U-factors, which have lower insulation performance, result in greater energy consumption for heating during colder seasons.
The data points represent various glazing types, including double and triple glazing with different gas fillings, as well as vacuum-insulated glazing systems. As the U-factor increases, the rate of heat loss through the windows increases, leading to higher heating demands. Specifically, the U-factor in the dataset ranges from approximately 0.5 to over 3, while the corresponding heating loads range from around 169 to over 181 units. This linear increase in heating load with increasing U-factor highlights the significant impact that window thermal properties have on building energy demand. Windows with higher U-factors allow more heat to escape, thus requiring more energy to maintain the desired indoor temperature. This underscores the importance of selecting windows with lower U-factors to effectively reduce energy consumption for heating, particularly during winter.
Figure 5 below depicts the relationship between the SHGC and the heating load based on the data from the previous table. The SHGC, shown on the X-axis, measures the fraction of solar radiation admitted through a window, while the Y-axis represents the corresponding heating load.
Figure 5 demonstrates a more scattered relationship compared to the U-factor, but there are still key insights to be noted. SHGC represents the ability of windows to transmit solar heat into a building, and while the pattern is less linear, it suggests that as SHGC increases, the heating load generally decreases. This occurs because higher SHGC values allow more solar heat to enter the building, reducing the amount of energy needed for heating.
In this dataset, SHGC values range from 0.35 to 0.76, and while the relationship is not as strong as with the U-factor, it is evident that windows with higher SHGC tend to reduce the heating load. This inverse relationship between SHGC and heating load indicates that when the U-factor remains constant, an increase in solar heat gain through windows can contribute to lower heating demands as the building benefits from the additional solar energy. Although the pattern is more dispersed, this highlights the importance of considering SHGC in colder climates, where increasing solar heat gain can help offset heating requirements, particularly during winter months.
Figure 6 shows the heatmap, which provides a visual representation of the heating load as a function of the U-factor and SHGC based on the data from the previous table. The color gradient represents the heating load, with lighter colors indicating lower heating loads and darker colors corresponding to higher heating loads. On the Y-axis, the U-factor shows the windows’ thermal transmittance; on the X-axis, the SHGC represents the SHGC. The heatmap reveals a clear trend where windows with lower U-factors and higher SHGC values tend to reduce heating load, showcasing how a balance between minimizing heat loss (U-factor) and optimizing solar gain (SHGC) can improve building energy efficiency in winter. This visual tool highlights the combined effect of these two parameters on the overall energy demand for heating.
Figure 6 provides a detailed visual representation of how different combinations of U-factor and SHGC impact the heating load. The color gradient indicates that the U-factor has a more significant influence on heating load than SHGC. As the U-factor increases (moving down the Y-axis), the heating load rises due to greater heat transfer through the window, requiring more energy to maintain indoor temperatures. In contrast, SHGC (X-axis) also affects heating load, but its impact is more nuanced. Lower SHGC values (toward the left of the heatmap) generally correspond to lower heating loads, as less solar heat enters the building. However, the effect of SHGC is less pronounced compared to the U-factor, particularly when the U-factor is low.
This reveals a nonlinear relationship between SHGC and U-factor. When insulation performance is high (low U-factor), variations in SHGC have a minor influence on heating demand. However, as the U-factor increases, SHGC becomes more critical in reducing heating load, though this effect is not linear. Beyond a certain SHGC threshold, the reduction in heating load diminishes, demonstrating diminishing returns. The interaction between SHGC and U-factor suggests that their effects are interdependent rather than additive, meaning optimal window design requires a balanced approach rather than a fixed linear trade-off. Ultimately, the heatmap confirms that while the U-factor is the primary driver of heating load increases, SHGC plays a secondary but important role in modifying heating demand based on specific window properties and climate conditions.

3.2. Summary of Window Size Modification

Increasing window area affects heat transfer in two opposing ways: it enhances solar heat gain, which can reduce heating demands, particularly in winter, but also increases heat loss due to the window’s typically higher U-value compared to walls. This means windows lose more heat through conduction than walls. South-facing windows, which receive the most solar radiation in winter, are ideal for renovation. Expanding these windows can enhance solar heat gain but also lead to greater heat loss, making it crucial to strike a balance. The thermal performance of a window is determined by two key factors: the SHGC, which indicates how much solar energy passes through (higher SHGC means more heat gain), and the U-value, which measures heat loss (lower U-values indicate better insulation and reduced heat loss). The key equation is
Δ Q T o t a l = U w i n d o w U w a l l Δ A 1 n T t
This formula calculates the total heat loss difference due to the difference in U-values between the window and wall. The solar gain equation is
Q s o l a r = S H G C × A 1 n I s o l a r t
This represents the additional heat gained through the window due to solar radiation. By comparing the SHGC with the difference between the U-values of the window and the wall, a critical value can be determined to assess whether the solar gain compensates for the additional heat loss. If the ratio SHGC/(UwindowUwall) exceeds a certain threshold, increasing the window size will result in net energy savings by gaining more heat than is lost. A comparison of different window configurations, including their U-value, SHGC, and VT, highlights how this ratio determines whether solar heat gain outweighs conductive heat loss. In summary, to maximize energy efficiency, window size should only be increased when the additional solar gain surpasses the added heat loss. The SHGC/(UwindowUwall) ratio serves as a key metric in evaluating this balance—if it exceeds the critical value, enlarging the window can be beneficial for energy savings.

4. Discussion

The findings of this study contribute to a deeper understanding of how different window types and modifications impact building energy performance. Previous research has established the significance of glazing technology and window design in reducing energy consumption, and this study further refines those insights by evaluating the interplay between U-value, SHGC, and structural parameters of windows [40,41,42].
The analysis of various window types, including double- and triple-glazed units filled with different gases, vacuum windows, and low-emissivity (low-E) vacuum windows, highlights the critical role of glazing structure in thermal performance. Consistent with prior studies, the results demonstrate that increasing the number of glass layers reduces energy consumption by enhancing insulation [43]. Furthermore, structural parameters such as pillar radius and spacing within vacuum windows have a notable impact on efficiency [44,45,46]. Larger pillar radii were found to reduce performance, while greater pillar spacing improved efficiency by minimizing thermal bridging. These findings emphasize the necessity of optimizing both material properties and design parameters to maximize energy savings in building applications.
A key takeaway from this study is the trade-off between U-value and SHGC in determining overall energy efficiency. When comparing windows with the same U-value, a higher SHGC improves efficiency by allowing greater solar heat gain, which can be advantageous in colder climates by reducing heating demand. Conversely, for windows with identical SHGC, a lower U-value enhances insulation and minimizes heat loss, improving building performance in both heating and cooling seasons. The interplay between these factors underscores the importance of climate-specific optimization when selecting window glazing systems.
In terms of practical application, replacing the standard double glazing with low-E vacuum glass (column radius 0.25 mm, spacing 40 mm) and doubling the area of the south window was considered the best solution. The inclusion of low-E coatings, which reflect infrared radiation, further enhances thermal performance by mitigating heat loss in winter and reducing cooling loads in summer.
The study also investigates the impact of window size modification on building energy consumption. While enlarging windows increases heat conduction losses, it also enhances solar heat gain, particularly for south-facing windows that receive substantial radiation in winter. The analysis introduces a ratio, SHGC/(UwindowUwall), as a key metric to determine whether the solar heat gain from larger windows outweighs the increased thermal losses. When this ratio remains below a critical threshold, expanding window size can improve energy efficiency. However, exceeding this threshold results in diminishing returns, where additional heat loss offsets solar gains, ultimately increasing energy demand.
These findings highlight the necessity of a holistic approach to window design, considering both material properties and spatial configurations. By comparing different window configurations and balancing heat gain and loss, designers can optimize window performance without resorting to complex energy simulations for each individual case. The results reaffirm that window modifications should be tailored to specific climatic conditions and building characteristics to achieve maximum efficiency.
Future research should further explore the long-term durability and performance stability of advanced glazing materials, as well as investigate the dynamic interaction between window modifications and HVAC system operation. In addition, more attention should be given to the impact of air infiltration on building energy efficiency, as it is often overlooked in research. Uncontrolled air infiltration can lead to additional heat loss or gain, reducing overall building efficiency and affecting the actual performance of various energy-saving technologies, including advanced window systems. Similarly, air circulation significantly affects both the indoor environment and the energy consumption of buildings. Modifying windows can also influence indoor air quality. Therefore, future research should take these factors into consideration [47]. Additionally, the choice of glass and shading strategies plays a key role in improving sustainability and reducing the carbon footprint of residential buildings. In future designs, the control of shading devices can be combined with window retrofit strategies to optimize overall building performance [48]. Therefore, future studies should not only incorporate experimental measurements and simulation analyses but also integrate real-world monitoring data to more accurately assess the impact of air infiltration on optimized window design strategies. This data-driven approach will help validate simulation-based findings, enhance the practical feasibility of energy-saving strategies, and promote the synergistic optimization of building envelopes and HVAC systems, ultimately improving overall building sustainability.

5. Conclusions

This study provides a comprehensive analysis of how different window types and sizes influence building energy efficiency, emphasizing the critical relationship between U-value, SHGC, and structural design parameters. The results confirm that increasing the number of glass layers and optimizing vacuum window configurations can effectively reduce energy consumption. Among the tested strategies, adopting low-E vacuum glass and expanding the south-facing window area to twice its original size proved to be the most effective solution, reducing the heating load by 7.01 GJ. In comparison, modifying only the window type without changing the size of the south-facing windows resulted in a reduction of 5.48 GJ. This represents a 27.9% improvement in energy savings achieved by the comprehensive optimization strategy.
Moreover, the study introduces a key ratio, SHGC/(UwindowUwall), to assess the impact of window size modifications. The findings suggest that increasing window size is beneficial when solar heat gain exceeds additional thermal losses, reinforcing the importance of carefully balancing heat conduction and solar heat gain effects. These insights contribute to a more nuanced understanding of energy-efficient window design and provide practical guidance for optimizing building performance in various climatic conditions.
Overall, this research underscores the importance of an integrated approach to window selection and design, ensuring that material properties, insulation performance, and solar gain are harmonized to achieve optimal energy efficiency. Future work should explore dynamic control strategies for smart glazing technologies and assess their real-world performance through experimental validation.

Author Contributions

Conceptualization, Y.Z. and S.O.; methodology, Y.Z., R.H. and S.O.; software, Y.Z. and R.H.; validation, Y.Z. and S.O.; formal analysis, Y.Z., R.H. and S.O.; investigation, Y.Z. and S.O.; resources, S.O.; data curation, Y.Z. and R.H.; writing—original draft preparation, Y.Z.; writing—review and editing, Y.Z., R.H. and S.O.; supervision, S.O. All authors have read and agreed to the published version of the manuscript.

Funding

This research received no external funding.

Institutional Review Board Statement

The study did not require ethical approval.

Informed Consent Statement

Not applicable.

Data Availability Statement

The data presented in this study are available upon request from the corresponding author.

Acknowledgments

Thanks to John Chilton for providing all the information and energy consumption data of the house.

Conflicts of Interest

The authors declare no conflicts of interest.

Abbreviations

The following abbreviations are used in this manuscript:
WWRwindow-to-wall ratio
SHGCSolar Heat Gain Coefficient
VTvisible transmittance

References

  1. Collins, L.C.; Natarajan, S.; Levermore, G. Climate change and future energy consumption in UK housing stock. Build. Serv. Eng. 2010, 31, 75–90. [Google Scholar] [CrossRef]
  2. Kolokotroni, M.; Ren, X.; Davies, M.; Mavrogianni, A. London’s urban heat island: Impact on current and future energy consumption in office buildings. Energy Build. 2012, 47, 302–311. [Google Scholar] [CrossRef]
  3. Office, M. Climate Summaries. Available online: https://www.metoffice.gov.uk/research/climate/maps-and-data/summaries/index (accessed on 8 October 2024).
  4. Tummala, S.; Kumar, D.R.V.; Narsimha, K.; Kosaraju, S.; Bobba, P.; Singh, S. Spatial Day Light Autonomy and Energy Analysis of a Residential Building for Different Climatic Conditions and Window-to-Wall Ratios. E3S Web Conf. 2020, 184, 01117. [Google Scholar] [CrossRef]
  5. Liu, J.; Liu, X.; Fan, H.; Zhang, Z.; Mao, P. Study on the Optimal Window and Wall Ratio of Village and Town Housing Based on Energy Consumption. Earth Environ. Sci. 2019, 219, 012021. [Google Scholar] [CrossRef]
  6. Lahmar, I.; Cannavale, A.; Martellotta, F.; Zemmouri, N. The Impact of Building Orientation and Window-to-Wall Ratio on the Performance of Electrochromic Glazing in Hot Arid Climates: A Parametric Assessment. Buildings 2022, 12, 724. [Google Scholar] [CrossRef]
  7. Albatayneh, A.; Atieh, H.; Jaradat, M.; Al-Omary, M.; Zaquot, M.; Juaidi, A.; Abdallah, R.; Manzano-Agugliaro, F. The Impact of Modern Artificial Lighting on the Optimum Window-to-Wall Ratio of Residential Buildings in Jordan. Appl. Sci. 2021, 11, 5888. [Google Scholar] [CrossRef]
  8. Shaeri, J.; Habibi, A.; Yaghoubi, M.; Chokhachian, A. The Optimum Window-to-Wall Ratio in Office Buildings for Hot–Humid, Hot–Dry, and Cold Climates in Iran. Environments 2019, 6, 45. [Google Scholar] [CrossRef]
  9. Dewi, O.C.; Rahmasari, K.; Hanjani, T.A.; Ismoyo, A.D.; Dugar, A.M. Window-to-Wall Ratio as a Mode of Daylight Optimization for an Educational Building with Opaque Double-Skin Façade. J. Sustain. Archit. Civ. Eng. 2022, 30, 142–152. [Google Scholar] [CrossRef]
  10. Ma, P.; Wang, L.-S.; Guo, N. Maximum window-to-wall ratio of a thermally autonomous building as a function of envelope U -value and ambient temperature amplitude. Appl. Energy 2015, 146, 84–91. [Google Scholar] [CrossRef]
  11. Fathi, S.; Kavoosi, A. Optimal Window to Wall Ratio Ranges of Photovoltachromic Windows in High-Rise Office Buildings of Iran. J. Daylighting 2021, 8, 134–148. [Google Scholar] [CrossRef]
  12. Liu, H.; Zhang, Z.; Ma, X.; Lu, W.; Li, D.; Kojima, S. Optimization Analysis of the Residential Window-to-Wall Ratio Based on Numerical Calculation of Energy Consumption in the Hot-Summer and Cold-Winter Zone of China. Sustainability 2021, 13, 6138. [Google Scholar] [CrossRef]
  13. Xue, P.; Li, Q.; Xie, J.; Zhao, M.; Liu, J. Optimization of window-to-wall ratio with sunshades in China low latitude region considering daylighting and energy saving requirements. Appl. Energy 2019, 233–234, 62–70. [Google Scholar] [CrossRef]
  14. Li, A.; Cheng, L.; Tao, Q.; Tang, Y.; Olofsson, T.; Kosonen, R. Optimized design and energy consumption simulation of window-wall ratio in Yanqui Library, Jimei University. E3S Web Conf. 2022, 356, 01056. [Google Scholar] [CrossRef]
  15. Chiesa, G.; Acquaviva, A.; Grosso, M.; Bottaccioli, L.; Floridia, M.; Pristeri, E.; Sanna, E. Parametric Optimization of Window-to-Wall Ratio for Passive Buildings Adopting A Scripting Methodology to Dynamic-Energy Simulation. Sustainability 2019, 11, 3078. [Google Scholar] [CrossRef]
  16. Mahdavi Adeli, M.; Sarhaddi, F.; Farahat, S. Parametric Study of the Impact of Windows to Wall Ratio on Reduction of Energy Consumption and Environmental Impact of a Zero-Energy Building in Different Orientations. J. Comput. Appl. Mech. 2019, 50, 295–302. [Google Scholar] [CrossRef]
  17. Li, J.; Zheng, B.; Chen, X.; Zhou, Y.; Rao, J.; Bedra, K.B. Research on Annual Thermal Environment of Non-Hvac Building Regulated by Window-to-Wall Ratio in a Chinese City (Chenzhou). Sustainability 2020, 12, 6637. [Google Scholar] [CrossRef]
  18. Yang, Q.; Liu, M.; Shu, C.; Mmereki, D.; Uzzal Hossain, M.; Zhan, X. Impact Analysis of Window-Wall Ratio on Heating and Cooling Energy Consumption of Residential Buildings in Hot Summer and Cold Winter Zone in China. J. Eng. 2015, 2015, 548254. [Google Scholar] [CrossRef]
  19. Yu, Z.; Zhang, W.L.; Fang, T.Y. Impact of Building Orientation and Window-Wall Ratio on the Office Building Energy Consumption. Appl. Mech. Mater. 2013, 409–410, 606–611. [Google Scholar] [CrossRef]
  20. Lago, T.G.S.; Ismail, K.A.R.; Lino, F.A.M. Ventilated double glass window with reflective film: Modeling and assessment of performance. Sol. Energy 2019, 185, 72–88. [Google Scholar] [CrossRef]
  21. Fang, Y.; Eames, P. The effect of glass coating emittance and frame rebate on heat transfer through vacuum and electrochromic vacuum glazed windows. Sol. Energy Mater. Sol. Cells 2006, 90, 2683–2695. [Google Scholar] [CrossRef]
  22. Fang, Y.; Eames, P.C.; Norton, B.; Hyde, T.J.; Zhao, J.; Wang, J.; Huang, Y. Low emittance coatings and the thermal performance of vacuum glazing. Sol. Energy 2007, 81, 8–12. [Google Scholar] [CrossRef]
  23. Ismail, K.A.R.; Salinas, C.T.; Henriquez, J.R. A comparative study of naturally ventilated and gas filled windows for hot climates. Energy Convers. Manag. 2009, 50, 1691–1703. [Google Scholar] [CrossRef]
  24. Onatayo, D.; Aggarwal, R.; Srinivasan, R.S.; Shah, B. A data-driven approach to thermal transmittance (U-factor) calculation of double-glazed windows with or without inert gases between the panes. Energy Build. 2024, 305, 113907. [Google Scholar] [CrossRef]
  25. Gasparella, A.; Pernigotto, G.; Cappelletti, F.; Romagnoni, P.; Baggio, P. Analysis and modelling of window and glazing systems energy performance for a well insulated residential building. Energy Build. 2011, 43, 1030–1037. [Google Scholar] [CrossRef]
  26. Urbikain, M.K.; Sala, J.M. Analysis of different models to estimate energy savings related to windows in residential buildings. Energy Build. 2009, 41, 687–695. [Google Scholar] [CrossRef]
  27. Tsikaloudaki, K.; Theodosiou, T.; Laskos, K.; Bikas, D. Assessing cooling energy performance of windows for residential buildings in the Mediterranean zone. Energy Convers. Manag. 2012, 64, 335–343. [Google Scholar] [CrossRef]
  28. Li, H.S.; Gao, Y.; Zhao, G.J.; Jing, Y.Z. Impact of Window-Wall Ratio on Air Conditioning Energy Consumption under Different Residential Using Modes in Guangzhou. Appl. Mech. Mater. 2013, 316–317, 1123–1127. [Google Scholar] [CrossRef]
  29. Ma, R.; Ma, R.; Long, E. Analysis of the rule of window-to-wall ratio on energy demand of residential buildings in different locations in China. Heliyon 2023, 9, e12803. [Google Scholar] [CrossRef]
  30. Troup, L.; Phillips, R.; Eckelman, M.J.; Fannon, D. Effect of window-to-wall ratio on measured energy consumption in US office buildings. Energy Build. 2019, 203, 109434. [Google Scholar] [CrossRef]
  31. Ozel, M.; Ozel, C. Effect of window-to-wall-area ratio on thermal performance of building wall materials in Elazig, Turkey. PLoS ONE 2020, 15, e0237797. [Google Scholar] [CrossRef]
  32. Veillette, D.; Rouleau, J.; Gosselin, L. Impact of Window-to-Wall Ratio on Heating Demand and Thermal Comfort When Considering a Variety of Occupant Behavior Profiles. Front. Sustain. Cities 2021, 3, 700794. [Google Scholar] [CrossRef]
  33. Goia, F. Search for the optimal window-to-wall ratio in office buildings in different European climates and the implications on total energy saving potential. Sol. Energy 2016, 132, 467–492. [Google Scholar] [CrossRef]
  34. Zhou, Z.H.; Hu, S.; Du, T. Study on Determination of Best Window-Wall Ratio of Office Building in Cold Area. Appl. Mech. Mater. 2012, 260–261, 209–216. [Google Scholar] [CrossRef]
  35. Budhiyanto, A. The Effect of the Window-to-Wall Ratio on Cooling Energy Usage and Comfort Temperature. DIMENSI J. Archit. Built Environ. 2017, 44, 189–194. [Google Scholar] [CrossRef]
  36. Caggiano, A.; Junlin, Z.; Longwei, Z. Multi objective optimization of window to wall ratio of University Gymnasium in severe cold area by coupling natural lighting and energy consumption. E3S Web Conf. 2021, 293, 02044. [Google Scholar] [CrossRef]
  37. Alibaba, H. Determination of Optimum Window to External Wall Ratio for Offices in a Hot and Humid Climate. Sustainability 2016, 8, 187. [Google Scholar] [CrossRef]
  38. Mangkuto, R.A.; Rohmah, M.; Asri, A.D. Design optimisation for window size, orientation, and wall reflectance with regard to various daylight metrics and lighting energy demand: A case study of buildings in the tropics. Appl. Energy 2016, 164, 211–219. [Google Scholar] [CrossRef]
  39. Bueno, B.; Cejudo-López, J.M.; Katsifaraki, A.; Wilson, H.R. A systematic workflow for retrofitting office façades with large window-to-wall ratios based on automatic control and building simulations. Build. Environ. 2018, 132, 104–113. [Google Scholar] [CrossRef]
  40. Altun, A.F. Determination of Optimum Building Envelope Parameters of a Room concerning Window-to-Wall Ratio, Orientation, Insulation Thickness and Window Type. Buildings 2022, 12, 383. [Google Scholar] [CrossRef]
  41. Szcześniak, J.T.; Ang, Y.Q.; Letellier-Duchesne, S.; Reinhart, C.F. A method for using street view imagery to auto-extract window-to-wall ratios and its relevance for urban-level daylighting and energy simulations. Build. Environ. 2022, 207, 108108. [Google Scholar] [CrossRef]
  42. Vukadinović, A.; Radosavljević, J.; Đorđević, A.; Protić, M. Influence of Facade Structure, Glazing Type, and Window-to-Wall Ratio on the Energy Performance of a Detached Residential Building with a Sunspace. J. Energy Eng. 2023, 149, 04022046. [Google Scholar] [CrossRef]
  43. Li, S.; Zou, K.; Sun, G.; Zhang, X. Simulation research on the dynamic thermal performance of a novel triple-glazed window filled with PCM. Sustain. Cities Soc. 2018, 40, 266–273. [Google Scholar] [CrossRef]
  44. Urbikain, M.K. Energy efficient solutions for retrofitting a residential multi-storey building with vacuum insulation panels and low-E windows in two European climates. J. Clean. Prod. 2020, 269, 121459. [Google Scholar] [CrossRef]
  45. Cho, S.; Kim, S.-H. Analysis of the Performance of Vacuum Glazing in Office Buildings in Korea: Simulation and Experimental Studies. Sustainability 2017, 9, 936. [Google Scholar] [CrossRef]
  46. Lee, W.; Kang, J.; Cho, S.W. A New Structure of Vacuum Insulation Glazing for Edge Effect Reduction: A Parametric Study. Int. J. Precis. Eng. Manuf. 2018, 19, 447–452. [Google Scholar] [CrossRef]
  47. Myroniuk, K.; Furdas, Y.; Zhelykh, V.; Adamski, M.; Gumen, O.; Savin, V.; Mitoulis, S.-A. Passive Ventilation of Residential Buildings Using the Trombe Wall. Buildings 2024, 14, 3154. [Google Scholar] [CrossRef]
  48. Amirat, Y.; Idouanaou, A.; Cherqi, O.; Malha, M.; Bah, A. Impact of Shading and Glazing Types of Trombe Walls on the Carbon Footprint of Residential Buildings in Morocco. E3S Web Conf. 2024, 572, 03002. [Google Scholar] [CrossRef]
Figure 1. Energy balance of window size modification on building energy consumption.
Sustainability 17 03258 g001
Figure 2. Architectural model with dimensions of the building.
Sustainability 17 03258 g002
Figure 3. Energy consumption of the building: (a) total electricity consumption; (b) total gas consumption.
Sustainability 17 03258 g003
Figure 4. Scatter plot of U-factor and heating load.
Sustainability 17 03258 g004
Figure 5. Scatter plot of SHGC and heating load.
Sustainability 17 03258 g005
Figure 6. Heatmap of heating load by U-factor and SHGC.
Sustainability 17 03258 g006
Table 1. Different parameters.
Gas TypeUnitAirArgonKryptonXenon
Thicknessm0.0080.0080.0080.008
Conductivity Coefficient AW/mK0.0028730.0022850.00094430.0004538
Conductivity Coefficient BW/mK20.00007760.000051490.000028260.00001723
Conductivity Coefficient CW/mK30000
Viscosity Coefficient AKg/ms0.000003720.000003380.000002210.00000107
Viscosity Coefficient BKg/msK0.000000050.000000060.000000080.00000007
Viscosity Coefficient CKg/msK20000
Specific Heat Coefficient AJ/kgK1002.737521.9285278248.0906982158.3397064
Specific Heat Coefficient BJ/kgK20.012324000
Specific Heat Coefficient CJ/kgK30000
Molecular Weightg/mol28.9739.94883.8131.3
ThicknessmAirArgonKryptonXenon
Conductivity Coefficient AW/mK0.0080.0080.0080.008
Conductivity Coefficient BW/mK20.0028730.0022850.00094430.0004538
Conductivity Coefficient CW/mK30.00007760.000051490.000028260.00001723
Viscosity Coefficient AKg/ms0000
Viscosity Coefficient BKg/msK0.000003720.000003380.000002210.00000107
Table 2. The parameters of the vacuum windows.
SpacingU-FactorSHGCVT
(mm)(W/m2·K)
Vacuum Radius 1.5 mm203.7110.7590.814
253.3230.760.814
303.0430.7610.814
352.8420.7620.814
402.6950.7620.814
Vacuum Radius 1.0 mm203.3560.760.814
253.0150.7610.814
302.7860.7620.814
352.6280.7620.814
402.5170.7630.814
Vacuum Radius 0.5 mm202.8550.7620.814
252.6190.7630.814
302.4750.7630.814
352.3810.7630.814
402.3180.7640.814
Vacuum Radius 0.25 mm202.5170.7630.814
252.3760.7630.814
302.2940.7640.814
352.2430.7640.814
402.2090.7640.814
Vacuum low-e Radius 1.5 mm203.2680.3880.69
252.6590.380.69
302.1830.3740.69
351.8190.370.69
401.5390.3660.69
Vacuum low-e Radius 1.0 mm202.7140.3810.69
252.1330.3740.69
301.7130.3680.69
351.4080.3640.69
401.1840.3620.69
Vacuum low-e Radius 0.5 mm201.8420.370.69
251.390.3640.69
301.0970.3610.69
350.9010.3580.69
400.7640.3560.69
Vacuum low-e Radius 0.25 mm201.1840.3620.69
250.8890.3580.69
300.7120.3560.69
350.5990.3540.69
400.5230.3530.69
Table 3. Energy consumption of original building and base case building ( electricity consumption including fan consumption).
BuildingsGas Consumption (GJ)Electricity Consumption (GJ)
Original Wall Building 165.966.27
Actual Values (Average) 272.567.52
Common Cavity Wall Building 3148.2712.77
1 The simulation results of the original building. 2 The measurement data of the original building. 3 The base case building for this project.
Table 4. Parameters and energy consumption with different windows.
SpacingSHGC/(Uwindow − Uwall)Heating Load 1 1 (2) 2Difference Value
(mm) (GJ) (GJ)
Double air 0.65148.27 (147.31)0.96
Triple air 3.23145.55 (144.25)1.3
Double argon 0.82147.4 (146.33)1.07
Triple argon 84.62144.74 (143.32)1.42
Double Krypton 1.10146.43 (145.21)1.22
Triple Krypton −3.30143.82 (142.28)1.54
Double Xenon 1.15146.17 (144.89)1.28
Triple Xenon −2.59143.53 (141.92)1.61
Vacuum
Radius 1.5 mm
200.39150.51 (149.86)0.65
250.49149.12 (148.28)0.84
300.60148.05 (147.06)0.99
350.71147.27 (146.17)1.1
400.82146.71 (145.53)1.18
Vacuum
Radius 1.0 mm
200.48149.24 (148.42)0.82
250.61147.94 (146.94)1
300.75147.06 (145.93)1.13
350.88146.45 (145.24)1.21
401.02146 (144.73)1.27
Vacuum
Radius 0.5 mm
200.70147.32 (146.23)1.09
250.89146.4 (145.18)1.22
301.08145.84 (144.54)1.3
351.24145.47 (144.12)1.35
401.38145.21 (143.82)1.39
Vacuum
Radius 0.25 mm
201.02146 (144.73)1.27
251.25145.45 (144.1)1.35
301.45145.12 (143.72)1.4
351.60144.92 (143.49)1.43
401.72144.78 (143.33)1.45
Vacuum low-e Radius 1.5 mm200.26154.03 (154.12)−0.09
250.43151.81 (151.59)0.22
300.90150.01 (149.54)0.47
356.98148.6 (147.92)0.68
40−1.61147.35 (146.5)0.85
Vacuum low-e Radius 1.0 mm200.40152.01 (151.82)0.19
251.02149.82 (149.31)0.51
30−6.94148.19 (147.46)0.73
35−1.02146.65 (145.69)0.96
40−0.62145.8 (144.6)1.1
Vacuum low-e Radius 0.5 mm204.87148.69 (148.03)0.66
25−0.97146.57 (145.6)0.97
30−0.54145.33 (144.17)1.16
35−0.41144.48 (143.2)1.28
40−0.36143.87 (142.51)1.36
Vacuum low-e Radius 0.25 mm20−0.62145.7 (144.6)1.1
25−0.41144.42 (143.14)1.28
30−0.34143.64 (142.24)1.4
35−0.30143.13 (141.66)1.47
40−0.28142.79 (141.26)1.53
1 The heating load when the south window was the original size. 2 The heating load when the south window is twice the size.
Disclaimer/Publisher’s Note: The statements, opinions and data contained in all publications are solely those of the individual author(s) and contributor(s) and not of MDPI and/or the editor(s). MDPI and/or the editor(s) disclaim responsibility for any injury to people or property resulting from any ideas, methods, instructions or products referred to in the content.

