Abstract
Based on panel data from 30 Chinese provinces from 2012 to 2022, this study empirically examines the impact of new-quality productivity on environmental pollution and explores the underlying mechanisms. A multidimensional index system is constructed to measure new-quality productivity, incorporating new laborers, new labor materials, new labor objects, new technologies, new production organizations, and new data elements. The results indicate that the development of new-quality productivity significantly reduces environmental pollution levels, a conclusion that remains robust after a series of robustness and endogeneity tests. Mechanism analysis reveals that green finance plays a partial mediating role in the pollution-reducing effect of new-quality productivity, with the mediating effect accounting for 11.7%. Regional heterogeneity analysis shows that the environmental improvement effect of new-quality productivity is significant in the eastern and northeastern regions but relatively weaker in the central and western regions. Based on these findings, this study proposes a three-pronged policy framework that integrates “factor upgrading, mechanism innovation, and region-specific adaptation”, emphasizing the enhancement of new-quality productivity, the development of green finance, and regionally differentiated development strategies to better mitigate environmental pollution. This study provides empirical evidence on the environmental governance effects of new-quality productivity and offers theoretical insights for developing countries seeking to resolve the “growth-pollution” paradox and optimize regional green transition pathways.
1. Introduction
During the process of globalization, the complex crises of environmental pollution and climate change are accelerating the erosion of the legitimacy of traditional development paradigms, compelling nations to explore new pathways that reconcile economic growth with ecological protection [1]. Since the initiation of economic reforms and opening up, China has experienced rapid economic development. However, the long-term reliance on an extensive growth model has led to significant resource consumption and pollutant emissions. As a responsible major power and a key participant in the restructuring of the global industrial system and technological revolution, China is leveraging new-quality productivity—characterized by disruptive technological innovation, a green and low-carbon orientation, and enhanced total factor productivity—to construct an environmental governance model [2]. This model offers both localized practical value and internationally relevant insights for addressing the “growth-pollution” paradox [3]. By systematically analyzing the environmental governance logic behind China’s new-quality productivity, this study aims to provide valuable lessons for countries in the Global South seeking to overcome development dilemmas, while also offering useful references for developed nations to optimize technological transformation pathways. Ultimately, it contributes to the construction of a more inclusive international environmental governance framework capable of addressing global environmental challenges and advancing the realization of global sustainable development goals.
2. Literature Review
As China enters the era of Industry 4.0, new-quality productivity is gradually becoming a key driver of high-quality economic development, playing a crucial role in transforming the economic development model and advancing ecological civilization. This new-quality productivity is characterized by innovation-led growth, a break from traditional economic expansion patterns, and features such as high technology, high efficiency, and high quality, aligning with the principles of the new development paradigm [4]. Existing literature on new-quality productivity primarily focuses on measuring and analyzing its evolution [5,6] as well as its impact on total factor productivity [7], high-quality economic development [8], and innovation performance [9]. Meanwhile, research on the determinants of environmental pollution is also extensive, with studies examining its causes and mitigation pathways from various perspectives, including economic growth [10,11], foreign direct investment [12], industrial structure [13], environmental regulation [14], fiscal decentralization [15], and population agglomeration [16].
In the current academic research field, theoretical exploration of the relationship between new-quality productivity and environmental pollution is relatively scarce. Existing studies primarily focus on analyzing the relationship between new-quality productivity and green development. Du and Ye (2024) [17] delved into the theoretical logic, value implications, and practical pathways of how new-quality productivity empowers green development, emphasizing that through diverse approaches—such as green technological innovation, policy support, industrial expansion, and energy innovation—new-quality productivity opens new pathways and injects strong momentum into green development. Ye and Chen (2024) [18] systematically analyzed the dynamic process of new-quality productivity driving green development from the following three dimensions: mechanisms, challenges, and pathways. They clarified that new-quality productivity achieved green development goals by optimizing the combination of factors, driving technological innovation, and upgrading industries. Yue and Qu (2024) [19] focused on the green development dimension of new-quality productivity, proposing that new-quality productivity consists essentially of green productive forces, and that their development must strictly adhere to the principles of green development to achieve the vision of harmonious coexistence between humans and nature. Zhong and Wu (2024) [20] innovatively introduced the concept of “ecological new-quality productivity”, highlighting its critical role in driving high-quality development and realizing the vision of “harmonious coexistence between humans and nature”. Guo and Fang (2024) [21], from a materialist historical perspective, deeply elaborated on the ecological connotations of new-quality productivity, arguing that new-quality productivity represented a novel form of Marxist productivity theory, carrying profound ecological implications. Li and Xu (2024) [22] explored the ecological implications of new-quality productivity from the following three dimensions: ecological connotation, ecological thinking, and ecological orientation, highlighting their key role in promoting green development and advancing China’s modernization process.
In summary, existing academic research has extensively explored new-quality productivity, with numerous studies providing strong evidence of its close connection to green development. The progression of new-quality productivity contributes to achieving sustainable ecological development, laying a solid foundation and offering key references for this study. Against this backdrop, several critical questions arise. For example, can new-quality productivity effectively mitigate environmental pollution? If so, through what mechanisms? And which regions benefit the most? Addressing these questions not only enriches the research on the development of new-quality productivity but also holds practical significance for promoting environmental sustainability.
3. Theoretical Analysis and Research Hypothesis
3.1. The Direct Effect of New-Quality Productivity on Environmental Pollution
For the tangible elements of new-quality productivity, new laborers contribute to ecological values and green skill development through an increasing proportion of higher-educated individuals, driven by intensified education investment and an optimized student structure. This shift encourages employment preferences to transition from traditional resource-intensive industries to knowledge-intensive and low-carbon service sectors. Meanwhile, the growing workforce in strategic emerging industries reduces the labor supply for pollution-intensive sectors, compelling enterprises to adopt cleaner production technologies. Additionally, the rise in innovative human capital investment and entrepreneurial activity fosters market-driven pollution control mechanisms through the development of green technologies and the emergence of environmentally friendly startups. Intelligent tools, such as industrial robots and digital infrastructure, enhance precision in resource utilization, effectively minimizing raw material waste. Furthermore, advancements in remote control and autonomous operation capabilities break the dependence of traditional production on physical space, thereby reducing land occupation and ecological disruption, ultimately alleviating environmental burdens. This exemplifies how new means of labor within new-quality productivity can mitigate pollution at the production stage. Similarly, new objects of labor—such as renewable energy and advanced materials—serve as substitutes for conventional petrochemical resources, reducing pollution at the source. Moreover, as the number of publicly listed companies in the new materials sector increases, capital market incentives accelerate investments in environmentally friendly material research and development, reinforcing the effect of source pollution substitution.
Among the diffusion-oriented elements, new technologies within new-quality productivity contribute to environmental sustainability through the exponential growth in high-tech R&D personnel and funding. This facilitates advancements in carbon capture technologies and enhances the efficiency of microbial soil remediation. Additionally, the application of disruptive innovations, such as hydrogen metallurgy and carbon capture, utilization, and storage (CCUS), is transforming industrial processes in sectors like steel and chemicals, enabling carbon neutrality at the production stage. Within new production organizations, the increasing number of artificial intelligence (AI) enterprises is driving the intelligent transformation of pollution control. For instance, AI algorithms have reduced emergency response times for air pollution incidents to as little as two hours. Furthermore, improvements in enterprise digitalization enable production process reengineering, thereby minimizing hazardous waste generation. The integration of industrial pollution control investments, agricultural non-point source pollution management, and industrial solid waste utilization foster a closed-loop system based on the principles of “polluter pays–third-party governance–resource reutilization”. Regarding new data elements, the expansion of the digital economy has facilitated the development of large-scale environmental data platforms, achieving pollution source localization with meter-level precision and significantly improving monitoring coverage. Meanwhile, the advancement of rural digitalization, particularly through agricultural Internet of Things (IoT) technologies, optimizes the application of fertilizers and pesticides, thereby reducing pollution loads. In summary, new-quality productivity exerts a comprehensive mitigating effect on environmental pollution through the synergistic interaction of their six key components—subjects, tools, objects, technologies, organizations, and data—addressing pollution across multiple dimensions.
Hypothesis (H1).
New quality productivity can mitigate environmental pollution.
Hypothesis (H2).
The inhibitory effects of different components of new-quality productivity on environmental pollution vary.
3.2. Analysis of the Intermediary Effect of Green Finance
The direct inhibitory effect of green finance on environmental pollution primarily manifests through the targeted allocation of financial resources and market constraint mechanisms. By establishing an environmental credit assessment system, green finance enforces an “environmental veto system” for high-pollution enterprises, restricting their access to credit and increasing their financing costs, thereby compelling them to downscale production [23,24]. Simultaneously, green credit policies adjust interest rate pricing mechanisms to internalize environmental risks into corporate financing costs, imposing market-driven constraints on pollution-intensive industries [25]. Furthermore, financial instruments such as green bonds channel capital specifically into environmental projects, creating a crowding-out effect that diverts financing away from traditional polluting industries and directly reduces pollution sources [26].
Given the close intrinsic connection between new-quality productivity and green finance, the development of new-quality productivity theoretically promotes the expansion of green finance. From the perspective of Schumpeter’s innovation theory, new-quality productivity is fundamentally driven by innovation and requires substantial financial support. Green finance facilitates this process by providing funding for technological innovation and industrial upgrading, thereby advancing new-quality productivity while simultaneously expanding its own market scope and investment opportunities. Moreover, according to Porter’s hypothesis, the development of new-quality productivity is often accompanied by stringent environmental regulations, prompting enterprises to increase investments in green technologies and green finance. This enables a transition toward low-carbon, sustainable development while enhancing total factor productivity, ultimately accelerating the growth of green finance. From an industrial linkage perspective, the advancement of new-quality productivity the green transformation, and the upgrading of related industries, which are closely interconnected with green finance. Green finance provides capital support to industries associated with new-quality productivity, while the development of these industries, in turn, generates greater business opportunities and market demand for green finance, expanding its scale and improving its efficiency.
In summary, new-quality productivity indirectly contributes to mitigating environmental pollution by fostering the development of green finance.
Hypothesis (H3).
New-quality productivity can indirectly mitigate environmental pollution by promoting green finance.
3.3. Analysis of Regional Heterogeneity of Environmental Pollution Caused by New-Quality Productivity
The impact of new-quality productivity on environmental pollution exhibits significant regional heterogeneity across China.
In the eastern region, characterized by high levels of economic development, abundant capital, strong technological innovation capacity, and a well-established market system, favorable conditions exist for the growth of new-quality productivity. These factors facilitate technological advancements and industrial upgrading, thereby enhancing the capacity to mitigate environmental pollution.
The central region benefits from a relatively balanced industrial structure, a strategic geographical location, and convenient transportation, providing a broad market base and expansion potential for new-quality productivity. However, its relatively lower economic development level, weaker capital accumulation, and limited technological capabilities hinder research and innovation, potentially constraining the effectiveness of new-quality productivity in reducing pollution.
The western region is rich in natural resources and undergoing accelerated industrial restructuring, with emerging industries showing strong growth momentum. These conditions offer essential raw materials, resource security, and vast market opportunities for new-quality productivity. However, the region’s relatively low economic development level, underdeveloped market system, and shortage of skilled technological talent may impede the advancement of new-quality productivity and its environmental benefits.
The northeastern region possesses a well-established industrial system and high-level research institutions and enterprises, providing a strong industrial foundation and technological support for the development of new-quality productivity. However, the dominance of state-owned enterprises and traditional industries, coupled with the relatively small proportion of emerging and high-tech industries, results in a less flexible institutional framework, a lower degree of marketization, and significant talent outflows. These structural challenges, along with severe environmental pollution, may limit the effectiveness of new-quality productivity in mitigating pollution [27].
Hypothesis (H4).
The mitigating effect of new-quality productivity on environmental pollution varies by region.
4. Research Design
4.1. Variable Definition and Measurement
Drawing on the research findings of Yin and Sun (2024), the comparison between traditional productive forces and new-quality productivity can be summarized in Table 1 [28]. Given the substantial differences between new and traditional productive forces, conventional measurement methods for traditional productive forces—such as the Solow residual method, growth accounting method, and frontier analysis—may not effectively capture the characteristics of new-quality productivity. Therefore, constructing a comprehensive indicator system for measuring new-quality productivity presents a more suitable approach.

Table 1.
The contrast between traditional productivity and new-quality productivity.
Given the rich theoretical connotations of new-quality productivity, this study adopts a political economy perspective and focuses on its core essence, which involves laborers, labor materials, labor objects, and the significant improvements achieved through their optimized combination. On the one hand, new-quality productivity is rooted in substantive elements such as new laborers, labor materials, and labor objects. On the other hand, the importance of penetrating factors such as new technologies, production organizational methods, and data elements is becoming increasingly prominent, as these factors drive the leap from substantive elements to more optimal combinations.
Based on an in-depth analysis of the intrinsic nature of new-quality productivity, and drawing comprehensively from Table 1 [28] as well as the research findings of scholars such as Han et al. (2024) [8] and Lu et al. (2024) [6] on measuring new-quality productivity, this study constructs a measurement framework using six primary indicators. These include three tangible factors—new laborers, new labor materials, and new labor objects—and three diffusion factors—new technologies, new production organization, and new data elements.
New laborers are measured using seven indicators, including the number of employees in emerging industries, the proportion of higher education graduates, education expenditure intensity, student structure, investment in innovative human capital, and entrepreneurial activity. These indicators reflect differences in workforce size, quality, employment mindset, and entrepreneurial spirit.
New labor materials are assessed using the following three indicators: Industrial robot penetration, digital infrastructure, and traditional infrastructure. These represent the tools and facilities encompassed by new labor materials.
New labor objects capture variations in energy and materials, using the following five indicators: energy intensity, the number of ultra-high-voltage transmission lines, renewable energy consumption, the output value of the new materials industry, and the number of listed enterprises in the new materials sector.
New technologies are measured using six indicators, namely, the number of high-tech R&D personnel, high-tech R&D investment, the number of high-tech R&D institutions, innovation R&D, innovative industries, and innovative products); these indicators reflect R&D investment and outcomes in new technology development.
New production organization is assessed through the following five indicators to capture its intelligence and environmental sustainability: The number of AI enterprises, corporate digitalization level, completed investments in industrial pollution control, agricultural pollution management, and waste utilization. Among them, considering the concentration and strong traceability of industrial pollution, agricultural pollution is characterized by dispersion, concealment, and multi-source nature, making it difficult to measure through a single investment amount. Therefore, two different measurement methods are chosen. This approach involves synthesizing multiple indicators into one, aiming to utilize the information from multiple indicators to achieve a better and more comprehensive measurement.
New data elements encompass the following three indicators: the digital economy, corporate digitalization, and rural digitalization levels.
The specific calculation methods for each indicator are detailed in Table 2.
Table 2.
Evaluation index system of the new-quality productivity force development level.
Specifically, the measurement of industrial robot penetration draws on the methods used by Acemoglu and Restrepo (2020) [29] as well as Wang and Dong (2020) [30]. The data sources for this study are diverse and extensive, covering the International Federation of Robotics (IFR), the Ministry of Industry and Information Technology, corporate annual reports, the Tianyancha platform, the National Bureau of Statistics official website, and authoritative statistical yearbooks such as the China Statistical Yearbook, China Rural Statistical Yearbook, China Science and Technology Statistical Yearbook, China Environmental Statistical Yearbook, China Social Statistical Yearbook, and China Energy Statistical Yearbook. The study also incorporates data from Peking University’s Digital Finance Research Center and provincial statistical yearbooks. For missing data, interpolation methods are employed to scientifically supplement gaps, ensuring the completeness and consistency of the data. The research period is set from 2012 to 2022. Due to data availability constraints and the substantial missing data in the Tibet region, the study sample includes 30 provinces of China (excluding Hong Kong, Macau, Taiwan, and Tibet).
The development level of new-quality productivity is influenced to varying degrees by different fundamental indicators. Therefore, the first step in assessing this level through an indicator system is to establish a method for assigning weights. Given that subjective weighting methods rely on the personal judgment of the assigner to allocate weights to each indicator, it is difficult to avoid the influence of subjective bias in practical operations. Therefore, this study adopts the entropy method, an objective weighting approach, to allocate the weights of the indicators: First, all indicators are normalized. Second, the proportion, information entropy, and redundancy of each indicator are calculated. Finally, based on this information, the weights for each indicator are determined. The overall index score is then obtained through weighted calculations Wang et al. (2021) [31]. Due to the small weight coefficients of the indicators, four decimal places are retained in parentheses in Table 2.
4.2. Model Construction
The following model is constructed to examine the direct impact of new-quality productivity on environmental pollution:
The core explanatory variable, , represents the development level of new-quality productivity in region i at time t.
The dependent variable, , represents the level of environmental pollution in region i at time t. In environmental pollution research, the “three wastes”—waste gas, wastewater, and solid waste—are widely used [16]. However, due to data availability constraints, the statistical yearbooks only publish the emissions of industrial sulfur dioxide (SO2), industrial smoke (Smoke), and industrial wastewater (Water). Since these three pollutants are non-additive and have different units, considering these factors, this study follows the approach of Wang and Sun (2017) [32] and normalizes the “three wastes” using the entropy method. The weight coefficients for each year are calculated, and the weighted sum is then used to derive a composite pollution emission index for each industry, which serves as the measure for environmental pollution levels.
represents a series of control variables that may influence environmental pollution, including the following: labor force level (lfl), measured by the natural logarithm of the number of employed persons; tax burden level (tbl), measured as tax revenue divided by regional GDP; informationization level (il), measured by the total volume of postal and telecommunications services divided by regional GDP; urbanization level (ul), measured by the ratio of the permanent urban population to the total population within a given region; degree of openness (doo), measured as the total value of the imports and exports * exchange rate of USD to RMB, divided by regional GDP.
Additionally, the model also controls for province-fixed effects, , and time-fixed effects, , to account for inherent differences between provinces and the overall growth trend of new-quality productivity at the national level. represents the random error term.
4.3. Research Sample and Descriptive Statistical Analysis
The descriptive statistics of the variables are shown in Table 3.
Table 3.
Descriptive statistics for each variable.
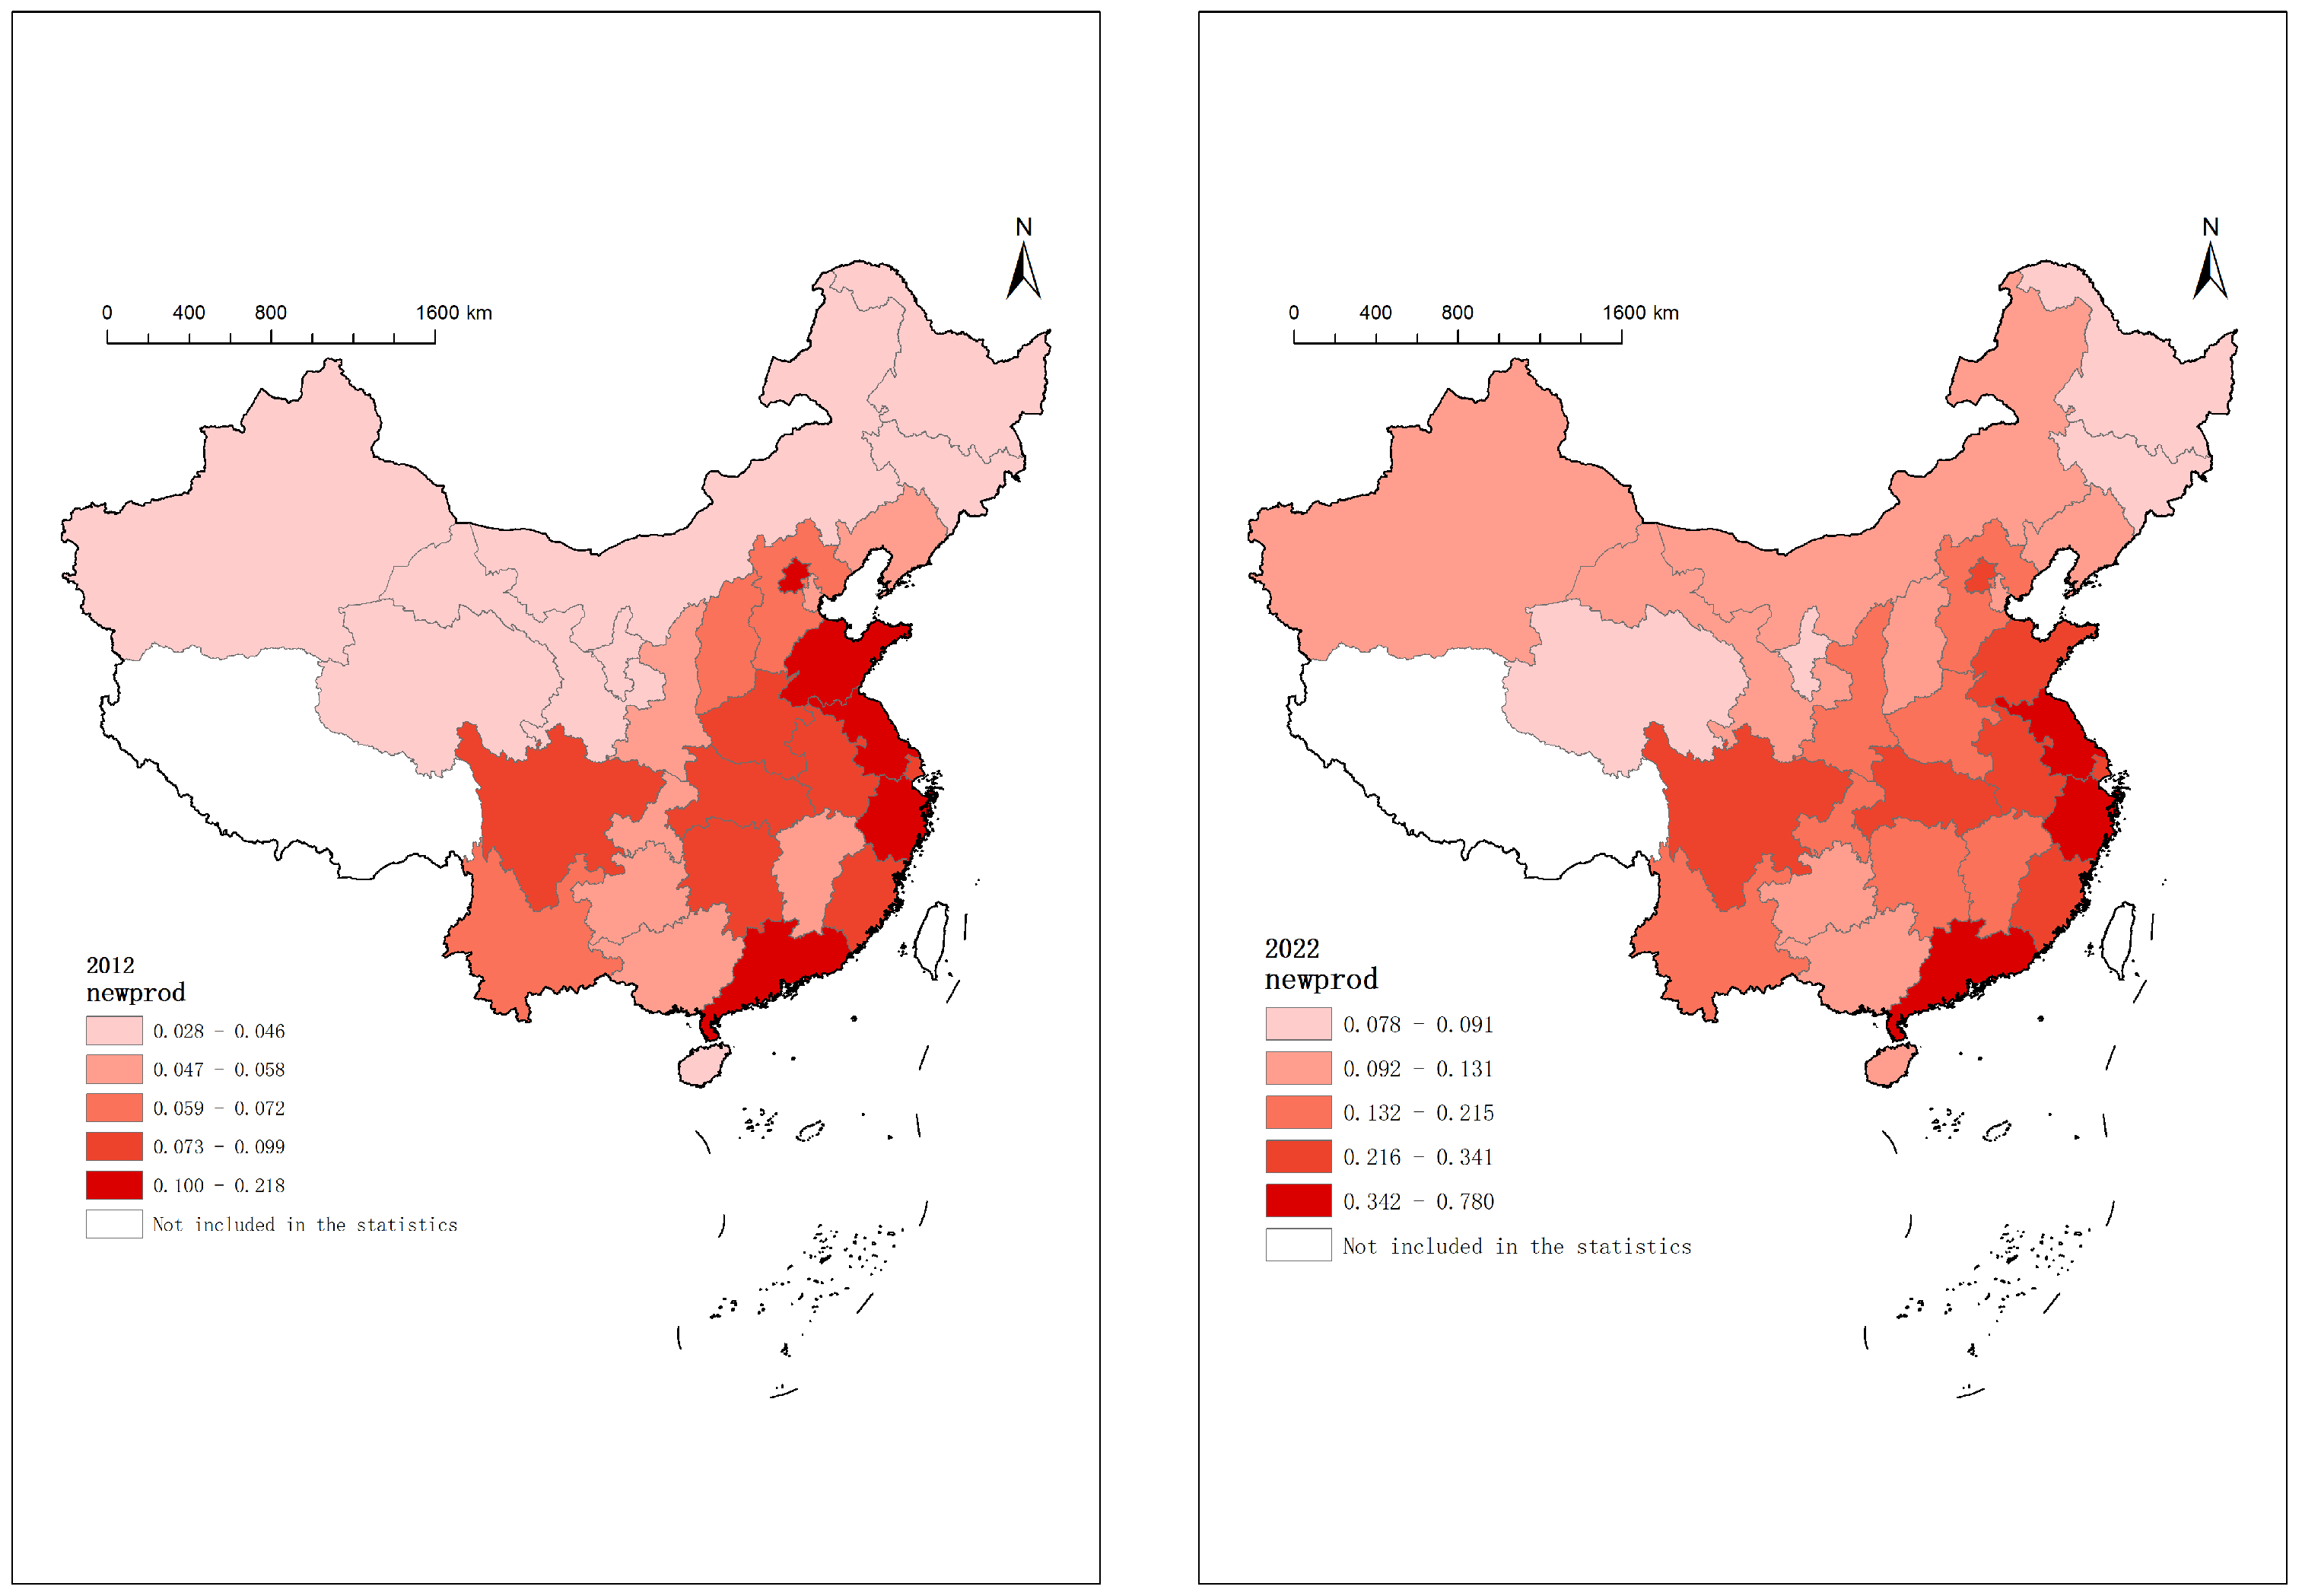
Figure 1 shows the development of new-quality productivity in 2012 and 2022. It uses the 2019 map of China—drawing no. GS (2019) 1822. The white part in Figure 1 indicates that it is not included in these statistics.
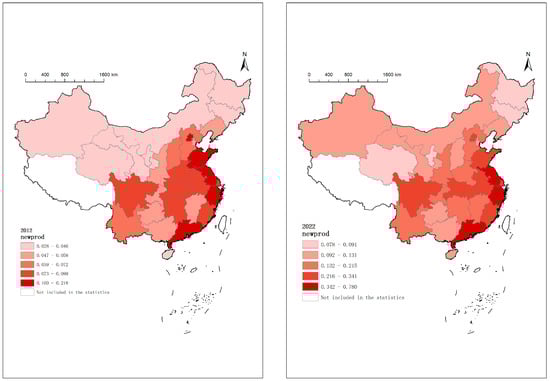
Figure 1.
New-quality productivity in 2012 and 2022.
5. Empirical Results and Analysis
5.1. Baseline Results Analysis
Table 4 presents the impact of the level of new-quality productivity on environmental pollution. Model (1) does not include control variables or fixed effects, while Models (2) and (3) progressively add two types of fixed effects and control variables. All three regressions show that the development of new-quality productivity significantly reduces environmental pollution, and this conclusion is statistically significant at the 1% level. To ensure the robustness and generalizability of these findings, Models (4), (5), and (6) apply different robustness checks: Model (4) excludes data from the year 2020. Model (5) applies a 1% winsorization to all data before conducting the regression. Model (6) replaces the core explanatory variable with the new-quality productivity index calculated using the entropy weight–TOPSIS method. The results of Models (4)–(6) remain significant at the 1% level, further confirming that new-quality productivity significantly mitigates environmental pollution. Thus, Hypothesis 1 (H1) is supported.
Table 4.
The impact of new-quality productivity on environmental pollution.
The above results are consistent with the expectations of this study. The underlying logic is that the development of new-quality productivity is often accompanied by technological innovation and industrial upgrading, which encourages firms to adopt more efficient production technologies and environmentally friendly management practices, thereby reducing pollutant emissions. In addition, regarding the control variables: Labor force level (lfl) shows a significant positive effect in Model (3), meaning that an increase in the labor force may lead to a rise in environmental pollution. This is likely because more labor input often accompanies an expansion of the production scale, which increases energy consumption and waste emissions. Tax burden level (tbl) exhibits a significant negative effect in Model (3), indicating that a higher tax burden effectively reduces environmental pollution. This may be due to tax policies constraining the polluting behavior of firms, forcing them to adopt more environmentally friendly production methods. The urbanization level (ul) also shows a significant negative impact in Model (3). Urbanization can effectively improve environmental quality through multiple mechanisms such as structural transformation, scale effects, and technology diffusion. The higher the urbanization ratio, the more it can promote the economic structure transformation effect, that is, shifting the economic focus from the highly polluting primary industry (agriculture) to the low-emission tertiary industry (services), thereby increasing the proportion of services and reducing energy consumption per unit of GDP, which in turn lowers pollutant emissions. It can also fully leverage the scale effect of infrastructure, for instance, the development of rail transit networks reduces per capita transportation carbon emissions compared to dispersed living. Moreover, it promotes the intensification of energy utilization, such as centralized heating systems having higher thermal efficiency and lower energy consumption per unit compared to decentralized heating. Regarding the mechanism of technological innovation diffusion, it is mainly reflected in digital technology empowerment. For example, Hangzhou’s City Brain optimizes traffic flow to reduce exhaust emissions. And Meituan’s intelligent delivery system reduces delivery mileage through the optimal path algorithm, which also saves energy consumption. The informationization level (il), however, does not have a significant effect on environmental pollution in Model (3). Although the improvement in informationization has—to some extent—promoted the application of environmental protection technologies, this effect is not yet strong enough to produce a significant impact at the current stage. Finally, the degree of openness (doo) also shows no significant effect on environmental pollution in Model (3). This may be due to the complex and bidirectional effects of openness on environmental pollution, such as technology introduction and changes in trade structure, which may offset each other to some extent, leading to no significant overall impact.
5.2. Endogenous Issue
In empirical econometric analysis, addressing endogeneity is crucial. Endogeneity arises when explanatory variables are correlated with the error term, leading to biased estimates and compromising the accuracy and reliability of conclusions. Although this study incorporates a range of control variables and employs a two-way fixed effects model to mitigate endogeneity, potential concerns may still remain. Following the approach adopted by some scholars, we use the one-period lagged value of new-quality productivity as an instrumental variable (IV). This choice is justified for two reasons: (1) Relevance: The lagged new-quality productivity is highly correlated with current new-quality productivity, satisfying the instrument relevance condition. (2) Exogeneity: A lagged value of new-quality productivity does not directly affect the dependent variable (environmental pollution) in the current period, meeting the instrument exogeneity condition. Thus, we incorporate the one-period lagged new-quality productivity as an instrumental variable in the analysis, with the results presented in Table 5: Model (1) shows the regression results using lagged new-quality productivity as an instrument. Model (2) reports the regression results of new-quality productivity on environmental pollution after addressing endogeneity. Tests for under-identification, over-identification, and weak instruments all reject the null hypothesis, indicating that the instrumental variable is appropriately selected. These results confirm that after controlling for endogeneity, new-quality productivity still significantly reduces environmental pollution.
Table 5.
The results of the instrumental variables method.
Considering that a single approach to addressing endogeneity may lack robustness, we further employ the generalized method of moments (GMM) for validation. Specifically, we incorporate the one-period lagged dependent variable (evp) as an additional explanatory variable in the regression model, while maintaining the one-period lagged new-quality productivity as the instrumental variable. The Difference-GMM regression results are presented in Table 6. After addressing endogeneity using GMM, the findings remain consistent: new-quality productivity continues to significantly reduce environmental pollution. This further reinforces the robustness and reliability of our conclusions.
Table 6.
Results of the generalized method of moments test.
6. Further Analysis
In order to make the subsequent regression results more reliable, and taking into account the exogenous impact of the new crown epidemic, the Chinese government has implemented relatively strict control measures to safeguard people’s lives, including limiting some production activities and controlling population movement. These behaviors may affect the stability of the model results and make the model estimates biased. Therefore, the next robustness test is based on the unified deletion of the 2020 sample data to ensure that the model results reflect the long-term stable relationship between variables, rather than the interference of short-term shocks.
6.1. Mechanism Analysis and Robustness Test
This study takes a novel approach by exploring the mechanisms through which new-quality productivity reduces environmental pollution. Based on the above theory, this study references the mediation effect model proposed by Wen et al. (2004) [33] and constructs the following model to examine the indirect impact of new-quality productivity on environmental pollution:
Green finance () represents the mediating variable. Currently, China’s green finance mainly includes green credit, green securities, green insurance, and green investment [34,35]. Other variables are consistent with those in Model (2).
In the three equations, in Equation (2) represents the total effect of new-quality productivity on environmental pollution; in Equation (4) captures the direct effect; and * reflect the mediating effects. The mediation effect test involves the following steps: Step 1: Perform a regression analysis on Equation (2) to test the significance of the . If it is significantly negative, it indicates that new-quality productivity has a significant impact on environmental pollution, allowing us to proceed with the mediation test. Otherwise, the test is halted. Step 2: Perform a regression analysis on Equation (3) to examine whether the of new-quality productivity on the mediator variable is significant. If it is significantly positive, this suggests that new-quality productivity promotes the mediator variable. Step 3: Conduct a regression on Equation (4); if coefficients and are significantly negative and the absolute value of coefficient is less than the absolute value of coefficient , this indicates the presence of partial mediation. If is not significant and is significant, this indicates that the mediator variable has played a complete mediating role. The test results are presented in Table 7.
Table 7.
The mechanism of action of new-quality productivity in reducing environmental pollution.
From the results in Table 7, Model (1) shows the regression results with environmental pollution (evp) as the dependent variable and new-quality productivity (newprod) as the core explanatory variable. Model (2) presents the regression results with green finance (gf) as the dependent variable and new-quality productivity (newprod) as the core explanatory variable. Model (3) shows the regression results with environmental pollution (evp) as the dependent variable and both new-quality productivity (newprod) and green finance (gf) as core explanatory variables.
According to the results in Model (1) of Table 7, the regression coefficient of new-quality productivity on environmental pollution is −0.299. The coefficient is negative and significant at the 1% level, indicating that for each unit increase in the development level of new-quality productivity, the environmental pollution index decreases by 0.299 units. In Model (2), the regression coefficient of new-quality productivity is 0.064, which is positive and significant at the 1% level, suggesting that new-quality productivity has a significant positive impact on green finance. Green finance, in turn, mediates the effect of new-quality productivity on environmental pollution. Finally, in Model (3), the regression coefficient for new-quality productivity is −0.264, and for green finance, it is −0.480. Both coefficients pass the significance test at the 1% level. Since in Model (1) the regression coefficient for new-quality productivity is −0.299, which in absolute value is larger than −0.264; this indicates the presence of a partial mediation effect of green finance in the relationship between new-quality productivity and environmental pollution. The mediation effect is 0.035, accounting for 11.7% of the total effect.
Models (4)–(6) conduct robustness tests on the mediation effect by removing the 2020 data sample. The results from these models confirm that the mediation effect remains valid. By integrating the findings from models (4)–(6), it is evident that new-quality productivity influences environmental pollution through a partial mediation effect. Therefore, Hypothesis 3 (H3) is verified—new-quality productivity can indirectly mitigate environmental pollution by promoting green finance.
6.2. Fractional Exponent Results Analysis
Considering that the effects of the various components of new-quality productivity on environmental pollution may differ, this study further examines the heterogeneous effects of each component on environmental pollution. Each component is shown in Level 1 indicators in Table 2. The results of the influence of different components of new-quality productivity on environmental pollution are shown in Table 8. It can be observed that all components significantly reduce environmental pollution.
Table 8.
The impact of different components of new-quality productivity on environmental pollution.
Table 9 presents the robustness check results for Table 8, where the 2020 sample data have been removed. The findings remain consistent, indicating that each component of new-quality productivity continues to have a significant effect in reducing environmental pollution. This confirms the validity of Hypothesis 2 (H2).
Table 9.
Robustness test of the results in Table 8.
New laborers, with their higher education levels, exceptional innovative abilities, and strong environmental awareness, play a significant role in reducing environmental pollution. They are capable of deeply understanding and effectively applying various environmental protection technologies and methods, quickly adapting to and mastering new technologies that help reduce pollution and improve resource efficiency. In addition to the continued advancement of digital and automation technologies, these have strongly supported the application of new labor materials. These technologies not only enhance the prevalence of remote work, intelligent monitoring, and automated production but also effectively reduce the demand and waste of physical resources, significantly improving resource utilization efficiency by minimizing human error, and further decreasing material waste and environmental pollution. Meanwhile, new labor objects, such as new materials and renewable energy sources, reduce the required amount of energy by improving energy efficiency and adopting cleaner energy technologies. This contributes to achieving energy conservation and emission reduction goals while effectively lowering greenhouse gas and other pollutant emissions. Additionally, the recycling and reuse of materials play a crucial role in reducing resource extraction and waste generation, further decreasing environmental pollution.
In this context, new technological elements significantly reduce environmental pollution through various pathways. For example, the accelerated development of catalytic technologies has sped up the output of innovative results, promoted the establishment of green technology systems, and facilitated the optimization and adjustment of industrial structures, while enhancing the effectiveness of environmental monitoring and management. New production organizations combine intelligence and sustainability, significantly improving environmental management capabilities through real-time monitoring and data analysis, thereby effectively reducing resource consumption and enabling more scientific and efficient management and resolution of environmental issues. New data elements exhibit immense potential in mitigating environmental pollution. They not only enable precise resource allocation but also improve waste recycling rates, reducing waste while balancing lower resource demand and carbon emissions. Moreover, new data elements can monitor environmental quality in real time to provide accurate early warnings and enhance governance precision by integrating multi-domain data.
6.3. Regional Heterogeneity
This study further divides the 30 provinces in China into four regions: eastern, central, western, and northeast, and examines the impact of new-quality productivity on environmental pollution in these regions, with the results shown in Table 10. It can be observed that the weakening effect of new-quality productivity on environmental pollution is more significant in the eastern and northeast regions, while the impact on environmental pollution in the central and western regions is not significant. Based on the robustness test results of Models (5)–(8), the conclusion remains valid. The mitigating effect of new-quality productivity on environmental pollution exhibits regional heterogeneity, confirming the validity of Hypothesis 4 (H4).
Table 10.
The impact of new-quality productivity on environmental pollution in different regions.
The regional heterogeneity analysis indicates significant spatial disparities in the impact of new-quality productivity on environmental pollution. Specifically, the eastern region, characterized by a high level of economic development, abundant capital accumulation, strong technological innovation capabilities, and a well-established market system, has fostered a favorable ecosystem for the advancement of new-quality productivity. This, in turn, provides a solid foundation for technological innovation in environmental governance and the adoption of cleaner production methods. In contrast, the central region benefits from a balanced industrial structure, advantageous geographic location, and an extensive transportation network, offering market depth and industrial synergy for the cultivation of new-quality productivity. However, its relatively lagging economic development, weak technological research and development (R&D) foundation, and limited capital accumulation may hinder the innovation-driven effects of new-quality productivity in environmental governance.
The western region, endowed with abundant natural resources, a rapidly evolving industrial structure, and a thriving emerging industry sector, presents unique factor endowments and market opportunities for new-quality productivity. Nevertheless, its lower economic level, underdeveloped market mechanisms, and shortage of scientific and technological human resources may impede the effective transmission of the environmental benefits of new-quality productivity. Notably, the northeastern region, with its well-established industrial system, high-density research institutions, and strong industrial base, provides a robust platform for the technological transformation of new-quality productivity. However, the heavy reliance on traditional industries, rigid institutional constraints, ongoing talent outflow, and severe structural pollution problems may result in the most pronounced environmental governance effects of new-quality productivity in this region.
7. Conclusions and Policy Implications
7.1. Conclusions
This study examines the impact of new-quality productivity on environmental pollution and its underlying mechanisms. The conclusions are as follows: First, the advancement of new-quality productivity can effectively mitigate environmental pollution. This conclusion remains robust even after addressing potential endogeneity issues and conducting robustness checks. Second, the primary mechanism by which new-quality productivity reduces environmental pollution is through promoting the development of green finance. Green finance, in turn, enhances environmental governance effectiveness by facilitating the allocation of financial resources toward environmentally friendly industries. Third, from a regional heterogeneity perspective, the effect of new-quality productivity on environmental pollution varies across regions due to differences in historical and economic contexts. However, in general, new-quality productivity contributes to pollution reduction.
7.2. Policy Implications
Based on these findings, this study proposes a three-pronged environmental governance policy framework that integrates “factor upgrading, mechanism innovation, and region-specific adaptation”.
First, factor upgrading: This involves upgrading new-quality productivity and its constituent elements. It includes strengthening green skills training for new types of workers, increasing vocational education and in-house corporate training, and cultivating professionals with capabilities in green technology innovation. This involves vigorously promoting the transition of new labor materials to a green, low-carbon model, intensifying research and development efforts in smart hardware and green manufacturing equipment, and broadly promoting automation equipment to reduce energy consumption and pollutant emissions. It involves optimizing the use of resources by new labor objects, increasing the use of renewable resources, reducing reliance on traditional resources, and actively promoting a circular economy. This approach not only enhances green technological innovation and development and increases the capacity for green technological innovation—supporting the research and development of technologies such as new energy storage materials, smart grids, and carbon capture—but also promotes their industrialization. On the other hand, it involves strengthening green management in production organizations by adopting clean production methods and environmental management systems, as well as building green supply chains. It also involves empowering the green potential of data elements by utilizing big data and artificial intelligence to optimize production processes and achieve precise energy savings.
Second, mechanism innovation: To enhance the environmental governance impact of green finance, it is crucial to establish a coordinated planning mechanism between green finance and new-quality productivity while developing a multidimensional policy support system. This involves the following: (1) Improving the green finance institutional framework: Strengthening financial decentralization reforms can enhance local governments’ incentives for environmental governance. Establishing regional environmental information disclosure platforms and implementing differentiated credit policies can improve the efficiency of green financial resource allocation [23,24]. (2) Accelerating digital technology integration: Leveraging blockchain technology for green asset traceability and utilizing big data to develop dynamic environmental risk assessment models can enhance green financial product innovation and precision in capital allocation [36]. (3) Enhancing market incentive mechanisms: A coordinated “financial interest subsidy + risk compensation” mechanism should be established, coupled with tax incentives for green bond issuance. Additionally, integrating the carbon finance market with the emissions trading market can create a market-driven pricing mechanism for environmental assets [26,37]. Moreover, regional coordination should be emphasized. The eastern region can pilot innovations in green financial derivatives, while the central and western regions should focus on developing green industrial funds. Meanwhile, the northeastern region should prioritize financing for the green transformation of traditional industries and establish cross-regional platforms for green technology transfer and commercialization [25]. Finally, strengthening regulatory technology applications is essential. A multi-tiered evaluation system that incorporates ESG indicators should be developed, and financial institutions should be subject to dynamic assessments of their green business share to prevent systemic risks associated with “green-washing” practices [23,26].
Third, region-specific adaptation: The development of new-quality productivity should be tailored to regional conditions, focusing on the following two key strategies: (1) Strengthening competitive advantages: For regions that already excel in specific domains of new-quality productivity, fiscal support and tax incentives should be further enhanced. Establishing dedicated funds for technological research and industrial applications will help cultivate world-class industrial clusters. (2) Addressing weaknesses: For emerging industries such as fundamental materials and artificial intelligence, or for areas where new-quality productivity remains underdeveloped, reforms in the transformation of scientific research achievements should be accelerated. Investments in both basic research and applied technology development should be increased. Additionally, efforts must be made to cultivate and attract specialized talent in strategic emerging industries and future industries. Beyond assessing their own strengths and weaknesses, regions must adhere to a localized approach, tailoring development strategies to their unique resource endowments, industrial structures, and market demands. A differentiated regional development strategy should be formulated to ensure targeted policy implementation. For instance, the eastern coastal region can prioritize the development of high-tech industries, while the central and western regions can leverage their natural resource advantages to advance industries such as new materials and renewable energy [8].
Compared to developed countries that have historically followed a “pollute first, remediate later” approach, China—as the world’s largest developing country and manufacturing hub—has adopted a unique model of environmental governance through new-quality productivity. Unlike Germany’s Industry 4.0, which primarily focuses on the intelligent upgrading of production systems and derives environmental benefits from efficiency improvements under pre-existing high environmental standards, China’s new-quality productivity strategy integrates large-scale investments in renewable energy infrastructure and the digital economy, enabling both technological breakthroughs and institutional innovation. In contrast to developing countries such as Vietnam and India, which are also advancing industrial digitalization, China’s development benefits from a more extensive industrial scale and stronger policy coordination, making its experience a valuable reference for other nations.
Author Contributions
Conceptualization, L.Y. and Z.F.; methodology, L.Y. and Z.F.; validation, L.Y. and Z.F.; formal analysis, L.Y. and Z.F.; writing, L.Y. and Z.F. All authors have read and agreed to the published version of the manuscript.
Funding
This research received no external funding.
Institutional Review Board Statement
Not applicable.
Informed Consent Statement
Not applicable.
Data Availability Statement
The data used in this paper can be found at https://www.stats.gov.cn (accessed on 1 January 2025). The data presented in this study are available upon request from the corresponding author.
Conflicts of Interest
The authors declare no conflicts of interest.
References
- Feng, C.; Wang, M.; Liu, G.C.; Huang, J.B. Green development performance and its influencing factors: A global perspective. J. Clean. Prod. 2017, 144, 323–333. [Google Scholar]
- Xu, S.; Wang, J.; Peng, Z. Study on the Promotional Effect and Mechanism of new quality productivity on Green Development. Sustainability 2024, 16, 8818. [Google Scholar] [CrossRef]
- Wang, Q.; Chen, X. Can new quality productivity promote inclusive green growth: Evidence from China. Front. Environ. Sci. 2024, 12, 1499756. [Google Scholar] [CrossRef]
- Liu, W. Scientific understanding and practical development of new quality productive forces. Econ. Res. J. 2024, 59, 4–11. [Google Scholar]
- Feng, N.; Yan, M.; Yan, M. Spatiotemporal Evolution and Influencing Factors of New-Quality Productivity. Sustainability 2024, 16, 10852. [Google Scholar] [CrossRef]
- Jiang, L.; Zi’ang, G.; Yuping, W. Development level, regional differences and improvement path of new quality productive forces. J. Chongqing Univ. (Soc. Sci. Ed.) 2024, 30, 1–17. (In Chinese) [Google Scholar]
- Xiaohua, Z.; Yangyang, G. Analysis on Improving total Factor Productivity With the Decvelopment of New Quality Productivity. J. Jiangxi Norm. Univ. (Philos. Soc. Sci. Ed.) 2025, 58, 15–24. [Google Scholar]
- Han, W.; Zhang, R.; Zhao, F. Measurement of New Quality Productivity Levels and New Momentum for China’s Economic Growth. J. Quant. Tech. Econ 2024, 6, 5–25. [Google Scholar]
- Xin, J.; Qunli, S.; Rongxue, J. Digital transformation, new quality productive forces and corporate innovation performance. J. Hainan Univ. (Humanit. Soc. Sci.) 2025, 43, 86–96. [Google Scholar]
- Zhang, S.; Wang, Y.; Liu, Z.; Hao, Y. The spatial dynamic relationship between haze pollution and economic growth: New evidence from 285 prefecture-level cities in China. J. Environ. Plan. Manag. 2021, 64, 1985–2020. [Google Scholar]
- Zhang, J.; Zhang, K.; Zhao, F. Spatial effects of economic growth, energy consumption and environmental pollution in the provinces of China—An empirical study of a spatial econometrics model. Sustain. Dev. 2020, 28, 868–879. [Google Scholar]
- Wang, H.; Liu, H. Foreign direct investment, environmental regulation, and environmental pollution: An empirical study based on threshold effects for different Chinese regions. Environ. Sci. Pollut. Res. 2019, 26, 5394–5409. [Google Scholar]
- Xi, B.; Zhai, P. Economic growth, industrial structure upgrading and environmental pollution: Evidence from China. Kybernetes 2023, 52, 518–553. [Google Scholar] [CrossRef]
- Zhang, K.; Xu, D.; Li, S. The impact of environmental regulation on environmental pollution in China: An empirical study based on the synergistic effect of industrial agglomeration. Environ. Sci. Pollut. Res. 2019, 26, 25775–25788. [Google Scholar]
- Hao, Y.; Chen, Y.F.; Liao, H.; Wei, Y.M. China’s fiscal decentralization and environmental quality: Theory and an empirical study. Environ. Dev. Econ. 2020, 25, 159–181. [Google Scholar]
- Xu, H.; Yang, H. The Impact of Population and Industrial Agglomeration on Environmental Pollution—Taking 100 Cities in China as an Example. Urban Probl. 2017, 1, 53–60. [Google Scholar]
- Du, S.; Ye, X. Logical Reasoning, Value Implication and Practical Path of Green Development Empowered by New Quality Productivity. J. Beijing Inst. Technol. (Soc. Sci. Ed.) 2024, 26, 52–61. [Google Scholar]
- Ye, Q.; Chen, Y. new quality productivity Promote Green Development: Mechanisms, Challenges and Paths. Rev. Econ. Res. 2024, 6, 33–43. [Google Scholar]
- Yue, K.; Qu, X. Green development dimension of new quality productivity. Contemp. Econ. Res. 2024, 8, 15–21. [Google Scholar]
- Zhong, Y.; Wu, S. Ecological New Quality Productivity: Research on Value Implication, Realistic Dilemma and Development Path. J. Jiangxi Norm. Univ. (Philos. Soc. Sci. Ed.) 2024, 57, 3–12. [Google Scholar]
- Guo, F.; Fang, W. A Materialist Historical Interpretation of the Ecological Connotation of new quality productivity. J. China Univ. Geosci. (Soc. Sci. Ed.) 2025, 25, 11–19. [Google Scholar]
- Li, Y.; Xu, X. On the Ecological Implications of Developing new quality productivity. Contemp. Econ. Res. 2024, 12, 35–44. [Google Scholar]
- Cai, X.; Chen, G.; Wang, F. How Does Green Finance Policy Affect the Capacity Utilization Rate of Polluting Enterprises? Sustainability 2023, 15, 16927. [Google Scholar] [CrossRef]
- Liu, G.; Fang, Y.; Yang, S. Financial development, financial decentralization and urban environmental pollution suppression. J. Jinan Univ. 2021, 31, 91–102. [Google Scholar]
- Xu, K.; Zhao, P.; Gao, Y. The impact of green finance on industrial pollution emissions: Empirical evidence from economic and environmental perspectives. Environ. Sci. Pollut. Res. 2023, 30, 98417–98439. [Google Scholar] [CrossRef]
- Wang, X.; Gao, C. Does green finance policy help to improve carbon reduction welfare performance? Evidence from China. Energy Econ. 2024, 132, 107452. [Google Scholar] [CrossRef]
- Ren, Y.; Wu, Y.; Wu, Z. Financial Agglomeration, Industry University Research Cooperation, and New Quality Productivity. Financ. Theory Pract 2024, 45, 27–34. [Google Scholar]
- Yin, J.; Sun, J. New Quality Productive Forces and New Production Relations: A Political Economy Analysis. Reform 2024, 5, 45–53. [Google Scholar]
- Acemoglu, D.; Restrepo, P. Robots and jobs: Evidence from US labor markets. J. Political Econ. 2020, 128, 2188–2244. [Google Scholar] [CrossRef]
- Wang, Y.; Dong, W. How the rise of robots has affected China’s labor market: Evidence from China’s listed manufacturing firms. Econ. Res. J. 2020, 55, 159–175. [Google Scholar]
- Wang, J.; Zhu, J.; Luo, X. Research on the measurement of China’s digital economy development and the characteristics. J. Quant. Tech. Econ. 2021, 38, 26–42. [Google Scholar]
- Wang, Y.; Sun, X. The mechanism of industrial transformation and upgrading driven by government subsidies. China Ind. Econ. 2017, 10, 101–119. [Google Scholar]
- Wen, Z.; Chang, L.; Hau, K.T.; Liu, H. Testing and application of the mediating effects. Acta Psychol. Sin. 2004, 36, 614. [Google Scholar]
- Zeng, X.; Liu, Y.; Man, M.; Shen, Q. Measurement analysis of the development level of China’s green finance. J. China Exec. Leadersh. Acad. Yan’an 2014, 7, 112–121. [Google Scholar]
- Wang, X.; Wang, Q. Research on the impact of green finance on the upgrading of China’s regional industrial structure from the perspective of sustainable development. Resour. Policy 2021, 74, 102436. [Google Scholar] [CrossRef]
- Zhang, Y.; Bawuerjiang, R.; Lu, M.; Li, Y.; Wang, K. Green finance and environmental pollution: Evidence from China. Econ. Anal. Policy 2024, 84, 98–110. [Google Scholar] [CrossRef]
- Wang, Y.; Cui, L.; Zhou, J. The impact of green finance and digital economy on regional carbon emission reduction. Int. Rev. Econ. Financ. 2025, 97, 103748. [Google Scholar] [CrossRef]
Disclaimer/Publisher’s Note: The statements, opinions and data contained in all publications are solely those of the individual author(s) and contributor(s) and not of MDPI and/or the editor(s). MDPI and/or the editor(s) disclaim responsibility for any injury to people or property resulting from any ideas, methods, instructions or products referred to in the content. |
© 2025 by the authors. Licensee MDPI, Basel, Switzerland. This article is an open access article distributed under the terms and conditions of the Creative Commons Attribution (CC BY) license (https://creativecommons.org/licenses/by/4.0/).