Article

Controlling Factors Affecting NAPL Residuals in Aquifers Containing Low-Permeability Lens Bodies

1
Institute of Hydrogeology and Environmental Geology, Chinese Academy of Geological Sciences, Shijiazhuang 050061, China
2
School of Chinese Academy of Geological Sciences, China University of Geosciences (Beijing), Beijing 100086, China
3
Key Laboratory of Groundwater Remediation of Hebei Province & China Geological Survey, Shijiazhuang 050083, China
*
Author to whom correspondence should be addressed.
Sustainability 2025, 17(7), 3205; https://doi.org/10.3390/su17073205
Submission received: 16 January 2025 / Revised: 15 March 2025 / Accepted: 1 April 2025 / Published: 3 April 2025
(This article belongs to the Section Pollution Prevention, Mitigation and Sustainability)

Abstract

:
The presence of residual non-aqueous phase liquid (NAPL) in low-permeability lens aquifers of ten results in a “tailing” effect, ecological deterioration and poor sustainability, which is a primary factor contributing to remediation failures at NAPL-contaminated sites. This issue is largely due to the poorly understood mechanisms by which NAPL residuals interact with low-permeability lens aquifers. To elucidate these mechanisms, this study conducted a series of column experiments, varying the permeability contrast (Kmn), lens sizes (ϕ), and hydraulic gradients (I). Complementary techniques such as mercury intrusion porosimetry and particle size analysis were employed to characterize the aquifer and lens materials. The data obtained include the residual NAPL saturation (Sr), groundwater flow velocity (V), pore size distribution, particle size, and gradation under different experimental conditions. Sensitivity analyses using range and variance analyses identified the following order of effect on NAPL residuals in low-permeability lens aquifers: Kmn > ϕ > I. Correlation analyses further suggest that the governing mechanisms are predominantly mediated by changes in the average particle size, macroporosity (pores > 60 μm), mesoporosity (pores = 30~60 μm), and microporosity (pores = 2~30 μm), as well as abrupt changes in pore size at the interface between the lens and the aquifer, in addition to V. This study can provide a theoretical basis for green, low-carbon, and sustainable development, such as pollution remediation and ecological environment security.

Graphical Abstract

1. Introduction

The increasing utilization of organic chemical products has led to the introduction of substantial quantities of organic compounds into subsurface environments during the processes of refining, storage, transportation, and utilization [1,2,3,4]. Among these compounds, petroleum and petroleum-derived chemical pollutants are characterized by their extremely low solubility in water, frequently existing in the form of non-aqueous phase liquids (NAPLs) [5,6,7]. NAPLs are notable for their high toxicity, chemical stability, and resistance to degradation [8,9,10], which enables their persistence in subsurface soil–water environments, thereby posing significant risks to ecological safety and human health. This is contrary to the global sustainable development strategy. During the remediation of NAPL contamination, residual NAPL in low-permeability lens aquifers has been observed to induce a “tailing” effect (Figure 1), often leading to remediation failures [11,12,13,14]. Therefore, it is imperative to identify the controlling factors and mechanisms that affect NAPL residuals in aquifers containing low-permeability lens bodies to ensure successful remediation efforts. This study can provide new ideas for the disciplines of pollution hydrogeology and environmental geology and provide application support for the restoration and treatment of polluted sites in industrial enterprises, as well as ecological sustainable development.
To examine the mechanisms that affect NAPL residuals in aquifers containing low-permeability lens bodies, a series of studies have been conducted by researchers globally. The results indicate that the migration and distribution of NAPL within aquifers containing lenses are significantly impacted by the heterogeneity of the media. In fine media, coarser-grained lenses facilitate NAPL migration, thereby reducing residual NAPL, whereas in coarse media, finer-grained lenses hinder NAPL migration, resulting in an increase in residual NAPL [15,16,17,18,19]. In aquifers characterized by layered lenses, the presence of hydraulic gradients (I) significantly impacts residual NAPL. Variations in I alter the groundwater flow velocity (V), which in turn affects NAPL’s migration and its residual state within pore spaces, ultimately affecting the quantity of residual NAPL [20,21,22,23]. The existence of lenses alters the overall pore structure, leading to an increase in displacement pressure within low-permeability zones. V may be insufficient to overcome the critical capillary pressure, thereby preventing the ingress of fluids into these zones, where clusters of residual NAPL form, consequently affecting NAPL residuals [24,25,26,27,28,29]. Previous studies suggested that factors such as the V, particle size, gradation, pore size, and pore distribution in low-permeability lens aquifers all play a role in affecting NAPL residuals. These macro-scale effects can be classified into three primary factors: lens permeability, lens size (ϕ), and I. However, the specific responses of NAPL residuals to these factors and the underlying mechanisms remain inadequately understood.
To identify the primary factors controlling NAPL residuals in aquifers containing low-permeability lens bodies and to elucidate the underlying mechanisms, this study conducted soil column experiments. By varying the permeability and size of the lenses, aquifers with different lens characteristics were simulated, and multiple I were established for comparative analysis. This study examined the effects of permeability contrast (Kmn, defined as the ratio of aquifer permeability to lens permeability), ϕ, and I on NAPL residuals to ascertain the primary controlling factors. In conjunction with V, particle size analysis, and mercury intrusion porosimetry results for both aquifers and lenses, the mechanisms affecting NAPL residuals in aquifers containing low-permeability lens bodies were elucidated. This research aims to provide theoretical guidance for identifying critical points in the remediation of NAPL-contaminated sites and for selecting appropriate NAPL remediation strategies.

2. Materials and Methods

To accomplish the objectives of this study, a series of soil column simulation experiments, mercury intrusion porosimetry tests, particle size analyses, and the development of a standard NAPL concentration curve were performed. The materials and methods employed in each experiment are outlined as follows:

2.1. Soil Column Simulation Experiment

2.1.1. Experimental Materials

NAPL: In this study, non-toxic and readily available diesel fuel (#0 diesel) was utilized as a substitute for NAPL pollutants. The properties of the diesel fuel are summarized in Table 1. To mitigate the potential effect of microbial degradation, as noted by Wang [30], low-clay-content white quartz sand, sourced from Henan Minghai Environmental Technology Co., Ltd. (Zhengzhou, China), was employed to simulate aquifer media. Prior to its application, the quartz sand underwent sterilization at elevated temperatures. The physical properties of the quartz sand are detailed in Table 2.
The experimental apparatus utilized in this study included a HACH DR 3900 spectrophotometer, sourced from HACH company (Loveland, CO, USA), a JRJ300-SH emulsification machine, sourced from Shanghai Pingxuan Scientific Instrument Co., Ltd. (Shanghai, China), a HACH DRB 200 digestion instrument, sourced from HACH company (Loveland, CO, USA), 500 mL beakers, sourced from Jiangsu Lele teaching equipment Co., Ltd. (Taizhou, China), a micropipette, sourced from Jiangsu Lele teaching equipment Co., Ltd. (Taizhou, China), and HACH reagent tubes, sourced from HACH company (Loveland, CO, USA).

2.1.2. Experimental Apparatus

A soil column experimental setup was utilized to examine the variations in NAPL residuals under changes in several influencing factors, including Kmn, ϕ, and I. The soil column was constructed from plexiglass, measuring 95 cm in height and 7 cm in diameter, with a maximum packing height of 75 cm. The base of the column was equipped with sampling ports and a device for measuring hydraulic head. An inlet, located 10 cm from the top, was connected to a constant-head water supply system (Figure 2). To evaluate the fluid flow within the column and the effect of the lens on NAPL residuals, ϕ = 3.5 cm and heights (h) of 10 cm, 20 cm, and 30 cm were designed. As shown in Table 2, Kmn was set to 1, 24, and 42. Previous research indicated that the I in flat areas typically ranges from 1‰ to 15‰ [31,32]. For the experimental conditions, I was set at three levels: 4‰, 8‰, and 12‰.

2.1.3. Soil Column Experiment

The soil column experiment incorporated three factors (Kmn, ϕ, and I), each assessed at three levels. Implementing a single-factor design would have necessitated a considerable workload and could have led to redundant data due to the interactions among the factors [33]. To enhance the efficiency of the experimental process and to yield representative results, this study employed an orthogonal experimental design (Table 3).
During the packing process, the wet method was employed [34] to mitigate the formation of bubbles during subsequent saturation, as such bubbles could potentially alter the permeability of the medium or compromise the overall integrity of the packing. A lens with a diameter of 3.5 cm and varying heights was positioned 20 cm above the bottom of the plexiglass column (Figure 2). In packing the surrounding aquifer medium, the height of the quartz sand was meticulously controlled to ensure uniformity in mass across all the experimental groups, thereby maintaining consistent permeability within the aquifer medium. Throughout the packing procedure, the water level in the plexiglass column was consistently maintained at 1~2 cm above the quartz sand to guarantee that the medium was fully saturated and evenly packed.
After the packing process, a glass rod was employed to facilitate the flow, and NAPL was gradually injected from the top of the column. The liquid exiting the sampling port at the bottom was collected, and the injection was halted once the effluent was entirely composed of NAPL. The column was subsequently allowed to soak for a duration of 48 h to ensure complete penetration of NAPL into the lens. At this juncture, the total volume of NAPL injected into the plexiglass column (V0) was recorded. Subsequently, the constant-head water supply apparatus was activated, and the experiment commenced under the conditions in Table 3. Samples were collected from the sampling ports of the soil column, and the volume of effluent was documented. The average V was calculated based on the recorded effluent volume and the elapsed time. The NAPL concentration in the effluent was measured at various time intervals (Section 2.4). The experiment concluded when the NAPL concentration in the effluent stabilized and exhibited no further changes. Utilizing the mass conservation principle, the total volume of NAPL in the effluent (VC) was computed. The residual NAPL saturation (Sr) in each soil column was determined using Equation (1) [35,36]:
S r = V 0 V c V t o t a l × 1
where Vtotal is the total pore volume; V0 is the total volume of NAPL injected into the plexiglass column; and VC is the total volume of NAPL in the effluent.

2.2. Mercury Intrusion Porosimetry Test

2.2.1. Equipment and Materials of Mercury Intrusion Porosimetry Test

The apparatus utilized for the mercury intrusion porosimetry test was a MicroActive AutoPore V 9620 mercury intrusion porosimeter, produced by Micromeritics (Norcross, GA, USA). The primary materials employed in the experiment included quartz sand, the specifications and physical properties of which are summarized in Table 2, as well as an FA2004N electronic balance, produced by Juchuang Group Co., Ltd. (Qingdao, China).

2.2.2. Mercury Intrusion Porosimetry Procedure

According to the principles of mercury intrusion porosimetry [37,38], mercury initially penetrates larger pores when subjected to a specific pressure. As the pressure is incrementally increased, smaller pores are subsequently infiltrated, thereby facilitating the assessment of the pore size and pore volume distribution characteristics of the sample.
To assess the pore size distribution of each lens, a predetermined amount of quartz sand was accurately weighed and placed into 5 cc sample tubes. Subsequently, mercury intrusion porosimetry was performed to evaluate the pore size distribution of each sample.

2.3. Particle Size Analysis

2.3.1. Equipment and Materials of Particle Size Analysis

The primary apparatus utilized for particle size analysis comprised sieves of varying mesh sizes and a Mastersizer 3000 laser particle size analyzer, produced by Malvern Instruments Limited (Malvern, UK). The principal materials employed in this analysis were quartz sand, the specifications and physical properties of which are detailed in Table 2, along with an FA2004N electronic balance.

2.3.2. Particle Size Measurement

Utilizing the boundaries established by the sieving method in conjunction with a laser particle size analyzer, Quartz Sand No. 1, identified as the aquifer medium, was characterized as relatively coarse. The particle size distribution was assessed through the sieving method, wherein a 50 g sample of Quartz Sand No. 1 was accurately weighed using a balance. This sample was subsequently placed into a series of sieves arranged in descending order of mesh size, from the top to the bottom, and subjected to horizontal shaking to quantify the mass of sand retained on each sieve. A particle size distribution curve was subsequently generated, reflecting the percentage of sand within each size range. In contrast, the particle size distributions for Quartz Sand No. 2 and No. 3 were determined utilizing a laser particle size analyzer, which facilitated the measurement of the percentage content of particles across various size ranges.

2.4. NAPL Concentration Measurement

The liquid collected in the sampling bottles from the soil column simulation experiment comprised a mixture of NAPL and water. To accurately quantify the NAPL content in the effluent, a standard curve was developed to correlate the NAPL concentration with the chemical oxygen demand using chromium (CODCr). This was achieved by preparing standard solutions [39]. The concentration of NAPL in the effluent was subsequently determined using this established curve.

2.4.1. Equipment and Materials of NAPL Concentration Measurement

The equipment and materials utilized in this study included a HACH DR3900 spectrophotometer, sourced from HACH company (Loveland, CO, USA), a JRJ300-SH emulsification machine, sourced from Shanghai Pingxuan Scientific Instrument Co., Ltd. (Shanghai, China), a HACH DRB200 digestion instrument, sourced from HACH company (Loveland, CO, USA), 500 mL beakers, sourced from Jiangsu Lele teaching equipment Co., Ltd. (Taizhou, China), a micropipette, sourced from Jiangsu Lele teaching equipment Co., Ltd. (Taizhou, China), and HACH reagent tubes, sourced from HACH company (Loveland, CO, USA).

2.4.2. Standard Curve Development

The standard curve was established as follows: A total of 500 mL of NAPL–water mixtures were prepared, incorporating concentration gradients of 20 mg/L, 50 mg/L, 100 mg/L, 200 mg/L, 400 mg/L, 600 mg/L, 800 mg/L, and 1200 mg/L in beakers. The emulsifier was set to operate at a speed of 5000 revolutions per minute (r/min), and each mixture was emulsified for 3 min, progressing from the lowest to the highest concentration. Following the emulsification process, 2 mL of each mixture was extracted using a micropipette and transferred into HACH-specific CODCr reagent tubes, which contained potassium dichromate as the indicator. The samples were then digested at 150 °C for 2 h utilizing a digestion instrument. After the digestion period, the tubes were allowed to cool to room temperature, and the CODCr of each sample was measured using a spectrophotometer.
Through the application of this method, a standard curve was developed to establish a correlation between the NAPL concentration and CODCr (Figure 3). The fitted equation is represented as C = 0.9754C0 + 33.555, where C0 is the NAPL concentration in the prepared solution and C is the NAPL concentration as measured using the spectrophotometer. The correlation coefficient (R2 = 0.987) demonstrates a strong degree of correlation, thereby validating the efficacy of this method for quantifying the diesel concentration through CODCr analysis. All the experiments conducted in this study that involved measurements of the NAPL concentration adhered to this established method.

3. Results

3.1. Soil Column Experiment Results

The Sr for each experimental group following the completion of the soil column experiments is outlined in Table 4.
Sensitivity analysis for orthogonal experimental design predominantly encompasses range analysis and variance analysis. Range analysis, often referred to as the intuitive analysis method, presents several advantages, including its simplicity, ease of computation, and comprehensibility. However, it is limited in its capacity to estimate errors. Conversely, variance analysis provides a robust framework for accurately assessing the significance of each factor’s effect on the experimental results and for analyzing the variations attributable to experimental errors. This capability effectively mitigates the shortcomings associated with intuitive analysis [40].
The expression for the range Rj is given as follows:
R j = m a x ( K j 1 ¯   , K j 2 ¯   ,   K j n ¯   ) m i n ( K j 1 ¯   , K j 2 ¯   ,   K j n ¯ )
where K j n ¯ is the average of the sum of Sr corresponding to n levels of the j-th factor and Rj is the range for the j-th factor, calculated as the difference between the maximum and minimum values of Sr across all levels of the j-th factor. This range reflects the degree of variation in Sr caused by changes in the levels of the j-th factor. A larger Rj indicates a greater effect of the factor on the experimental results.
Figure 4a illustrates a bar chart depicting the ranges associated with each influencing factor. The ranking of these factors, based on their effects on the range of Sr, is presented as follows: Kmn > ϕ > I. To mitigate the limitations inherent in range analysis, a variance analysis was performed on Sr for each experimental group. The results of the variance analysis are summarized in Table 5.
As shown in Table 5, the p-value for Kmn is less than 0.05, indicating a high level of statistical significance. This result suggests that Kmn exerts the most substantial impact on Sr in aquifers characterized by low-permeability lenses, followed by ϕ and I. Therefore, the sensitivity ranking of factors affecting Sr is determined as follows: Kmn > ϕ > I.
To represent the influencing patterns and trends of various factors for Sr, a relationship trend graph was constructed. In this graph, the levels of each factor are plotted along the horizontal axis, while the corresponding average Sr is depicted on the vertical axis (Figure 4b). In Figure 4b, Sr increases with an increase in Kmn. Specifically, when Kmn < 24, the curve exhibits a steeper slope. However, when Kmn ∈ (24, 42), the slope becomes less pronounced. This indicates that, within the interval of Kmn from 24 to 42, Sr exhibits a slower rate of change in response to variations in Kmn compared to the interval of Kmn from 1 to 24. Furthermore, Sr increases almost uniformly with an increase in ϕ. Conversely, there is a decrease in Sr as I increases. Notably, the slope of the curve is less steep when I is between 4‰ and 8‰. However, when I ∈ (4‰, 8‰), the slope becomes steeper. This suggests that, within the interval of I from 4‰ to 8‰, Sr changes at a slower rate in response to variations in I compared to the interval of I from 8‰ to 12‰.

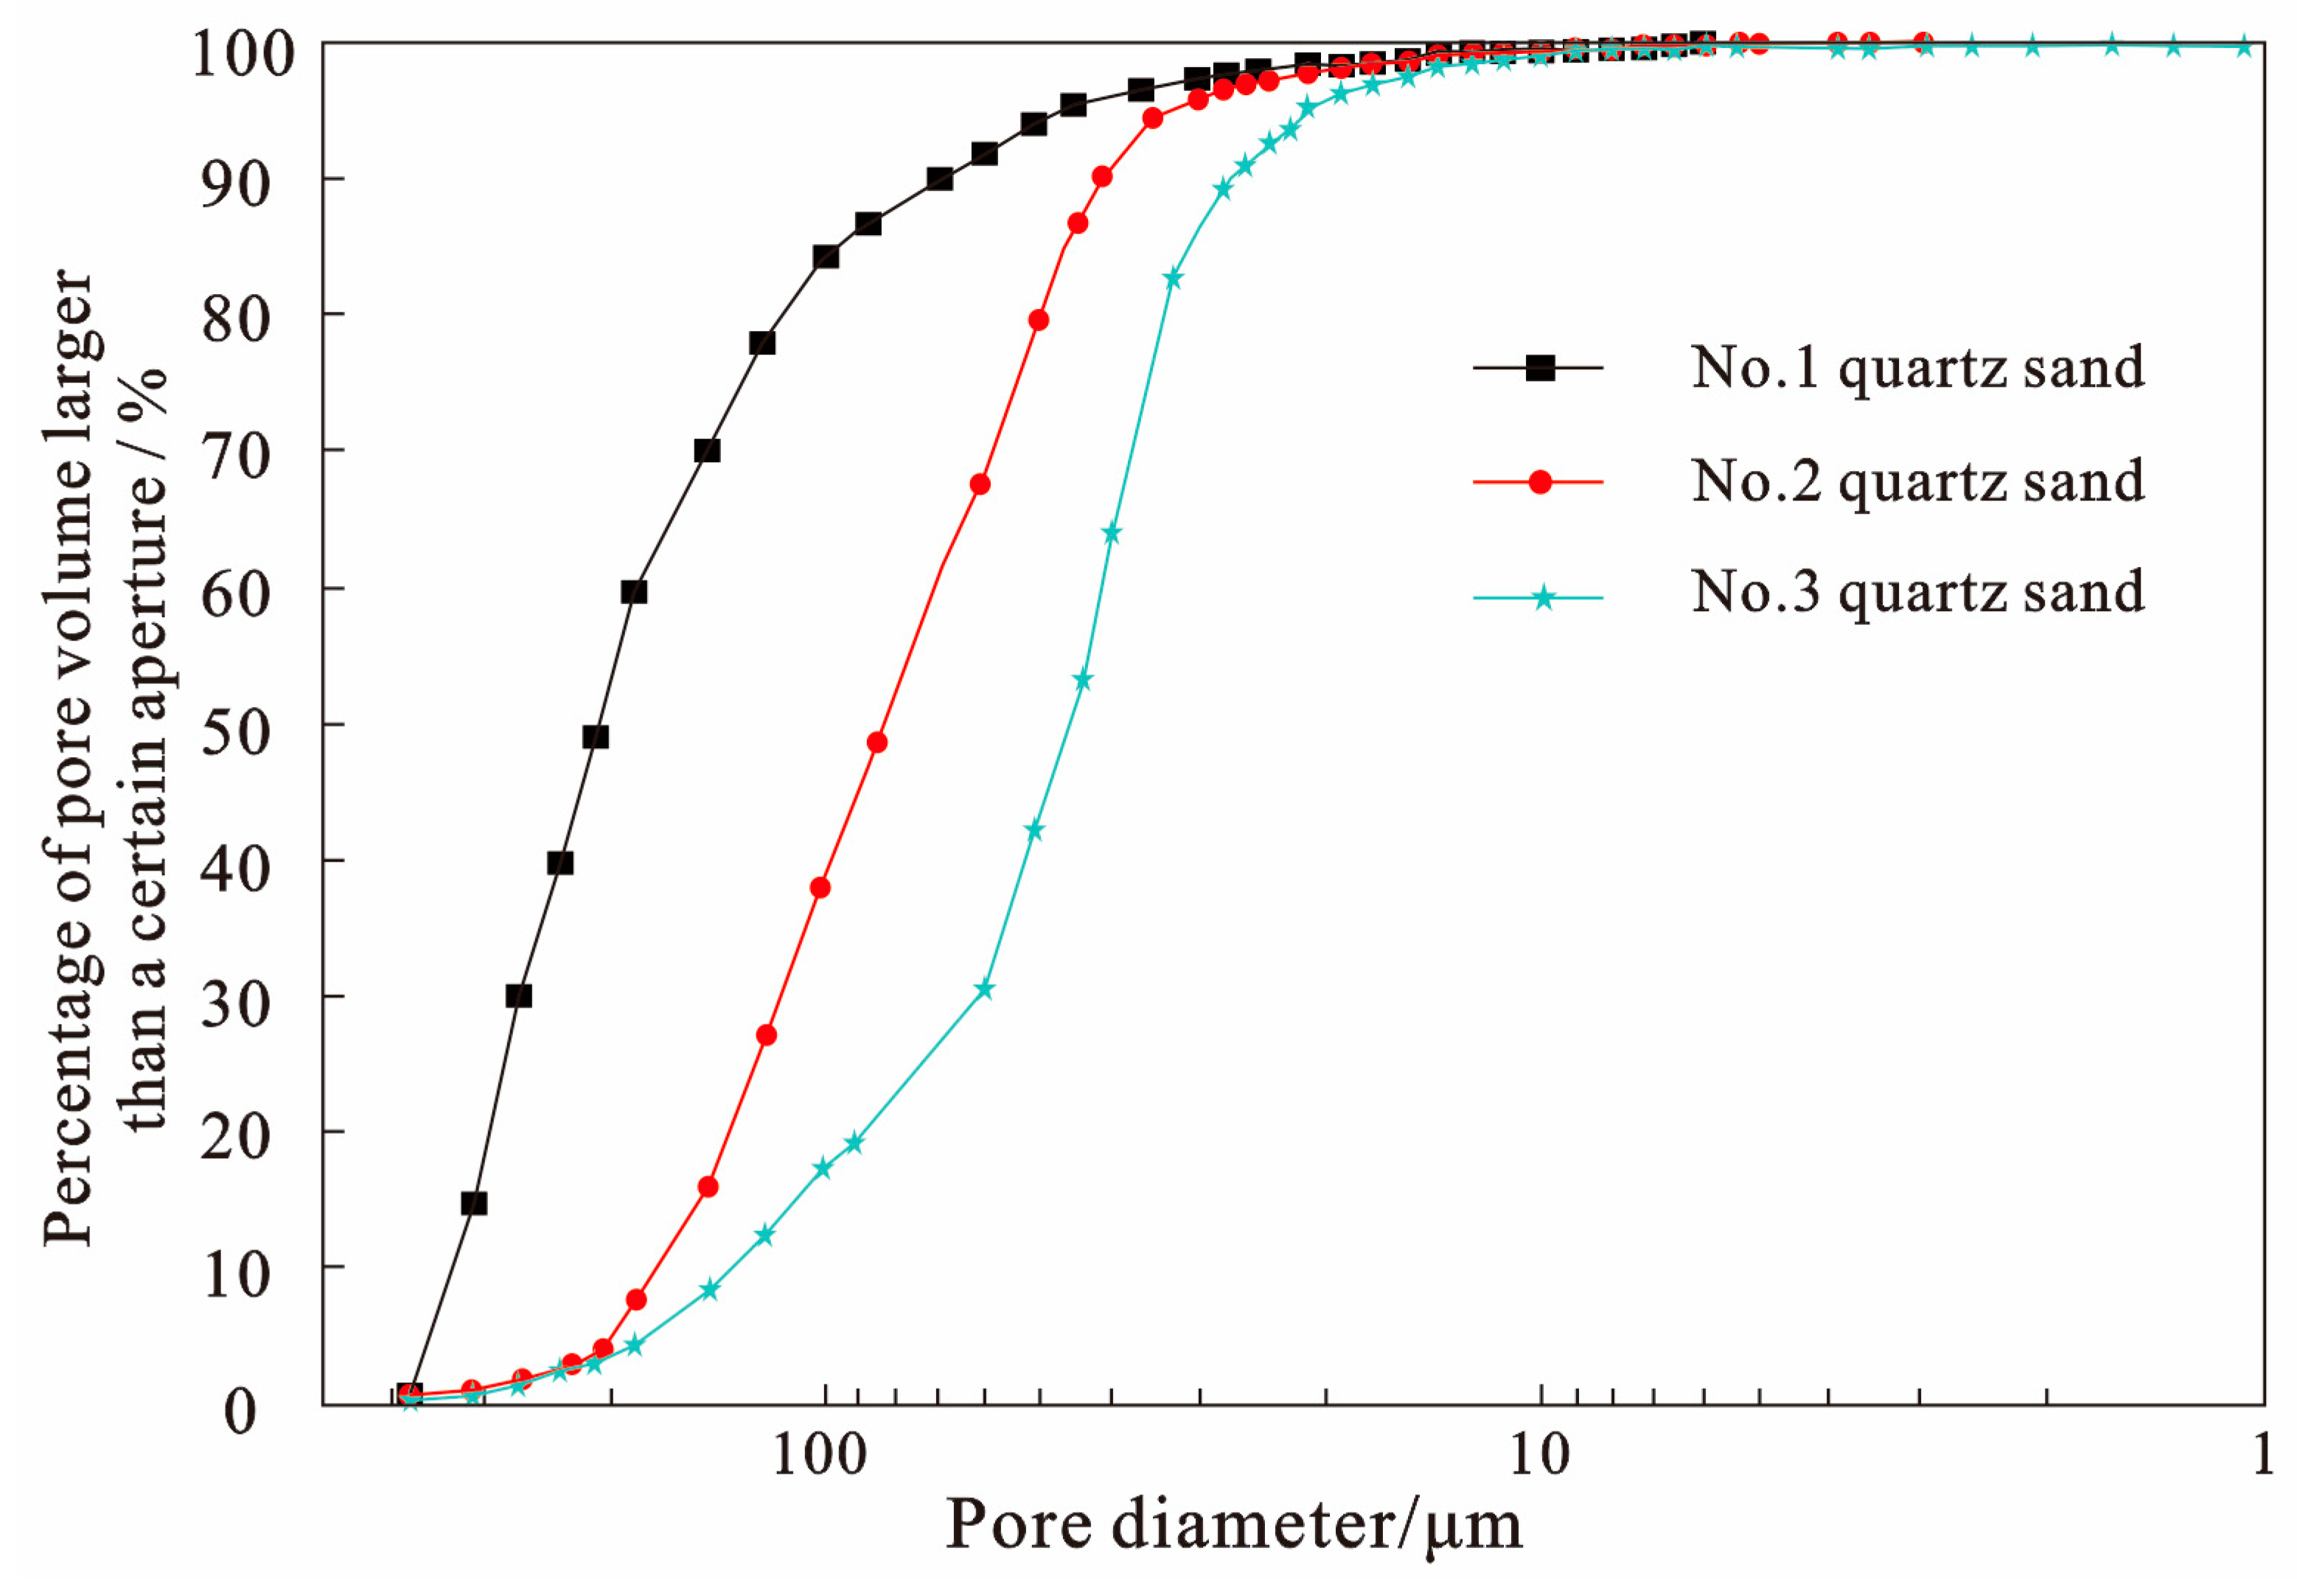
3.2. Mercury Intrusion Porosimetry Results

Figure 5 depicts the cumulative distribution curves of pore sizes within the aquifer and each lens body, categorized by varying pore diameters. The X-axis represents the pore diameter, while the Y-axis indicates the volume percentage of pores that are smaller than a specified diameter. The analysis of these curves reveals that the pores of quartz sands No. 1, No. 2, and No. 3 are predominantly concentrated within the 20~300 μm diameter range. Notably, the curve corresponding to No. 1 quartz sand is positioned at the highest point among all the curves, indicating that the pore sizes of No. 1 quartz sand are the largest when compared to the other two types of quartz sands.
Huang et al. (2010) [41] suggested that pore diameters within the range of 0~30 μm, characterized as very fine water-bound pores, exhibit the highest capillary action and significantly impact the underlying mechanisms. In the range of 30 μm to 100 μm, capillary forces are present. However, when the pore diameter exceeds 100 μm, these forces become nearly negligible. Thomasson (1978) [42] revealed that capillary action remains strong in pores with diameters less than 60 μm, with pores smaller than 2 μm predominantly serving as binding pores for water. These studies align with the proposed classification of pores into macropores (pore diameter > 60 μm), mesopores (pore diameter = 30~60 μm), small pores (pore diameter = 2~30 μm), and micropores (pore diameter < 2 μm), which do not facilitate the migration of microorganisms, NAPL, or other substances. Therefore, pores with diameters less than 2 μm were excluded from consideration and discussion in this study.

3.3. Particle Size Distribution Results

The cumulative particle size distribution curves for each type of quartz sand were constructed based on the experimental results for the particle size distribution (Figure 6). The average particle diameter, uniformity coefficient (Cu), and curvature coefficient (Cs) for each type of quartz sand were derived from the cumulative distribution curves and are outlined in Table 6.
The average particle diameter is a physical parameter that characterizes the overall particle size distribution within a medium. Cu and Cs serve as indicators of the distribution of various particle sizes. Cu < 5 suggests that the particles exhibit relative uniformity. Additionally, 1 < Cs <3 indicates the absence of gaps in the particle size distribution. As shown in Table 6, the particle sizes of quartz sands across different lens bodies exhibit variability. However, the differences in the values of Cu and Cs are minimal.

4. Discussion

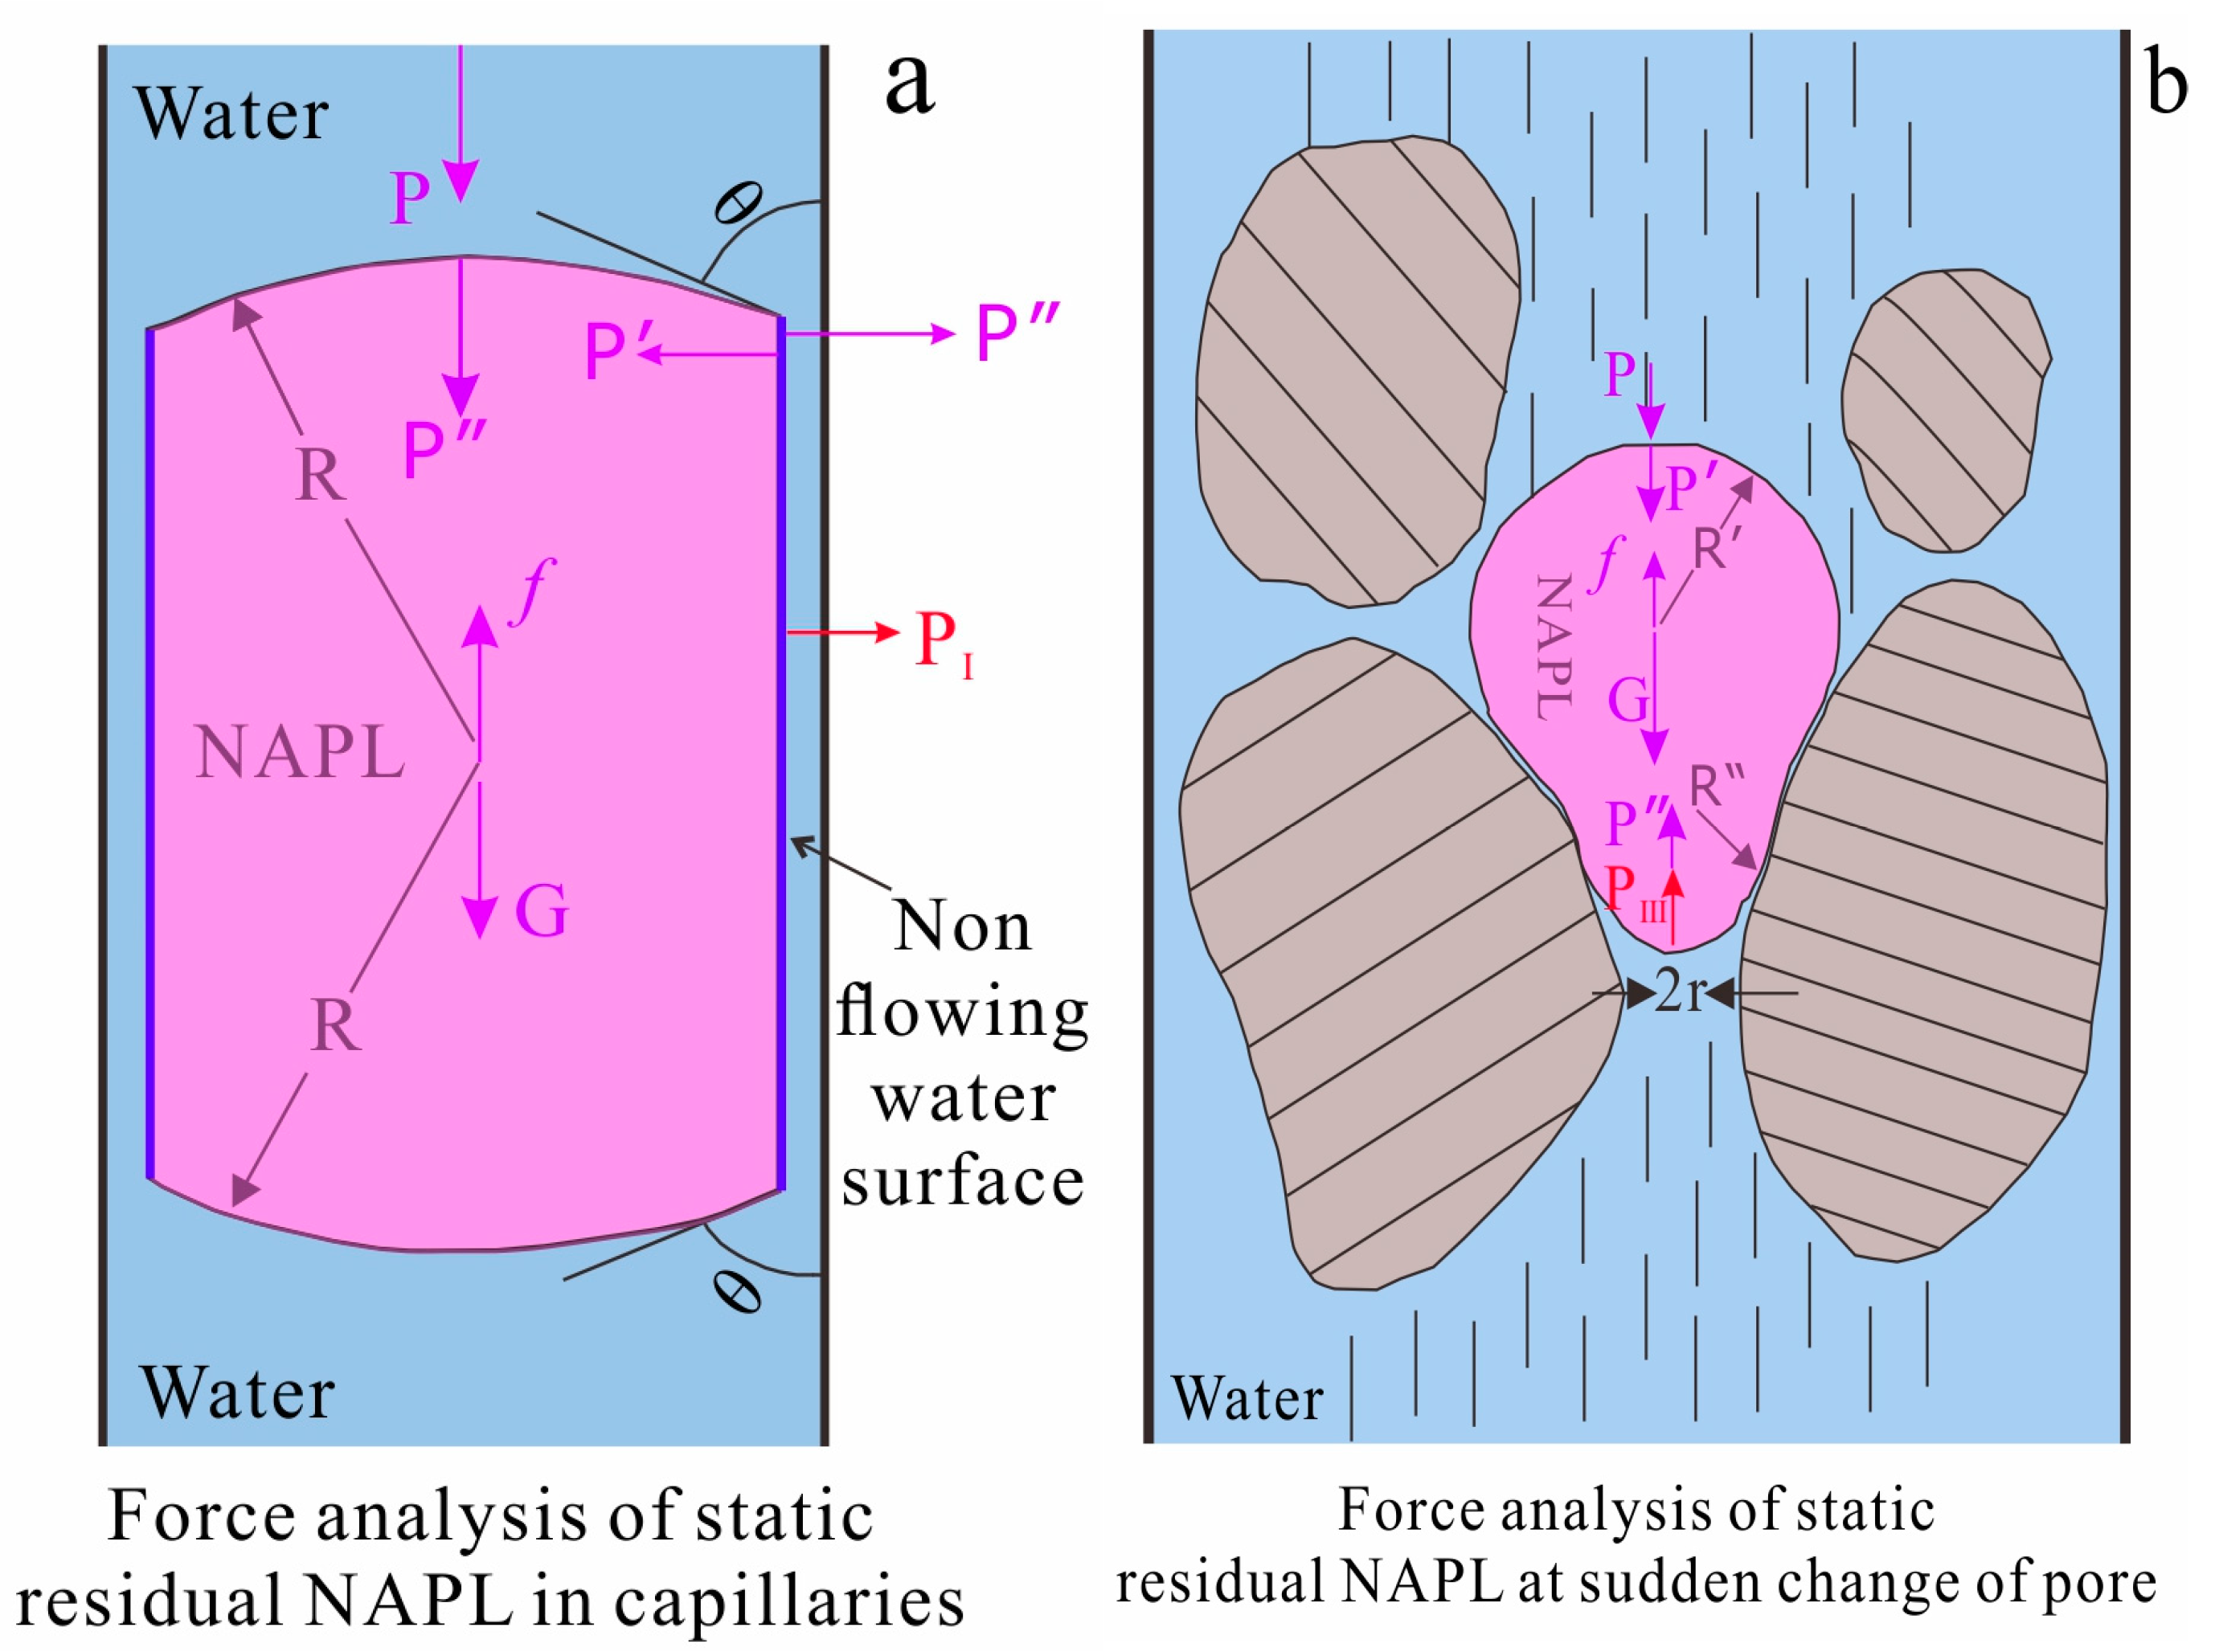
4.1. NAPL Residuals Mechanism

The residual NAPL in porous media primarily comprises two components: adsorption and retention. Both quartz sand and NAPL particles exhibit a similar double-layer structure on their surfaces. Upon contact, a common counter-ion layer may form between them. Due to the significant disparities in particle size and mass, the attraction exerted by the common counter-ion layer is sufficient to facilitate the adherence of dissolved NAPL onto the surfaces of quartz sand particles, thereby establishing a relatively stable structure [43,44,45]. Water flow alone is insufficient to fully separate NAPL from quartz sand particles, resulting in the adsorption of dissolved NAPL onto the particle surfaces. The amount of NAPL adsorbed decreases as the particle size increases, as adsorption is directly influenced by the specific surface area of the quartz sand. A higher specific surface area facilitates greater NAPL adsorption. Notably, the specific surface area of quartz sand increases exponentially with decreasing particle size [46,47,48]. Therefore, smaller particles possess a larger specific surface area, leading to greater NAPL adsorption.
To examine the residual mechanisms associated with the retained fraction of NAPL, this study draws upon Liu et al. (2016) [49], which investigated residual oil within geological formations. The forces exerted on NAPL droplets, which arise from their retention in lens-bearing aquifers, can be classified into two categories (Figure 7a,b). A comprehensive force analysis is performed for each scenario involving NAPL droplets.
As shown in Figure 7a, the pores function as capillaries of uniform diameter, while NAPL is represented as a spherical droplet in a state of equilibrium. This droplet is subjected to a water flow pressure (P), buoyant force f, a spherical capillary force (P″) exerted on the pore wall, a cylindrical capillary force (P′) acting at the center of the pore, and gravitational force (G). The resultant force (PI) is defined as the vector sum of P″ and P′, directed towards the pore wall. This analysis is based on the principles outlined by the Laplace equation [50]. The values of P″, P′, and PI are calculated as follows:
P = 2 σ c o s θ r
P = σ r
Therefore, PI can be determined as follows:
P I = 2 σ r c o s θ 0.5
where σ is the surface tension; r is the capillary diameter; and θ is the wetting contact angle [50]. The effect of PI is to increase the attachment of the NAPL droplet to the pore wall. To move the droplet, it is necessary to overcome the additional frictional resistance along the pore wall caused by PI.
Figure 7b illustrates the deformation of residual NAPL droplets upon encountering pore discontinuities. At this juncture, the NAPL droplet assumes an irregular spherical shape characterized by two ends. The residual NAPL droplet is affected by several forces, including P, buoyant force f, capillary forces (P″ and P′), and G. P″ and P′ can be collectively represented as a resistance force (PIII), which acts in opposition to the movement of the NAPL droplet. Therefore, PIII can be determined as follows:
P III = 2 σ 1 R 1 R
When the front radius of the residual NAPL droplet is equal to the radius of the narrow pore, PIII attains its maximum value. As a result, PIII can be expressed as follows:
P III = 2 σ r
The analysis of the forces acting on residual NAPL droplets indicates that a decrease in flow velocity correlates with an increase in the number of capillary pores. Furthermore, greater variability in pore size is associated with an increase in the volume of residual NAPL [51].
Kmn is defined as the ratio of the permeability coefficients of the aquifer to that of the lens body, with its fundamental characteristics being affected by the particle size and pore size of the lens body. ϕ represents its dimensions, while I, in conjunction with Kmn and ϕ, jointly determines V. Therefore, Kmn, ϕ, and I exert effects on the residual NAPL by affecting both the overall V and the properties of the medium, which include the particle size distribution, pore size distribution, and degree of connectivity (λ) between the lens body and aquifer pores. The experimental results suggest that the Cu and Cs of the various media do not exhibit significant differences. Therefore, the particle size characteristics in this study are represented only by the particle diameter. In this study, “particle size” is the average particle diameter. The macropore, mesopore, and micropore porosities are denoted by nmax, nmid, and nmin, respectively, to characterize the distribution of pore sizes. λ is defined as the ratio of the average pore diameter of the lens body to that of the aquifer. A higher λ value indicates better connectivity, while a lower value suggests poorer connectivity. Based on the definition from the particle cumulative curve, the average particle diameter corresponds to the pore size at 50% of the cumulative pore size distribution curve.
Table 7 lists the average particle diameter for each group, along with the pore size, pore connectivity, and flow velocity, as determined from the experimental results.

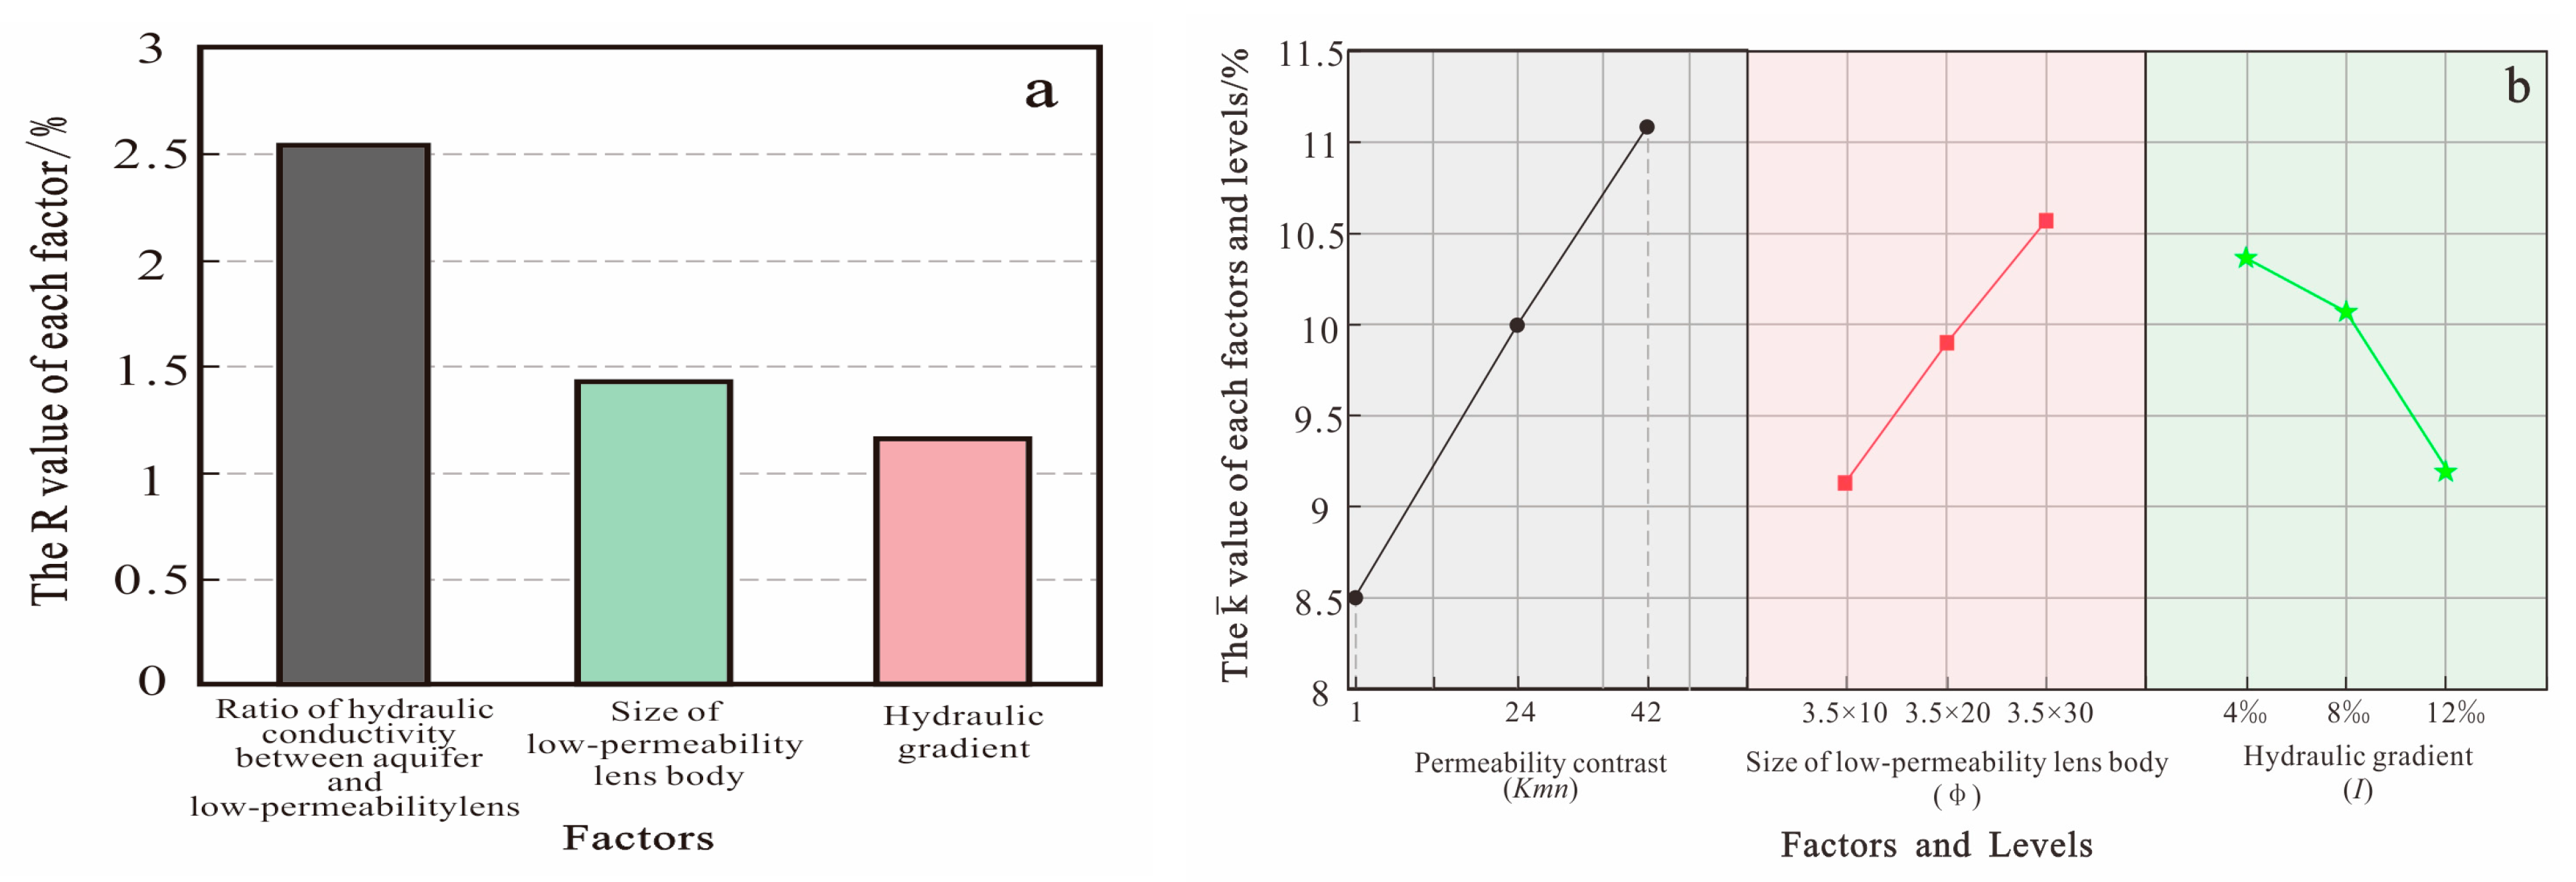
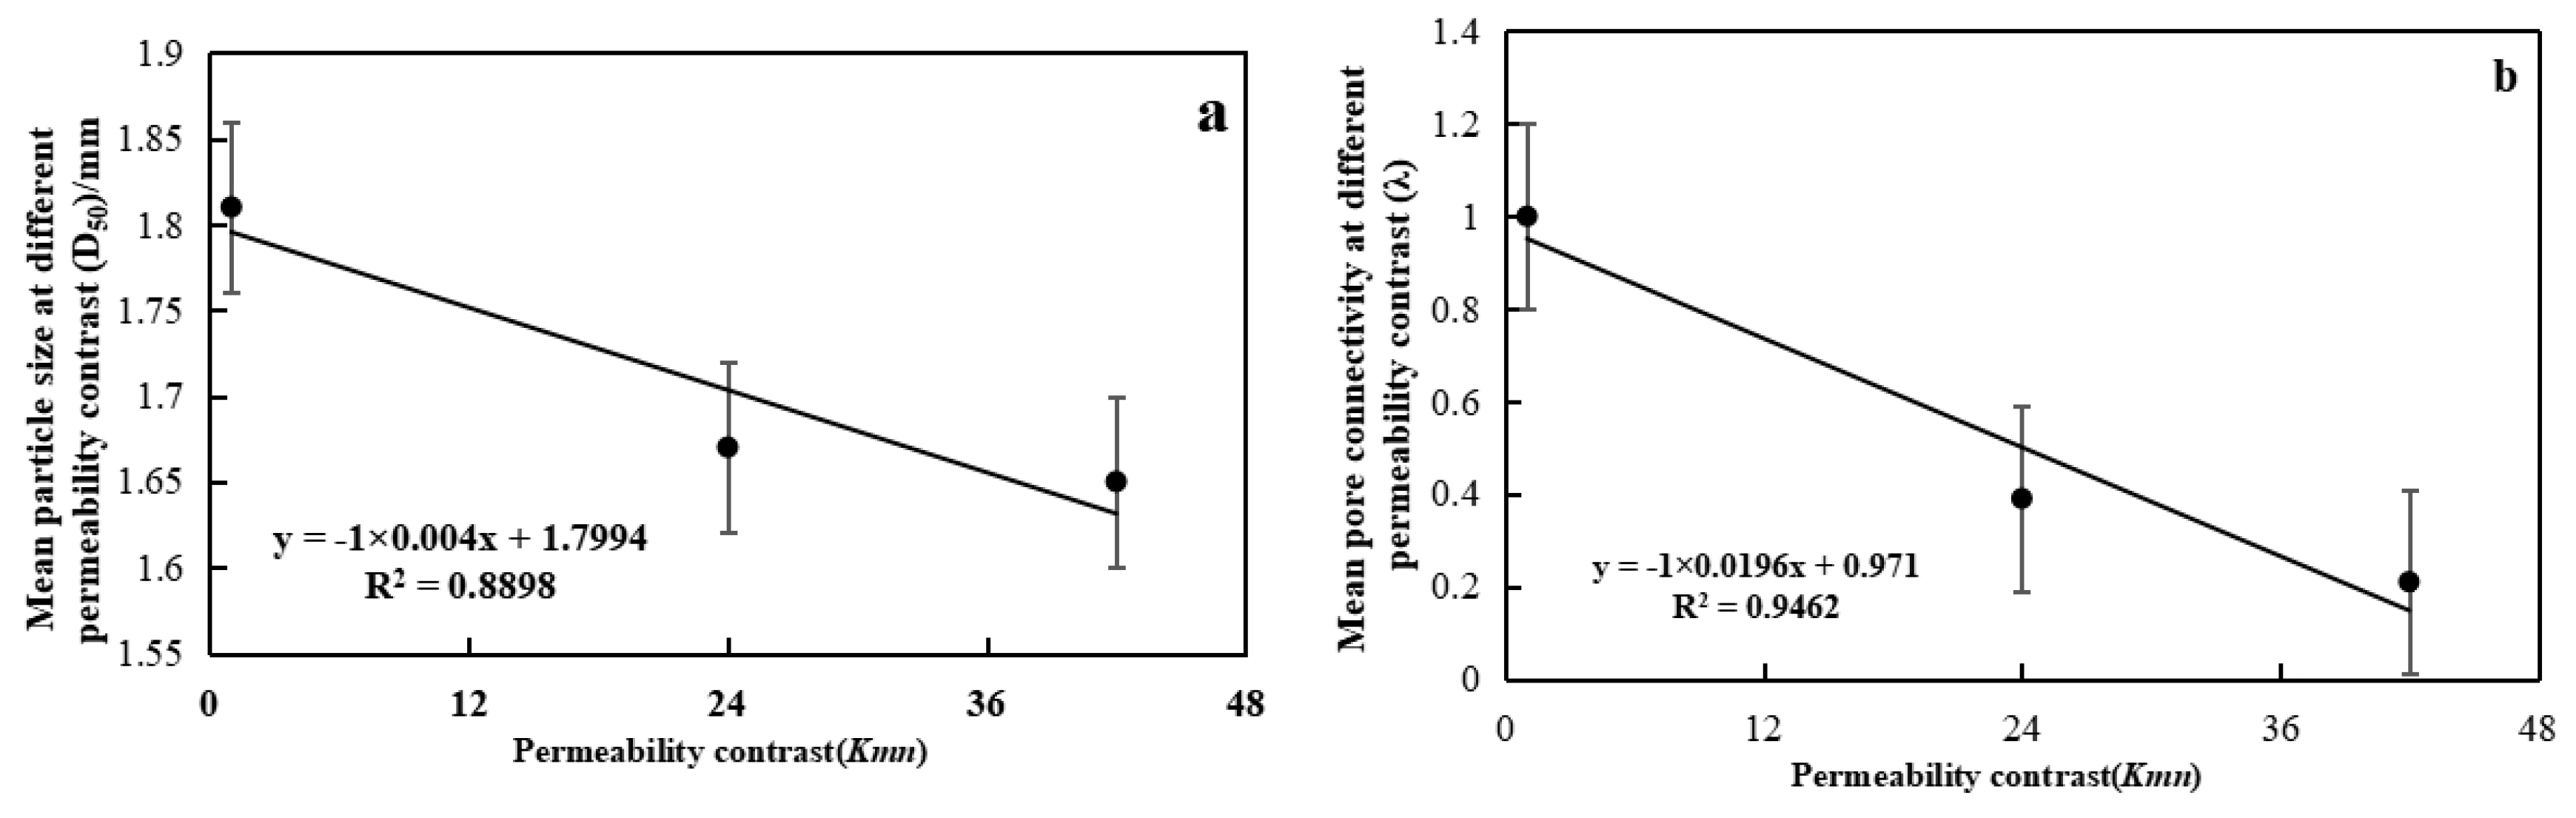
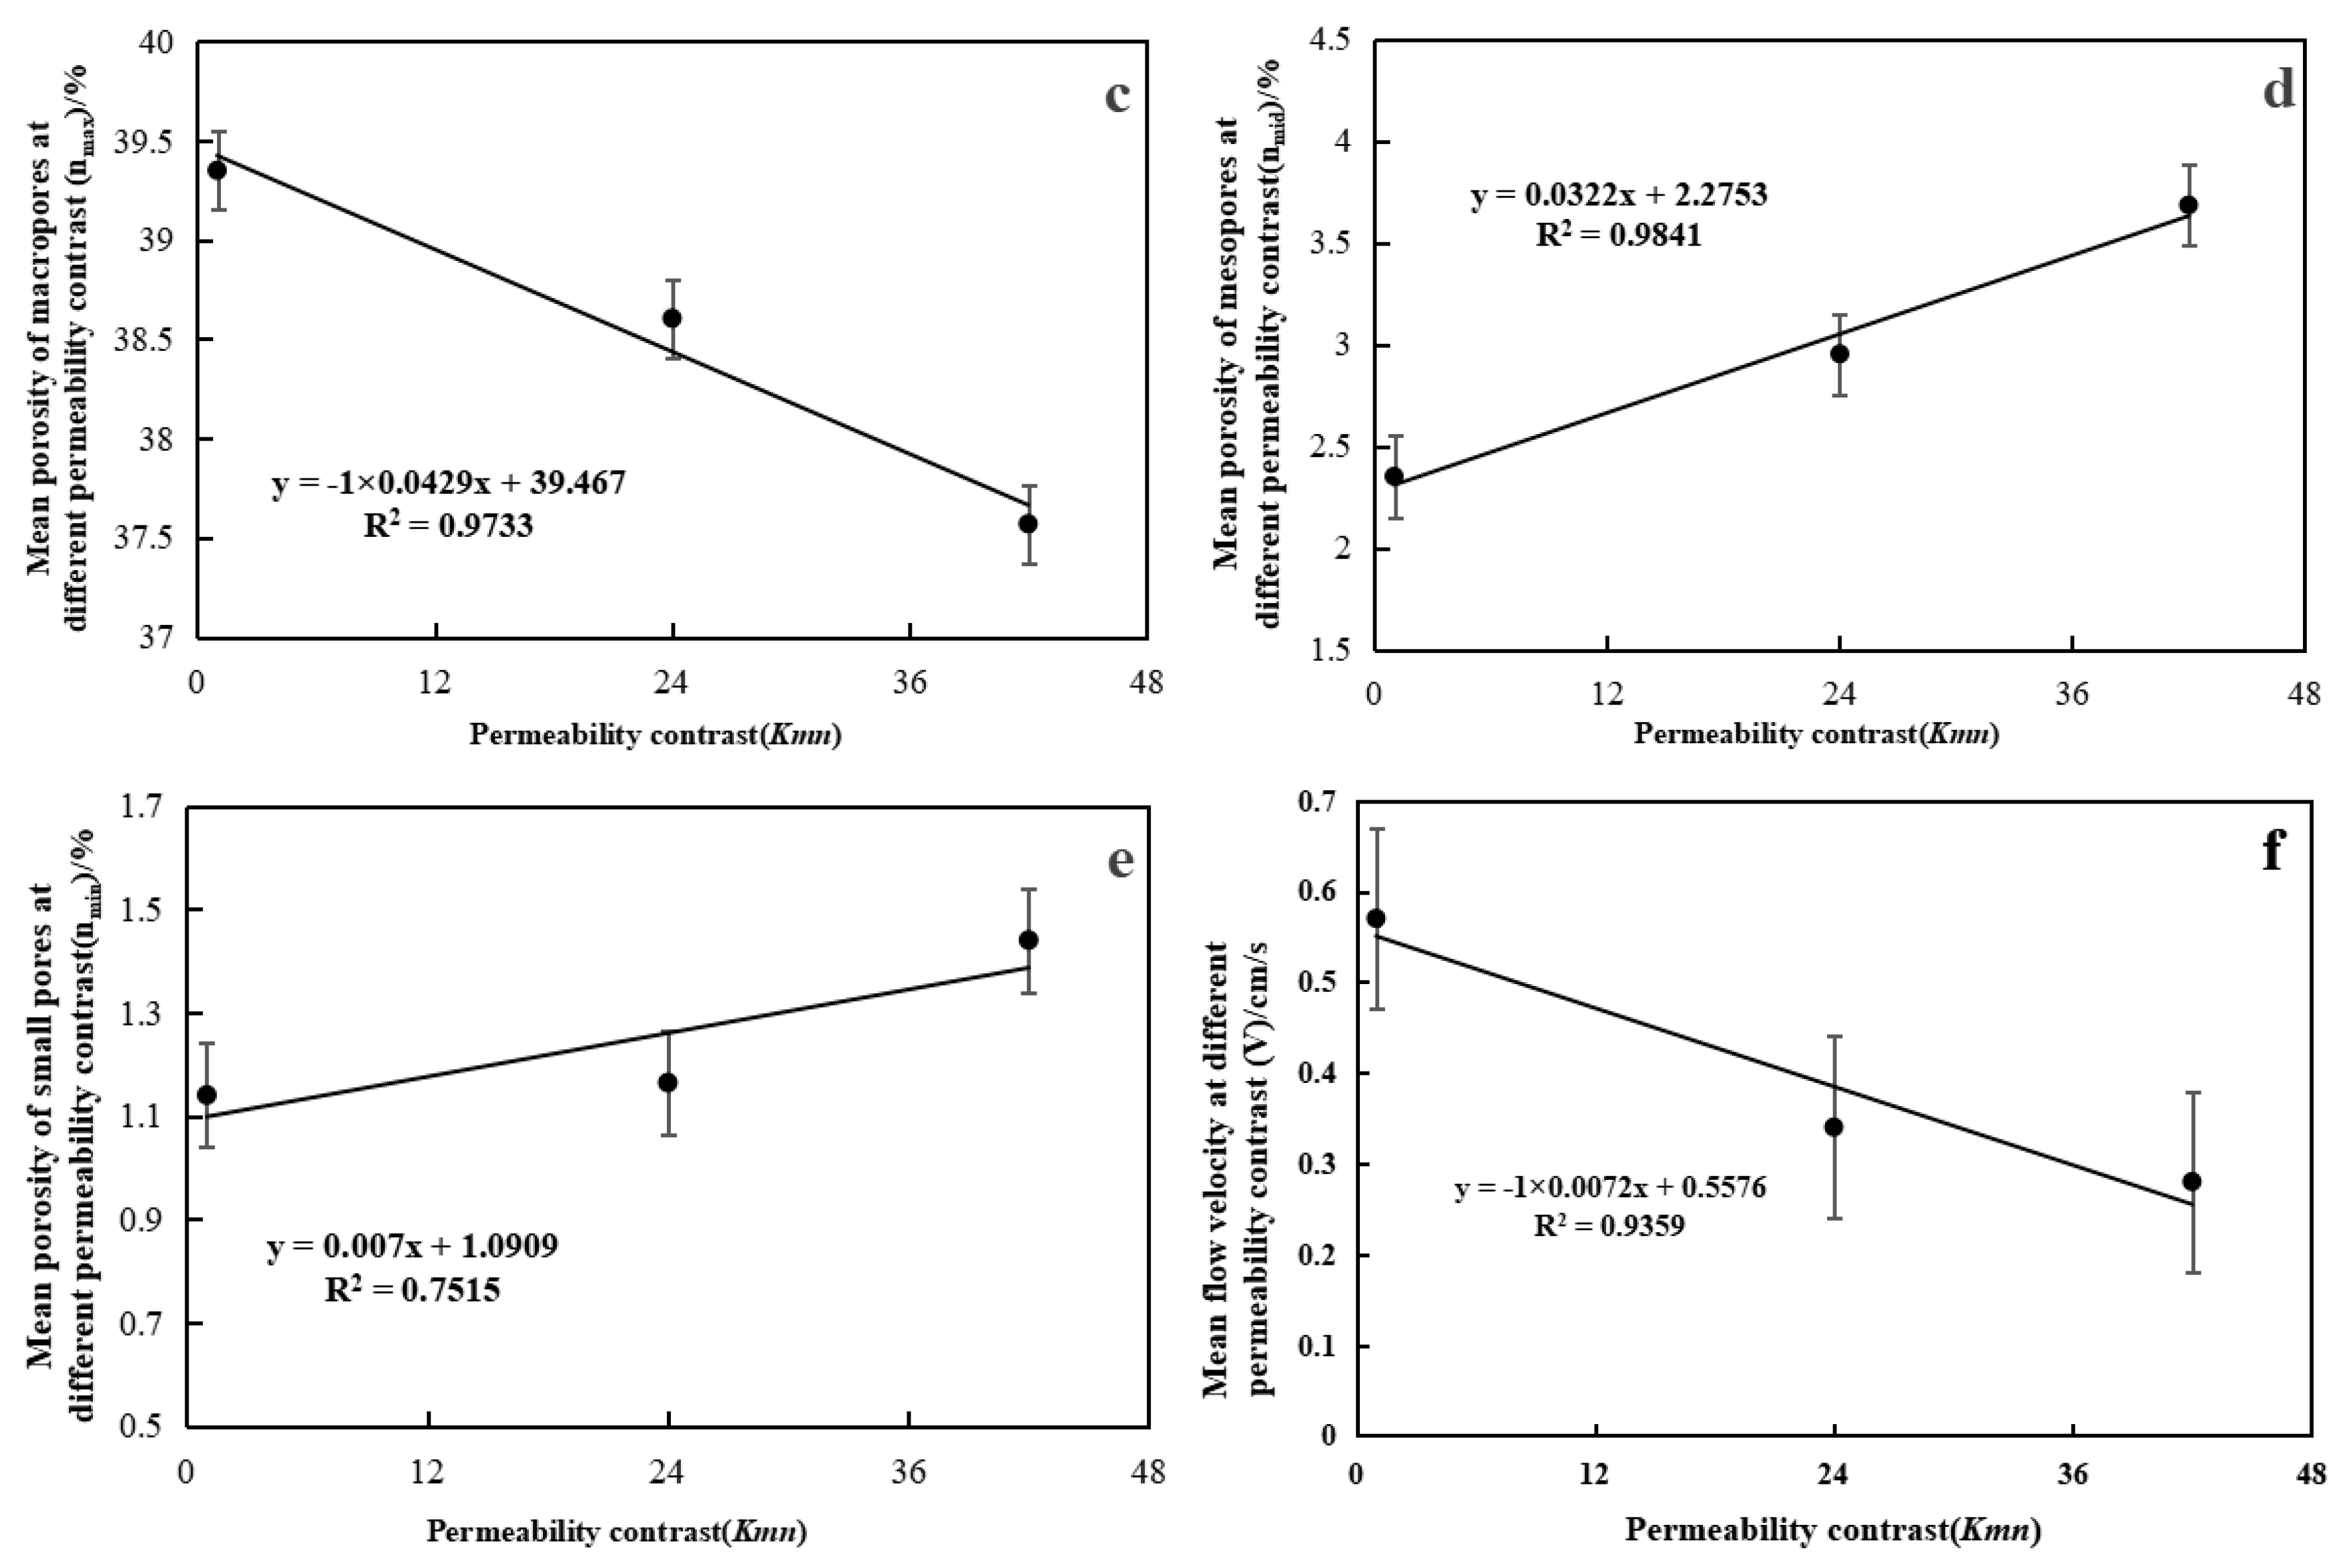
4.2. Effect of Permeability Coefficient Range on NAPL Residuals

In accordance with the calculation method for K j n ¯ outlined in Section 3.1 of the orthogonal experiment analysis, the medium characteristics corresponding to various ranges of Kmn were computed. This study examined the relationship between Kmn and the medium characteristics, as well as the correlation between the medium characteristics and Sr. Furthermore, the mechanisms by which Kmn affects NAPL residuals are discussed, integrating the analyses of residual NAPL adsorption and retention forces in Section 4.1.
Figure 8 depicts the correlation analysis curve depicting the relationship between medium characteristics and the variation in Kmn. As shown in Figure 8, an increase in Kmn corresponds with a decrease in the overall average particle size of the medium (Figure 8a). Additionally, the connectivity of the medium’s overall pores deteriorates (Figure 8b), while the macropore porosity experiences a decline (Figure 8c). Conversely, both mesopore and micropore porosities exhibit an increase (Figure 8d,e), and V diminishes (Figure 8f).
Figure 9 illustrates the correlation analysis curve of Sr in relation to variations in medium characteristics. The results indicate the following trends: As the average particle size increases, Sr decreases (Figure 9a). Poorer pore connectivity within the medium corresponds to a higher Sr (Figure 9b). A reduction in macropore porosity, coupled with increases in mesopore and micropore porosities, leads to a rise in Sr (Figure 9c–e). Decreasing V is associated with an increase in Sr (Figure 9f).
In Figure 8, several observations can be made: (1) An increase in Kmn is associated with a decrease in the average particle size (Figure 8a). When this result is integrated with the information in Section 4.1 and Figure 9a, a reduction in particle size corresponds to an increase in specific surface area, which in turn leads to a higher residual amount of NAPL. (2) As Kmn increases, the disparity in pore size between the aquifer and the lens body at the contact point becomes more pronounced, resulting in diminished pore connectivity (Figure 8b). Based on this observation and the relationship discussed in Section 4.1 and Figure 9b, it can be inferred that increased resistance to the movement or deformation of NAPL droplets at the interface, characterized by NAPL droplet wettability, leads to a higher Sr. (3) For larger Kmn, macropore porosity exhibits a declining trend, while the mesopore and micropore porosities increase, thereby expanding the storage capacity for residual NAPL (Figure 8c–e). Therefore, when combined with the results in Section 4.1 and Figure 9c–e, Sr increases as the water content and storage space within the medium rise. (4) As Kmn increases, V decreases (Figure 8f). This reduction in V lowers the P exerted on residual NAPL droplets and increases the resistance to their movement, ultimately leading to a higher Sr (Section 4.1 and Figure 9f).

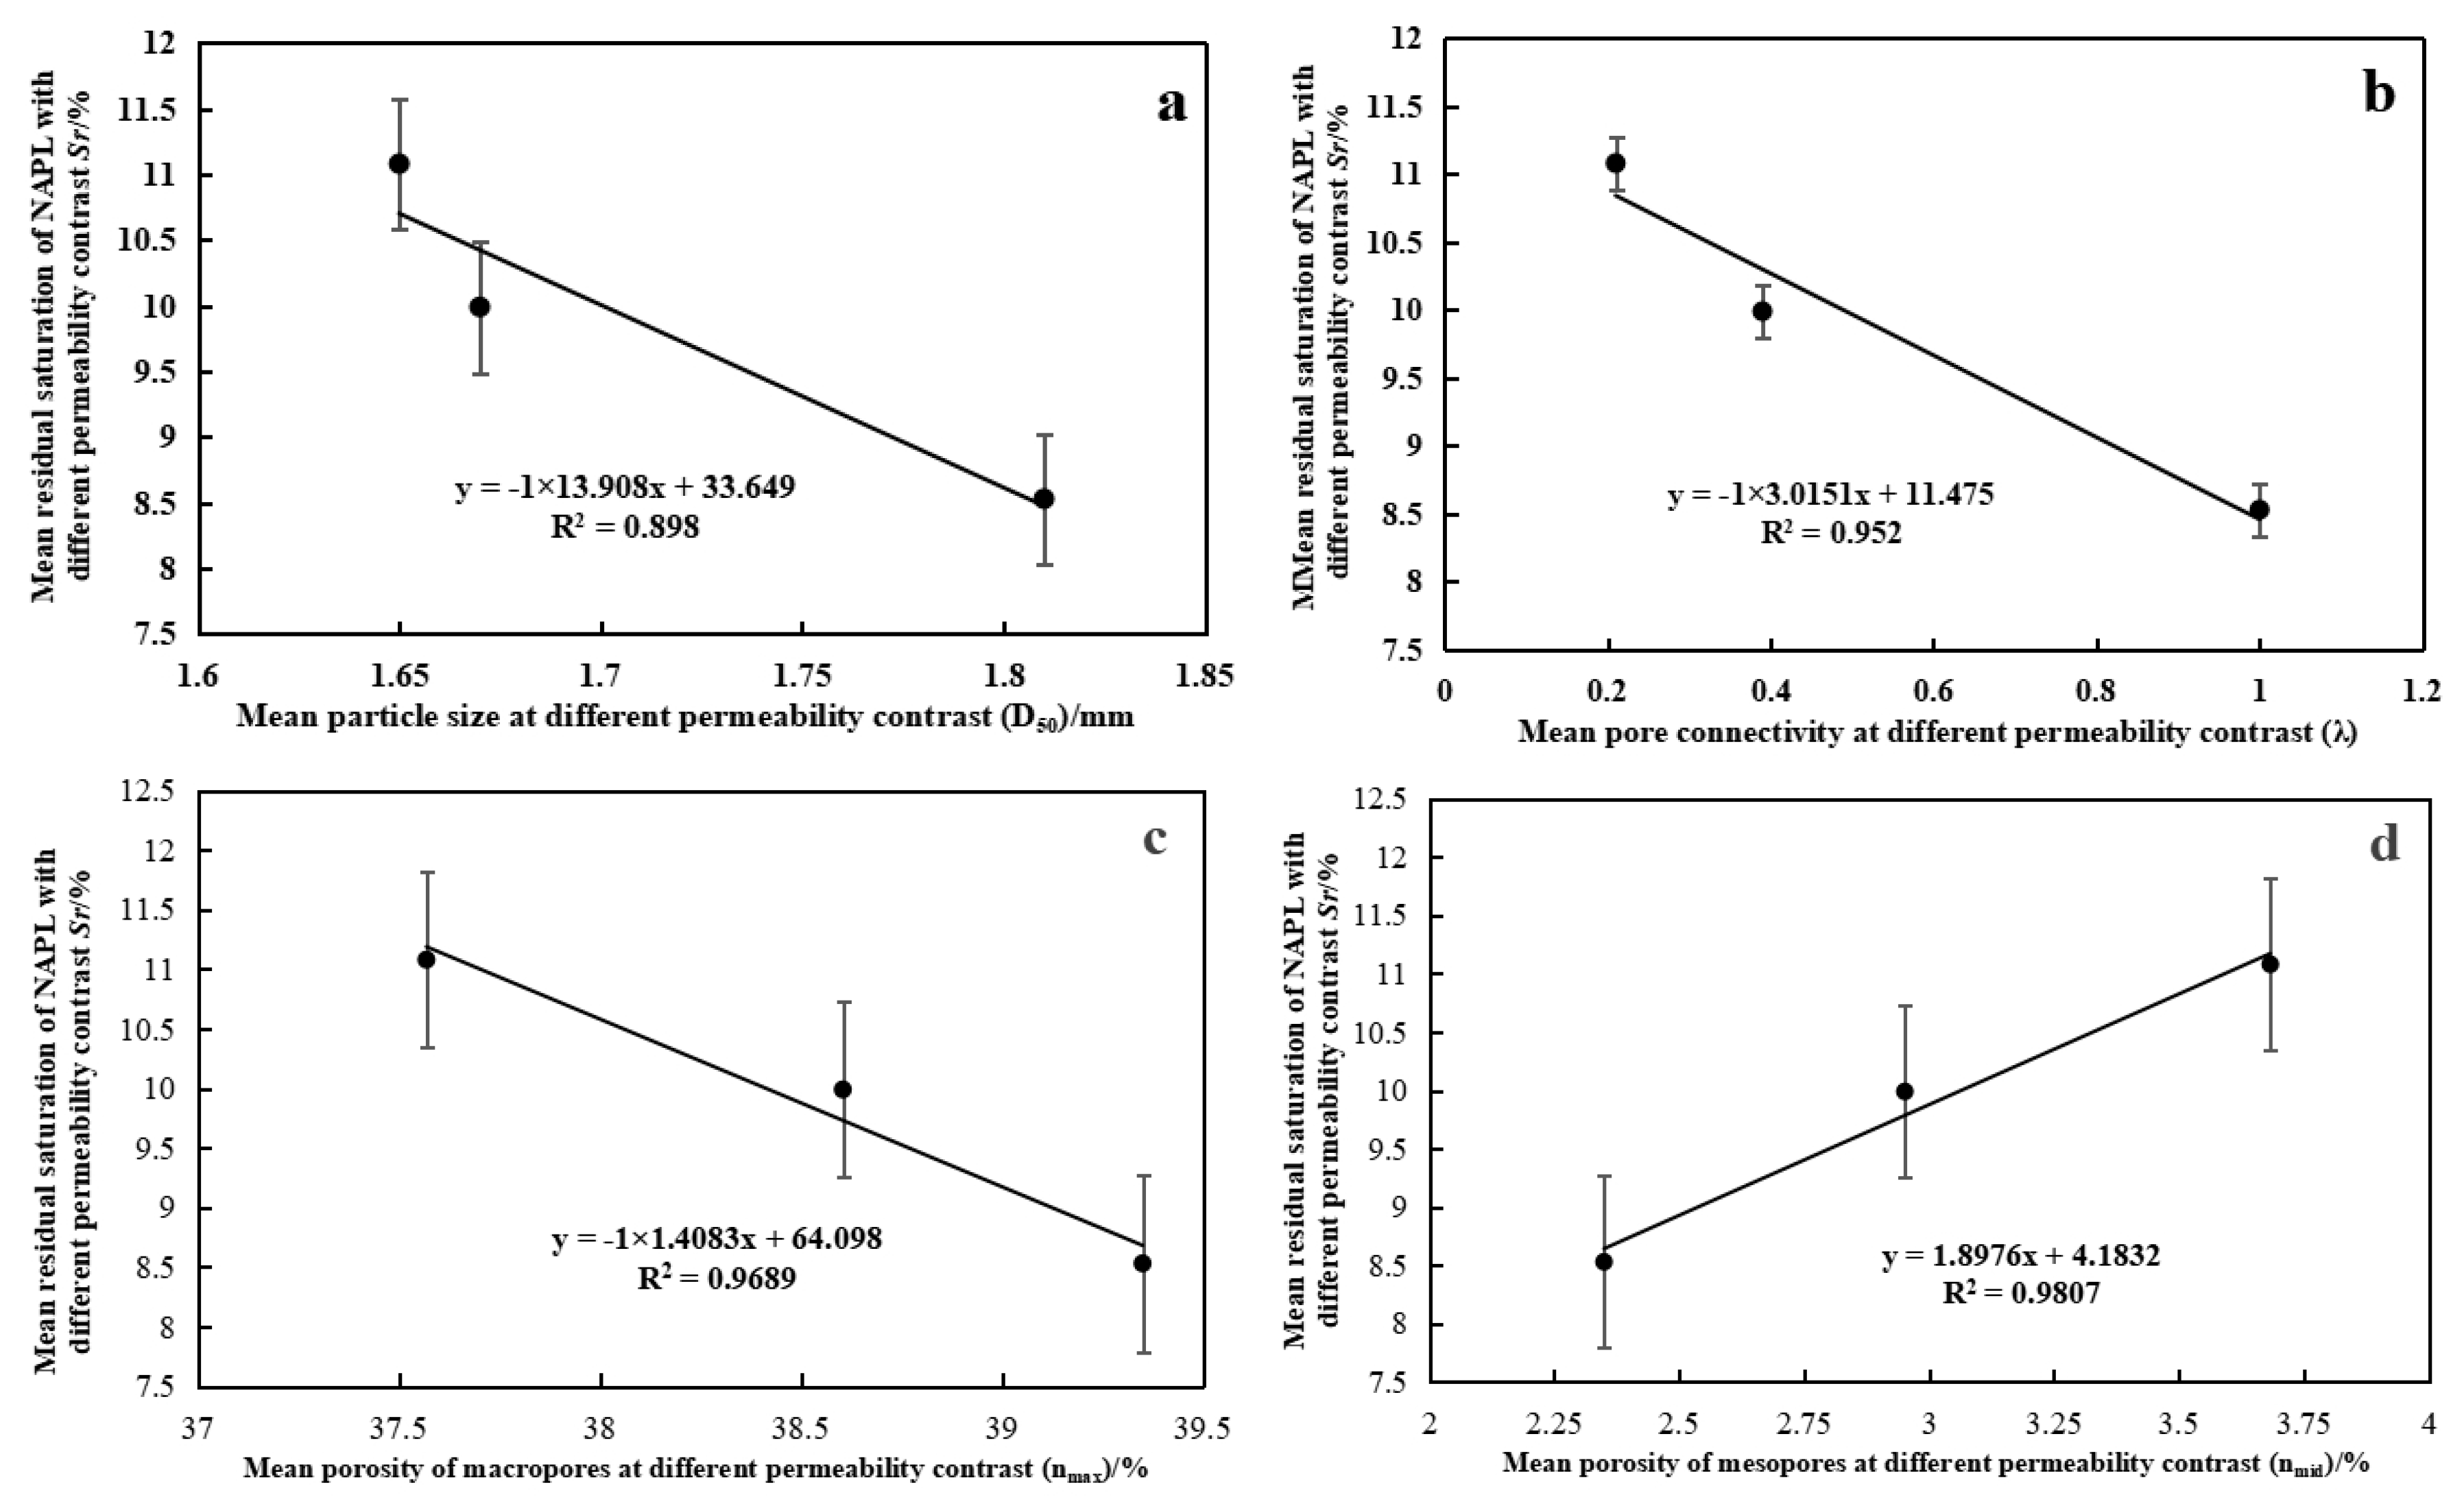
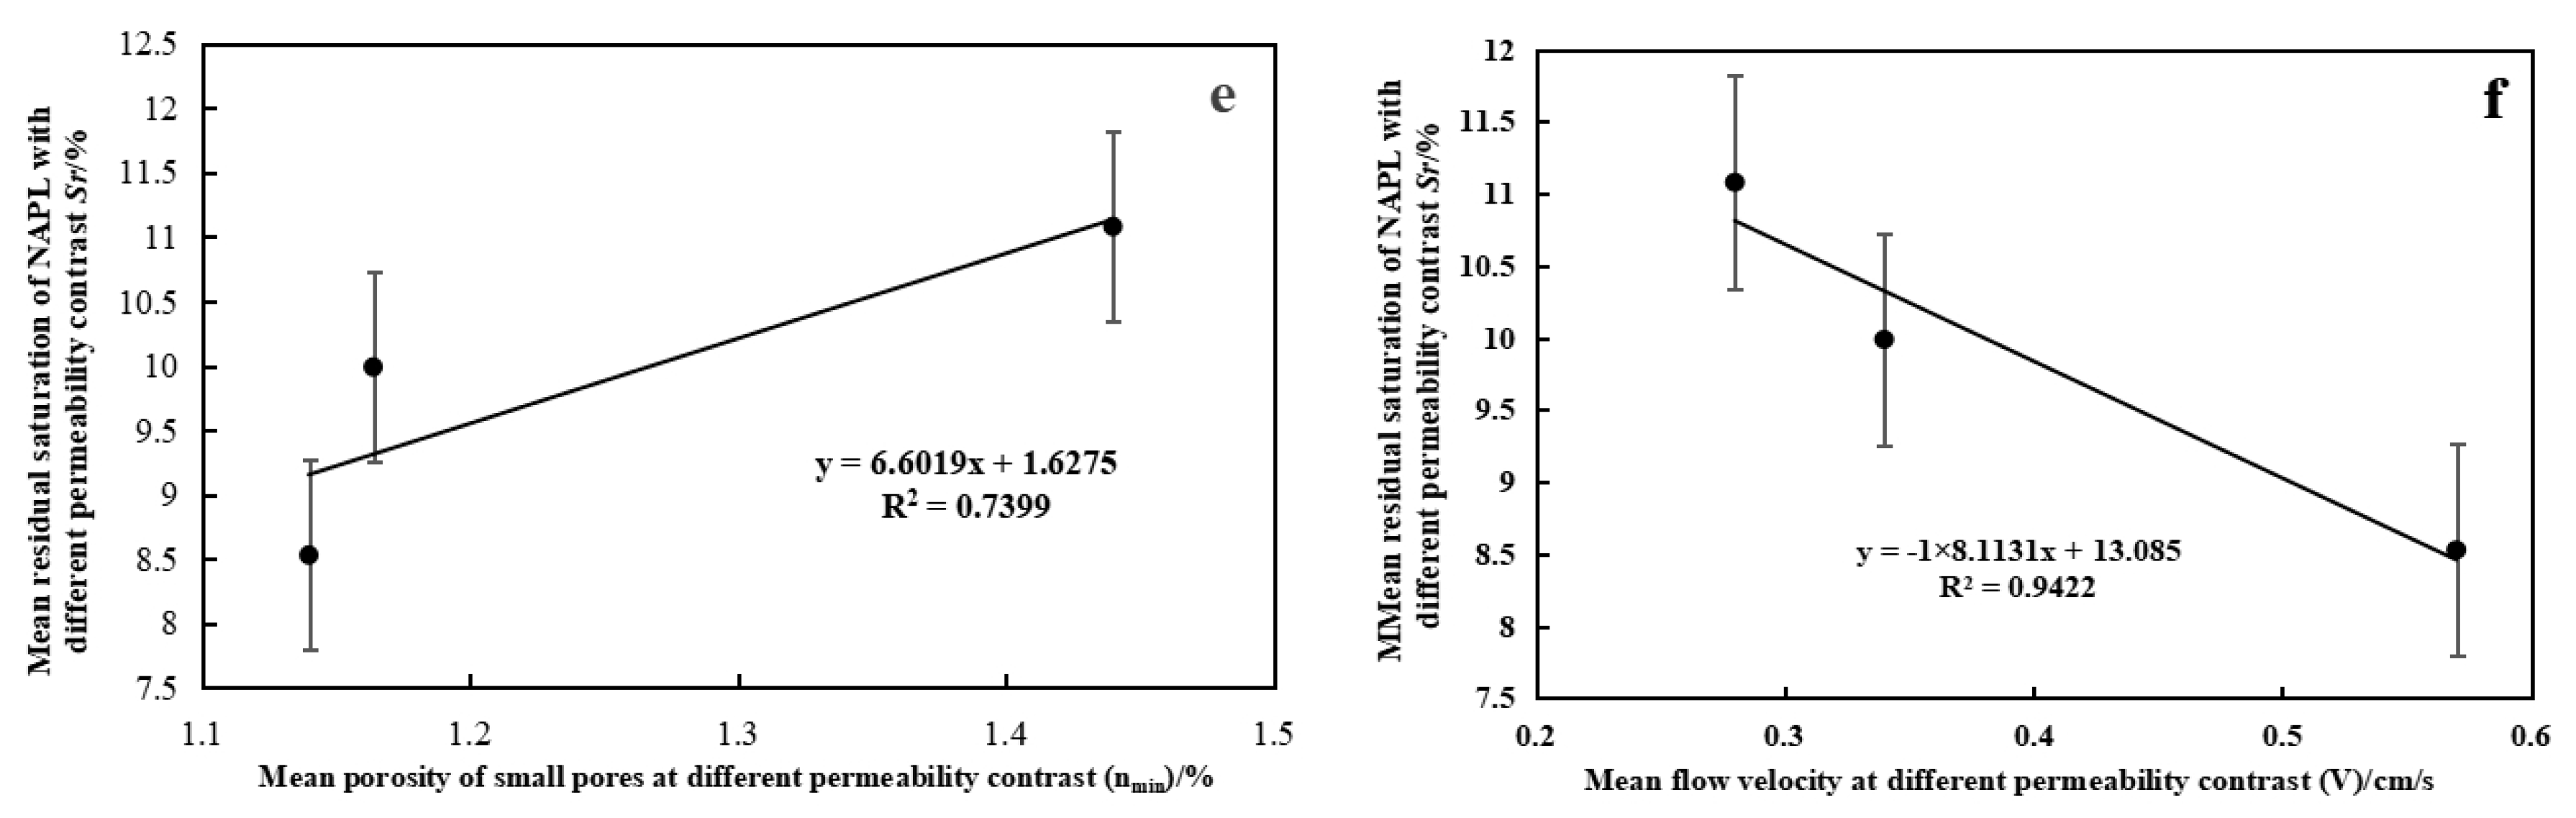
4.3. Mechanism Affecting ϕ on NAPL Residuals

In accordance with the calculation method for K j n ¯ outlined in Section 3.1 of the orthogonal experiment analysis, the medium characteristics corresponding to various ϕ were computed. This study examined the relationship between ϕ and the medium characteristics, as well as the correlation between these medium characteristics and Sr. Furthermore, the mechanisms by which ϕ affects NAPL residuals were explored, integrating the analyses of residual NAPL adsorption and the entrapment forces associated with residual NAPL (Section 4.1).
Figure 10 depicts the correlation analysis curves of the medium characteristics as ϕ varies. As shown in Figure 10a, the overall average particle size of the medium exhibits a gradual decrease with an increase in ϕ. Concurrently, Figure 10b presents a decline in the macropore porosity of the medium. In contrast, the porosity of mesopores and micropores shows an increasing trend (Figure 10c,d). Additionally, Figure 10e illustrates a reduction in the flow velocity of underground water.
Figure 11 illustrates the correlation analysis curves depicting the relationship between Sr and variations in medium characteristics. The analysis reveals that, as the average particle size increases, Sr decreases (Figure 11a). Conversely, a reduction in macropore porosity, accompanied by an increase in mesopore and micropore porosities, results in higher Sr (Figure 11b–d). Furthermore, a decrease in V is associated with an increase in Sr (Figure 11e).
In Figure 10, several conclusions can be drawn: (1) As ϕ increases, the average particle size decreases (Figure 10a). This reduction in particle size leads to an increase in specific surface area, which, in turn, results in a higher residual NAPL amount, as illustrated in Figure 11a. This result is consistent with the observations in Section 4.1. (2) An increase in ϕ correlates with a reduction in macropore porosity, while simultaneously enhancing mesopore and micropore porosity. This alteration increases the storage capacity for residual NAPL (Figure 10b–d). By combining the results from Section 4.1 and Figure 11b–d, we observe that Sr increases as the mesopore and micropore porosities rise. (3) As ϕ increases, V decreases (Figure 10e). When these results are considered alongside the insights from Section 4.1 and Figure 11e, it is apparent that this reduction in V leads to decreased P exerted on residual NAPL droplets. Consequently, the resistance to NAPL droplet migration increases, resulting in a further rise in Sr.

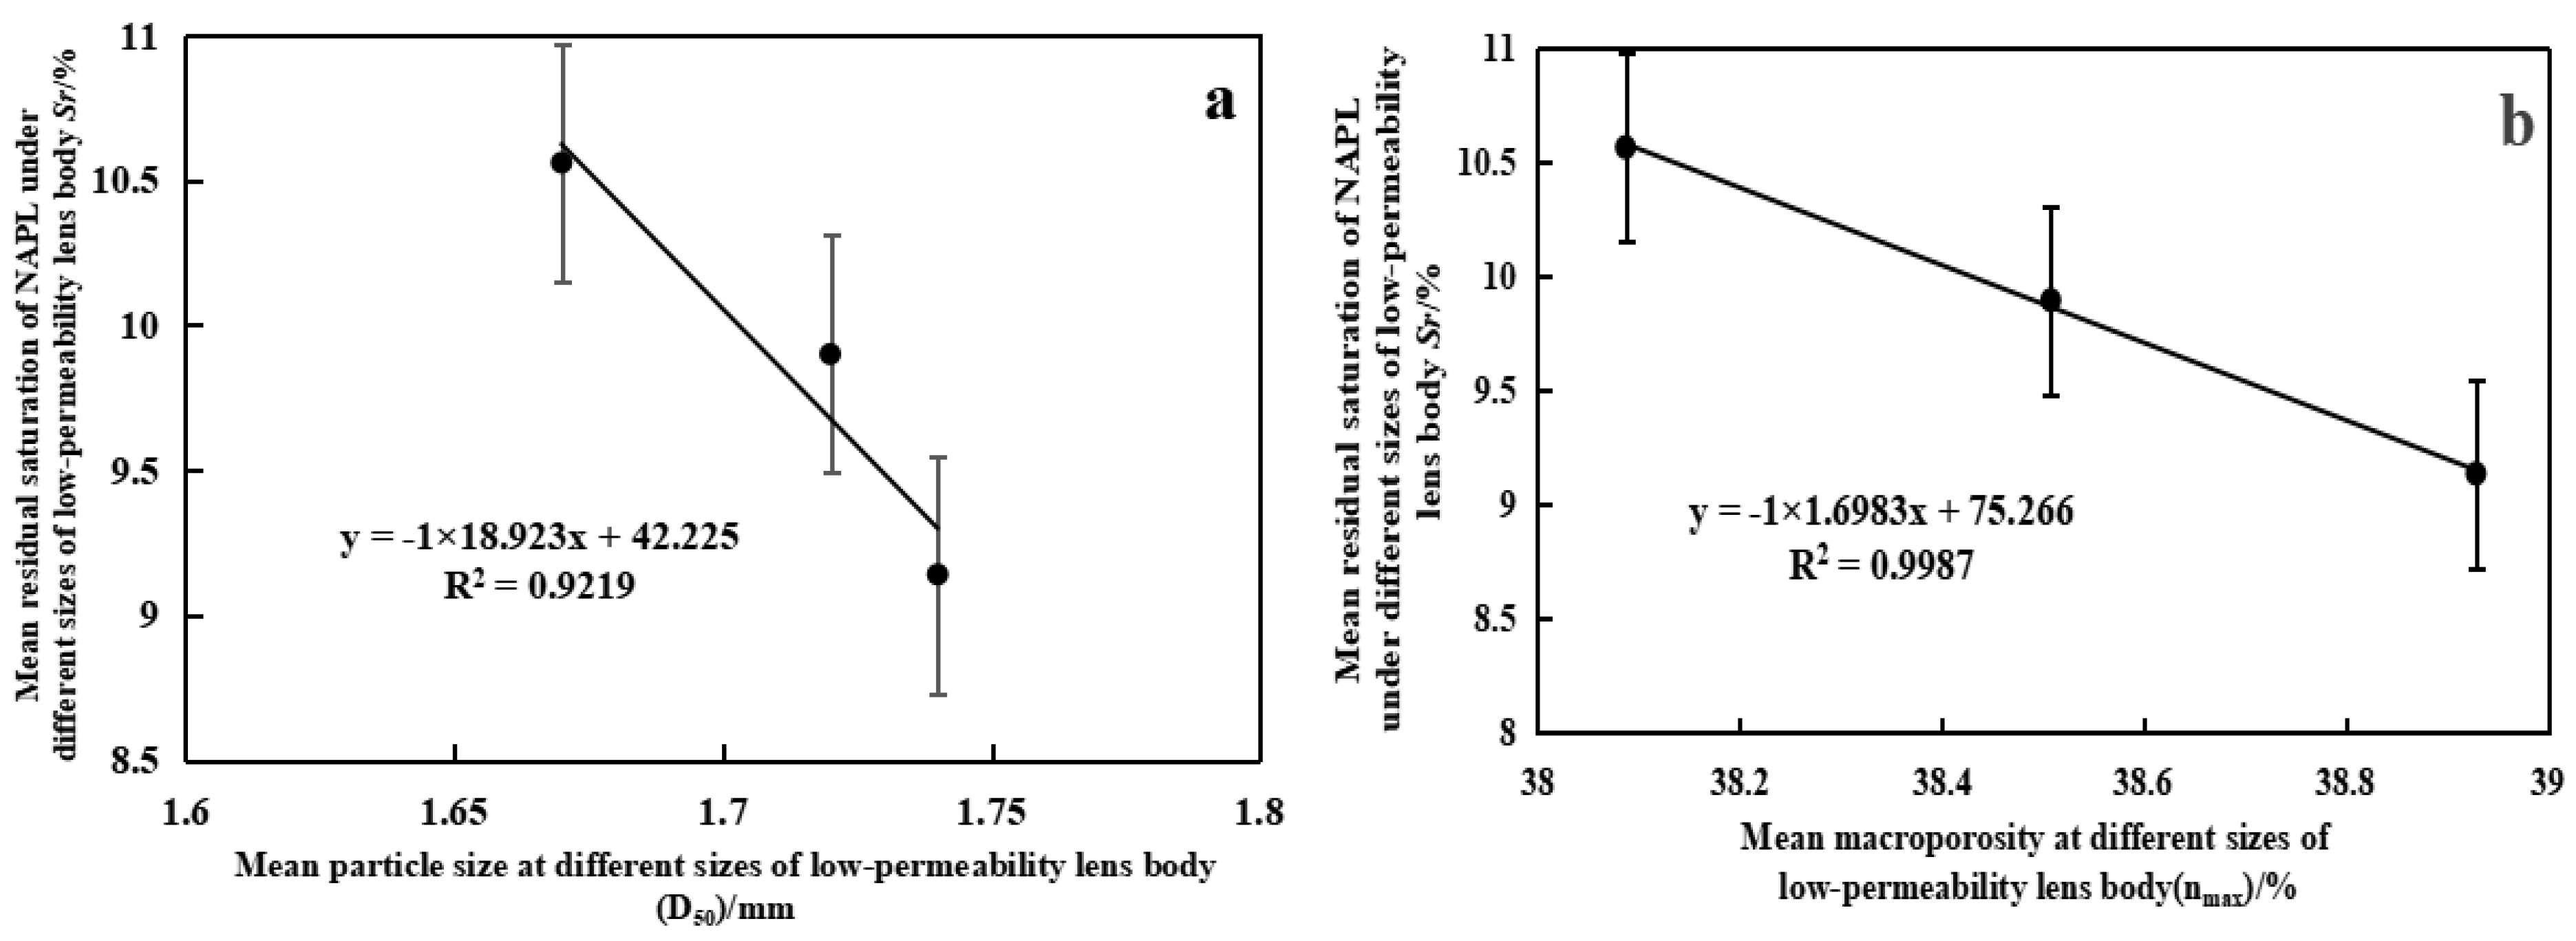
4.4. Mechanism Affecting I on NAPL Residuals

I only affects V, which subsequently impacts the residual NAPL. Consequently, in accordance with the calculation principles in Section 3.1 for K j n ¯ in the orthogonal experimental comprehensive analysis, V at varying I was computed. This analysis facilitates an examination of the relationship between I and V, as well as an exploration of the mechanisms by which I affects NAPL residuals. This exploration was conducted in conjunction with the residual NAPL adsorption in Section 4.1 and an analysis of the dominant forces contributing to NAPL retention.
Figure 12a illustrates the correlation between V and I, showing that an increase in I results in a corresponding rise in V. Figure 12b depicts the relationship between Sr and I. As I increases, V also rises. When these findings are combined with the results from Section 4.1, it is apparent that this increase in V enhances the P acting on residual NAPL droplets, facilitating their accelerated migration. As a result, Sr decreases.

5. Conclusions and Outlook

5.1. Conclusions

The sensitivity ranking of factors affecting the residual NAPL in aquifers containing low-permeability lens bodies is determined as follows: Kmn > ϕ > I.
Sr increases with an increase in Kmn, driven by the following factors: (1) As Kmn increases, the average particle size decreases, resulting in a greater specific surface area and enhanced NAPL adsorption onto the particles. (2) The greater the Kmn, the more pronounced the difference in pore sizes between the aquifer and lens. This leads to reduced pore connectivity, increasing the resistance to NAPL droplet migration at the interface between the lens and aquifer. (3) A higher Kmn reduces the porosity of large pores and increases the porosity of medium and small pores, thereby increasing the storage capacity for residual NAPL. (4) An increase in Kmn reduces V, lowering the pressure exerted on migrating residual NAPL droplets, which in turn reduces the mobility of NAPL and increases the resistance to its migration.
Similarly, ϕ also has a positive effect on Sr. This is primarily due to the following: (1) As ϕ increases, the average particle size decreases, leading to an increase in specific surface area and more NAPL adsorption onto the particles. (2) With a larger ϕ, the porosity of large pores decreases, while the porosity of medium and small pores increases. This enhances the storage volume for residual NAPL. (3) As ϕ increases, the migrating NAPL droplets become trapped more easily in pore spaces, leading to a slower migration rate. This enhances the resistance to NAPL migration, promoting the formation of residues.
Finally, I has an inverse relationship with Sr. As I increases, V rises, and the pressure on NAPL droplets during migration increases, facilitating the transport of NAPL through the porous medium and reducing its retention.

5.2. Outlook

This study assumed that the pore spaces in aquifers are uniform capillary tubes and that residual NAPL droplets are spherical. However, in real-world aquifers, the pore structure is far more complex, with variable pore sizes and tortuous shapes [52]. Furthermore, residual NAPL droplets may exhibit different shapes based on their locations within the aquifer [50,53]. The particle size, gradation, contact patterns, and arrangement, as well as the shape of the particles, all affect the retention and adsorption of NAPL in the pores. While this study provides preliminary insights into NAPL residuals in low-permeability lens-bearing aquifers, it has certain limitations.
Future research will focus on refining soil column experiments to study the behavior of NAPL residuals under varying permeability coefficient ratios. Future work will incorporate advanced imaging techniques such as computed tomography (CT) scanning, magnetic resonance imaging (MRI), and scanning electron microscopy (SEM) to examine the effects of grain size distribution and pore structure in different lenses on the quantity, distribution, and morphological characteristics of NAPL residuals. This will provide deeper insights into the mechanisms governing NAPL retention and migration in aquifers containing low-permeability lens bodies. This study can provide new ideas for the field of pollution geology and provide a theoretical basis and application support for the pollution remediation of related enterprises such as petrochemical, refining, and steel industries, as well as the green, low-carbon, and sustainable development of ecological environment security.

Author Contributions

Conceptualization, W.S. and L.S.; methodology, W.S. and S.W.; software, W.S.; validation, W.S. and S.W.; formal analysis, W.S.; investigation, S.W. and L.S.; resources, W.S., L.S. and S.W.; data curation, W.S.; writing—original draft preparation, W.S.; writing—review and editing, W.S. and L.S.; project administration, L.S.; funding acquisition, W.S. and L.S. All authors have read and agreed to the published version of the manuscript.

Funding

This research was supported by National Natural Science Foundation of China (No. 42007171), the S&T program of Hebei (grant number 22377602D), the Hebei Natural Science Foundation (grant number D2022504009) and Basal Research Found of IHEG (CAGS:sk202319, JKYZD202412).

Institutional Review Board Statement

Not applicable.

Informed Consent Statement

Not applicable.

Data Availability Statement

The original contributions presented in this study are included in the Article, further inquiries can be directed to the corresponding author.

Acknowledgments

Thank you for the support from the laboratory of Qinghai University in terms of experiments.

Conflicts of Interest

The authors declare no conflicts of interest.

References

  1. Wang, H.; Li, Y.; Li, C.; Zhu, H.; Li, Z.; Wang, L.; Medina-Rodriguez, B.X. Unveil the controls on CO2 diffusivity in saline brines for geological carbon storage. Geoenergy Sci. Eng. 2025, 244, 213483. [Google Scholar] [CrossRef]
  2. Gong, J.; Tang, K.; Wang, H. Zone-division of water crisis and corresponding strategies in China. Resour. Sci. 2015, 37, 1314–1321. [Google Scholar]
  3. Lin, K.S.; Mdlovu, N.V.; Chen, C.Y.; Chiang, C.L.; Dehvari, K. Degradation of TCE, PCE, and 1, 2–DCE DNAPLs in contaminated groundwater using polyethylenimine-modified zero-valent iron nanoparticles. J. Clean. Prod. 2018, 175, 456–466. [Google Scholar]
  4. Li, S.; Liu, F.; Li, W.; Li, C.; Huang, F.; Jin, S.; Liu, J.; Yang, L.; Piao, H.; Zhang, Y.; et al. Prioritization of organic contaminants in China’s groundwater based on national-scale monitoring data and their persistence, bioaccumulation, and toxicity. Sci. Total Environ. 2024, 929, 172656. [Google Scholar] [CrossRef] [PubMed]
  5. Zhu, X.; Han, B.; Yin, E. Research Progress on Groundwater Contamination by DNAPLs. Sichuan Environ. 2005, 24, 65–70. [Google Scholar]
  6. Wang, H.; Xin, Y.; Kou, Z.; He, C.; Li, Y.; Wang, T. Unveil the role of engineering parameters on hydrogen recovery in deep saline aquifer, Rock Springs Uplift, Wyoming. Renew. Energy 2024, 255, 120261. [Google Scholar]
  7. Wang, H.; Kou, Z.; Ji, Z.; Wang, S.; Li, Y.; Jiao, Z.; Johnson, M.; McLaughlin, J.F. Fred McLaughlin. Investigation of enhanced CO2 storage in deep saline aquifers by WAG and brine extraction in the Minnelusa sandstone, Wyoming. Energy 2023, 265, 126379. [Google Scholar] [CrossRef]
  8. Rao, P.C.; Annable, M.D.; Kim, H. NAPL source zone characterization and remediation technology performance assessment: Recent developments and applications of tracer techniques. J. Contam. Hydrol. 2000, 45, 63–78. [Google Scholar]
  9. Zheng, F.; Gao, Y.; Shi, X.; Wu, J. Influence of groundwater flow velocity and geological heterogeneity on DNAPL migration in saturated porous media. J. Hydraul. Eng. 2015, 46, 925–933. [Google Scholar]
  10. Shi, Y. Fate and Transport of Typical Organic Pollutants in Saturated Porous Media. Ph.D. Thesis, Nanjing University, Nanjing, China, 2019. [Google Scholar]
  11. Chapman, S.W.; Parker, B.L. Plume persistence due to aquitard back diffusion following dense nonaqueous phase liquid source removal or isolation. Water Resour. Res. 2005, 41, W12411. [Google Scholar]
  12. Pan, Y.; Yang, J.; Jia, Y.; Xu, Z. Experimental study on non-aqueous phase liquid multiphase flow characteristics and controlling factors in heterogeneous porous media. Environ. Earth Sci. 2016, 75, 1–13. [Google Scholar] [CrossRef]
  13. Song, Y.A.; Hou, D.Y.; Zhao, Y.S.; Zhu, J.; Zhang, Q.; Qin, C.Y.; Wang, W.F. Remediation strategies for contanminated groundwater at chemical industrial sites in the Bejing-Tianjin-Hebei region. Res. Environ. Sci. 2020, 33, 1345–1356. [Google Scholar]
  14. Mateas, D.J.; Tick, G.R.; Carroll, K.C. In situ stabilization of NAPL contaminant source-zones as a remediation technique to reduce mass discharge and flux to groundwater. J. Contam. Hydrol. 2017, 204, 40–56. [Google Scholar] [CrossRef]
  15. Shu, S.; Liang, H.; Yuan, Y. Numerical analysis of transportation and distribution of light non-aqueous phase liquids in partially saturated heterogeneous soils. J. Hydraul. Eng. 2002, 11, 31–37. [Google Scholar]
  16. Cheng, Z.; Wu, J.; Xu, H.; Wang, J.; Gao, Y.; Li, J.; Dong, S. Investigation of the migration characteristic of DNAPL in aquifer with lenses and under the action of surfactant. China Environ. Sci. 2014, 34, 2888–2896. [Google Scholar]
  17. Wang, L. Experimental Study on Multiphase Flow in Soil Contaminated with Light Non-Aqueous Phase Liquid (LNAPL). Master’s Thesis, Chang’an University, Xi’an, China, 2009. [Google Scholar]
  18. Panter, S.E. The Hidden Potential of Mass-based Treatment: A Method for Preventing Rebound. Remediat. J. Environ. Cleanup Costs Technol. Tech. 2015, 25, 99–109. [Google Scholar] [CrossRef]
  19. Tao, J.; Shi, X.; Kang, X.; Xu, H.; Wu, J. Numerical analyses of factors affecting the LNAPL source-zone architecture. Hydrogeol. Eng. Geol. 2018, 45, 132–140. [Google Scholar]
  20. Kamon, M.; Endo, K.; Kawabata, J.; Inui, T.; Katsumi, T. Two-dimensional DNAPL migration affected by groundwater flow in unconfined aquifer. J. Hazard. Mater. 2004, 110, 1–12. [Google Scholar] [CrossRef]
  21. Luciano, A.; Viotti, P.; Papini, M.P. Laboratory investigation of DNAPL migration in porous media. J. Hazard. Mater. 2010, 176, 1006–1017. [Google Scholar] [CrossRef]
  22. Erning, K.; Grandel, S.; Dahmke, A.; Schäfer, D. Simulation of DNAPL infiltration and spreading behavior in the saturated zone at varying flow velocities and alternating subsurface geometries. Environ. Earth Sci. 2012, 65, 1119–1131. [Google Scholar] [CrossRef]
  23. Wang, X.; Wang, X.; He, T.; Li, Y.; Hou, L. The mechanism of NAPL layer formation in a microfluidic device with dual-permeability: Experiments and numerical simulation. IOP Conf. Ser. Earth Environ. Sci. 2021, 675, 012175. [Google Scholar]
  24. Kueper, B.H.; Abbott, W.; Farquhar, G. Experimental observations of multiphase flow in heterogeneous porous media. J. Contam. Hydrol. 1989, 5, 83–95. [Google Scholar] [CrossRef]
  25. Liu, H.L.; Zhou, Q.Y.; Xu, S. An experimental investigation of LNAPL migration and redistribution in unsaturated heterogeneous porous media. Hydrogeol. Eng. Geol. 2006, 52–57. [Google Scholar]
  26. Zhang, Y.; Zhu, S.; Xiao, R.; Wang, J.; Li, F. Vertical transport of polycyclic aromatic hydrocarbons in different particle-size fractions of sandy soils. Environ. Geol. 2008, 53, 1165–1172. [Google Scholar]
  27. Shi, X.Q.; Wu, J.C.; Liu, D.P.; Jiang, S.; Sun, Y.; Xu, H. Numerical simulation of transportation of dense non-aqueous phase liquids in the subsurface environment. J. Nanjing Univ. 2011, 47, 299–307. [Google Scholar]
  28. Al-Raoush Riyadh, I. Experimental investigation of the influence of grain geometry on residual NAPL using synchrotron microtomography. J. Contam. Hydrol. 2014, 159, 1–10. [Google Scholar] [CrossRef] [PubMed]
  29. Zhang, J.; Liu, Z.; Liu, S.; Wei, Q.; Wang, Y.; Lu, L. Study on Influence of Geological Heterogeneity on Migration of LNAPL in Contaminated Site Through Numerical Analysis; Springer: Singapore, 2019; pp. 834–841. [Google Scholar]
  30. Wang, B.; Xia, Y.; Qu, Z.; Zhao, Y. Natural attenuation of diesel in aquifers. Hydrogeol. Eng. Geol. 2014, 41, 138–143. [Google Scholar]
  31. Ning, Z.; Sheng, Y.; Gan, S.; Guo, C.; Wang, S.; Cai, P.; Zhang, M. Experimental and numerical study of pollution process in an aquifer in relation to a garbage dump field. Environ. Geol. 2005, 48, 1107–1115. [Google Scholar]
  32. Ning, Z.; Sheng, Y.; Gan, S.; Guo, C.; Wang, S.; Cai, P.; Zhang, M. Metagenomic and Isotopic Insights into Carbon Fixation by Autotrophic Microorganisms in a Petroleum Hydrocarbon Impacted Red Clay Aquifer. Environ. Pollut. 2024, 361, 124824. [Google Scholar]
  33. Zhou, J.; Shen, R. Dictionary of Soil Science; Science Press: Beijing, China, 2013. [Google Scholar]
  34. Heidari, P.; Li, L. Solute transport in low-heterogeneity sandboxes: The role of correlation length and permeability variance. Water Resour. Res. 2015, 50, 8240–8264. [Google Scholar] [CrossRef]
  35. Mackay, D.M.; Cherry, J.A. Groundwater contamination: Pump-and-treat remediation. Environ. Sci. Technol. 1989, 23, 630–636. [Google Scholar] [CrossRef]
  36. Hunt, J.R.; Sitar, N.; Udell, K.S. Nonaqueous phase liquid transport and cleanup: 1. Analysis of mechanisms. Water Resour. Res. 1988, 24, 1247–1258. [Google Scholar] [CrossRef]
  37. Li, Y.; Zhang, Y.; Zhang, L.; Hou, J. Characterization on pore structure of tectonic coals based on the method of mercury intrusion, carbon dioxide adsorption and nitrogen adsorption. J. China Coal Soc. 2019, 44, 1188–1196. [Google Scholar]
  38. Zhang, X.; Kong, L.; Guo, A.; Tuo, Y. Experiment study of pore distribution of strong structural clay under different consolidation pressures. Rock Soil Mech. 2014, 35, 2794–2800. [Google Scholar]
  39. Sun, L.; Wang, S.W.; Guo, C.J.; Shi, C.; Su, W. Using pore-solid fractal dimension to estimate residual LNAPLs saturation in sandy aquifers: A column experiment. J. Groundw. Sci. Eng. 2022, 10, 87–98. [Google Scholar]
  40. Zhang, X. Research of Coal-Like Materials Development and Drilling Test. Master’s Thesis, China University of Mining and Technology, Beijing, China, 2021. [Google Scholar]
  41. Huang, C.; Xu, J. Soil Science; China Agricultural Press: Beijing, China, 2010. [Google Scholar]
  42. Thomasson, A.J. Towards an objective classification of soil structure. Eur. J. Soil Sci. 1978, 29, 38–46. [Google Scholar] [CrossRef]
  43. Qian, N.; Wang, Z. Mechanics of Sediment Transport; Science Press: Beijing, China, 1986; pp. 28–32. [Google Scholar]
  44. Becher, P. Emulsions: Theory and Practice; Reinhold Pub. Corp: Washington, DC, USA, 1965. [Google Scholar]
  45. Zhao, G. Physical Chemistry of Surfactants; Peking University Press: Beijing, China, 1991; pp. 65–127. [Google Scholar]
  46. Xiao, Y.; Lu, Q.; Cheng, H.; Zhu, X.; Tang, H. Surface properties of sediments and its effect on phosphorus adsorption. J. Sediment Res. 2011, 6, 64–68. [Google Scholar]
  47. Xiao, Y.; Han, K.; Cheng, H.; Li, Q. Surface Properties of Sediments in the Waterway of Poyang Lake to Yangtze River and the Nanjing Reach of Yangtze River. South-North Water Transf. Water Scence Technol. 2014, 12, 47–50. [Google Scholar]
  48. Wu, J.W.; Zheng, X.L.; Li, L.L.; Sun, J. Adsorption of Aqueous Oil on Sands and Its Studies of Effective Factors. Environ. Sci. 2006, 27, 2019–2023. [Google Scholar]
  49. Liu, H.; Gao, S.; Lv, X. Reservoir Physics; Petroleum Industry Press: Beijing, China, 2016. [Google Scholar]
  50. Fetter, C.W. Contaminant Hydrogeology, 2nd ed.; Zhou, N.; Huang, Y., Translators; Higher Education Press: Beijing, China, 2011. [Google Scholar]
  51. Luo, Y.; Wen, T.; Lin, X.; Chen, X.; Shao, L. Quantitative analysis of pore-size influence on granite residual soil permeability using CT scanning. J. Hydrol. 2024, 645, 132133. [Google Scholar] [CrossRef]
  52. Wen, T.; Luo, Y.; Tang, M.; Chen, X.; Shao, L. Effects of representative elementary volume size on three-dimensional pore characteristics for modified granite residual soil. J. Hydrol. 2024, 643, 132006. [Google Scholar] [CrossRef]
  53. Bedient, P.B.; Rifai, H.S.; Newell, C.J. Groundwater Contamination Transport and Remediation; China Architecture & Building Press: Beijing, China, 2010. [Google Scholar]
Figure 1. Residual NAPL in low-permeability lens body leads to “tailing”.
Sustainability 17 03205 g001
Figure 2. A schematic map of the experimental device.
Sustainability 17 03205 g002
Figure 3. Standard curve corresponding to the NAPL concentrations and CODCr measurement values.
Sustainability 17 03205 g003
Figure 4. Range of each influencing factor (a) and mean NAPL residual saturation at each factor and level (b).
Sustainability 17 03205 g004
Figure 5. Cumulative distribution curve of pore size.
Sustainability 17 03205 g005
Figure 6. Cumulative curves of particle distribution.
Sustainability 17 03205 g006
Figure 7. Stress analysis diagram of residual NAPL in the aquifer containing a low-permeability lens body.
Sustainability 17 03205 g007
Figure 8. The curves of the variations in the medium characteristics with differences in the permeability contrast Kmn.
Sustainability 17 03205 g008aSustainability 17 03205 g008b
Figure 9. The curves of the variation in the residual saturation of NAPL (Sr) with medium characteristics under different permeability contrasts.
Sustainability 17 03205 g009aSustainability 17 03205 g009b
Figure 10. The curves of the variations in medium characteristics with the size of the low-permeability lens body ϕ.
Sustainability 17 03205 g010
Figure 11. The curves of the variation in the residual saturation Sr of NAPL with medium characteristics under different sizes of low-permeability lens bodies.
Sustainability 17 03205 g011aSustainability 17 03205 g011b
Figure 12. The curve of groundwater flow velocity V’s variation with the hydraulic gradient I (a) and the curve of residual saturation Sr’s variation with the groundwater flow velocity V under different hydraulic gradients (b).
Sustainability 17 03205 g012
Table 1. Properties of saturated diesel fuel used in experiments.
Viscosity (mPa·s)Surface Tension (mN·m)Liquefied Density (g/mL)Boiling Point (°C)Octane Number
2872.680.83180–36040–55
Table 2. Physical and chemical properties of experimental media.
Medium Identification NumberMedium Particle Size D (mm)Bulk Density ρ (g/cm3)Permeability Coefficient K (m/day)Porosity n (%)
Quartz Sand No. 1 (Simulated Aquifer Medium)0.25–4.001.53267.8442.85
Quartz Sand No. 2 (Simulated Lens Medium)0.08–2.001.6111.1541.07
Quartz Sand No. 3 (Simulated Lens Medium)0.05–1.001.696.3940.67
Table 3. Experimental design and parameters.
Experiment IDAquifer Medium Particle Size (mm)Low-Permeability Medium Particle Size (mm)Permeability Contrast (Kmn)Lens Size (ϕ)Hydraulic Gradient (I)Groundwater Velocity V (cm/s)
10.75–2.250.75–2.2513.5 × 104‰0.28
20.75–2.250.75–2.2513.5 × 208‰0.58
30.75–2.250.75–2.2513.5 × 3012‰0.86
40.75–2.250.125–0.25243.5 × 108‰0.43
50.75–2.250.125–0.25243.5 × 2012‰0.48
60.75–2.250.125–0.25243.5 × 304‰0.11
70.75–2.250.086–0.18423.5 × 1012‰0.61
80.75–2.250.086–0.18423.5 × 204‰0.1
90.75–2.250.086–0.18423.5 × 308‰0.14
Table 4. Results of soil column experiments.
Experiment ID123456789
Residual NAPL Saturation Sr (%)8.618.598.399.309.6711.019.5011.4312.30
Table 5. Variance analysis of Sr.
SourceSum of Squares (Type III)Degrees of FreedomMean SquareF-Valuep-ValueSignificance
Kmn9.81624.90820.2550.047*
ϕ3.05621.5286.3070.137
I2.19821.0994.5350.181
Error0.48520.242///
Total891.579////
Note: * indicates p < 0.05, signifying a statistically significant difference.
Table 6. Average particle diameter, Cu, and Cs of quartz sand samples.
Medium NumberAverage Particle Diameter D50 (mm)Uniformity Coefficient CuCurvature Coefficient Cs
Quartz Sand 11.803.771.03
Quartz Sand 20.443.751.22
Quartz Sand 30.193.071.11
Table 7. Changes in medium characteristics of each experimental group.
Experiment IDPermeability Contrast (Kmn)Lens Size (φ)Hydraulic Gradient (I)Average Particle Diameter D50/mmPorosity of Macropores nmax/%Porosity of Mesopores nmid/%Porosity of Small Pores
nmin/%
Pore Connectivity λ
113.5 × 10⁴‰1.8139.332.451.051
213.5 × 208‰1.8139.332.451.051
313.5 × 3012‰1.8139.332.451.051
4243.5 × 108‰1.7138.942.701.070.39
5243.5 × 2012‰1.6938.572.961.090.39
6243.5 × 304‰1.6138.183.211.110.39
7423.5 × 1012‰1.738.433.021.210.21
8423.5 × 204‰1.6737.513.591.380.21
9423.5 × 308‰1.5836.604.171.540.21
Disclaimer/Publisher’s Note: The statements, opinions and data contained in all publications are solely those of the individual author(s) and contributor(s) and not of MDPI and/or the editor(s). MDPI and/or the editor(s) disclaim responsibility for any injury to people or property resulting from any ideas, methods, instructions or products referred to in the content.

