Article

The Impact of ESG Performance on Green Technology Innovation: A Moderating Effect Based on Digital Transformation

School of Accounting, Nanjing University of Finance and Economics, Nanjing 210023, China
*
Author to whom correspondence should be addressed.
Sustainability 2025, 17(7), 3170; https://doi.org/10.3390/su17073170
Submission received: 15 February 2025 / Revised: 31 March 2025 / Accepted: 1 April 2025 / Published: 3 April 2025

Abstract

:
Corporate environmental, social, and governance (ESG) performance has emerged as a critical focus of societal and academic interest. This study employs an empirical analysis utilizing a sample of Chinese A-share listed companies to investigate the relationship between ESG performance and green technology innovation. The results demonstrate that ESG performance significantly enhances green technology innovation, with digital transformation acting as a moderating variable in this relationship. Furthermore, the analysis reveals that corporate social responsibility performance and internal governance mechanisms exert a more substantial influence on green technology innovation compared to other ESG dimensions. Notably, the impact of ESG performance on green technology innovation is more pronounced among firms in non-polluting industries and those operating in regions characterized by higher levels of marketization.

1. Introduction

Environmental, social, and governance (ESG) refers to the comprehensive evaluation of a company’s performance in three critical areas: environmental impact, social responsibility, and internal governance. With increasing promotion of national policies and organizational initiatives, the ESG framework has gained widespread recognition among the public. The adoption of ESG practices represents a crucial step toward achieving the goals of “carbon peak and carbon neutrality”, aligning with the principles of green development and contributing to the sustainable development of society. In recent years, global challenges such as climate change, environmental degradation, and public health crises have heightened international attention toward ESG practices. Concurrently, corporate social responsibility (CSR) performance has become a focal point for stakeholders worldwide. According to Bloomberg Industry Research, the global ESG asset market is projected to exceed USD 53 trillion by 2030, highlighting its vast potential for future growth. Data from the Wind Database and the People’s Bank of China reveal that, as of the end of June 2023, the scale of broad ESG investments in China reached RMB 37.48 trillion. Additionally, the Global Sustainable Investment Alliance (GSIA) reported that China’s sustainable investment assets amounted to RMB 33 trillion as of September 2023, with green credit accounting for a significant 86.2% of this total, positioning China as a global leader in this domain. These figures underscore the confidence and optimism of global investors in the ESG market. A deeper exploration of ESG performance is not only vital for advancing corporate development but also holds profound implications for broader social governance and sustainable economic growth.
In the context of the green development era, fostering green technology innovation has emerged as a critical objective for enterprises. Alongside the rapid advancement of emerging technologies such as artificial intelligence and big data, digital transformation has garnered significant attention from businesses worldwide. Promoting digital transformation and enhancing green technology innovation are pivotal strategies for unlocking the potential of scientific and technological advancements and driving the growth of a low-carbon economy. Digital transformation emphasizes the integration of information technologies to facilitate interconnections within enterprises, enabling supply chain optimization and comprehensive process upgrades. This transformation supports the intelligent evolution of enterprises, thereby enhancing their developmental potential and competitive strength [1]. Digital transformation serves as a pivotal moderator in the ESG–innovation relationship. It reconfigures organizational capabilities through three mechanisms: (1) data-driven ESG monitoring, (2) digital platform-enabled knowledge integration, and (3) AI-augmented innovation processes. This aligns with dynamic capability theory, suggesting that digitally mature firms better convert ESG commitments into tangible innovations. As digital transformation progresses, green technology innovation has become an indispensable pathway for achieving sustainable corporate development. Current research on green technology innovation has been predominantly shaped by engineering and economic perspectives, creating a significant research gap concerning the strategic management dimensions that determine firms’ choices between different categories of environmental innovation. Consequently, exploring the relationship between environmental, social, and governance (ESG) performance and green technology innovation, as well as its underlying mechanisms, holds significant practical importance. This exploration is particularly relevant at the enterprise level, especially within the context of digital transformation.
The potential marginal contributions of this research are as follows: i. Novel Perspective on Green Technology Innovation: While the existing literature predominantly examines green technology innovation through the lenses of financing costs and executive compensation incentives, this study investigates the impact of environmental, social, and governance (ESG) performance on corporate green technology innovation from the perspective of digital transformation. This approach aligns more closely with the current era of intelligent development and sustainable growth, offering a timely and relevant contribution to the field. ii. Quantification of Digital Transformation: Unlike previous studies that often relied on qualitative descriptions, this paper quantifies the digital transformation of enterprises, providing a more precise measurement of their digital capabilities. By exploring the moderating effect of digital transformation levels, this research enriches the existing body of knowledge and broadens the scope of inquiry in this domain. iii. Enrichment of ESG and Green Innovation Literature: This study contributes to the growing literature on ESG performance within the realm of green innovation. It elucidates the critical role of ESG in promoting green development and offers valuable insights for subsequent research. Furthermore, it underscores the societal importance of ESG and green technology innovation, providing theoretical support for the sustainable development of both enterprises and society at large.

2. Theoretical Analysis and Research Hypotheses

2.1. Corporate ESG Performance and Green Technology Innovation

With the progression of societal and economic development, an increasing number of enterprises are incorporating environmental, social, and governance (ESG) performance into their decision-making frameworks, moving beyond a sole focus on traditional financial objectives [2]. Existing theoretical frameworks suggest that strong ESG performance can serve as a positive signal to society, helping to cultivate a favorable corporate image and enhance corporate reputation [3]. Drawing on stakeholder theory and signaling theory, the regular disclosure of ESG reports and social responsibility reports by enterprises can significantly reduce information asymmetry for investors [4]. Furthermore, such disclosures can alleviate financing constraints [5,6], broaden funding opportunities [7], and lower financing costs [8]. In contrast to neoclassical theory, which advocates for the abandonment of any actions that do not maximize shareholder value, sustainability theory and green development theory are increasingly gaining acceptance among modern enterprises. These theories emphasize the importance of balancing economic performance with environmental and social responsibilities, reflecting a broader shift toward sustainable business practices.
ESG represents an advanced evolution of corporate social responsibility (CSR) in contemporary society [9,10]. Driven by the global shift toward green economic transformation, societal demand for ESG practices has grown significantly [11]. Consequently, ESG has emerged as a critical factor influencing investor decision making [12,13]. As a key tool for assessing corporate sustainability, ESG has been extensively studied in the existing literature. Firms demonstrating high levels of ESG performance tend to achieve superior outcomes in both market efficiency and financial efficiency [9,14]. For instance, Chen and Xie [15] empirically validated the positive impact of ESG performance on firms’ financial performance. Building on this, Ferdous et al. [16] further established a positive correlation between ESG disclosure and the quality of financial reporting. Additionally, ESG performance significantly enhances firm asset value [17], particularly during periods of financial instability, where it serves as a crucial safeguard for preserving corporate value [18]. Broadstock et al. [19] similarly confirmed the stabilizing effect of ESG performance on stock prices within the Chinese market. Moreover, studies by Yuan et al. [20] and Albuquerque et al. [21] demonstrated that corporate ESG practices can effectively mitigate risks related to environmental regulation compliance and asset price volatility. Luo et al. [22], focusing on Chinese listed companies, found that strong ESG performance significantly reduces the risk of stock price collapse. Pedersen et al. [12] also highlighted that corporate scale is influenced by ESG behavior, with firms exhibiting better ESG performance showing a stronger propensity for investment expansion.
Existing research further dissected ESG into its three core components: environmental (E), social (S), and governance (G). For instance, Chang et al. [23] demonstrated that robust corporate environmental governance enhances innovation levels and alleviates financing constraints. Harjoto and Jo [24], based on U.S. market data, concluded that corporate social responsibility contributes to firm value enhancement. Conversely, McGuinness et al. [25] argued that CSR is negatively correlated with return on assets (ROA), underscoring the nuanced and context-dependent nature of ESG impacts.
Currently, there is limited research on the relationship between ESG performance and green technology innovation. However, as the global focus on green development intensifies, green technology innovation is increasingly gaining attention among scholars. Green technology innovation is defined as the endogenous driver of sustainable enterprise development, aiming to achieve a harmonious balance between corporate growth and ecological preservation [26,27]. Promoting green technology innovation is a critical pathway toward achieving green development. Unlike traditional green innovation, green technology innovation emphasizes the integration of technological advancements with environmental sustainability. Balancing the relationship between “green” and “technology” can enhance both the modernization level of enterprises and environmental quality, thereby contributing to the construction of a technologically advanced and ecologically sustainable society [28,29].
In prior studies, green technology innovation was often categorized into two types: narrow green technology innovation, which refers to the output of utility model patents, and broad green technology innovation, which encompasses both creative and non-creative green technologies [30,31]. Fang et al. [32] found that increased corporate investment in green technology improves resource utilization efficiency and technological maturity, while also reducing pollution emissions. However, challenges such as long realization cycles, risk uncertainty, and high investment costs can diminish corporate willingness to invest in green technology innovation [33].
Amidst the pressures of environmental regulations and the push for green development, how does corporate ESG behavior influence green technology innovation? Long et al. [34] found that ESG performance significantly enhances societal green innovation levels at the national level. Wang et al. [30] observed that enterprises with stronger ESG performance exhibit faster growth in green invention patents. Wu et al. [35] highlighted that institutional investors’ ESG preferences significantly influence firms’ low-carbon innovation behaviors. Zheng et al. [36] identified a potential bidirectional synergy between ESG performance and green technology innovation, while Yang et al. [37] proposed a positive U-shaped relationship between ESG performance and green innovation. However, conflicting evidence exists in the literature. Cohen et al. [38] found that higher ESG ratings actually suppressed both the quantity and quality of green technology innovation in their study of U.S. energy firms. Furthermore, Raghunandan and Rajgopal [39] demonstrated that greenwashing behaviors impose additional costs on ESG activities, potentially crowding out funding for genuine green innovation. The divergence in existing research findings may be attributed to both methodological factors—such as inconsistencies in ESG rating methodologies across different agencies and potential endogeneity issues like reverse causality [6]—and corporate short-termism, where firms prioritize resource allocation toward short-term ESG impression management over substantive long-term green technology innovation, resulting in “performative” green innovation strategies aimed primarily at regulatory compliance rather than genuine technological advancement [40,41].
Based on the existing literature, this paper proposes the following hypothesis (H1):
H1. 
Holding all else constant, firms’ ESG performance significantly enhances green technology innovation.

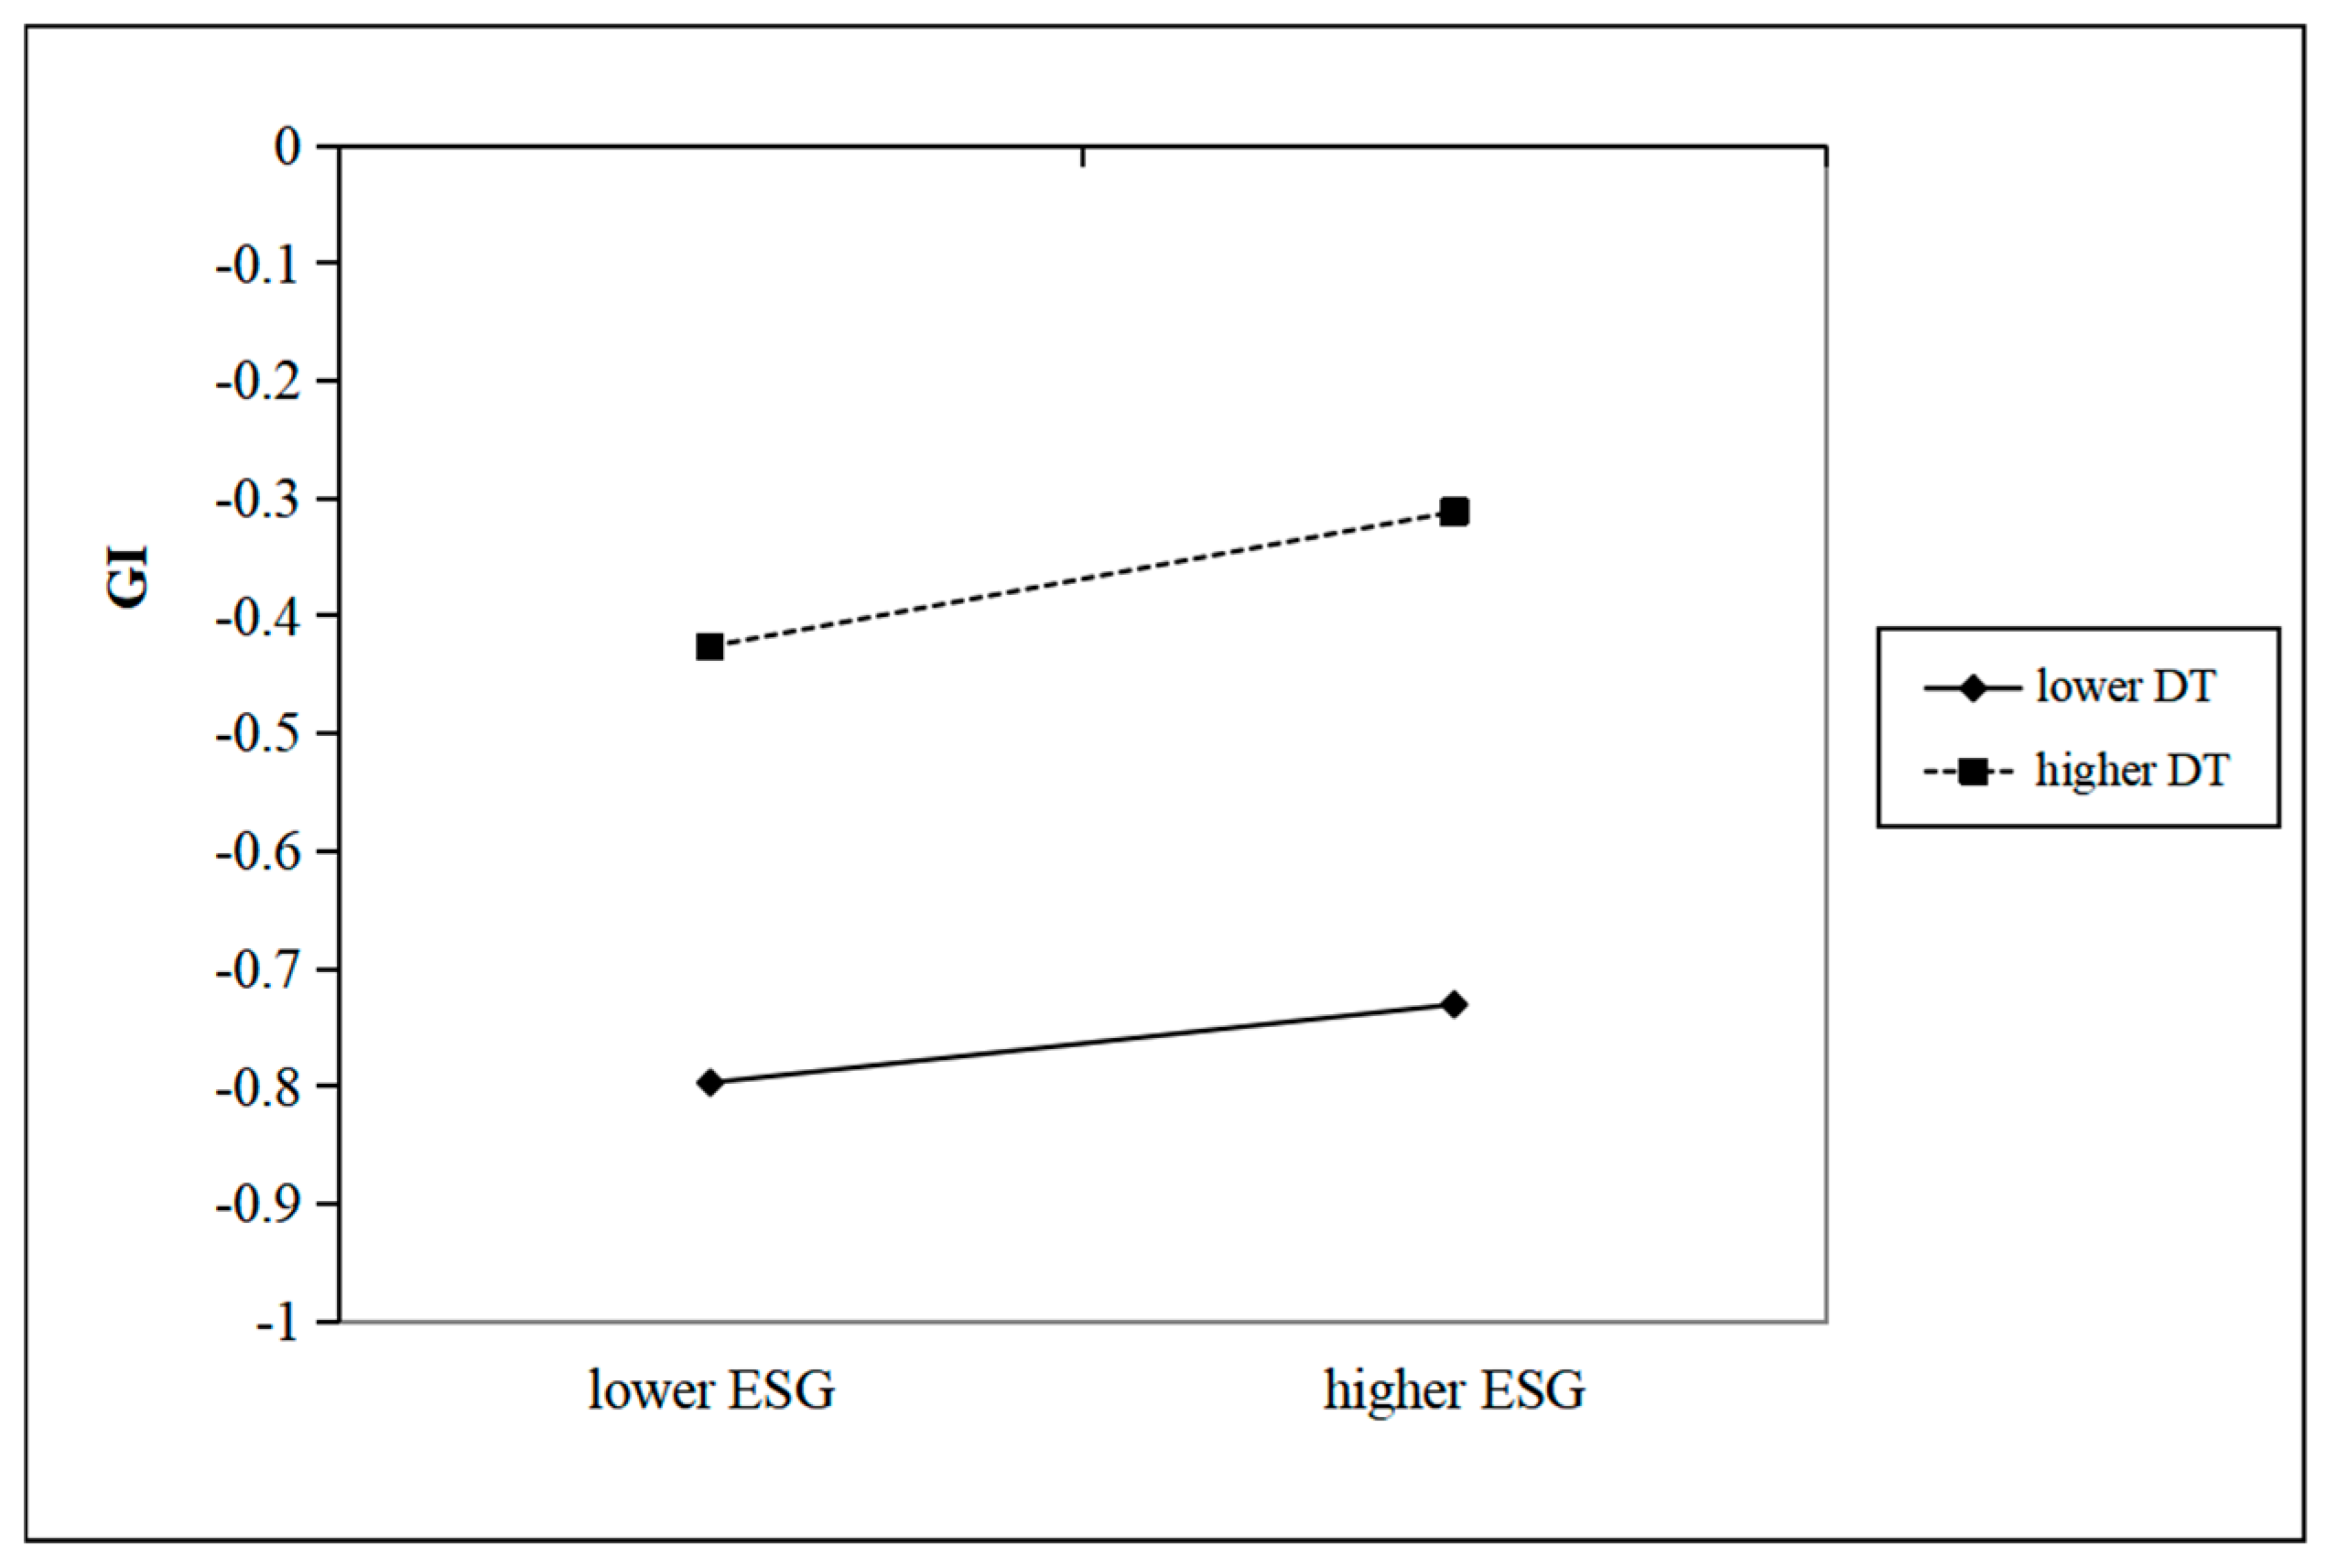
2.2. The Moderating Role of Digital Transformation

In the era of rapid advancements in artificial intelligence and information technology, digital transformation has become an imperative for enterprises seeking to sustain and enhance their competitiveness. Digital transformation fundamentally reshapes traditional industries by integrating information technology into all aspects of production and operations. This integration enables data and resource sharing across departments, fosters the deep integration of production means with information systems, and ultimately enhances resource productivity while generating additional value [42,43]. As a critical component of the digital economy, digital transformation emphasizes the application of emerging technologies such as artificial intelligence, blockchain, and big data. These technologies enable enterprises to upgrade their operations, strengthen their competitive advantage, optimize business models, and achieve comprehensive management of supply chains and value chains, thereby creating new value [1]. Research by Hinings et al. [44] and Liu et al. [45] demonstrated that digital transformation significantly enhances enterprise performance and value creation. Moreover, digital transformation facilitates energy conservation and emission reduction, enabling enterprises to fulfill their social responsibilities and establish a positive social image [46]. Ding et al. [47], using a fixed-effects model, found that digital transformation positively impacts total factor productivity (TFP). Data from Chinese listed companies further corroborated the positive effects of digital transformation on resource allocation efficiency and human capital optimization [48,49].
The relationship between digital transformation and environmental, social, and governance (ESG) performance has also been explored in recent research. Digital transformation enhances the transparency of enterprises’ environmental and social performance. Drawing on signaling theory, increased transparency makes corporate operational information more traceable, significantly reducing information asymmetry and interaction costs [50,51]. This transparency effectively curbs short-sighted behaviors among CEOs and elevates the importance of sustainable development, thereby improving ESG performance. Numerous studies support this perspective. For example, Fang et al. [52], based on data from Chinese firms, found that digital transformation significantly improves ESG scores, with the reduction of agency costs identified as a key contributing factor. Similarly, Liu et al. [53] demonstrated that the quality of environmental information disclosure and the efficiency of green resource allocation amplify the positive impact of digital transformation on ESG performance. The virtuous cycle created by digital transformation encourages ESG behaviors, as improved corporate reputation and communication effects further incentivize sustainable practices. However, some scholars offer contrasting views. For instance, Niehoff [54], in a study of German firms, argued that digital transformation, when overly focused on business-centric goals, may undermine corporate sustainability. This perspective highlights the nuanced and context-dependent nature of digital transformation’s impact on ESG performance.
Extensive research has been conducted on the influence of digital transformation on enterprises’ green technology innovation. For instance, Ghobakhloo et al. [55] found that digital development plays a significant role in promoting green technology innovation. Tang et al. [56], based on a study of Chinese listed companies, demonstrated that digital transformation enhances innovation efficiency, drives green transformation, and improves green economic efficiency. Similarly, De Luca et al. [57] and Song et al. [58] highlighted that the accumulation of digital technologies enhances enterprises’ information processing capabilities, enabling organizational and production process upgrades, which in turn elevate the level of green innovation. Building on these findings, some scholars have further explored the mechanisms through which digital transformation influences green innovation, considering both internal and external factors such as resource allocation, information disclosure, environmental pressures, and regulatory frameworks [59]. However, based on controllability theory, other scholars present a contrasting perspective. They argue that while digital transformation provides the potential for green technology innovation, it does not directly guarantee positive outcomes [60,61]. Given this divergence, this paper adopts controllability theory as a lens through which to examine whether the positive impact of digital transformation on green technology innovation is mediated by other factors and whether digital transformation plays a moderating role in this relationship. The specific mechanism process and theoretical model is shown in Figure 1. Based on this analysis, the following hypothesis is proposed:
H2. 
The role of ESG performance in enhancing firms’ green technology innovation is strengthened by digital transformation as a moderator.

3. Research Design

3.1. Sample Selection and Data Sources

This study utilized a sample of Chinese A-share listed companies from 2009 to 2022. To ensure data quality and consistency, we applied the following sample selection criteria: (1) exclusion of ST and *ST companies to mitigate potential biases from financially distressed firms; (2) removal of financial and insurance institutions due to their distinct financial characteristics and regulatory frameworks; and (3) elimination of observations with missing or abnormal data. The final dataset consisted of 36,926 firm–year observations. All continuous variables were winsorized at the 1% and 99% levels to minimize the influence of outliers. For variable measurement, we employed the China Securities Index (CSI) ESG ratings from the Wind Database as our primary proxy for corporate ESG performance. Data on green technology innovation were obtained from the China Research Data Service Platform (CNRDS), while other financial and corporate governance variables were sourced from the CSMAR database [45,46,62].

3.2. Variable Definitions

3.2.1. Explained Variable

The explained variable in this study is green technology innovation. Drawing on the methodology of Gao et al. [62], this paper employed the total number of green patent applications as a proxy to measure enterprises’ green technology innovation. Compared to simple research and development (R&D) investment, the total number of green patent applications provides a more accurate reflection of corporate innovation capabilities [63]. This approach mitigates the potential distortions caused by false or ineffective R&D investments, thereby offering a more realistic assessment of enterprises’ green innovation performance. Furthermore, green patent applications typically span multiple cycles and are continuously influenced by corporate activities throughout the application process. This characteristic makes them an effective indicator of enterprises’ green innovation performance [64,65]. As a result, the total number of green patent applications serves as a stable, reliable, and timely proxy variable for measuring green technology innovation [66,67].

3.2.2. Explanatory Variable

This study employed the China Securities Index (CSI) ESG ratings to measure corporate ESG performance, based on its comprehensive indicators, high accuracy, broad coverage, and data accessibility. The CSI ESG rating system classifies firms into nine tiers, ranging from “C” (the lowest tier, scoring below 60) to “AAA” (the highest tier), with 5-point intervals between adjacent tiers. Firms rated “BBB” or above are considered ESG leaders. We use the percentage-based composite scores (ranging 0–100) for the environmental (E), social (S), and governance (G) dimensions as our explanatory variable, rather than ordinal tier rankings. This approach better captures cross-firm ESG performance disparities and has been widely adopted in academic research [68].

3.2.3. Moderator Variable

Digital transformation was selected as the moderating variable in this study. Following the methodology of Zhong and Ren [69], the level of digital transformation was measured using text analysis. The digital transformation index was constructed across four dimensions: digital technology application, internet business models, intelligent manufacturing, and modern information technology. These dimensions encompassed 99 keywords, including but not limited to data mining, data platforms, industrial internet, artificial intelligence, information integration, and information sharing. To operationalize this measure, the text of listed companies’ annual reports was extracted using Python 3.12. The sample text was processed using the Jieba function for lexical segmentation, and the word frequencies across the four dimensions were aggregated. Finally, the natural logarithm of the total word frequencies was calculated to quantify the level of digital transformation for each enterprise.

3.2.4. Control Variables

Referring to the study by Liu et al. [70], this paper selected control variables from both financial and non-financial perspectives. The financial perspective contained enterprise scale (Size), financial leverage (Lev), operating income growth rate (Growth), return on assets (Roa), research and development expenditures (RD), market performance (TobinQ), and cash flow ratio (Cashflow). The non-financial perspective contained board size (Board), institutional investor shareholding (INST), firm age (FirmAge), and whether it is audited by a Big Four accounting firm (Big4). The specific variables are defined as shown in Table 1.

3.3. Model Design

To test the impact of ESG performance on firms’ green technology innovation, the following model was constructed:
G I i , t = α 0 + α 1 E S G i , t + C o n t r o l s i , t + F i r m + Y e a r + I n d u s t r y + ε i , t
where subscripts i and t denote sample individuals and years, respectively; the explanatory variable GI is green technology innovation; the explanatory variable ESG is firms’ ESG performance; and ε is a random disturbance term.
To examine the moderating role of digital transformation (DT), we augmented Model (1) by incorporating both DT and its interaction term with ESG performance (ESG*DT), thereby establishing Model (2) for fixed-effects regression analysis. Both ESG and DT variables were mean-centered to mitigate multicollinearity. The coefficient β3 quantifies the magnitude and direction of DT’s moderating effect.
G I i , t = β 0 + β 1 E S G i , t + β 2 D T i , t + β 3 E S G i , t D T i , t + C o n t r o l s i , t + F i r m + Y e a r + I n d u s t r y + ε i , t

4. Empirical Results and Analyses

4.1. Descriptive Statistics

The descriptive statistics of the main variables are shown in Table 2. The average value of green technology innovation between enterprises is 0.354, the minimum value is only 0, and the maximum value is 3.555, from which it can be judged that the awareness of green technology innovation of the sample enterprises is low, and the overall level of green technology innovation needs to be improved. The minimum value of the enterprise ESG score is 58.03, which is located in the rating below C, the maximum value is 84.07, and the standard deviation is 4.918, which shows that the development of enterprise ESG performance is not balanced and there is a big gap between enterprises. The average ESG score is 73.47, which indicates that the ESG performance of the sample enterprises as a whole is poor, and there is still a large room for improvement. The gap between enterprises’ digital transformation performance is also obvious, with a minimum value of 0, a maximum value of 6.999, and a standard deviation of 1.257, indicating that the degree of digital transformation of each enterprise is different, and the development status is not balanced.
To preliminarily test Hypothesis 1, this paper carried out a correlation analysis on the main variables, and the results are shown in Table 3. The Spearman correlation coefficient of each variable is shown on the upper right, and the Pearson correlation coefficient is shown on the lower left. The correlation coefficients of each variable do not exceed 0.5, which indicates that there is no serious problem of multiple covariance between the samples. Corporate ESG performance and green technology innovation are significantly and positively correlated at the 1% level, which preliminarily verifies that corporate ESG performance can help to enhance green technology innovation performance.

4.2. Regression Analysis

This study employed a fixed effects model for regression analysis, and the results are presented in Table 4. Column (1) displays the regression results without controlling for individual, industry, or year fixed effects and without including control variables. The regression coefficient for ESG is significant at the 1% level, providing initial evidence of the positive impact of ESG behavior on green technology innovation. Column (2) presents the results without controlling for individual, industry, or year fixed effects but with the inclusion of control variables. The regression coefficient for ESG remains significant at the 1% level, indicating that the positive effect of ESG behavior on green technology innovation persists even without accounting for industry and year-specific factors. Further, column (3) introduces control variables and controls for firm, industry, and year fixed effects. The results show that firms’ ESG performance and green technology innovation remain significantly and positively correlated at the 1% confidence level. By contrast, traditional financial indicators (Lev, Roa) show no significant effects, suggesting that investors’ long-term expectations, rather than short-term financial metrics, play a more critical role in fostering green technology innovation, supporting Hypothesis H1. Column (4) examines the moderating effect of digital transformation by including an interaction term between digital transformation and ESG performance. The regression coefficients for both ESG and the interaction term are significantly positive at the 1% confidence level, confirming the positive moderating role of digital transformation. Specifically, a higher degree of digital transformation enhances the positive impact of ESG behavior on green technology innovation. As illustrated in Figure 2’s moderation effect plot, the positive impact of ESG on green technology innovation intensifies progressively with higher levels of digital transformation (DT). While ESG remains statistically significant for firms in the lower DT group, its effect magnitude is substantially weaker compared to the higher DT group. This visual evidence robustly validates Hypothesis 2, confirming DT’s catalytic role in amplifying ESG-driven innovation. This finding can be attributed to the dual role of ESG behavior in promoting both corporate self-optimization and social responsibility. The pressures of environmental protection and sustainable development have reinforced the concept of green development among enterprises, incentivizing them to increase investments in green innovation technologies. Simultaneously, digital transformation enhances enterprises’ capabilities in data acquisition and resource integration, strengthens governance levels, improves the efficiency of ESG practices, and amplifies the direct impact of ESG performance on green technology innovation.

5. Endogeneity Tests and Robustness Tests

In order to mitigate the endogeneity problem caused by two-way causation and sample selection bias, this paper re-evaluated the model using the instrumental variables approach, the Heckman two-stage, and the generalized method of moments estimation (GMM).

5.1. Instrumental Variables Method

Drawing on the methodology of He et al. [71], this paper selected the number of enterprises held by ESG investment funds as an instrumental variable for corporate ESG performance. There is a strong correlation between the number of enterprises held by ESG investment funds and their ESG performance. As institutional investors, fund companies independently determine their investment direction and scale, often selecting high quality enterprises with strong ESG performance. By holding shares in these companies, ESG investment funds disseminate their ESG preferences to the public, thereby increasing public attention on the ESG performance of the companies they invest in [72]. This mechanism underscores the strong correlation between ESG investment funds and corporate ESG performance. Furthermore, ESG investment funds do not participate in the management or operations of the companies they hold. As a result, the management of these companies retains full control over their development direction, and the holding information of ESG investment funds does not directly influence the level of green technology innovation. This ensures that the instrumental variable satisfies the exogeneity condition, adhering to the principle of homogeneity.

5.2. Heckman Two-Stage Model

To mitigate potential sample selection bias, this study employed the Heckman two-stage model. In the first stage, a dummy variable, ESG_bin, was constructed. This variable took a value of 1 if a firm’s ESG score exceeded the sample average, and 0 otherwise. This dummy variable served as the dependent variable in a Probit regression model, with the market value of ‘pan-ESG’ fund holdings (ESGFV) as the key explanatory variable. Additional control variables were also included in the model. The inverse Mills ratio (imr) was then calculated from this regression. The results, presented in column (3) of Table 5, indicate that the market value of ‘pan-ESG’ fund holdings (ESGFV) is significantly and positively correlated with the dummy variable ESG_bin at the 1% confidence level. This confirms the effectiveness of the selected exogenous variable in addressing sample selection bias. In the second stage, the inverse Mills ratio (imr) was incorporated as a control variable in the regression of Model (1). The results, shown in column (4) of Table 5, reveal that the model does indeed suffer from sample selection bias. However, even after controlling for this endogeneity issue, the regression coefficients for firms’ ESG performance (ESG) and green technology innovation (GI) remain significantly positive at the 1% confidence level. This demonstrates the robustness of the findings and underscores the reliability of the conclusions drawn from the analysis.

5.3. Generalized Method of Moment Estimation (GMM)

To further address potential endogeneity issues, this study employed the Generalized Method of Moments Estimation (GMM). The lagged one-period explanatory variable (L.GI) was selected as the instrumental variable for GMM estimation. The results, presented in Column (5) of Table 5, demonstrate that the impact of firms’ ESG performance (ESG) on green technology innovation remains significant at the 5% confidence level. The validity of the instrumental variable is confirmed by Hansen’s test, which yielded a p-value greater than 0.1, indicating no over-identification issues. Additionally, the Arellano–Bond test for autocorrelation showed that the p-value for AR(1) was less than 0.1, while the p-value for AR(2) was greater than 0.1. This confirms the absence of second-order or higher autocorrelation in the disturbance term, satisfying the assumptions of the GMM model. These results further corroborate the robustness of the benchmark regression findings, reinforcing the conclusion that firms’ ESG performance significantly enhances green technology innovation.

5.4. Reconsidering Lag Effects

Given that the impact of corporate ESG disclosure often exhibits a time lag, this study incorporated the lagged one-period ESG performance (L.ESG) as an explanatory variable in a fixed-effects model to more accurately examine its influence on green technology innovation. The regression results are presented in Table 6. Column (1) displays the results without control variables, showing that lagged ESG performance (L.ESG) is significantly and positively correlated with green technology innovation at the 1% level. This relationship remains significant after introducing control variables, as shown in column (2). Column (3) further incorporates the moderating variable of digital transformation (DT). The results indicate that lagged ESG performance (L.ESG) continues to positively influence green technology innovation at the 1% confidence level. Additionally, the moderating effect of digital transformation (DT) and the interaction term between DT and lagged ESG performance (L.ESG) are significant at the 5% confidence level. The robust moderating effect of digital transformation (DT) on the lagged ESG–innovation relationship may stem from DT’s capacity to (1) accelerate cross-functional knowledge integration through digital platforms, and (2) dynamically reallocate resources from prior ESG initiatives to high potential R&D projects. This aligns with the “ESG debt” concept [73], where DT helps firms to realize delayed returns on ESG investments. These findings demonstrate that, even after accounting for the lagged effect, corporate ESG performance significantly enhances green technology innovation. Moreover, the moderating role of digital transformation remains robust, further validating the reliability of the conclusions drawn in this study.

5.5. Replacing Explanatory Variable

To address potential discrepancies arising from differences in ESG rating criteria across systems, this study conducted a robustness check by replacing the original explanatory variable with Bloomberg ESG rating scores (Bloomberg). The regression results are presented in Table 6. Columns (4) and (5) show that corporate ESG performance (Bloomberg) and green technology innovation (GI) are significantly and positively correlated at the 1% confidence level. This confirms that ESG performance consistently enhances green technology innovation, regardless of the rating system used. Column (6) introduces the moderating variable of digital transformation (DT). The results indicate that both corporate ESG performance (Bloomberg) and its interaction term with digital transformation (M) remain significantly positive. The moderating effect of digital transformation (DT) also remains significant, further validating the robustness of the findings. These results demonstrate that the positive relationship between ESG performance and green technology innovation, as well as the moderating role of digital transformation, are robust across different ESG rating systems.

5.6. Other Robustness Tests

To investigate potential nonlinear effects between corporate ESG performance and green technology innovation (GI), we incorporated a squared term of the explanatory variable (ESG2) in our analysis. The regression results presented in column (1) of Table 7 show statistically insignificant coefficients for both the linear (ESG) and quadratic (ESG2) terms, suggesting a linear rather than nonlinear relationship between these variables. To ensure the robustness of our findings, we expanded the set of control variables to include asset turnover ratio (ATO), inventory ratio (INV), fixed asset ratio (FIXED), proportion of independent directors (Indep), ownership concentration (TOP10), shareholding balance (Balance), listing age (ListAge), and management shareholding ratio (Mshare). The augmented specifications in columns (2)–(4) consistently demonstrate that: (1) ESG performance maintains a statistically significant positive association with green innovation at the 1% level, and (2) the interaction term between ESG and digital transformation remains significant at the 1% level. These results provide robust evidence that digital transformation positively moderates the relationship between corporate ESG performance and green technology innovation.

6. Heterogeneity Analysis

6.1. Heterogeneity Analysis of Individual ESG Indicators

To provide a more granular understanding of the impact of ESG performance, this study followed the methodology of Garel and Petit-Romec [74] by disaggregating the ESG indicators into three distinct components: environmental (E), social (S), and internal governance (G). Separate regression analyses were conducted for each component with green technology innovation (GI) as the dependent variable. The results are presented in columns (1) to (3) of Table 8. The social (S) and internal governance (G) sub-indicators exhibit a significantly positive correlation with green technology innovation (GI) at the 1% confidence level, while the environmental dimension (E) exhibits a relatively weaker promoting effect. This disparity can be attributed to the fact that environmental investments are typically more costly and yield slower returns compared to social and governance initiatives. Additionally, environmental performance improvements may not directly or immediately translate into measurable advancements in technological innovation. Furthermore, in the context of green development, stakeholders may exhibit lower sensitivity and attention to environmental performance, thereby reducing its incremental impact on green technology innovation. Nevertheless, strong performance across all three ESG dimensions—environmental, social, and governance—serves as a hallmark of high quality enterprises and plays a significant role in promoting green technology innovation and sustainable development. These findings further corroborate Hypothesis 1, reinforcing the positive relationship between ESG performance and green technology innovation.

6.2. Heterogeneity Analysis of Industry Portability

The environmental pressure faced by enterprises in different industries varies greatly, so how will the relationship between ESG performance and green technology innovation differ? To further answer this question, this paper referred to the study by Deng et al. [75], which divided the sample firms into firms in heavily polluting industries and firms in non-heavily polluting industries and, according to the ‘Listed Company Environmental Verification Industry Classification and Management Directory’, 16 industries such as chemical, textile, iron, and steel were included among heavily polluting industries, while the others were included among non-heavily polluting industries. The results of the heterogeneity analysis are shown in column (4) and column (5) of Table 8. ESG performance and the green technology innovation level of enterprises in non-heavily polluting industries are significantly correlated at the 1% confidence level, while enterprises in heavily polluting industries are only significantly correlated at the 5% confidence level, which suggests that the positive correlation between ESG performance and green technology innovation is more significant in non-heavily polluting industries and that ESG investment in enterprises in heavily polluting industries often fails to achieve the expected results. The public’s distrust of heavy polluters [76] is an important reason for this difference, and enterprises in heavily polluting industries often face problems such as high investment costs, low returns, and long cycles, which makes some heavy polluters adopt ‘greenwashing’ behaviors such as falsifying green data and whitewashing ESG information [77]. Green data falsification aggravates the distrust of investors and regulators, and the efficiency of heavily polluting enterprises is lower under the same level of ESG investment, which in turn leads to poorer performance of green technology innovation.

6.3. Heterogeneity Analysis of Marketisation Levels

China’s regional development is characterized by significant imbalances, with coastal regions generally experiencing more advanced economic development compared to inland regions. These disparities are accompanied by varying policy and legal environments, which may influence the relationship between ESG performance and green technology innovation. To explore this, this study categorized provinces into high and low marketization level groups based on the China Provincial Marketization Index Report (2016). Provinces with marketization index scores above the median were classified as high marketization level regions, while those below the median were classified as low marketization level regions. Sample enterprises were assigned to the corresponding groups based on their registered locations for regression analysis. The results, presented in columns (6) and (7) of Table 8, reveal that ESG performance is significantly and positively correlated with green technology innovation at the 1% confidence level in high marketization level regions. However, this relationship is not statistically significant in low marketization level regions. This indicates that the positive impact of ESG performance on green technology innovation is more pronounced and widely recognized in regions with higher marketization levels. Several factors contribute to this disparity. In low marketization regions, market opacity, higher financing costs, and elevated hidden costs create barriers to effective ESG implementation. Additionally, the smaller number of enterprises in these regions makes it difficult to form cluster advantages, further hindering the translation of ESG investments into green technology innovation. By contrast, high marketization regions benefit from a more harmonious business environment, greater market transparency, and relatively lower environmental pressures. These conditions enable enterprises to allocate more resources toward development and governance, allowing ESG initiatives to effectively enhance green technology innovation.
To more intuitively visualize the heterogeneous effects, the subgroup regression results are presented as a forest plot in Figure 3.

7. Conclusions and Recommendations

Green development has emerged as a defining theme of our era, with digital transformation and sustainable development becoming critical objectives for enterprises. The ESG (environmental, social, and governance) evaluation system, highly aligned with the principles of sustainable development, serves as a vital framework for both societal and corporate self-assessment. Our findings extend institutional theory by demonstrating how regional marketization levels create divergent ESG–innovation pathways, revealing that regulatory frameworks and market forces jointly shape corporate sustainability behaviors. Furthermore, the identified moderating effect of digital transformation enriches the resource-based view, positioning technological infrastructure as a meta-resource that amplifies ESG’s innovation returns. Using a sample of Chinese A-share listed companies from 2009 to 2022, this study empirically examined the impact of corporate ESG performance on green technology innovation, yielding the following key conclusions: i. ESG Performance and Green Technology Innovation: Corporate ESG performance significantly enhances the level of green technology innovation. Among the three ESG dimensions, the social (S) and internal governance (G) indicators exhibit a more pronounced impact on green technology innovation compared to the environmental (E) indicator. ii. Moderating Role of Digital Transformation: Digital transformation plays a crucial moderating role in this relationship. Corporate ESG behaviors accelerate digital transformation, which in turn amplifies the level of green technology innovation. The higher the degree of digital transformation, the more pronounced the positive effect of ESG performance on green technology innovation. iii. Heterogeneity Across Regions and Industries: The impact of ESG performance varies significantly across regions and industries. Enterprises in non-heavily polluting industries and high marketization regions demonstrate a stronger positive correlation between ESG performance and green technology innovation compared to those in heavily polluting industries and low marketization regions. This suggests that non-heavily polluting industries and high marketization areas are more conducive to achieving green transformation through ESG initiatives. These findings underscore the importance of ESG performance and digital transformation in driving green technology innovation, particularly in regions and industries with favorable conditions for sustainable development. The regional and industry heterogeneity suggests that policymakers should adopt differentiated strategies: (1) stringent ESG disclosure requirements for heavily polluting industries, coupled with (2) digital infrastructure investments in low marketization regions. For corporate leaders, the stronger impact of social (S) and governance (G) dimensions calls for rebalancing ESG investments from environmental reporting toward stakeholder engagement and governance digitization.
Based on the findings of this study, the following recommendations are proposed to enhance the role of ESG performance and green technology innovation in driving sustainable development: i. Government Role in ESG Disclosure and Policy Framework: The government should establish a unified ESG information disclosure policy, clearly defining the scope and content of disclosure. This will guide both society and enterprises to prioritize ESG behaviors and encourage increased investment in green technology innovation. Such measures will support the modernization and green transformation of the economy, aligning with national sustainability goals. ii. Corporate Responsibility and Strategic Focus: Enterprises should adopt a long-term perspective by prioritizing digital transformation and green development. They should fully recognize the significance of ESG behaviors and increase investments in green technology innovation. By leveraging transparent markets to communicate their ESG initiatives, enterprises can build a strong corporate reputation and maximize the benefits of their ESG efforts. iii. Role of ESG Rating Agencies: ESG rating agencies should continuously refine their evaluation methodologies and weighting systems to reflect evolving standards and practices. They should draw on the strengths of international ESG rating frameworks while adapting them to local contexts. Maintaining fairness and objectivity, these agencies should regularly publish ESG ratings of domestic listed companies, providing valuable insights for investors and regulators. This will foster greater transparency and accountability, contributing to the broader goals of green modernization and sustainable development.
While this study provides valuable insights into the relationship between ESG performance and green technology innovation, it is not without limitations. First, although our empirical analysis established a significantly positive relationship, the underlying transmission mechanisms remain underexplored. Future studies should incorporate mediation analysis to examine potential pathways such as improved access to green financing, enhanced knowledge spillover through ESG networks, and organizational legitimacy effects that facilitate innovation adoption. Second, the exclusive focus on Chinese A-share listed companies, while providing important contextual insights, limits the generalizability of findings to other emerging markets with different institutional configurations. Comparative studies across varying national contexts could yield important boundary conditions for our findings. Third, the measurement of digital transformation could be enriched in future work. While our index captures technological adoption, it does not fully account for workforce digital skills or ecosystem-level digital infrastructure—both of which may influence the ESG–innovation relationship. By addressing these limitations, future research can deepen our understanding of the mechanisms driving green technology innovation and provide more actionable insights for policymakers and practitioners worldwide.

Author Contributions

C.X.: Writing—review & editing, Resources, Methodology, Formal analysis. Y.H.: Funding acquisition, Project administration, Supervision. All authors have read and agreed to the published version of the manuscript.

Funding

This research was funded by the General Programme of the National Social Science Foundation of China “Research on Influencing Factors, Economic Consequences and Dynamic Mechanisms of Green Development of Enterprises” (20BJL136).

Institutional Review Board Statement

Not applicable.

Informed Consent Statement

Not applicable.

Data Availability Statement

Data will be made available upon request.

Acknowledgments

We would like to express our sincere gratitude to the editor and anonymous referees for their insightful and constructive comments.

Conflicts of Interest

There are no conflicts of interest among the authors.

References

  1. Bertani, F.; Ponta, L.; Raberto, M.; Teglio, A.; Cincotti, S. The complexity of the intangible digital economy: An agent-based model. J. Bus. Res. 2021, 129, 527–540. [Google Scholar] [CrossRef]
  2. Houston, J.F.; Shan, H. Corporate ESG profiles and banking relationships. Rev. Financ. Stud. 2022, 35, 3373–3417. [Google Scholar] [CrossRef]
  3. Barnea, A.; Rubin, A. Corporate social responsibility as a conflict between shareholders. J. Bus. Ethics 2010, 97, 71–86. [Google Scholar] [CrossRef]
  4. Cui, J.; Jo, H.; Na, H. Does corporate social responsibility affect information asymmetry? J. Bus. Ethics 2018, 148, 549–572. [Google Scholar]
  5. Zhang, D.; Lucey, B.M. Sustainable behaviors and firm performance: The role of financial constraints’ alleviation. Econ. Anal. Policy 2022, 74, 220–233. [Google Scholar] [CrossRef]
  6. Christensen, D.M.; Serafeim, G.; Sikochi, A. Why is corporate virtue in the eye of the beholder? The case of ESG ratings. Account. Rev. 2022, 97, 147–175. [Google Scholar] [CrossRef]
  7. Lenz, I.; Wetzel, H.A.; Hammerschmidt, M. Can doing good lead to doing poorly? Firm value implications of CSR in the face of CSI. J. Acad. Mark. Sci. 2017, 45, 677–697. [Google Scholar] [CrossRef]
  8. Ng, A.C.; Rezaee, Z. Business sustainability performance and cost of equity capital. J. Corp. Financ. 2015, 34, 128–149. [Google Scholar]
  9. Chang, X.; Fu, K.; Jin, Y.; Liem, P.F. Sustainable finance: ESG/CSR, firm value, and investment returns. Asia-Pac. J. Financ. Stud. 2022, 51, 325–371. [Google Scholar]
  10. Gillan, S.L.; Koch, A.; Starks, L.T. Firms and social responsibility: A review of ESG and CSR research in corporate finance. J. Corp. Financ. 2021, 66, 101889. [Google Scholar] [CrossRef]
  11. Li, Q.; Li, M.; Zhang, L. Revisiting the relationship between ESG, institutional ownership, and corporate innovation: An efficiency perspective. Corp. Soc. Responsib. Environ. Manag. 2024, 31, 6504–6525. [Google Scholar] [CrossRef]
  12. Pedersen, L.H.; Fitzgibbons, S.; Pomorski, L. Responsible investing: The ESG-efficient frontier. J. Financ. Econ. 2021, 142, 572–597. [Google Scholar]
  13. Avramov, D.; Cheng, S.; Lioui, A.; Tarelli, A. Sustainable investing with ESG rating uncertainty. J. Financ. Econ. 2022, 145, 642–664. [Google Scholar] [CrossRef]
  14. Lazzolino, G.; Bruni, M.E.; Veltri, S.; Morea, D.; Baldissarro, G. The impact of ESG factors on financial efficiency: An empirical analysis for the selection of sustainable firm portfolios. Corp. Soc. Responsib. Environ. Manag. 2023, 30, 1917–1927. [Google Scholar] [CrossRef]
  15. Chen, Z.; Xie, G. ESG disclosure and financial performance: Moderating role of ESG investors. Int. Rev. Financ. Anal. 2022, 83, 102291. [Google Scholar] [CrossRef]
  16. Ferdous, L.T.; Rana, T.; Yeboah, R. Decoding the impact of firm-level ESG performance on financial disclosure quality. Bus. Strategy Environ. 2024, 34, 162–186. [Google Scholar]
  17. Postiglione, M.; Carini, C.; Falini, A. ESG and firm value: A hybrid literature review on cost of capital implications from Scopus database. Corp. Soc. Responsib. Environ. Manag. 2024, 31, 6457–6480. [Google Scholar] [CrossRef]
  18. Zhou, G.; Liu, L.; Luo, S. Sustainable development, ESG performance and company market value: Mediating effect of financial performance. Bus. Strategy Environ. 2022, 31, 3371–3387. [Google Scholar] [CrossRef]
  19. Broadstock, D.C.; Chan, K.; Cheng, L.T.; Wang, X. The role of ESG performance during times of financial crisis: Evidence from COVID-19 in China. Financ. Res. Lett. 2021, 38, 101716. [Google Scholar]
  20. Yuan, X.; Li, Z.; Xu, J.; Shang, L. ESG disclosure and corporate financial irregularities–Evidence from Chinese listed firms. J. Clean. Prod. 2022, 332, 129992. [Google Scholar] [CrossRef]
  21. Albuquerque, R.; Koskinen, Y.; Zhang, C. Corporate social responsibility and firm risk: Theory and empirical evidence. Manag. Sci. 2019, 65, 4451–4469. [Google Scholar]
  22. Luo, W.; Tian, Z.; Fang, X.; Deng, M. Can good ESG performance reduce stock price crash risk? Evidence from Chinese listed companies. Corp. Soc. Responsib. Environ. Manag. 2024, 31, 1469–1492. [Google Scholar] [CrossRef]
  23. Chang, X.; Fu, K.; Low, A.; Zhang, W. Non-executive employee stock options and corporate innovation. J. Financ. Econ. 2015, 115, 168–188. [Google Scholar] [CrossRef]
  24. Harjoto, M.A.; Jo, H. Corporate governance and firm value: The impact of corporate social responsibility. J. Bus. Ethics 2011, 103, 351–383. [Google Scholar]
  25. McGuinness, P.B.; Vieito, J.P.; Wang, M. The role of board gender and foreign ownership in the CSR performance of Chinese listed firms. J. Corp. Financ. 2017, 42, 75–99. [Google Scholar] [CrossRef]
  26. Albitar, K.; Al-Shaer, H.; Liu, Y.S. Corporate commitment to climate change: The effect of eco-innovation and climate governance. Res. Policy 2023, 52, 104697. [Google Scholar] [CrossRef]
  27. Chen, Z.; Xiao, Y.; Jiang, K. Corporate green innovation and stock liquidity in China. Account. Financ. 2023, 63, 1381–1415. [Google Scholar] [CrossRef]
  28. Umme, H.; Cao, X.B.; Ahsan, A. Do green technology innovations, financial development, and renewable energy use help to curb carbon emissions? Renew. Energy 2022, 193, 1082–1093. [Google Scholar]
  29. Wang, X.Y.; Sun, X.M.; Zhang, H.T.; Xue, C. Does green financial reform pilot policy promote green technology innovation? Empirical evidence from China. Environ. Sci. Pollut. Res. 2022, 29, 77283–77299. [Google Scholar] [CrossRef]
  30. Wang, J.; Ma, M.; Dong, T.; Zhang, Z. Do ESG ratings promote corporate green innovation? A quasi-natural experiment based on SynTao Green Finance’s ESG ratings. Int. Rev. Financ. Anal. 2023, 87, 102623. [Google Scholar] [CrossRef]
  31. Xu, J.; Liu, F.; Shang, Y. R&D investment, ESG performance and green innovation performance: Evidence from China. Kybernetes 2021, 50, 737–756. [Google Scholar]
  32. Fang, L.H.; Lerner, J.; Wu, C. Intellectual property rights protection, ownership, and innovation: Evidence from China. Rev. Financ. Stud. 2017, 30, 2446–2477. [Google Scholar] [CrossRef]
  33. Berrone, P.; Fosfuri, A.; Gelabert, L.; Gomez-Mejia, L.R. Necessity as the mother of ‘green’ inventions: Institutional pressures and environmental innovations. Strateg. Manag. J. 2013, 34, 891–909. [Google Scholar] [CrossRef]
  34. Long, H.; Feng, G.-F.; Chang, C.-P. How does ESG performance promote corporate green innovation. Econ. Change Restruct. 2023, 56, 2889–2913. [Google Scholar] [CrossRef]
  35. Wu, B.; Gu, Q.; Liu, Z.; Liu, J. Clustered institutional investors, shared ESG preferences and low-carbon innovation in family firm. Technol. Forecast. Soc. Change 2023, 194, 122676. [Google Scholar] [CrossRef]
  36. Zheng, M.; Feng, G.F.; Jiang, R.A.; Chang, C.P. Does environmental, social, and governance performance move together with corporate green innovation in China? Bus. Strategy Environ. 2023, 32, 1670–1679. [Google Scholar] [CrossRef]
  37. Yang, C.; Zhu, C.; Albitar, K. ESG ratings and green innovation: A U-shaped journey towards sustainable development. Bus. Strategy Environ. 2024, 33, 4108–4129. [Google Scholar] [CrossRef]
  38. Cohen, L.; Gurun, U.G.; Nguyen, Q. The ESG-innovation disconnect: Evidence from green patenting. J. Financ. Econ. 2022, 146, 761–779. [Google Scholar]
  39. Raghunandan, A.; Rajgopal, S. Do ESG funds make stakeholder-friendly investments? Rev. Account. Stud. 2022, 27, 822–863. [Google Scholar] [CrossRef]
  40. Krüger, P. Corporate Goodness and Shareholder Wealth. J. Financ. Econ. 2015, 115, 304–329. [Google Scholar] [CrossRef]
  41. Hsu, P.-H.; Li, K.; Tsou, C.-Y. The effect of ESG ratings on innovation efficiency. Manag. Sci. 2023, 69, 2564–2582. [Google Scholar]
  42. Bai, C.A.; Cordeiro, J.; Sarkis, J. Blockchain technology: Business, strategy, the environment, and sustainability. Bus. Strategy Environ. 2020, 29, 321–322. [Google Scholar] [CrossRef]
  43. Shaik, A.S.; Alshibani, S.M.; Jain, G.; Gupta, B.; Mehrotra, A. Artificial intelligence (AI)-driven strategic business model innovations in small- and medium-sized enterprises. Insights on technological and strategic enablers for carbon neutral businesses. Bus. Strategy Environ. 2024, 33, 2731–2751. [Google Scholar] [CrossRef]
  44. Hinings, B.; Gegenhuber, T.; Greenwood, R. Digital innovation and transformation: An institutional perspective. Inf. Organ. 2018, 28, 52–61. [Google Scholar] [CrossRef]
  45. Liu, Q.; Liu, J.; Gong, C. Digital transformation and corporate innovation: A factor input perspective. Manag. Decis. Econ. 2023, 44, 2159–2174. [Google Scholar] [CrossRef]
  46. Li, Z.; Wang, J. The dynamic impact of digital economy on carbon emission reduction: Evidence city-level empirical data in China. J. Clean. Prod. 2022, 351, 131570. [Google Scholar]
  47. Ding, X.; Sheng, Z.; Appolloni, A.; Shahzad, M.; Han, S. Digital transformation, ESG practice, and total factor productivity. Bus. Strategy Environ. 2024, 33, 4547–4561. [Google Scholar]
  48. Liu, Y.; He, Q. Digital transformation, external financing, and enterprise resource allocation efficiency. Manag. Decis. Econ. 2024, 45, 2321–2335. [Google Scholar] [CrossRef]
  49. Wang, J.; Hu, Y.; Zhang, Z. Skill-biased technological change and labor market polarization in China. Econ. Model. 2021, 100, 105507. [Google Scholar] [CrossRef]
  50. Wang, S.; Esperança, J.P. Can digital transformation improve market and ESG performance? Evidence from Chinese SMEs. J. Clean. Prod. 2023, 419, 137980. [Google Scholar] [CrossRef]
  51. Fichman, R.G.; Dos Santos, B.L.; Zheng, Z.Q. Digital innovation as a fundamental and powerful concept in the information systems curriculum. MIS Q. 2014, 38, 329–343. [Google Scholar] [CrossRef]
  52. Fang, M.; Nie, H.; Shen, X. Can enterprise digitization improve ESG performance? Econ. Model. 2023, 118, 106101. [Google Scholar] [CrossRef]
  53. Liu, Z.; Chen, Z.; Hu, L. Can enterprise digital transformation improve ESG performance? Manag. Decis. Econ. 2024, 45, 5088–5103. [Google Scholar] [CrossRef]
  54. Niehoff, S. Aligning digitalisation and sustainable development? Evidence from the analysis of worldviews in sustainability reports. Bus. Strategy Environ. 2022, 31, 2546–2567. [Google Scholar] [CrossRef]
  55. Ghobakhloo, M.; Iranmanesh, M.; Grybauskas, A.; Vilkas, M.; Petraite, M. Industry 4.0, innovation, and sustainable development: A systematic review and a roadmap to sustainable innovation. Bus. Strategy Environ. 2021, 30, 4237–4257. [Google Scholar] [CrossRef]
  56. Tang, M.G.; Liu, Y.L.; Hu, F.X.; Wu, B.J. Effect of digital transformation on enterprises’ green innovation: Empirical evidence from listed companies in China. Energy Econ. 2023, 128, 107135. [Google Scholar] [CrossRef]
  57. De Luca, L.M.; Herhausen, D.; Troilo, G.; Rossi, A. How and when do big data investments pay off? The role of marketing affordances and service innovation. J. Acad. Mark. Sci. 2021, 49, 790–810. [Google Scholar] [CrossRef]
  58. Song, Y.; Du, C.; Du, P.; Liu, R.; Lu, Z. Digital transformation and corporate environmental performance: Evidence from Chinese listed companies. Technol. Forecast. Soc. Change 2024, 201, 123159. [Google Scholar] [CrossRef]
  59. Upadhayay, N.B.; Rocchetta, S.; Gupta, S.; Kamble, S.; Stekelorum, R. Blazing the trail: The role of digital and green servitization on technological innovation. Technovation 2024, 130, 102922. [Google Scholar] [CrossRef]
  60. Li, C.M.; Xu, Y.; Zheng, H.; Wang, Z.Y.; Han, H.T.; Zeng, L.E. Artificial intelligence, resource reallocation, and corporate innovation efficiency: Evidence from China’s listed companies. Resour. Policy 2023, 81, 103324. [Google Scholar] [CrossRef]
  61. Rahmani, A.; Naeini, A.B.; Mashayekh, J.; Aboojafari, R.; Daim, T.; Yalcin, H. Green innovation for a greener future: A meta-analysis of the impact on environmental performance. J. Clean. Prod. 2024, 460, 142547. [Google Scholar] [CrossRef]
  62. Gao, H.; Wang, H.; Wang, X.; Wen, H. ESG-oriented analysts and corporate green innovation. Account. Financ. 2024, 64, 4977–5008. [Google Scholar] [CrossRef]
  63. Cheng, Y.; Du, K.; Yao, X. Stringent environmental regulation and inconsistent green innovation behavior: Evidence from air pollution prevention and control action plan in China. Energy Econ. 2023, 120, 106571. [Google Scholar] [CrossRef]
  64. Kong, D.; Wang, Y.; Zhang, J. Efficiency wages as gift exchange: Evidence from corporate innovation in China. J. Corp. Financ. 2020, 65, 101725. [Google Scholar] [CrossRef]
  65. Huang, X.; Liu, W.; Zhang, Z.; Zou, X.; Li, P. Quantity or quality: Environmental legislation and corporate green innovations. Ecol. Econ. 2023, 204, 107684. [Google Scholar] [CrossRef]
  66. Caragea, D.; Cojoianu, T.; Dobri, M.; Hoepner, A.G.; Peia, O.; Romelli, D. Competition and innovation in the financial sector: Evidence from the rise of FinTech start-ups. J. Financ. Serv. Res. 2024, 65, 103–140. [Google Scholar] [CrossRef]
  67. He, J.J.; Tian, X. The dark side of analyst coverage: The case of innovation. J. Financ. Econ. 2013, 109, 856–878. [Google Scholar] [CrossRef]
  68. Lin, Y.; Fu, X.; Fu, X. Varieties in state capitalism and corporate innovation: Evidence from an emerging economy. J. Corp. Financ. 2021, 67, 101919. [Google Scholar] [CrossRef]
  69. Zhong, X.; Ren, G. Independent and joint effects of CSR and CSI on the effectiveness of digital transformation for transition economy firms. J. Bus. Res. 2023, 156, 113478. [Google Scholar] [CrossRef]
  70. Liu, M.; Li, C.; Wang, S.; Li, Q. Digital transformation, risk-taking, and innovation: Evidence from data on listed enterprises in China. J. Innov. Knowl. 2023, 8, 100332. [Google Scholar] [CrossRef]
  71. He, F.; Du, H.; Yu, B. Corporate ESG performance and manager misconduct: Evidence from China. Int. Rev. Financ. Anal. 2022, 82, 102201. [Google Scholar]
  72. Dyck, A.; Lins, K.V.; Roth, L.; Wagner, H.F. Do institutional investors drive corporate social responsibility? International evidence. J. Financ. Econ. 2019, 131, 693–714. [Google Scholar]
  73. Grewal, J.; Hauptmann, C.; Serafeim, G. ESG Debt: The Hidden Costs of Delayed Sustainability Investments. J. Account. Econ. 2023, 76, 101592. [Google Scholar]
  74. Garel, A.; Petit-Romec, A. Investor rewards to environmental responsibility: Evidence from the COVID-19 crisis. J. Corp. Financ. 2021, 68, 101948. [Google Scholar]
  75. Deng, M.; Tang, H.; Luo, W. Can the green experience of CEO improve ESG performance in heavy polluting companies? Evidence from China. Manag. Decis. Econ. 2024, 45, 2373–2392. [Google Scholar]
  76. Guo, C.; Su, W.; Song, X.; Hu, X. Heterogeneous debt financing and environmental research & development: Evidence from China. Int. Rev. Econ. Financ. 2022, 82, 65–81. [Google Scholar]
  77. Kim, E.H.; Lyon, T.P. Greenwash vs. brownwash: Exaggeration and undue modesty in corporate sustainability disclosure. Organ. Sci. 2015, 26, 705–723. [Google Scholar]
Figure 1. The specific mechanism process and theoretical model.
Sustainability 17 03170 g001
Figure 2. The moderating role of digital transformation.
Sustainability 17 03170 g002
Figure 3. Heterogeneity analysis.
Sustainability 17 03170 g003
Table 1. Definition of variables.
Variable TypeVariable NameVariable SymbolCalculation Method
explanatory variableESG performanceESGSource from CSI ESG Ratings
explained variableGreen technology innovationGILn (total number of green patent applications for the year + 1)
moderator variableDigital transformationDTLn (total word frequency of digital transformation + 1)
control variableEnterprise scaleSizeLn (total assets at end of period + 1)
Financial leverageLevTotal liabilities/total assets
Return on assetsRoaTotal income/total assets
Research and development expendituresRDLn (total R&D expenditures at the end of period+ 1)
Cash flow ratioCashflowNet cash flows from operating activities/total assets
Revenue growth rateGrowthIncrease in operating income for the current year/operating income for the previous year
Board sizeBoardLn (number of board members)
Market performanceTobinQMarket value/replacement cost
Institutional investor shareholdingINSTTotal number of shares held by institutional investors/outstanding share capital
Years of company establishmentFirmAgeLn(current year − year of incorporation + 1)
Whether audited by a Big Four accounting firmBig4Companies audited by Big Four firms are 1, otherwise 0
Table 2. Descriptive statistics.
VariableNMeanSDMinMax
GI35,1560.3540.76103.555
ESG35,15673.4704.91858.03084.070
DT35,1562.9401.25706.999
Size35,15622.2301.27919.99026.210
Lev35,1560.4140.2050.0510.889
Roa35,1560.0460.063−0.2210.227
RD35,1568.4569.080024.630
Cashflow35,1560.0490.069−0.1570.247
Growth35,1560.1690.373−0.5392.275
Board35,1562.1260.1991.6092.708
TobinQ35,1562.0301.2800.8468.406
INST35,1560.4450.2500.0030.909
FirmAge35,1562.8920.3451.7923.526
Big435,1560.0630.24401
Table 3. Correlation analysis.
GIESGDTSizeLevRoaRDCashflowGrowthBoardTobinQINSTFirmAge
GI 0.127 ***0.180 ***0.112 ***0.070 ***0.016 ***0.183 ***−0.013 **0.034 ***0.015 ***−0.030 ***−0.002−0.031 ***
ESG0.131 *** 0.101 ***0.148 ***−0.066 ***0.212 ***0.098 ***0.077 ***0.055 ***0.012 **−0.100 ***0.083 ***−0.028 ***
DT0.172 ***0.101 *** 0.069 ***−0.054 ***0.038 ***0.438 ***−0.021 ***0.035 ***−0.109 ***0.046 ***−0.108 ***0.099 ***
Size0.171 ***0.183 ***0.060 *** 0.530 ***−0.120 ***0.190 ***0.059 ***0.022 ***0.239 ***−0.504 ***0.406 ***0.225 ***
Lev0.088 ***−0.074 ***−0.063 ***0.525 *** −0.430 ***−0.008−0.142 ***0.014 ***0.147 ***−0.358 ***0.206 ***0.152 ***
Roa0.018 ***0.213 ***−0.005−0.051 ***−0.383 *** 0.028 ***0.412 ***0.346 ***−0.024 ***0.281 ***0.074 ***−0.146 ***
RD0.140 ***0.075 ***0.414 ***0.106 ***−0.052 ***−0.017 *** 0.075 ***−0.005−0.108 ***−0.102 ***−0.059 ***0.297 ***
Cashflow−0.0030.069 ***−0.021 ***0.060 ***−0.151 ***0.412 ***0.067 *** 0.058 ***0.039 ***0.110 ***0.130 ***0.015 ***
Growth0.005−0.0010.018 ***0.037 ***0.035 ***0.265 ***−0.031 ***0.032 *** −0.0060.108 ***0.030 ***−0.120 ***
Board0.030 ***0.021 ***−0.100 ***0.255 ***0.155 ***−0.004−0.129 ***0.038 ***−0.006 −0.138 ***0.228 ***0.008
TobinQ−0.044 ***−0.096 ***0.019 ***−0.356 ***−0.260 ***0.200 ***−0.070 ***0.126 ***0.065 ***−0.119 *** −0.132 ***−0.119 ***
INST0.022 ***0.085 ***−0.116 ***0.429 ***0.210 ***0.096 ***−0.093 ***0.118 ***0.041 ***0.237 ***−0.041 *** 0.010 *
FirmAge−0.015 ***−0.034 ***0.089 ***0.196 ***0.164 ***−0.128 ***0.306 ***0.023 ***−0.077 ***0.006−0.028 ***0.005
Lower triangular cells report Pearson’s correlation coefficients, and upper triangular cells are Spearman’s rank correlation. *** p < 0.01, ** p < 0.05, * p < 0.1.
Table 4. Results of regression analysis.
Variables(1)(2)(3)(4)
GIGIGIGI
ESG0.004 ***0.005 ***0.004 ***0.003 ***
(4.58)(5.76)(3.88)(3.75)
DT 0.015 ***
(2.67)
ESG*DT 0.002 ***
(2.73)
Size 0.082 ***0.055 ***0.051 ***
(8.69)(4.19)(3.82)
Lev 0.0470.0130.017
(1.42)(0.34)(0.44)
Roa 0.1000.0730.073
(1.61)(1.10)(1.10)
RD 0.005 ***0.008 ***0.007 ***
(9.05)(8.25)(8.05)
Cashflow −0.133 ***−0.091 *−0.090 *
(−2.84)(−1.87)(−1.86)
Growth −0.024 ***−0.021 ***−0.021 ***
(−3.74)(−3.10)(−3.15)
Board −0.013−0.014−0.016
(−0.41)(−0.39)(−0.43)
TobinQ 0.013 ***0.009 **0.009 **
(4.10)(2.41)(2.30)
INST −0.125 ***−0.104 **−0.103 **
(−4.01)(−2.53)(−2.50)
FirmAge −0.0050.0610.063
(−0.20)(0.67)(0.70)
Big4 0.0280.0250.025
(0.78)(0.63)(0.65)
Constant−0.125−1.829 ***−1.348 ***−1.285 ***
(−1.31)(−8.70)(−3.67)(−3.50)
Firm FEYESNOYESYES
Industry FEYESNOYESYES
Year FEYESNOYESYES
Observations35,15635,15635,15635,156
R-squared0.0250.0260.0300.031
*** p < 0.01, ** p < 0.05, * p < 0.1, Robust t-statistics in parentheses, hereinafter the same.
Table 5. Endogeneity test.
Variables(1)(2)(3)(4)(5)
ESGGIESG_binGIGI
ESG 0.093 *** 0.004 ***0.017 **
(4.75) (4.94)(2.15)
Fundnumber0.000 ***
(7.98)
ESGFV 0.000 ***
(11.23)
imr −0.169 ***
(−2.87)
L.GI 0.798 ***
(10.20)
Size0.974 ***−0.040 *0.173 ***0.031 ***−0.069
(16.29)(−1.76)(18.45)(2.73)(−0.93)
Lev−4.343 ***0.406 ***−0.888 ***0.113 **0.827 *
(−18.98)(4.36)(−18.45)(2.48)(1.77)
Roa6.374 ***−0.511 ***3.227 ***−0.299 **−0.590
(13.05)(−3.44)(21.74)(−2.08)(−0.59)
RD0.060 ***0.0020.022 ***0.005 ***−0.002
(8.25)(1.16)(9.72)(4.19)(−0.10)
Cashflow−2.199 ***0.101−0.344 ***−0.0541.055
(−5.93)(1.42)(−2.96)(−1.10)(1.14)
Growth−0.436 ***0.019−0.200 ***0.0010.062
(−7.31)(1.49)(−9.82)(0.08)(0.44)
Board−0.551 ***0.035−0.144 ***0.0020.170
(−2.79)(1.09)(−3.82)(0.07)(0.81)
TobinQ−0.126 ***0.016 ***−0.108 ***0.018 ***−0.007
(−4.88)(3.87)(−14.24)(4.03)(−0.20)
INST−0.014−0.126 ***−0.036−0.111 ***−0.978 **
(−0.06)(−3.48)(−1.10)(−3.78)(−2.00)
FirmAge−1.739 ***0.204 ***−0.199 ***0.077 *0.128
(−4.82)(3.17)(−8.26)(1.66)(0.40)
Big40.0680.0180.098 ***0.0150.232
(0.35)(0.61)(3.07)(0.62)(1.43)
Constant61.211 ***−6.574 ***−2.830 ***−0.762 ***−1.845
(36.95)(−5.60)(−13.14)(−2.59)(−0.86)
Industry FEYESYESYESYESYES
Year FEYESYESYESYESYES
Observations35,15635,15635,15635,15629,150
R-squared0.052 0.0860.031
*** p < 0.01, ** p < 0.05, * p < 0.1, Robust t-statistics in parentheses.
Table 6. Robustness test.
Variables(1)(2)(3)(4)(5)(6)
GIGIGIGIGIGI
L.ESG0.004 ***0.004 ***0.003 ***
(4.12)(3.43)(3.26)
Bloomberg 0.007 ***0.006 ***0.005 ***
(3.56)(3.00)(2.89)
DT 0.014 ** 0.008
(2.23) (0.76)
M 0.002 ** 0.002 *
(2.27) (1.65)
Size 0.053 ***0.049 *** 0.049 *0.046 *
(3.41)(3.13) (1.85)(1.72)
Lev −0.015−0.010 0.0240.025
(−0.34)(−0.23) (0.31)(0.33)
Roa 0.1020.098 0.2360.234
(1.35)(1.29) (1.62)(1.61)
RD 0.007 ***0.007 *** 0.009 ***0.009 ***
(7.37)(7.23) (5.84)(5.80)
Cashflow −0.087−0.086 −0.117−0.118
(−1.60)(−1.58) (−1.23)(−1.24)
Growth −0.020 ***−0.021 *** −0.017−0.017
(−2.62)(−2.68) (−1.50)(−1.51)
Board −0.007−0.008 −0.028−0.030
(−0.17)(−0.21) (−0.38)(−0.40)
TobinQ 0.009 **0.009 ** 0.0060.005
(2.17)(2.16) (0.86)(0.81)
INST −0.097 **−0.096 ** −0.194 **−0.193 **
(−2.06)(−2.06) (−2.22)(−2.21)
FirmAge 0.0550.060 0.1730.173
(0.51)(0.56) (0.88)(0.88)
Big4 0.0120.013 −0.012−0.012
(0.29)(0.31) (−0.20)(−0.20)
Constant−0.049−1.235 ***−1.179 ***0.158 ***−1.216 *−1.172
(−0.52)(−2.86)(−2.74)(2.66)(−1.69)(−1.63)
Firm FEYESYESYESYESYESYES
Industry FEYESYESYESYESYESYES
Year FEYESYESYESYESYESYES
Observations29,15029,15029,15012,36212,36212,362
R-squared0.0210.0260.0260.0470.0540.054
*** p < 0.01, ** p < 0.05, * p < 0.1, Robust t-statistics in parentheses.
Table 7. Other robustness test.
Variables(1)(2)(3)(4)
GIGIGIGI
ESG20.000
(1.59)
ESG−0.0200.005 ***0.004 ***0.004 ***
(−1.37)(4.75)(3.91)(3.77)
DT 0.016 ***
(2.76)
ESG*DT 0.002 ***
(2.74)
Size0.055 *** 0.053 ***0.049 ***
(4.19) (3.86)(3.56)
Lev0.012 −0.005−0.001
(0.32) (−0.12)(−0.02)
Roa0.075 0.0830.080
(1.12) (1.24)(1.19)
RD0.007 *** 0.008 ***0.007 ***
(8.19) (8.08)(7.90)
Cashflow−0.091 * −0.075−0.073
(−1.88) (−1.50)(−1.48)
Growth−0.020 *** −0.020 ***−0.020 ***
(−3.06) (−2.80)(−2.83)
Board−0.014 0.0070.006
(−0.39) (0.15)(0.13)
TobinQ0.009 ** 0.007 *0.007 *
(2.38) (1.75)(1.67)
INST−0.104 ** −0.0000.005
(−2.52) (−0.01)(0.08)
FirmAge0.061 0.0500.056
(0.67) (0.49)(0.55)
Big40.025 0.0290.030
(0.64) (0.72)(0.74)
ATO −0.012−0.012
(−0.91)(−0.87)
INV 0.0540.054
(0.97)(0.99)
FIXED 0.0030.004
(0.06)(0.07)
Indep 0.0010.001
(0.87)(0.90)
Top10 −0.171 **−0.181 **
(−2.06)(−2.19)
Balance −0.009−0.009
(−0.38)(−0.37)
ListAge −0.008−0.011
(−0.47)(−0.70)
Mshare 0.0010.000
(0.86)(0.81)
Constant−0.488−0.138−1.305 ***−1.251 ***
(−0.81)(−1.43)(−3.20)(−3.08)
Firm FEYESYESYESYES
Industry FEYESYESYESYES
Year FEYESYESYESYES
Observations35,15633,88733,88733,887
R-squared0.0310.0260.0320.033
*** p < 0.01, ** p < 0.05, * p < 0.1, Robust t-statistics in parentheses.
Table 8. Heterogeneity analysis.
Variables(1)
Environment
(2)
Society
(3)
Internal Governance
(4)
Heavily Polluting Industries
(5)
Non-Heavily Polluting Industries
(6)
High Marketization Areas
(7)
Low Marketization Areas
GIGIGIGIGIGIGI
E0.001
(1.58)
S 0.002 ***
(3.49)
G 0.002 ***
(2.80)
ESG 0.003 **0.004 ***0.004 ***0.002
(2.04)(3.24)(3.77)(1.06)
Size0.058 ***0.056 ***0.057 ***0.0280.071 ***0.062 ***0.014
(4.41)(4.23)(4.35)(1.37)(4.15)(4.24)(0.51)
Lev−0.002−0.0040.013−0.0720.0390.0130.007
(−0.05)(−0.11)(0.35)(−1.23)(0.78)(0.31)(0.10)
Roa0.0950.0840.0810.220 **0.0180.0820.078
(1.43)(1.27)(1.22)(2.03)(0.21)(1.09)(0.58)
0.008 ***0.007 ***0.008 ***0.008 ***0.008 ***0.008 ***0.006 ***
(8.38)(8.12)(8.43)(3.39)(7.68)(7.18)(3.59)
Cashflow−0.098 **−0.095 **−0.093 *0.023−0.140 **−0.134 **0.116
(−2.03)(−1.97)(−1.92)(0.32)(−2.25)(−2.50)(1.01)
Growth−0.022 ***−0.022 ***−0.022 ***0.004−0.027 ***−0.028 ***0.003
(−3.25)(−3.26)(−3.23)(0.32)(−3.33)(−3.52)(0.29)
Board−0.016−0.018−0.013−0.007−0.034−0.015−0.034
(−0.44)(−0.50)(−0.36)(−0.11)(−0.76)(−0.36)(−0.45)
TobinQ0.009 **0.009 **0.009 **0.009 *0.0060.010 **0.000
(2.38)(2.28)(2.38)(1.83)(1.16)(2.42)(0.01)
INST−0.103 **−0.102 **−0.106 **−0.070−0.098 *−0.106 **−0.058
(−2.49)(−2.47)(−2.56)(−1.04)(−1.80)(−2.27)(−0.69)
FirmAge0.0540.0530.063−0.1690.1610.109−0.285
(0.60)(0.59)(0.69)(−1.16)(1.45)(1.14)(−1.11)
Big40.0250.0260.0250.0120.024−0.0030.189
(0.63)(0.65)(0.63)(0.25)(0.47)(−0.08)(1.20)
Constant−1.175 ***−1.178 ***−1.289 ***−0.371−1.903 ***−1.616 ***0.383
(−3.25)(−3.31)(−3.51)(−0.63)(−3.98)(−4.07)(0.40)
Firm FEYESYESYESYESYESYESYES
Industry FEYESYESYESYESYESYESYES
Year FEYESYESYESYESYESYESYES
Observations35,15635,15635,15612,00323,15329,2115945
R-squared0.0300.0300.0300.0210.0400.0350.023
*** p < 0.01, ** p < 0.05, * p < 0.1, Robust t-statistics in parentheses.
Disclaimer/Publisher’s Note: The statements, opinions and data contained in all publications are solely those of the individual author(s) and contributor(s) and not of MDPI and/or the editor(s). MDPI and/or the editor(s) disclaim responsibility for any injury to people or property resulting from any ideas, methods, instructions or products referred to in the content.

