Article

Factors Influencing Transparency in Urban Landscape Water Bodies in Taiyuan City Based on Machine Learning Approaches

1
College of Environmental Science and Engineering, Taiyuan University of Technology, Jinzhong 030600, China
2
State Key Laboratory of Clean and Efficient Coal Utilization, Taiyuan University of Technology, Taiyuan 030024, China
3
Coshare Energy Environment, Taiyuan 030002, China
*
Author to whom correspondence should be addressed.
Sustainability 2025, 17(7), 3126; https://doi.org/10.3390/su17073126
Submission received: 5 February 2025 / Revised: 25 March 2025 / Accepted: 26 March 2025 / Published: 1 April 2025
(This article belongs to the Section Sustainable Urban and Rural Development)

Abstract

:
Urban landscape lakes (ULLs) in water-scarce cities face significant water quality challenges due to limited resources and intense human activity. This study identifies the main factors affecting transparency (SD) in these water bodies and proposes targeted management strategies. Machine learning techniques, including Gradient Boosting Decision Tree (GBDT), eXtreme Gradient Boosting (XGBoost), and Artificial Neural Networks (ANNs), were applied to analyze SD drivers under various water supply conditions. Results show that, for surface water-supplied lakes, the GBDT model was most effective, identifying chlorophyll-a (Chl-a), inorganic suspended solids (ISS), and hydraulic retention time (HRT) as primary factors. For tap water-supplied lakes, ISS and dissolved oxygen (DO) were critical while, for rainwater retention bodies, the XGBoost model highlighted chemical oxygen demand (CODMn) and HRT as key factors. Further analysis with ANN models provided optimal learning rates and hidden layer configurations, enhancing SD predictions through contour mapping. The findings indicate that, under low suspended solid conditions, the interaction between HRT and ISS notably affects SD in surface water-supplied lakes. For tap water-supplied lakes, SD is predominantly influenced by ISS at low levels, while HRT gains significance as concentrations increase. In rainwater retention lakes, CODMn emerges as the primary factor under low concentrations, with HRT interactions becoming prominent as CODMn rises. This study offers a scientific foundation for effective strategies in ULL water quality management and aesthetic enhancement.

1. Introduction

As globalization and urbanization accelerate, water scarcity has become a critical global issue. In water-scarce cities like Taiyuan, maintaining the quality of urban landscape water lakes (ULLs) presents a significant challenge [1,2]. Taiyuan, located in a temperate continental climate zone, suffers from uneven rainfall and extended drought periods, which only heighten its water resource constraints. Unlike cities with abundant water resources, Taiyuan cannot simply rely on increasing its water supply to address water quality issues. Therefore, understanding how to maintain urban water quality with limited water resources is crucial—not only for Taiyuan but for other cities facing similar challenges worldwide [3].
Globally, there has been growing recognition of the aesthetic and recreational importance of ULLs [4]. These bodies of water, often man-made with slow water flow, are valued for their visual appeal and function primarily to enhance urban beauty and offer recreational spaces [5,6]. Public perceptions of these water bodies are heavily influenced by visual factors such as transparency (SD), water color, and turbidity [7,8], with SD playing a particularly significant role. Several studies have indicated a strong correlation between SD and public satisfaction [8,9,10]. Moreover, SD not only indicates suspended solid concentrations but also provides insights into the ecological state of the water body, making it a key measure of water quality [5,6]. SD is commonly measured using a Secchi disk, which is a simple yet effective method for continuous water quality monitoring. For water-scarce cities, the challenge lies in maintaining high SD with minimal water replenishment.
Various methods have been used to predict SD, including ground-based sensors [11], water quality models [12,13,14], remote sensing technologies [15,16,17], and integrated approaches [18,19]. However, these approaches have limitations when applied to ULLs. Remote sensing is typically suited to large-scale water bodies and is less effective for smaller urban systems; water quality models often require complex, time-consuming data inputs; and, while ground-based sensors are highly accurate, their cost restricts broader implementation. In contrast, machine learning models offer greater efficiency and accuracy in handling complex multivariable relationships, making them ideal for predicting SD in ULLs while significantly reducing time and cost.
Machine learning techniques such as Random Forest (RF) [20,21,22] and Artificial Neural Networks (ANNs) [23,24] have demonstrated considerable success in identifying key factors influencing water quality, providing valuable guidance for water management [21,22]. Although machine learning has been widely adopted for WQI calculations [25,26], its application to assess the importance of water quality parameters in ULLs remains underexplored. ULLs, being smaller and more susceptible to anthropogenic impacts, present unique challenges distinct from those in larger natural systems. For instance, while Tymoteusz et al. [27] found biochemical oxygen demand (BOD), turbidity, dissolved oxygen (DO), nitrate, pH, and total phosphorus (TP) to be the most important factors in larger water bodies, research by Ao [5] and Chang [4,9] on ULLs in Xi’an identified suspended solids (ISS) and chlorophyll-a (Chl-a) as the most sensitive parameters.
This study investigates the influence of different water supply sources on the SD of 16 ULLs in Taiyuan. By applying advanced machine learning algorithms—namely, Gradient Boosting Decision Tree (GBDT), eXtreme Gradient Boosting (XGBoost), and an ANN —this study identifies how water source variations impact SD and determines the key parameters that drive these changes. The findings offer crucial insights for managing ULLs more effectively. Through iterative experiments, model parameters such as learning rates and network structures were optimized, leading to the development of SD fitting maps and contour plots. These results provide new perspectives for water resource management, offering innovative solutions and strategies for cities like Taiyuan and others facing similar water scarcity challenges.

2. Data Acquisition and Analysis Methods

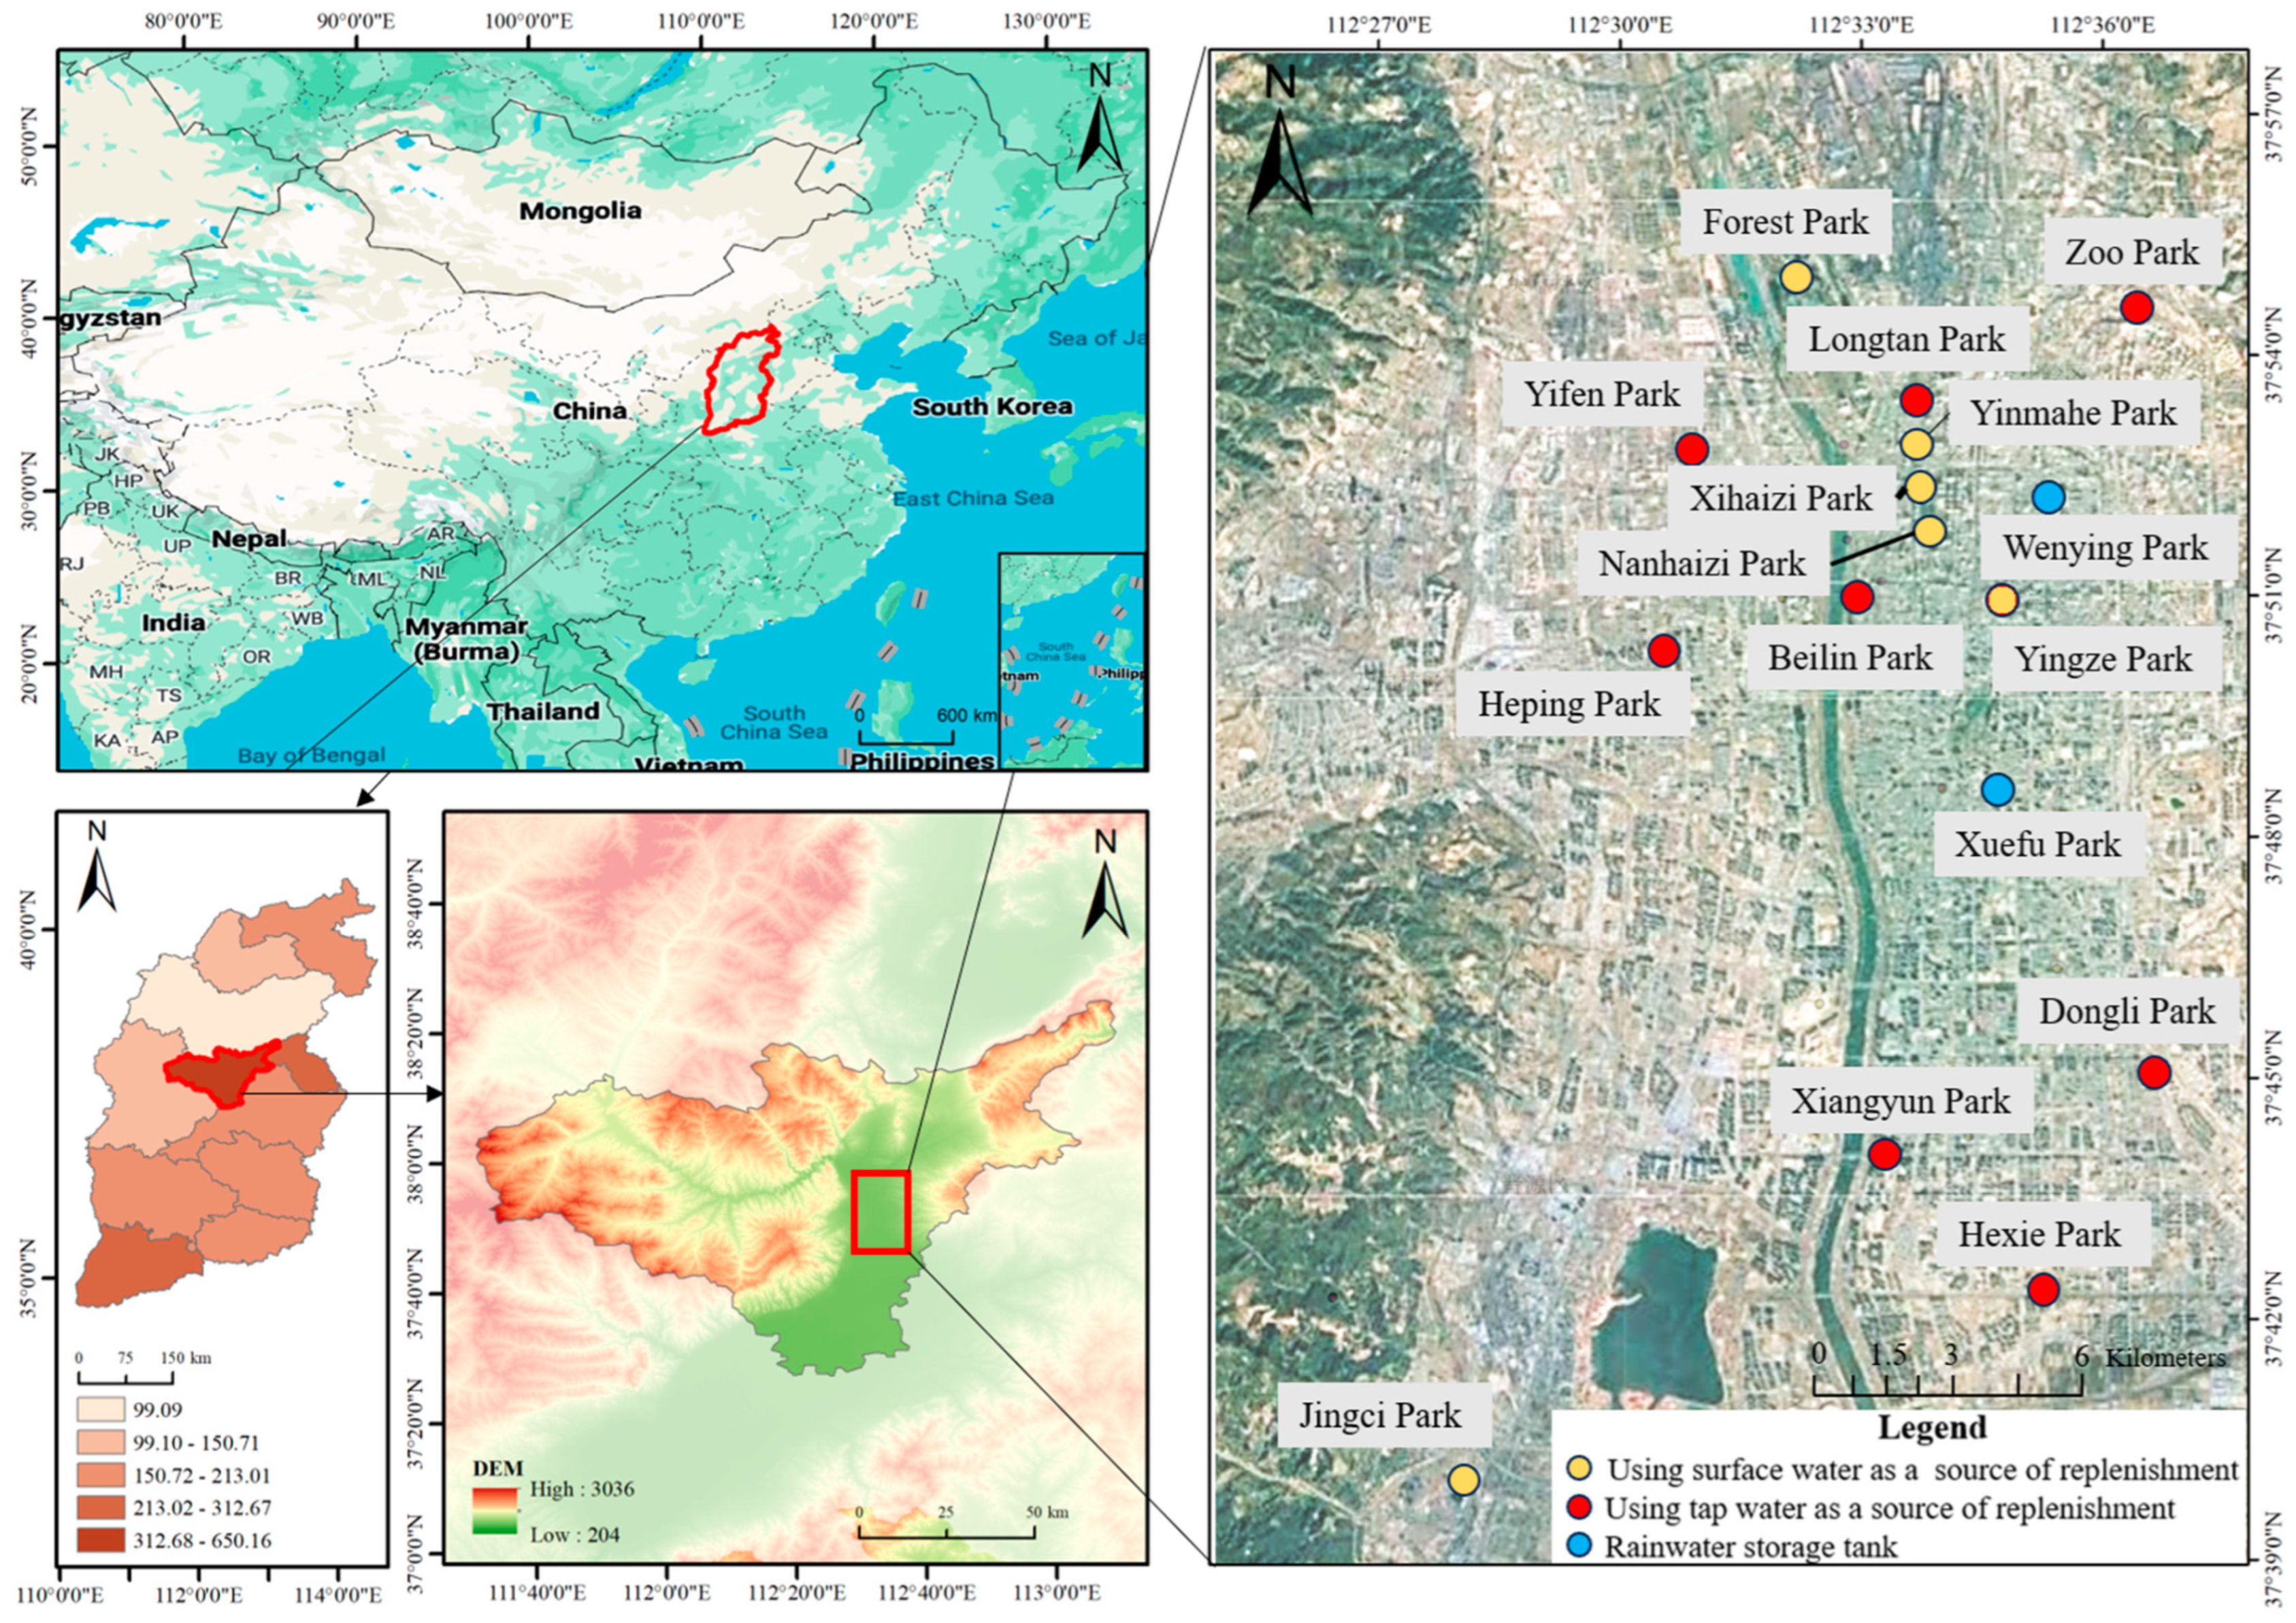
2.1. Study Area and Data Acquisition

From July to October 2021 and from April to October 2022, this study conducted sampling surveys on 16 representative ULLs in Taiyuan City. The primary water supply sources for these water bodies are tap water, rainwater, and surface water. The water bodies vary in size, with surface areas ranging from 0.11 to 25 hectares and an average depth of 1 to 2.55 m. The primary water sources included surface water (37.5%, six water bodies), municipal water supply (50%, eight water bodies), and rainwater runoff storage (12.5%, two water bodies). Field surveys and satellite map analysis provided morphological data for each water body, while local government agencies supplied detailed information on the water supply systems, including sources, frequency, and volume of replenishment. Figure 1 illustrates the study area covered, and the basic information about the research area can be found in our previously published article [28].
Sampling was conducted between the 22nd and 26th of each month, avoiding rainy and freezing periods. Monitoring points were selected based on the area and shape of the water bodies. Following established guidelines [29,30,31], temperature (T, °C) and dissolved oxygen (DO, mg/L) were measured using a portable YSI meter (YSI Company, Yellow Springs, OH, USA), and SD (cm) was assessed with a Secchi disc. Water samples were collected at a depth of 0.5 m and stored in 1 L plastic bottles. In the laboratory, total phosphorus (TP), chlorophyll-a (Chl-a), nitrate nitrogen (NO3-N), chemical oxygen demand (COD), and ammonia nitrogen (NH4+-N) were analyzed according to the “Standard Methods for the Examination of Water and Wastewater”. Three parallel samples were collected at each site, and average values were calculated to ensure data accuracy and reliability, providing a scientific basis for assessing the water quality in Taiyuan.

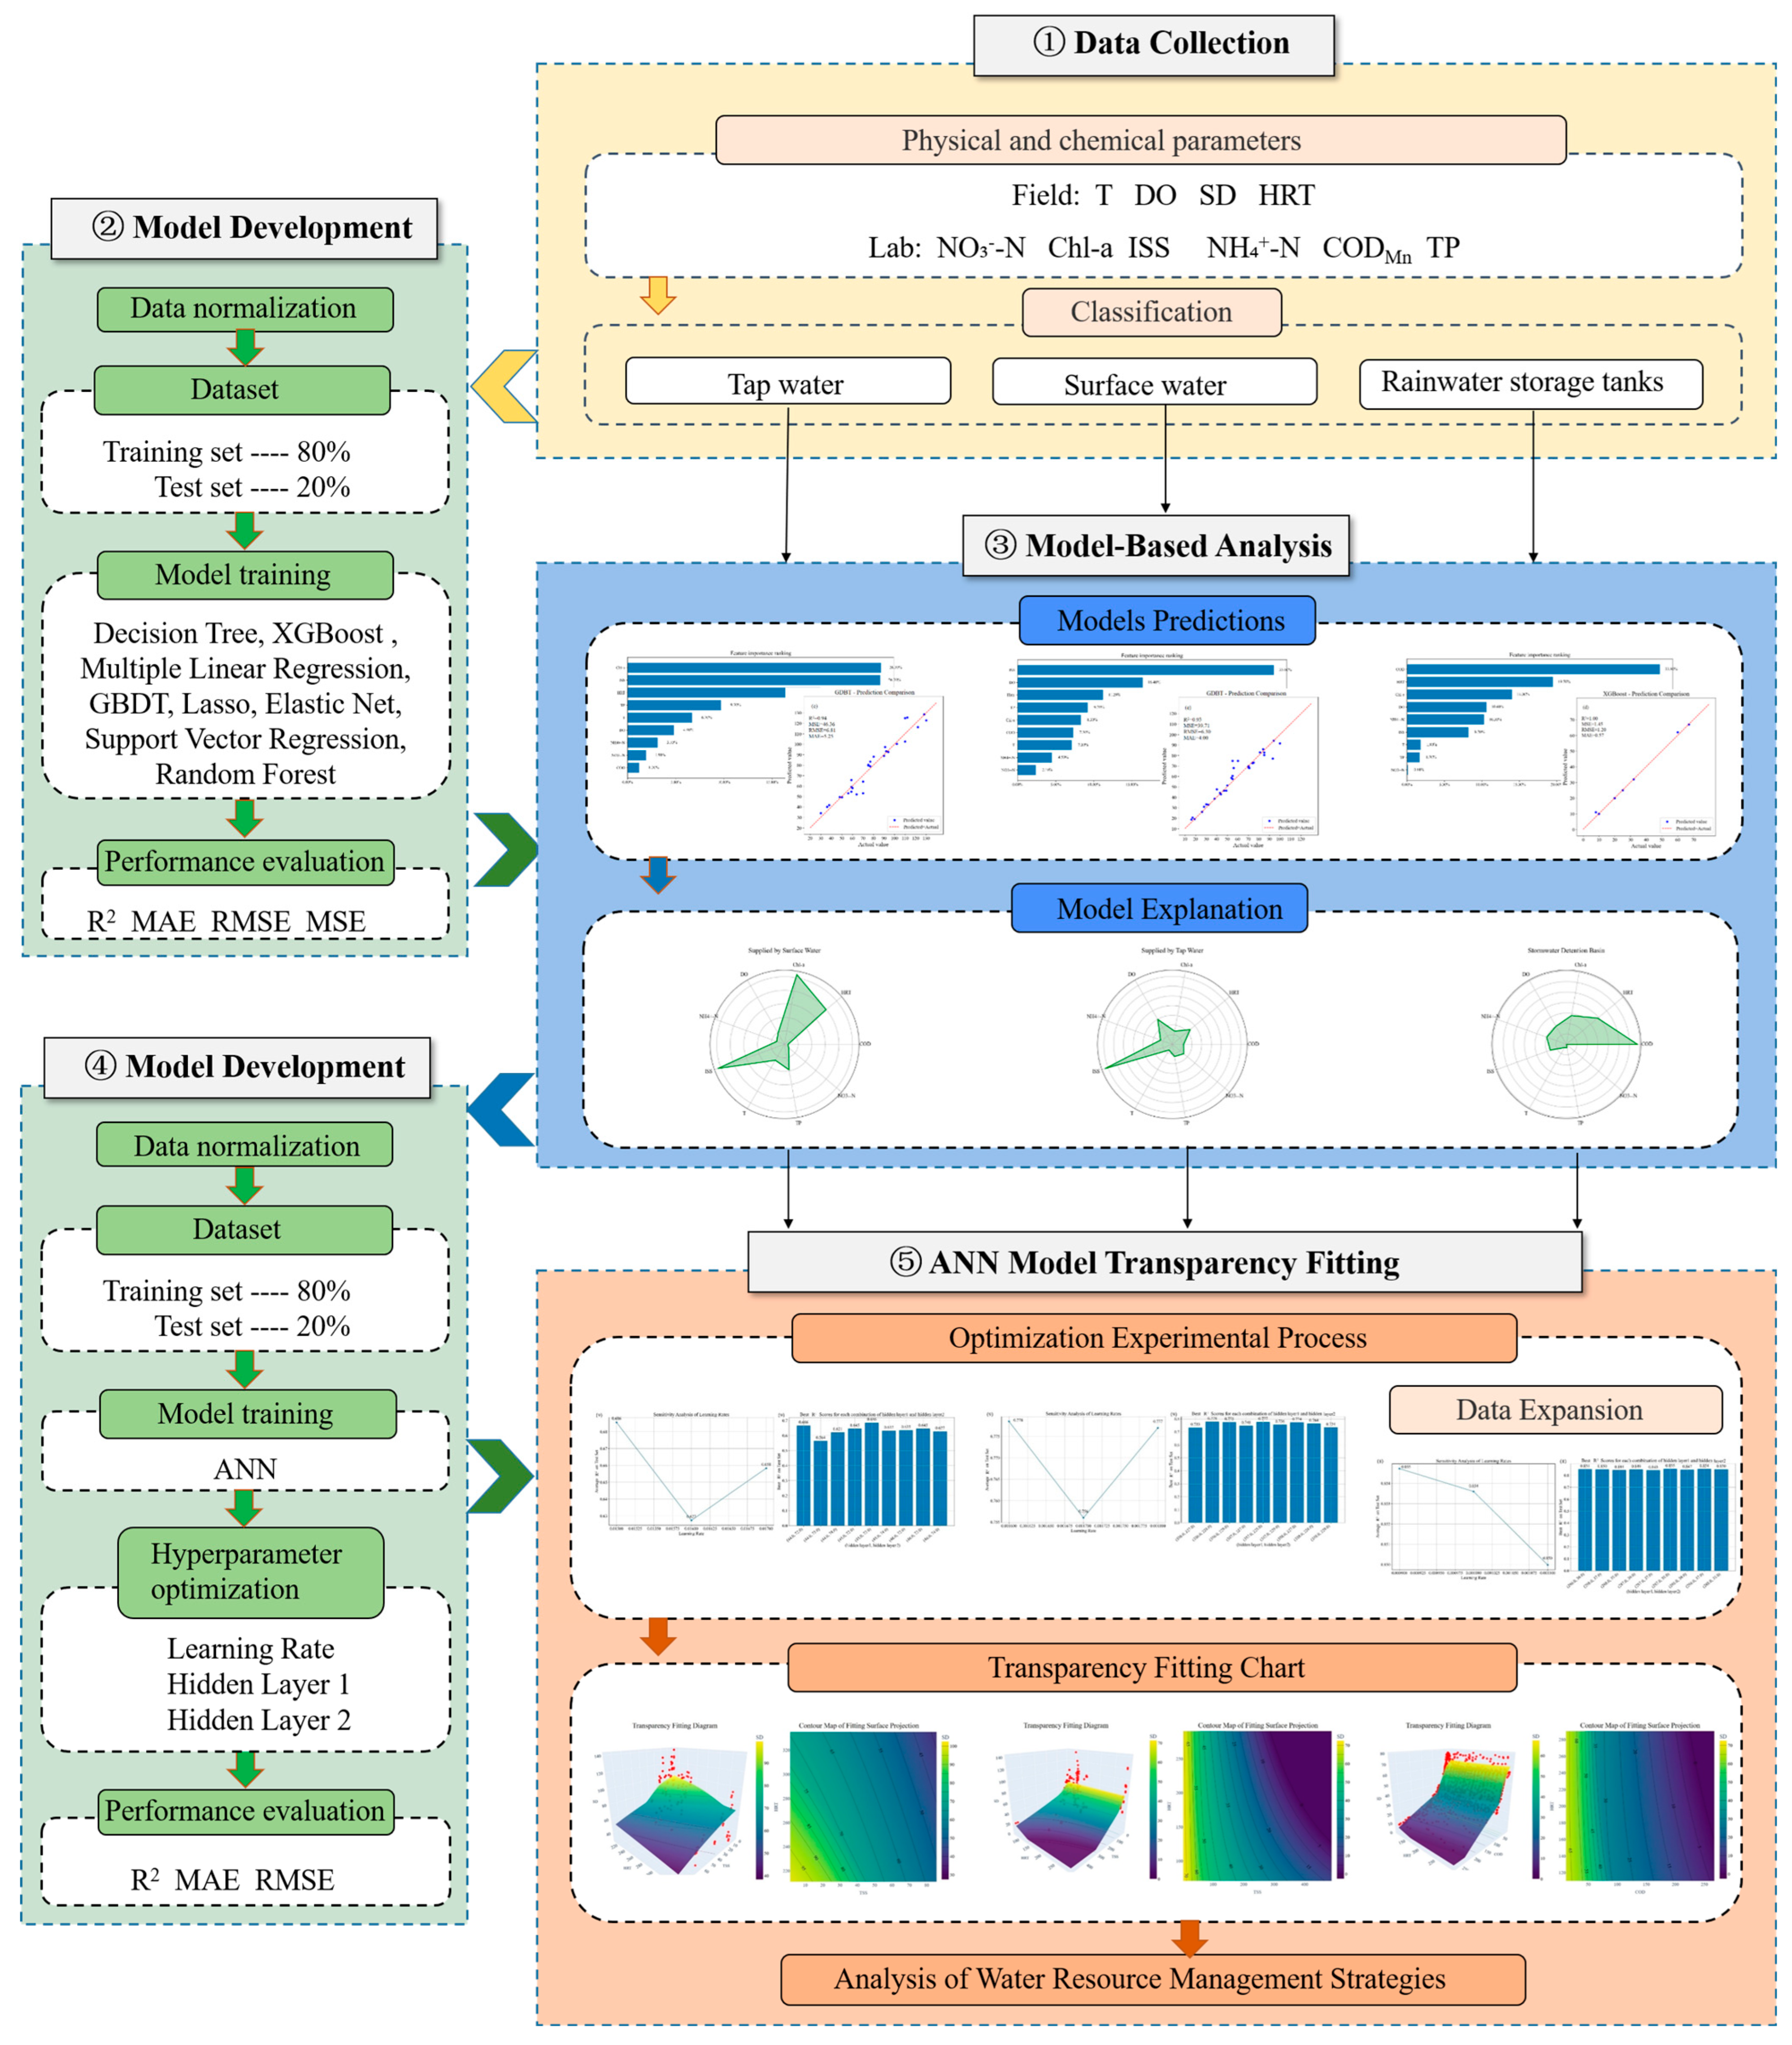
2.2. Analysis Procedure

(i) Collect 351 samples from ULLs and determine physicochemical parameters through laboratory analysis. (ii) Classify ULLs based on different water supply sources. (iii) Preprocess the data, including standardization, and divide it into training and test sets using a random sampling method. (iv) Apply eight machine learning models, including RF and Multiple Linear Regression (MLR), for fitting analysis. (v) Evaluate model performance using four statistical metrics, R2, MES, RMSE, and MAE, and select the optimal model for analyzing key water quality parameters. (vi) Optimize the hyperparameters of the ANN model for different water supply sources. (vii) Apply the optimized hyperparameters to the ANN model for SD fitting and evaluate strategies for maintaining water SD. The flowchart for this process is shown in Figure 2.

2.3. Data Selection

Research indicates that high concentrations of algae, sediment, and residues in urban water bodies, along with the absorption and scattering of light by these substances, are the primary factors leading to decreased water SD. Therefore, in addition to key factors such as Chl-a and ISS that directly impact SD, it is essential to consider water quality parameters that indirectly affect these indicators. These include DO, CODMn, NO3-N, NH4+-N, and TP. Moreover, T and HRT are crucial for the growth of phytoplankton and algae reproduction. Consequently, a comprehensive approach that considers environmental conditions (e.g., T), physicochemical states (e.g., DO, CODMn, NH4+-N, NO3-N, TP, Chl-a, and ISS), and hydraulic factors (e.g., HRT)—totaling nine parameters—is an effective research method [4,5].

2.4. Data Preprocessing

Data normalization scales different features to a standard range, typically [0, 1], to balance their influence within the model and prevent any single feature from dominating. This process is applied uniformly to both the training and test sets, enhancing model performance and accelerating convergence.
For model training and validation, 80% of the data was randomly allocated to the training set, with the remaining 20% assigned to the test set. This division enhances the model’s generalization ability, allowing it to accurately predict new data, and minimizing the risk of overfitting—a common approach in machine learning.

2.5. Machine Learning Models for Importance Analysis of Water Quality Parameters

Decision Tree (DT): Constructs a layered tree by splitting data based on individual parameters. Splits at top layers indicate significant parameters [32].
RF: Constructs a layered tree by splitting data based on individual parameters. Splits at top layers indicate significant parameters [33].
XGBoost: A gradient boosting model that builds on decision trees to iteratively reduce error. Key parameters are identified based on their cumulative influence across trees [34].
MLR: Models relationships between independent variables and a dependent variable, with parameter importance reflected by the magnitude of coefficients.
GBDT: Sequentially builds decision trees to minimize residuals. Important features are those frequently appearing in trees across multiple stages [35].
Support Vector Regression (SVR): Fits a line or hyperplane within a set tolerance. Feature importance is determined by their influence on the hyperplane’s position [36].
Least Absolute Shrinkage and Selection Operator (Lasso): Selects important features by penalizing smaller coefficients to zero, focusing on non-zero coefficients [37].
Elastic Net: Combines Lasso and Ridge Regression for feature selection, assigning zero to unimportant coefficients [38].

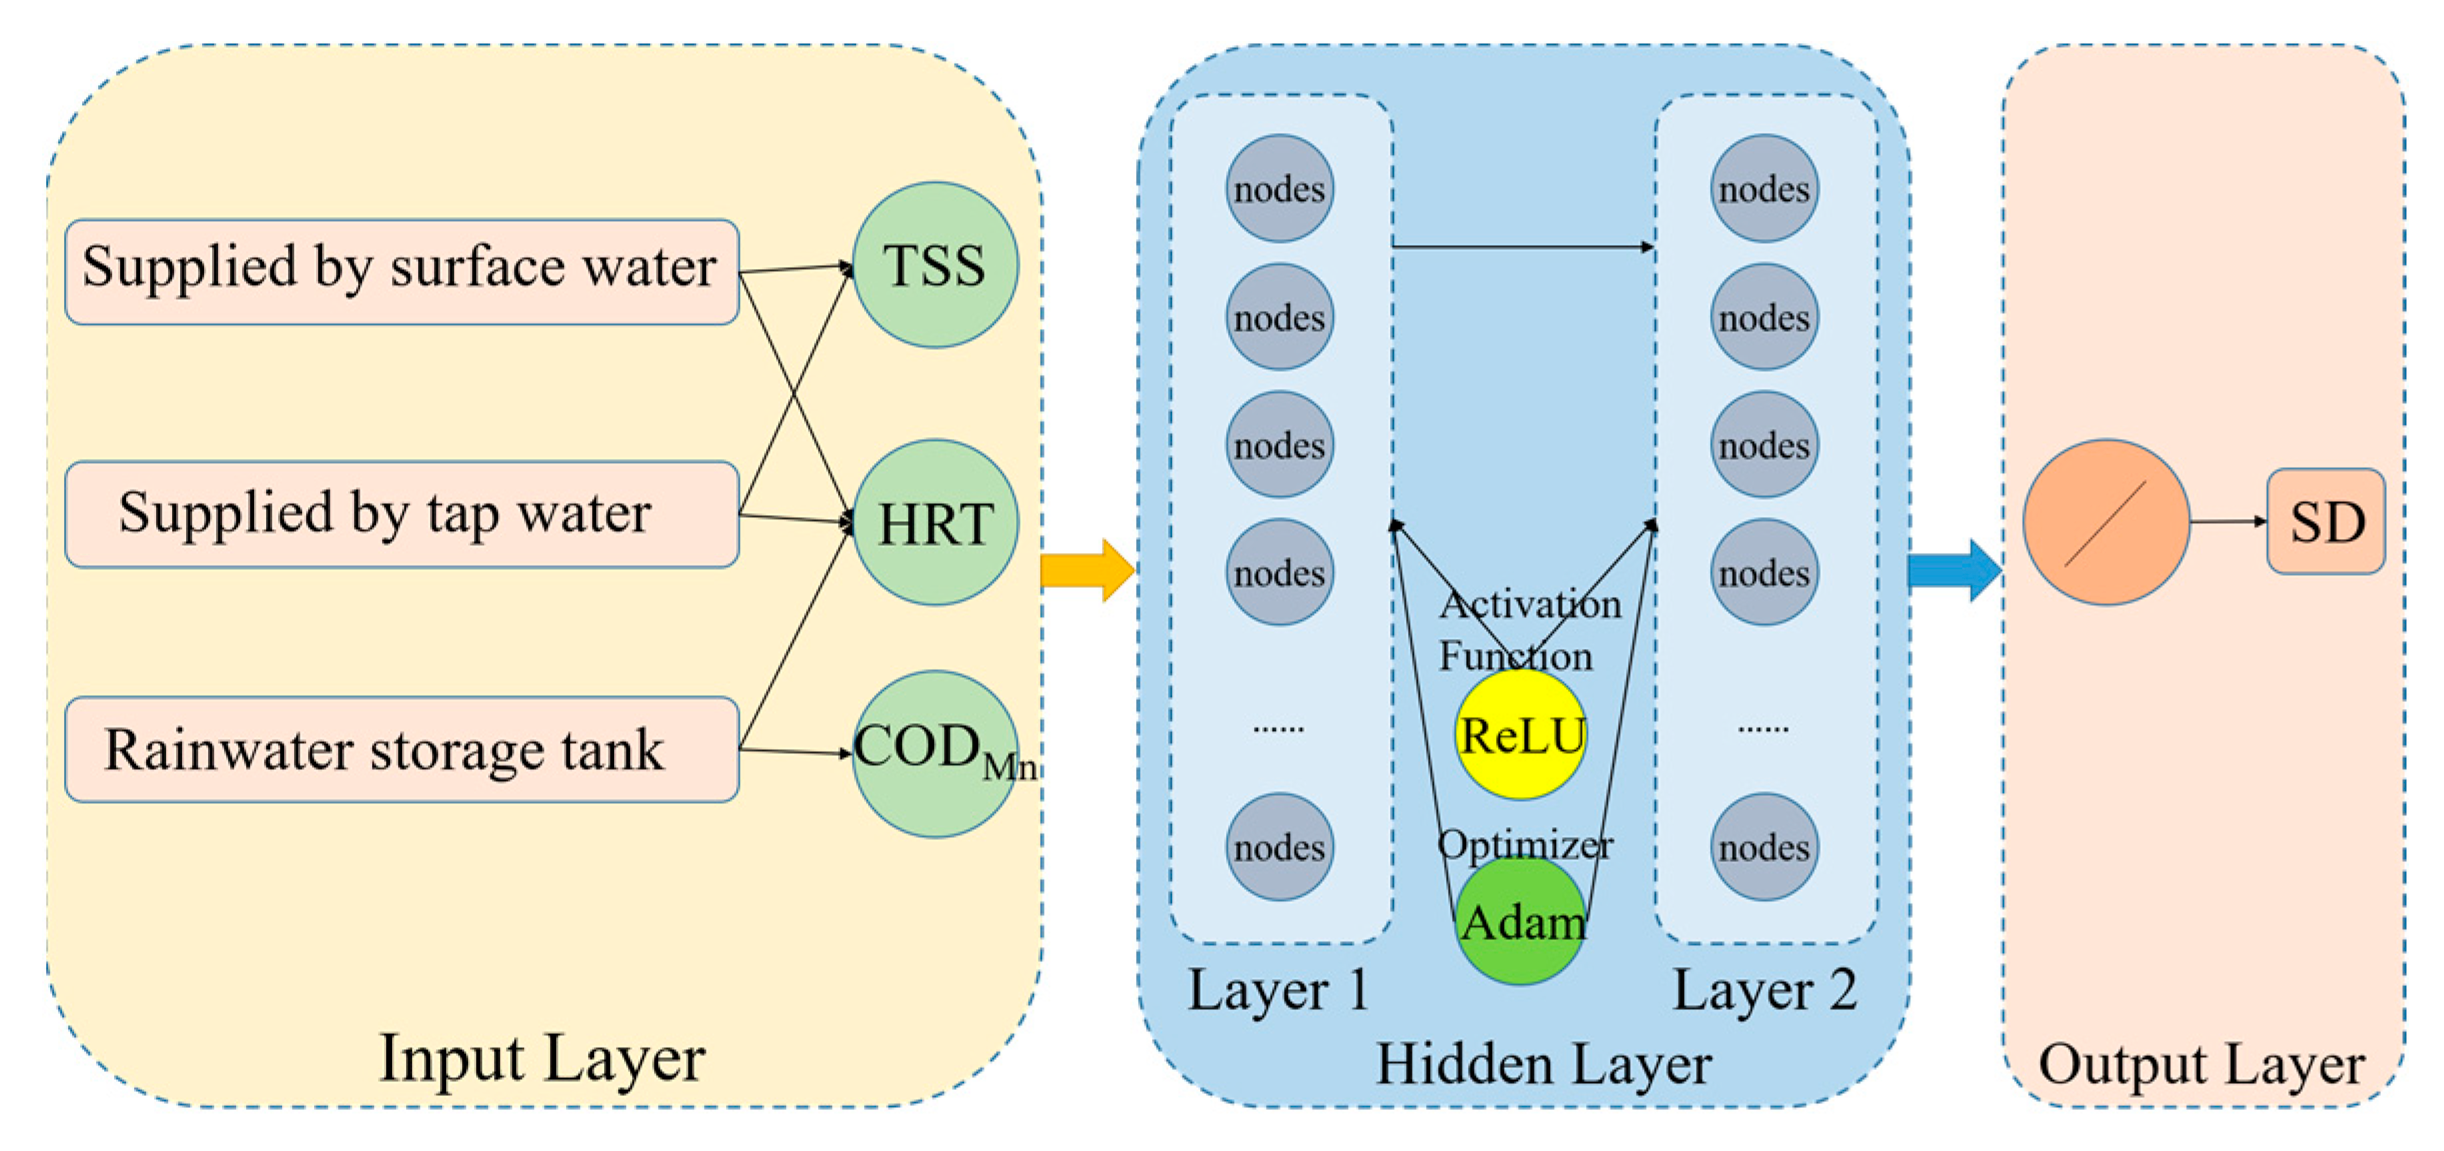
2.6. ANN Model for SD Fitting

Following the importance analysis of water quality parameters across different water sources, the ANN model was applied to systematically fit SD, aiming to optimize the predictive accuracy of SD under varying source conditions. In this study, an ANN model was constructed using the Python environment provided by the Anaconda3 distribution and its associated machine learning libraries. The objective was to fit one output parameter using two input parameters, presented simultaneously in the results section. A traditional ANN model comprises three parts: the input layer, hidden layers, and the output layer. These layers are interconnected through nodes called neurons. In this study, the ANN model was constructed and optimized by adjusting combinations of learning rate, hidden layer 1, and hidden layer 2. The goal was to identify the optimal parameter combination to improve the predictive accuracy of SD fitting.
The ANN model used in this study consists of an input layer, two hidden layers, and an output layer. The preprocessed data serve as the input layer, which then passes through two hidden layers with different numbers of neuron nodes, processed using the ReLU activation function. The output generates a single predicted value, namely, the water SD. The topology of the ANN is shown in Figure 3. This multi-layer network structure of the ANN model is capable of handling complex nonlinear relationships and effectively processing and analyzing input variables.
To improve the training efficiency and convergence speed of the model, this study employed normal distribution initialization for the network weights. This method ensures that the model parameters start within appropriate value ranges, preventing issues such as vanishing or exploding gradients. Specifically, the weights for each layer were initialized using a normal distribution, while the bias terms were set to zero.

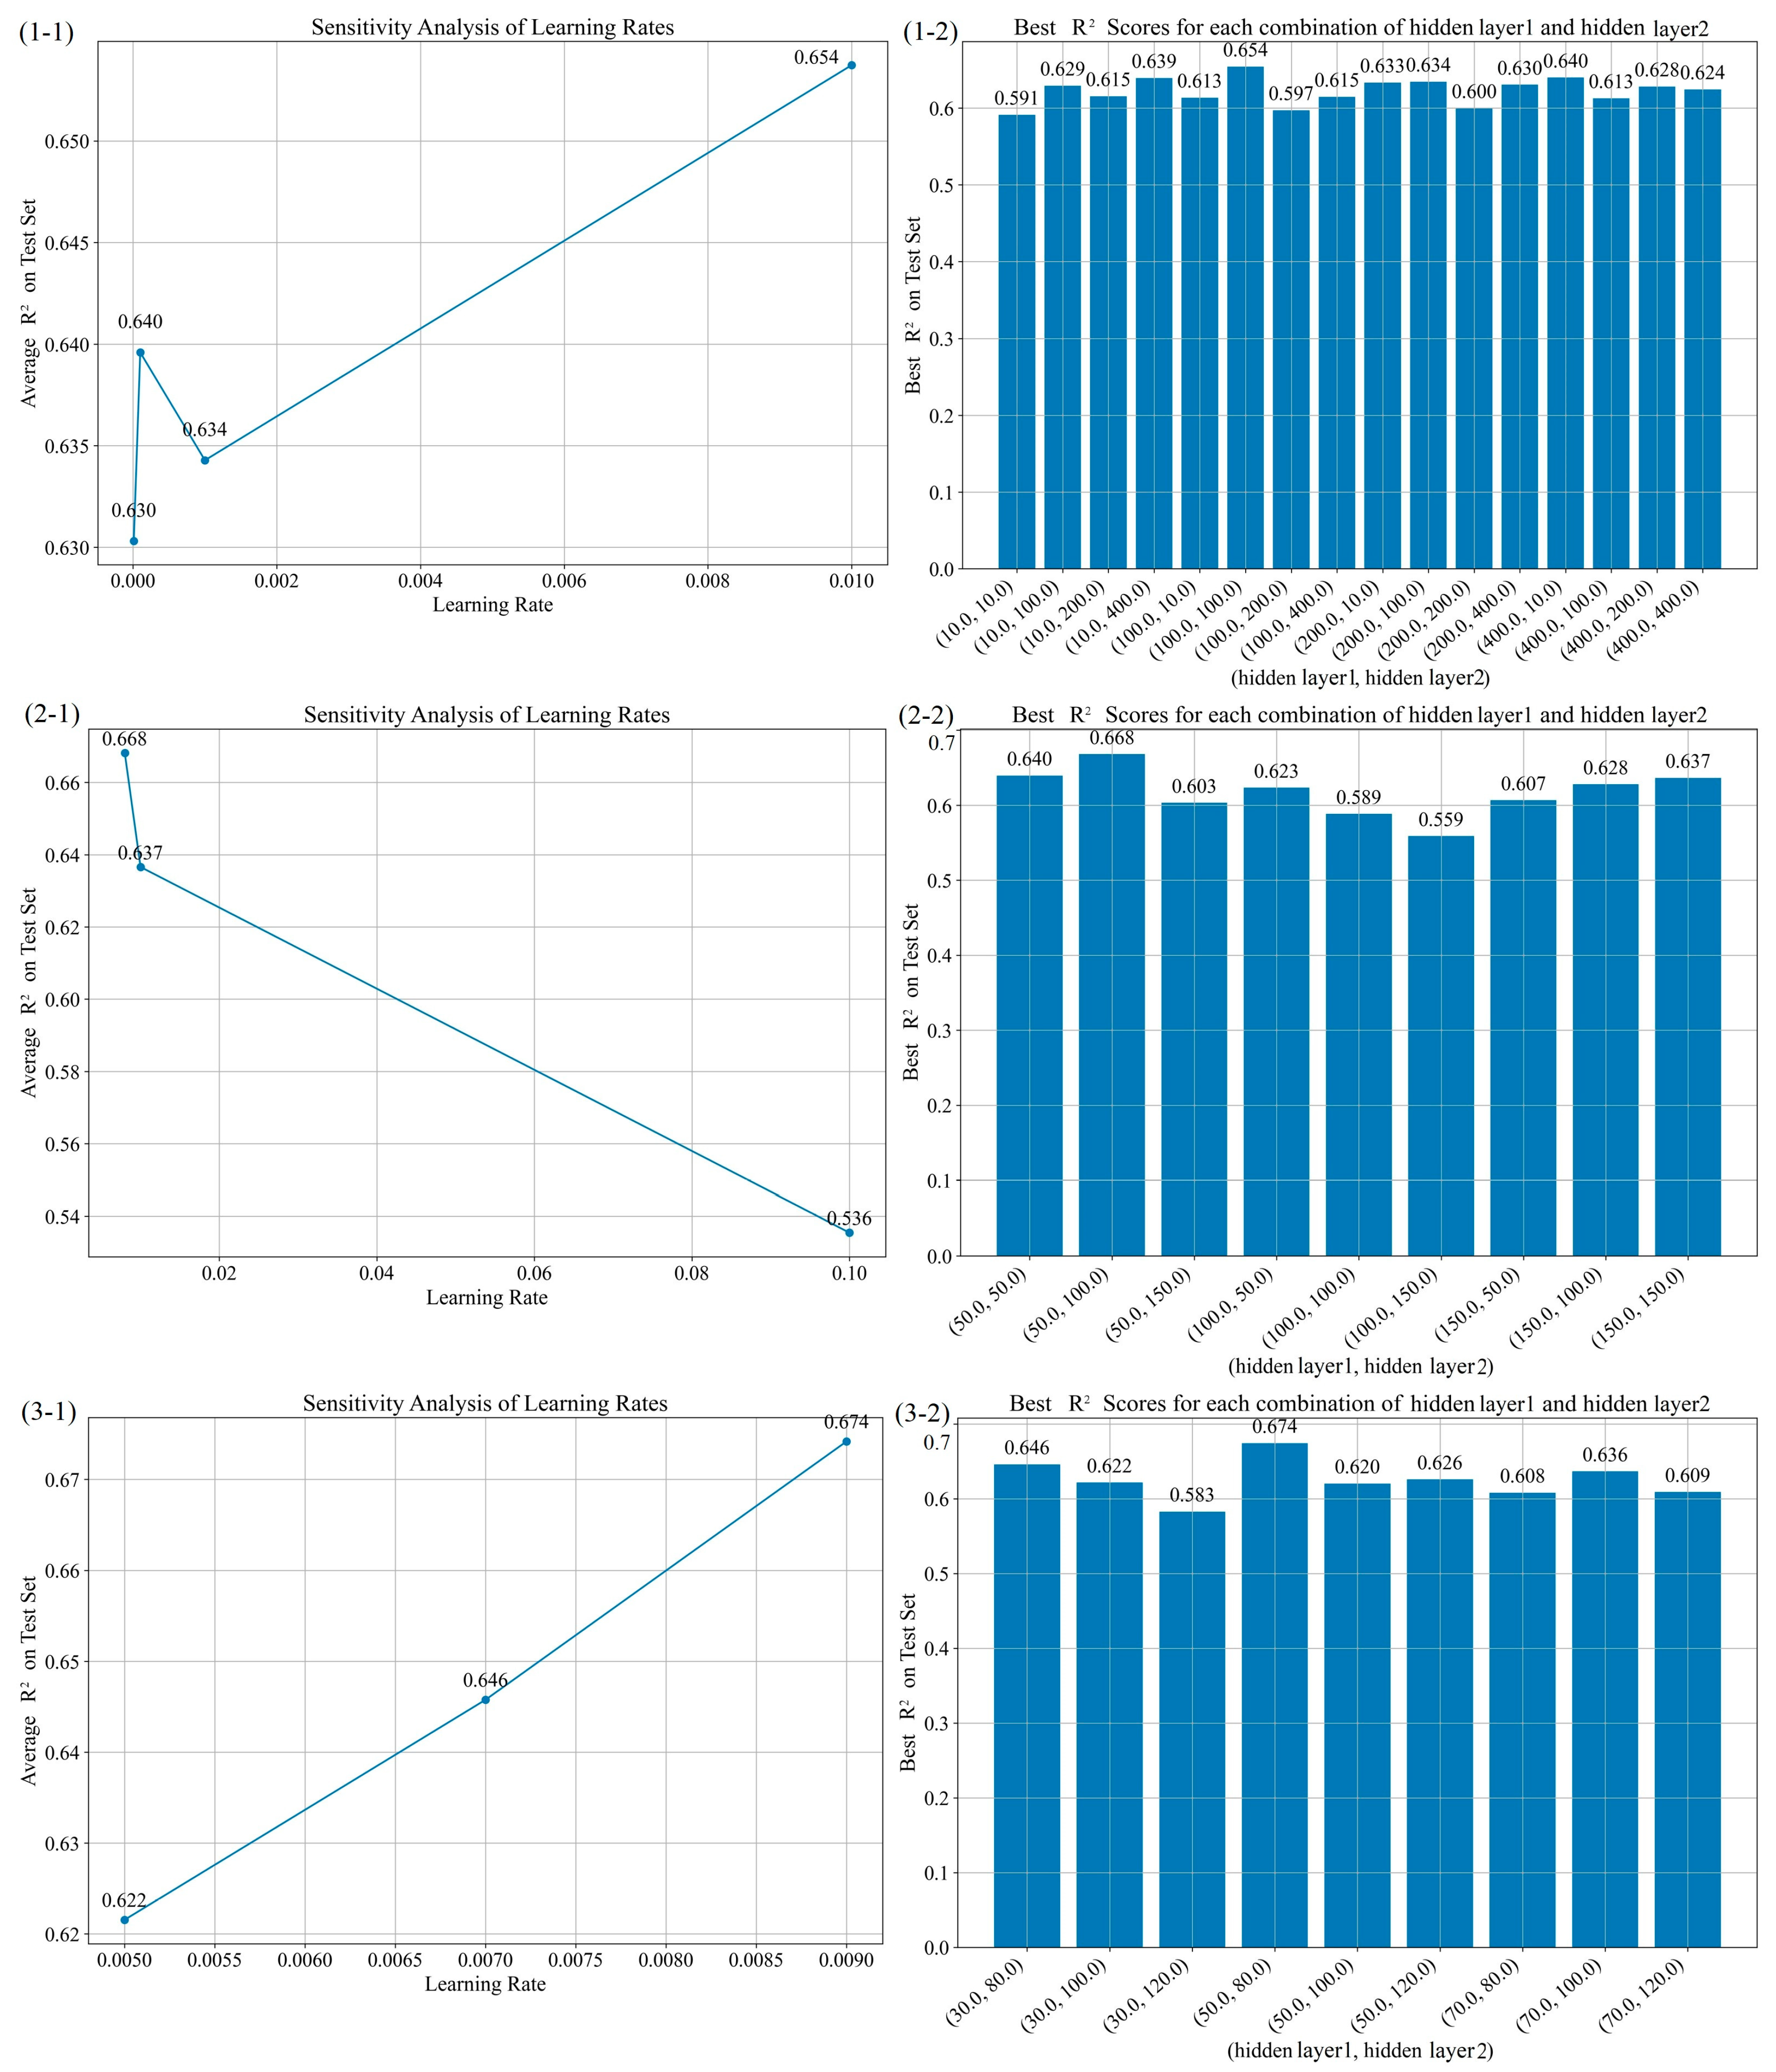
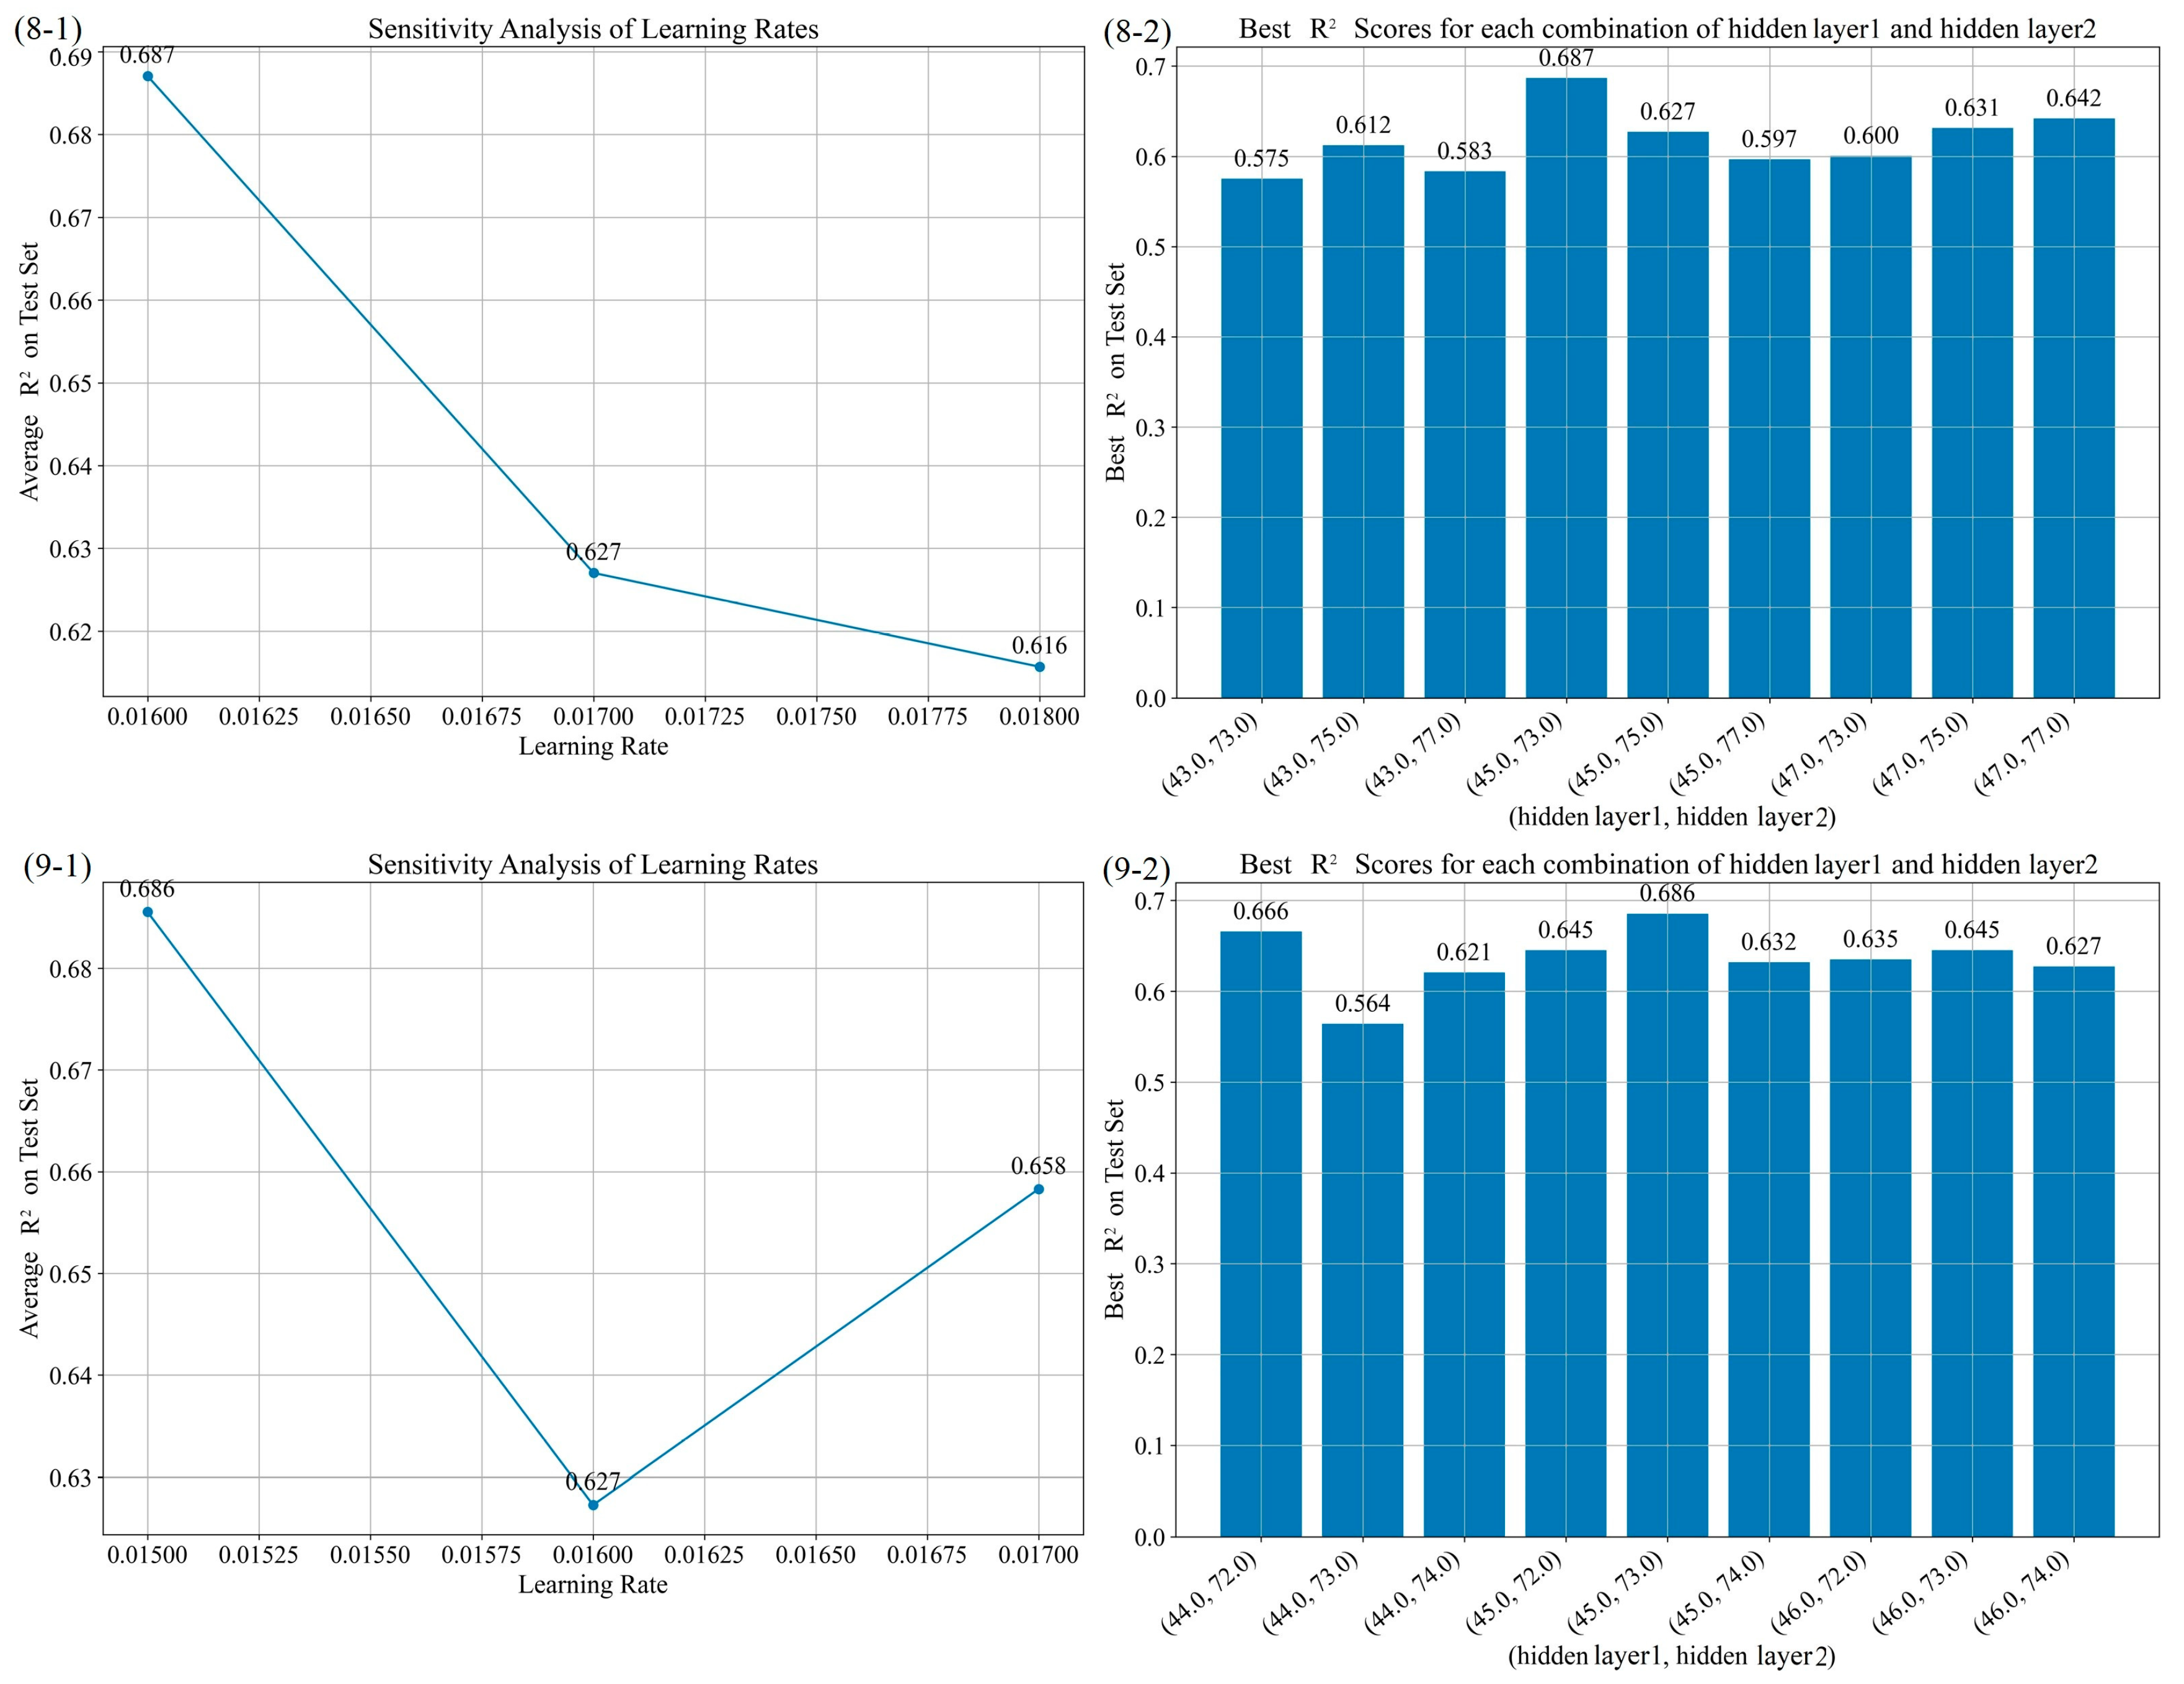
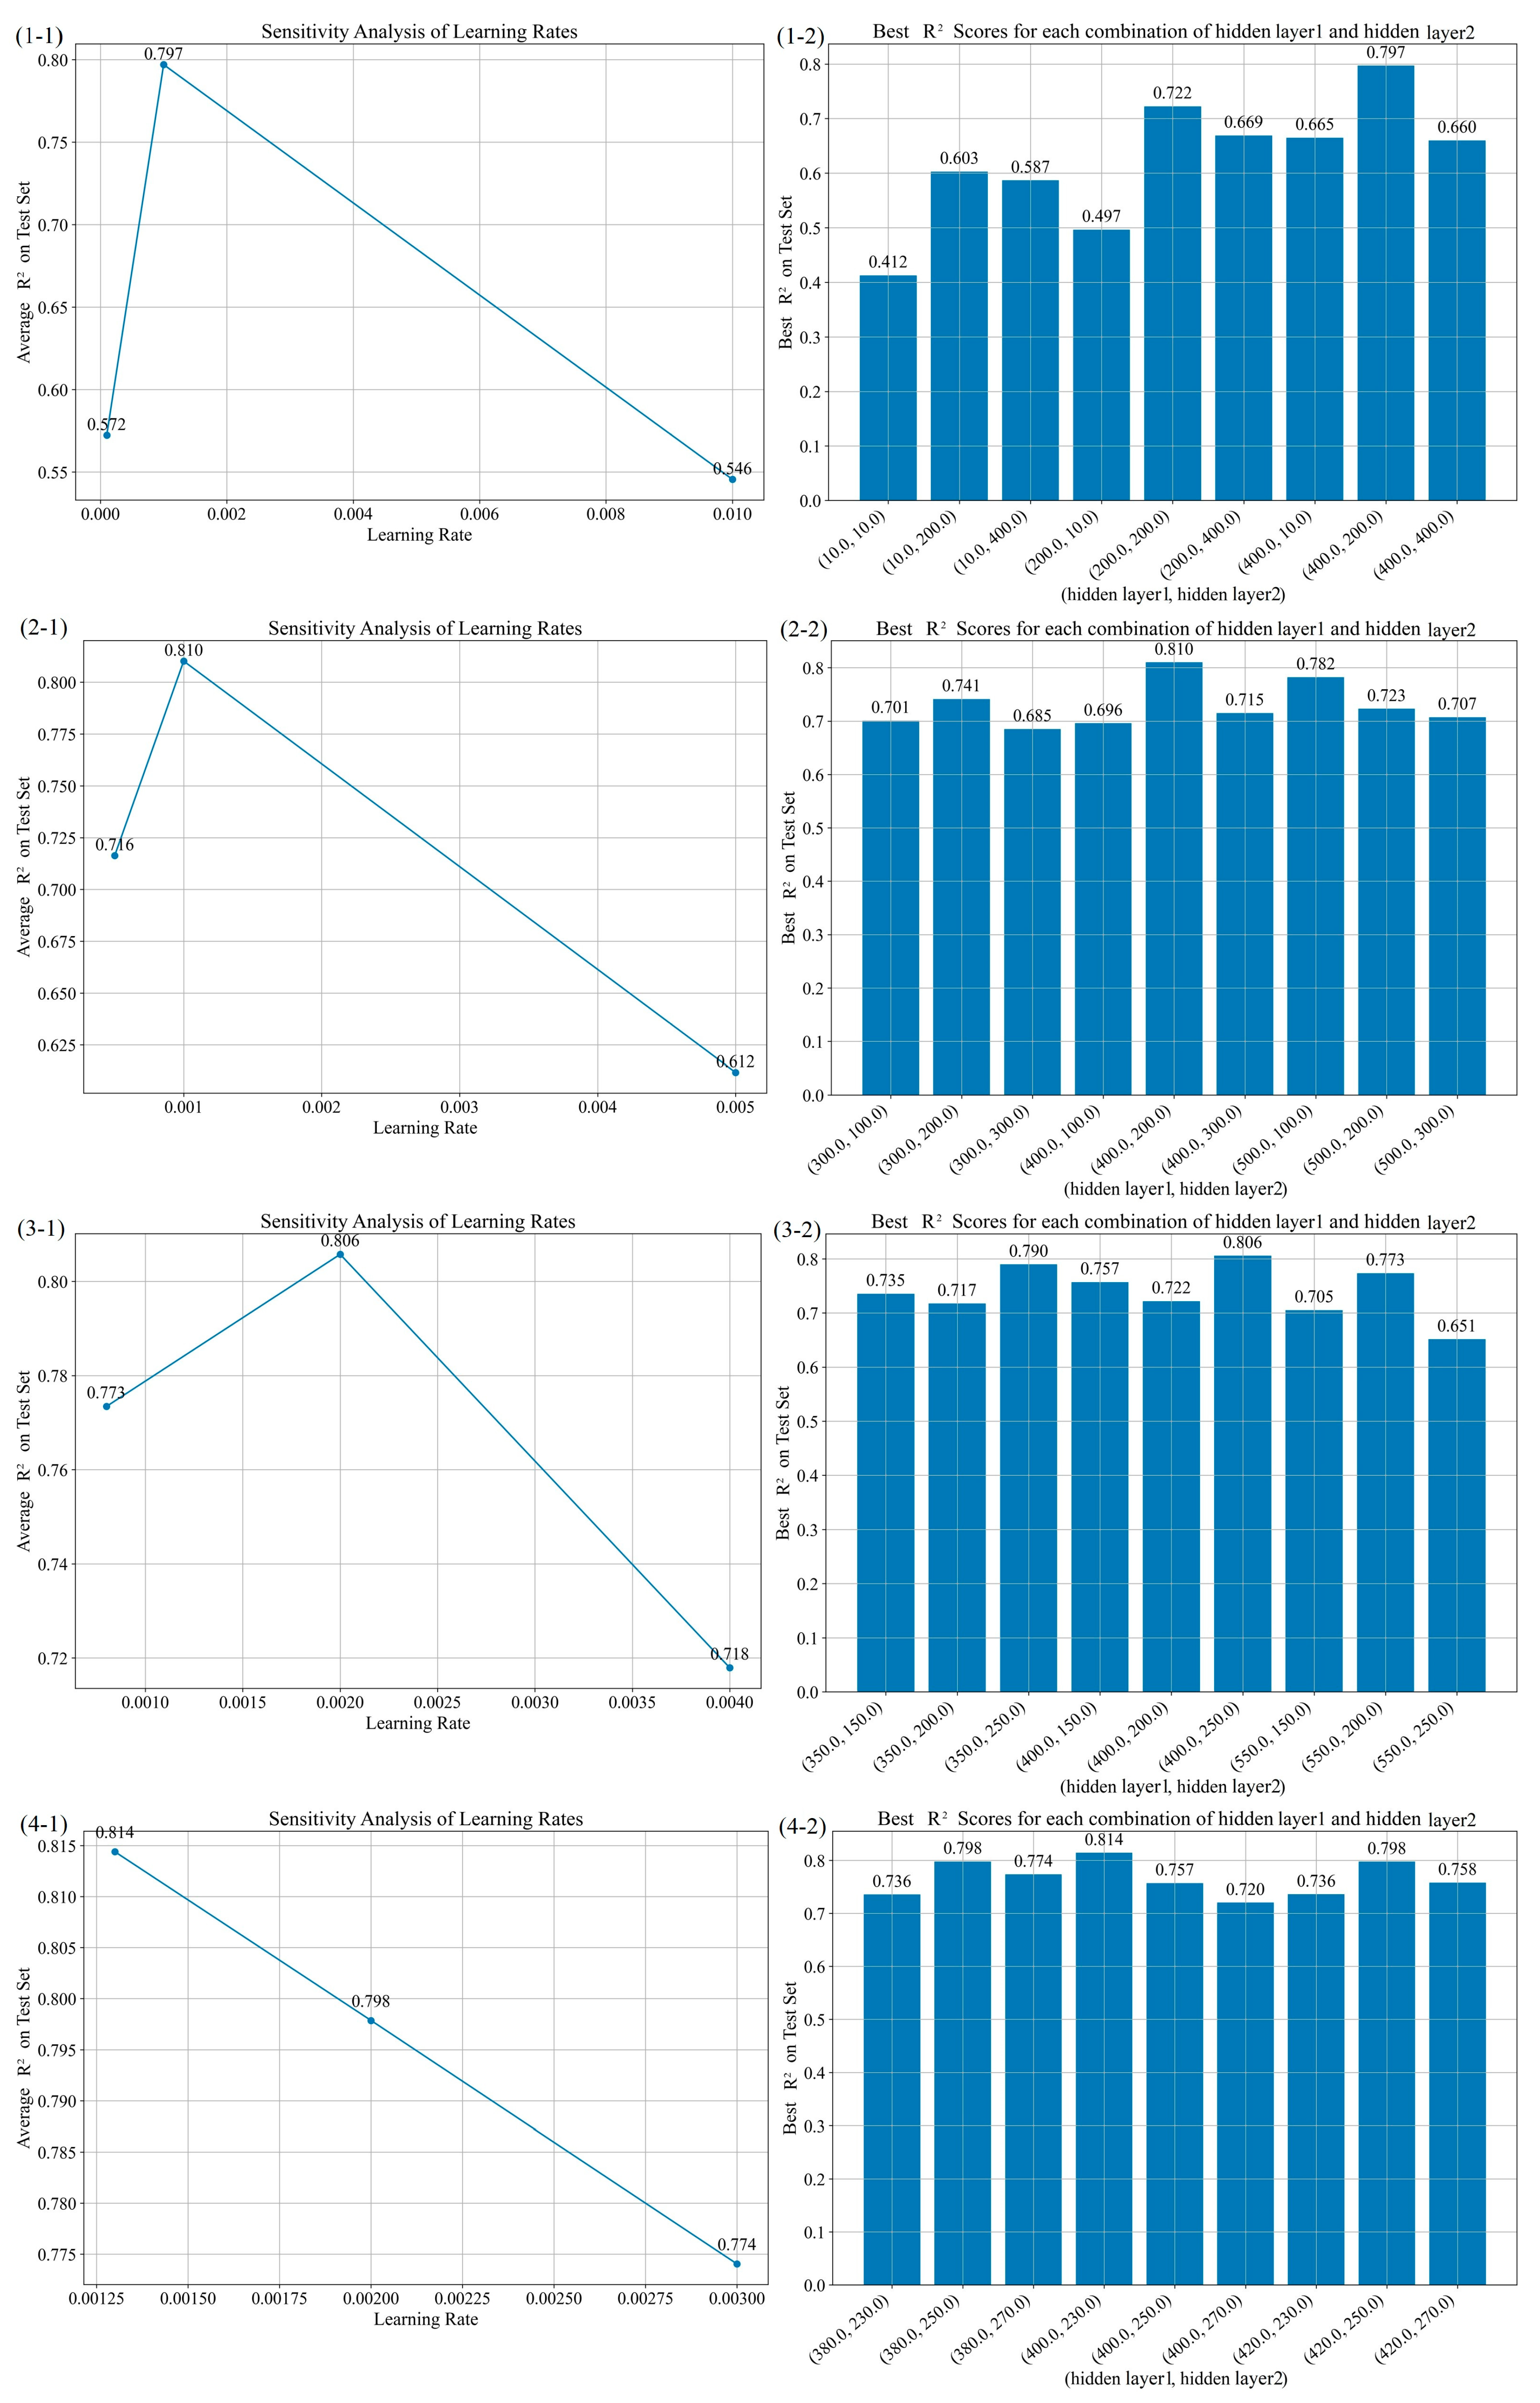
2.7. Hyperparameter Optimization

During the training of an ANN model, hyperparameters significantly influence its performance. Insufficient hidden layers can lead to underfitting, while too many hidden layers can cause overfitting [39]. This study optimized hyperparameters using the grid search method, focusing on learning rate and hidden layer size. To determine the optimal hyperparameter combination, the model’s performance under different combinations was evaluated through experiments. Specifically, multiple ANN models were constructed and trained with various combinations of learning rates and hidden layer sizes. By comparing performance metrics such as R2, RMSE, and MAE on the validation set for each combination, the best-performing hyperparameter combination was selected. This process ensured high accuracy and robustness in predicting SD.

2.8. Evaluation of Data Augmentation Rationality and Model Performance Metrics

(I) Model Performance Evaluation Metrics
Evaluating model performance is crucial, especially when different models produce varying results, requiring the selection of the most suitable one for analysis. This involves using metrics to assess the model’s strengths, weaknesses, and overall applicability. The evaluation focuses on two aspects: predictive ability (accuracy on the training set) and generalization ability (accuracy on the test set). Balancing both is essential for ensuring the model adapts well to new data. Generalization ability is evaluated by comparing test set predictions with actual values. Common metrics include the R2, MAE, and RMSE.
(II) Evaluation of Data Augmentation Rationality
Assessing the rationality of data augmentation is essential for ensuring data integrity and reliability. Statistical methods such as residual analysis, difference tests, and skewness–kurtosis analysis help verify consistency between augmented and original data. Residual analysis evaluates the mean and standard deviation of the residuals, with values close to zero indicating minimal error. The difference test, using T-statistics and p-values, assesses whether the differences between datasets are statistically significant—a p-value above 0.05 confirms no significant difference. Skewness and kurtosis check distribution characteristics, with similar values between the original and augmented data confirming the augmentation’s validity.

3. Results

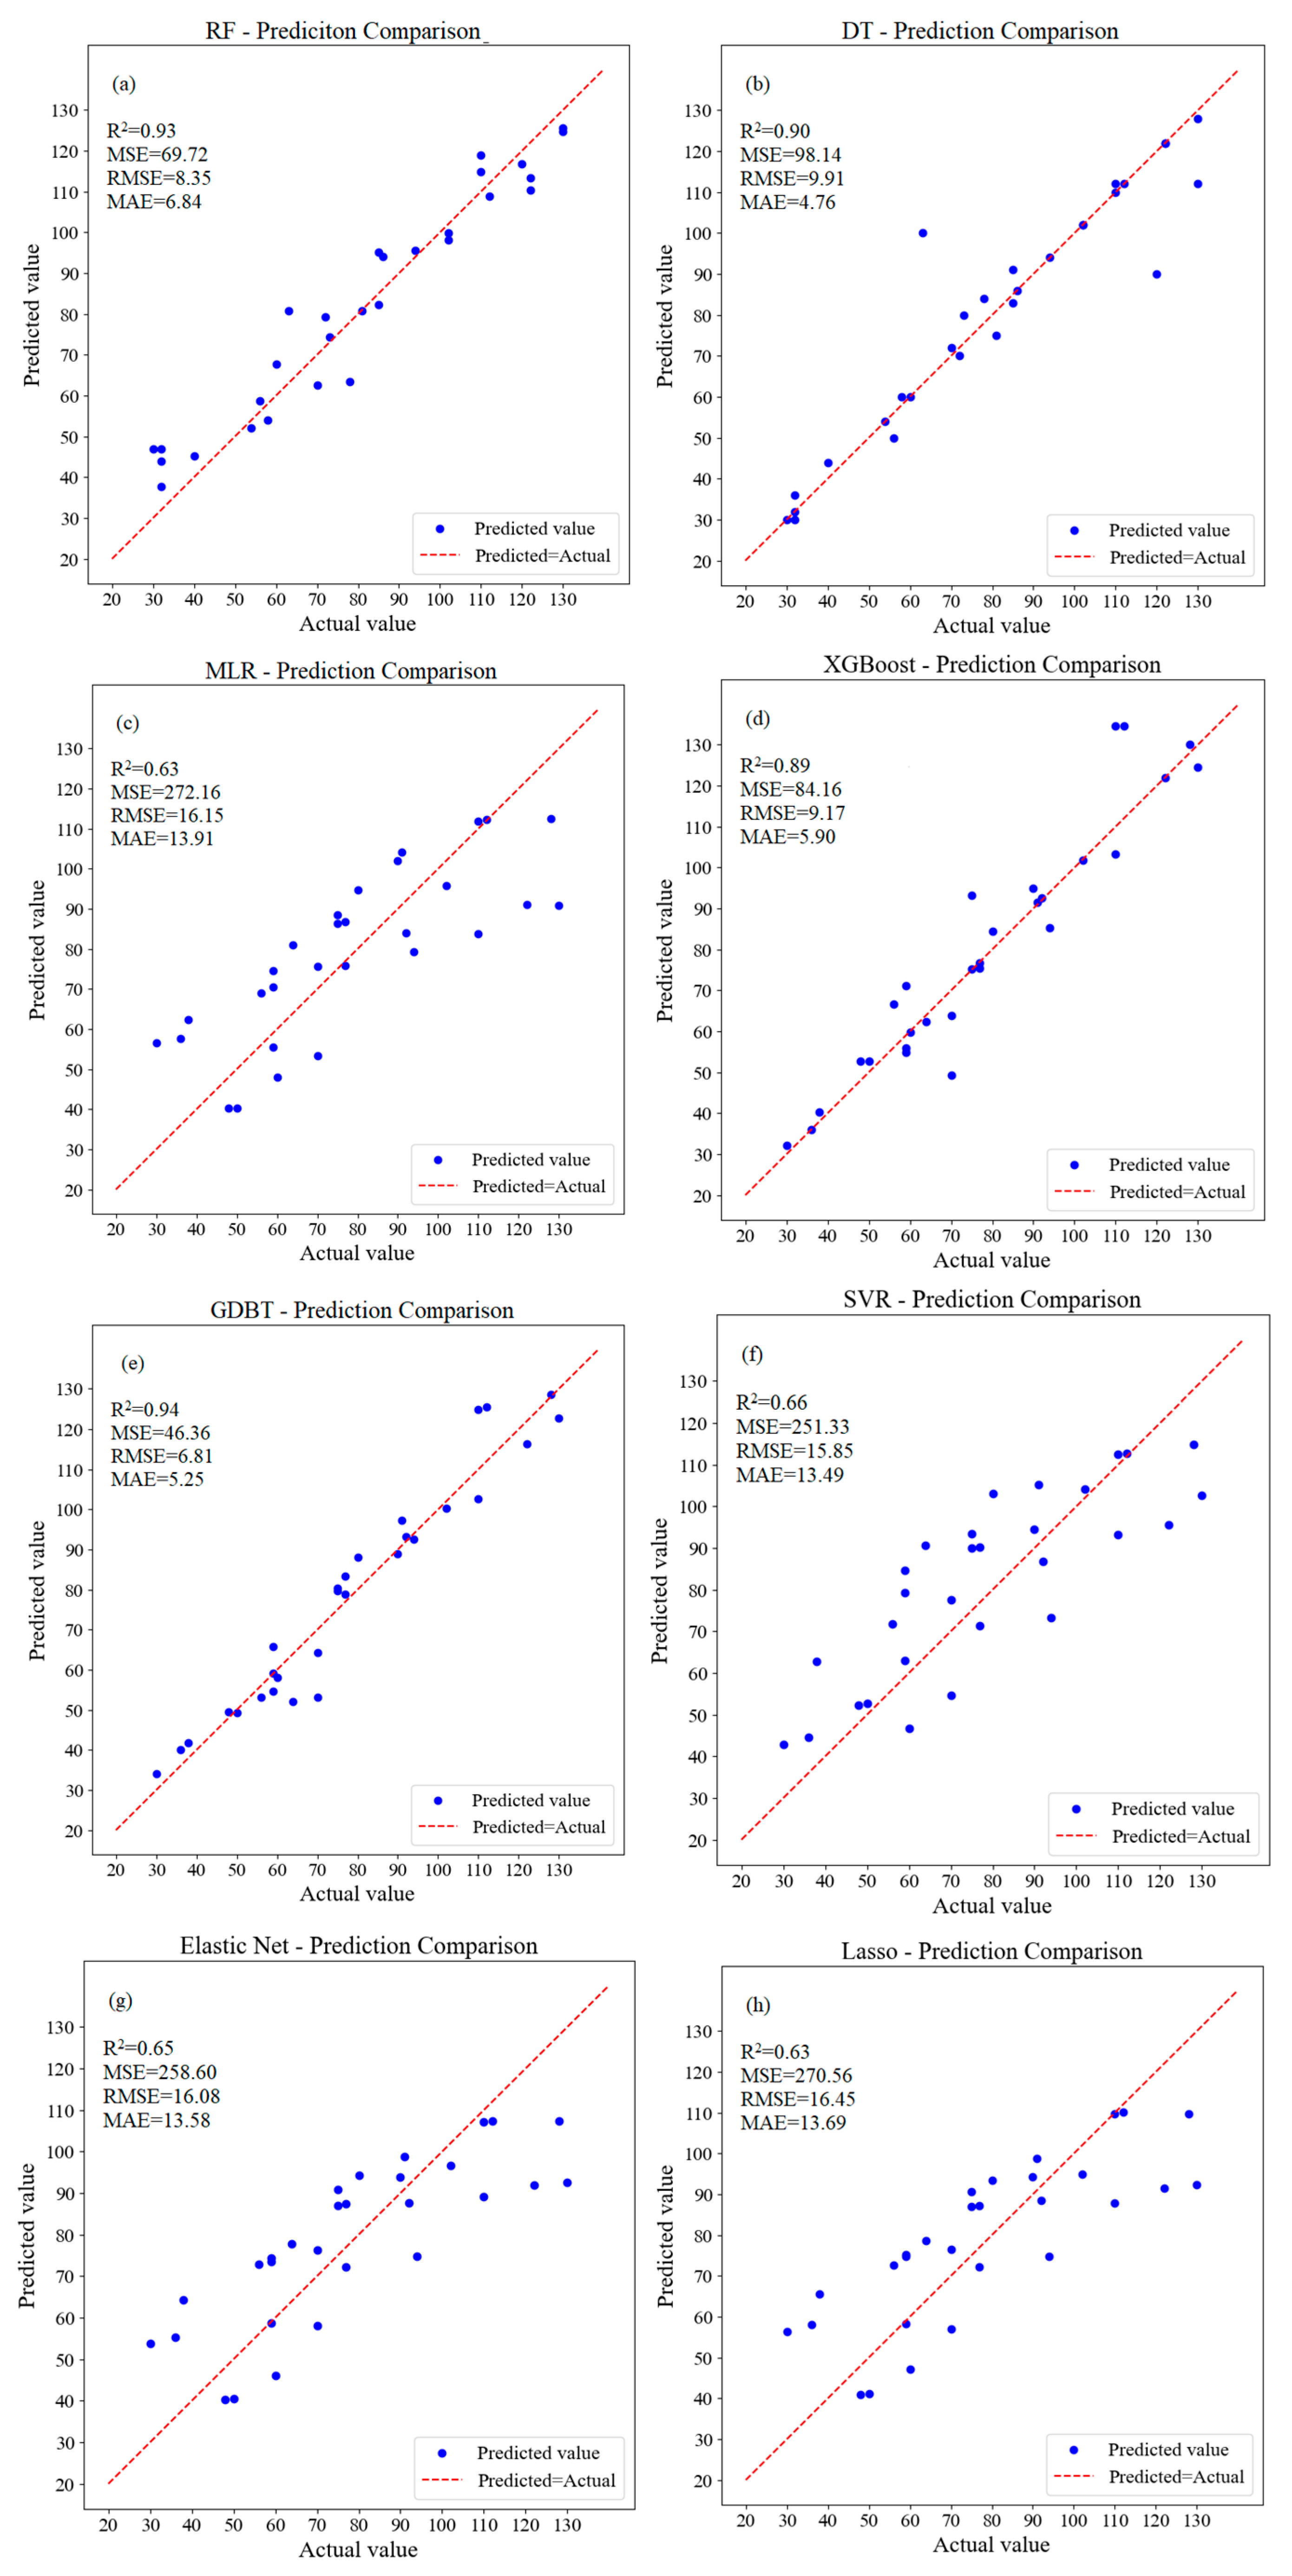
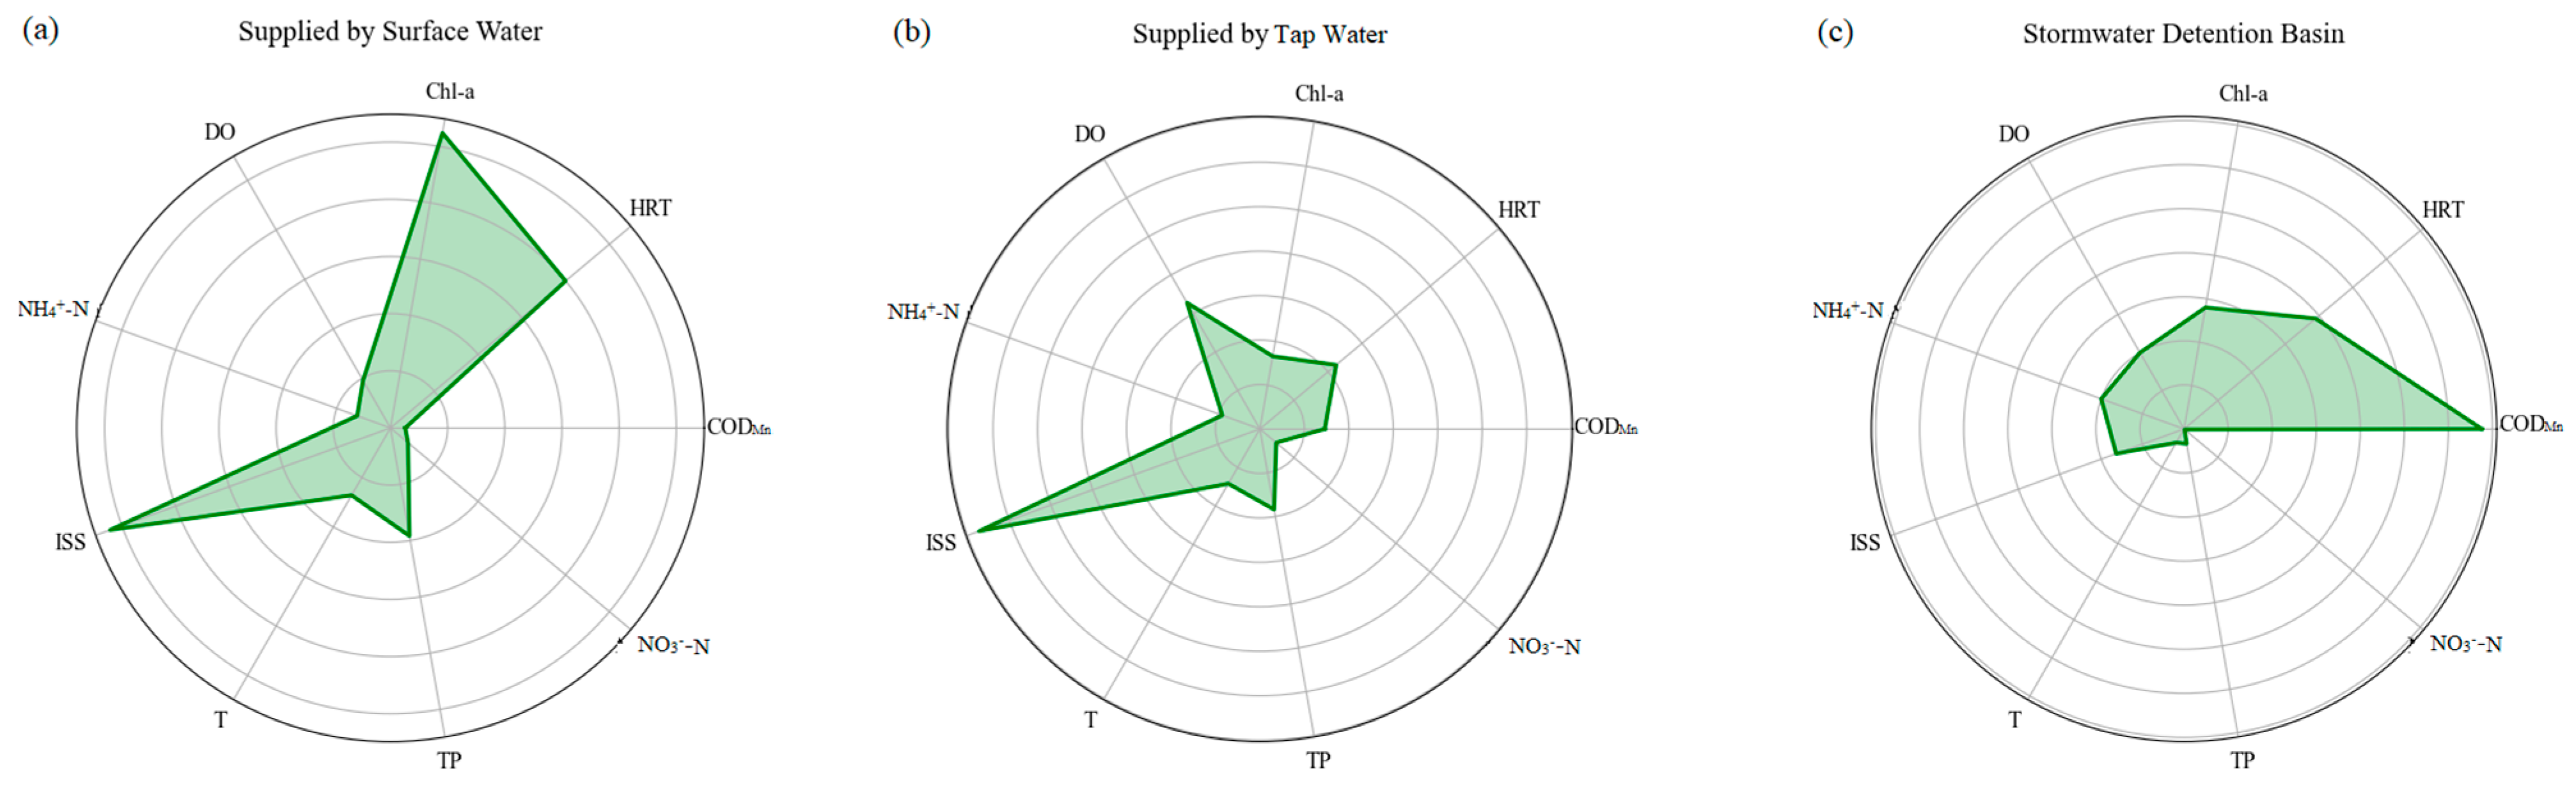
3.1. Machine Learning Analysis of Water Quality Parameters for ULLs with Different Water Supply Sources

This study conducted an in-depth analysis of ULLs with different water supply sources using various machine learning algorithms. The study subjects included water bodies supplemented by surface water (144 data points), water bodies supplemented by tap water (163 data points), and rainwater storage ponds (44 data points). The results are presented through scatter plots, where blue dots represent predicted values, and the red line indicates the match between predicted and actual values. The degree of overlap between the blue dots and the red line visually demonstrates the model’s predictive accuracy; the greater the overlap, the better the predictive performance.

3.1.1. Machine Learning Prediction of Water Quality Parameters for ULLs Supplemented by Surface Water

The test set results for using machine learning to predict the water quality parameters of ULLs supplemented by surface water are shown in Figure 4. The analysis reveals that the predicted values closely match the actual values for most samples, demonstrating the machine learning models’ accurate predictive capability in assessing the importance of various water quality parameters on water SD. Notably, the GBDT model outperformed others across all metrics (R2 = 0.94, MSE = 46.36, RMSE = 6.81, MAE = 5.25). Consequently, the GBDT model was selected to calculate the importance of water quality factors based on water SD for water bodies supplemented by surface water. The specific results of this calculation are shown in Figure 5.
The GBDT model results for water quality factors in water bodies supplemented by surface water are presented in Figure 5. The analysis indicates that the primary factors influencing water SD in ULLs are Chl-a, ISS, and HRT, with importance values of 26.2%, 26.1%, and 20.1%, respectively. These parameters are essential for maintaining SD and serve as central indicators in water quality assessment.
In conclusion, Chl-a, ISS, and HRT are the most significant factors influencing water SD in ULLs supplemented by surface water, while other parameters, with an importance of less than 10%, play a comparatively minor role in the model.

3.1.2. Machine Learning Prediction of Water Quality Parameters for ULLs Supplemented by Tap Water

The test set results for using machine learning algorithms to predict the water quality parameters of ULLs primarily supplemented by tap water are shown in Figure 6. According to the prediction results, the GBDT model outperforms other models across various performance metrics, with R2 (0.93), MSE (39.71), RMSE (6.30), and MAE (4.00). Therefore, the GBDT model was selected to evaluate the importance of various water quality factors in water bodies supplemented by tap water, using water SD as the indicator. The ranking of these factors is presented in Figure 7.
Figure 6 presents the GBDT model results for water bodies supplemented by tap water, highlighting ISS as the most influential factor on SD, contributing 36.6% to the total impact. Adequate DO levels and effective water renewal rates are also essential for stable water quality.
Among Taiyuan’s ULLs, those supplemented by tap water are typically smaller and have limited self-purification capacity. While they tend to have higher Chl-a content compared to surface water-supplemented lakes, the primary factors influencing SD remain ISS, followed by DO and HRT. This is likely because tap water itself has low Chl-a, with most Chl-a in these lakes originating from sediment.

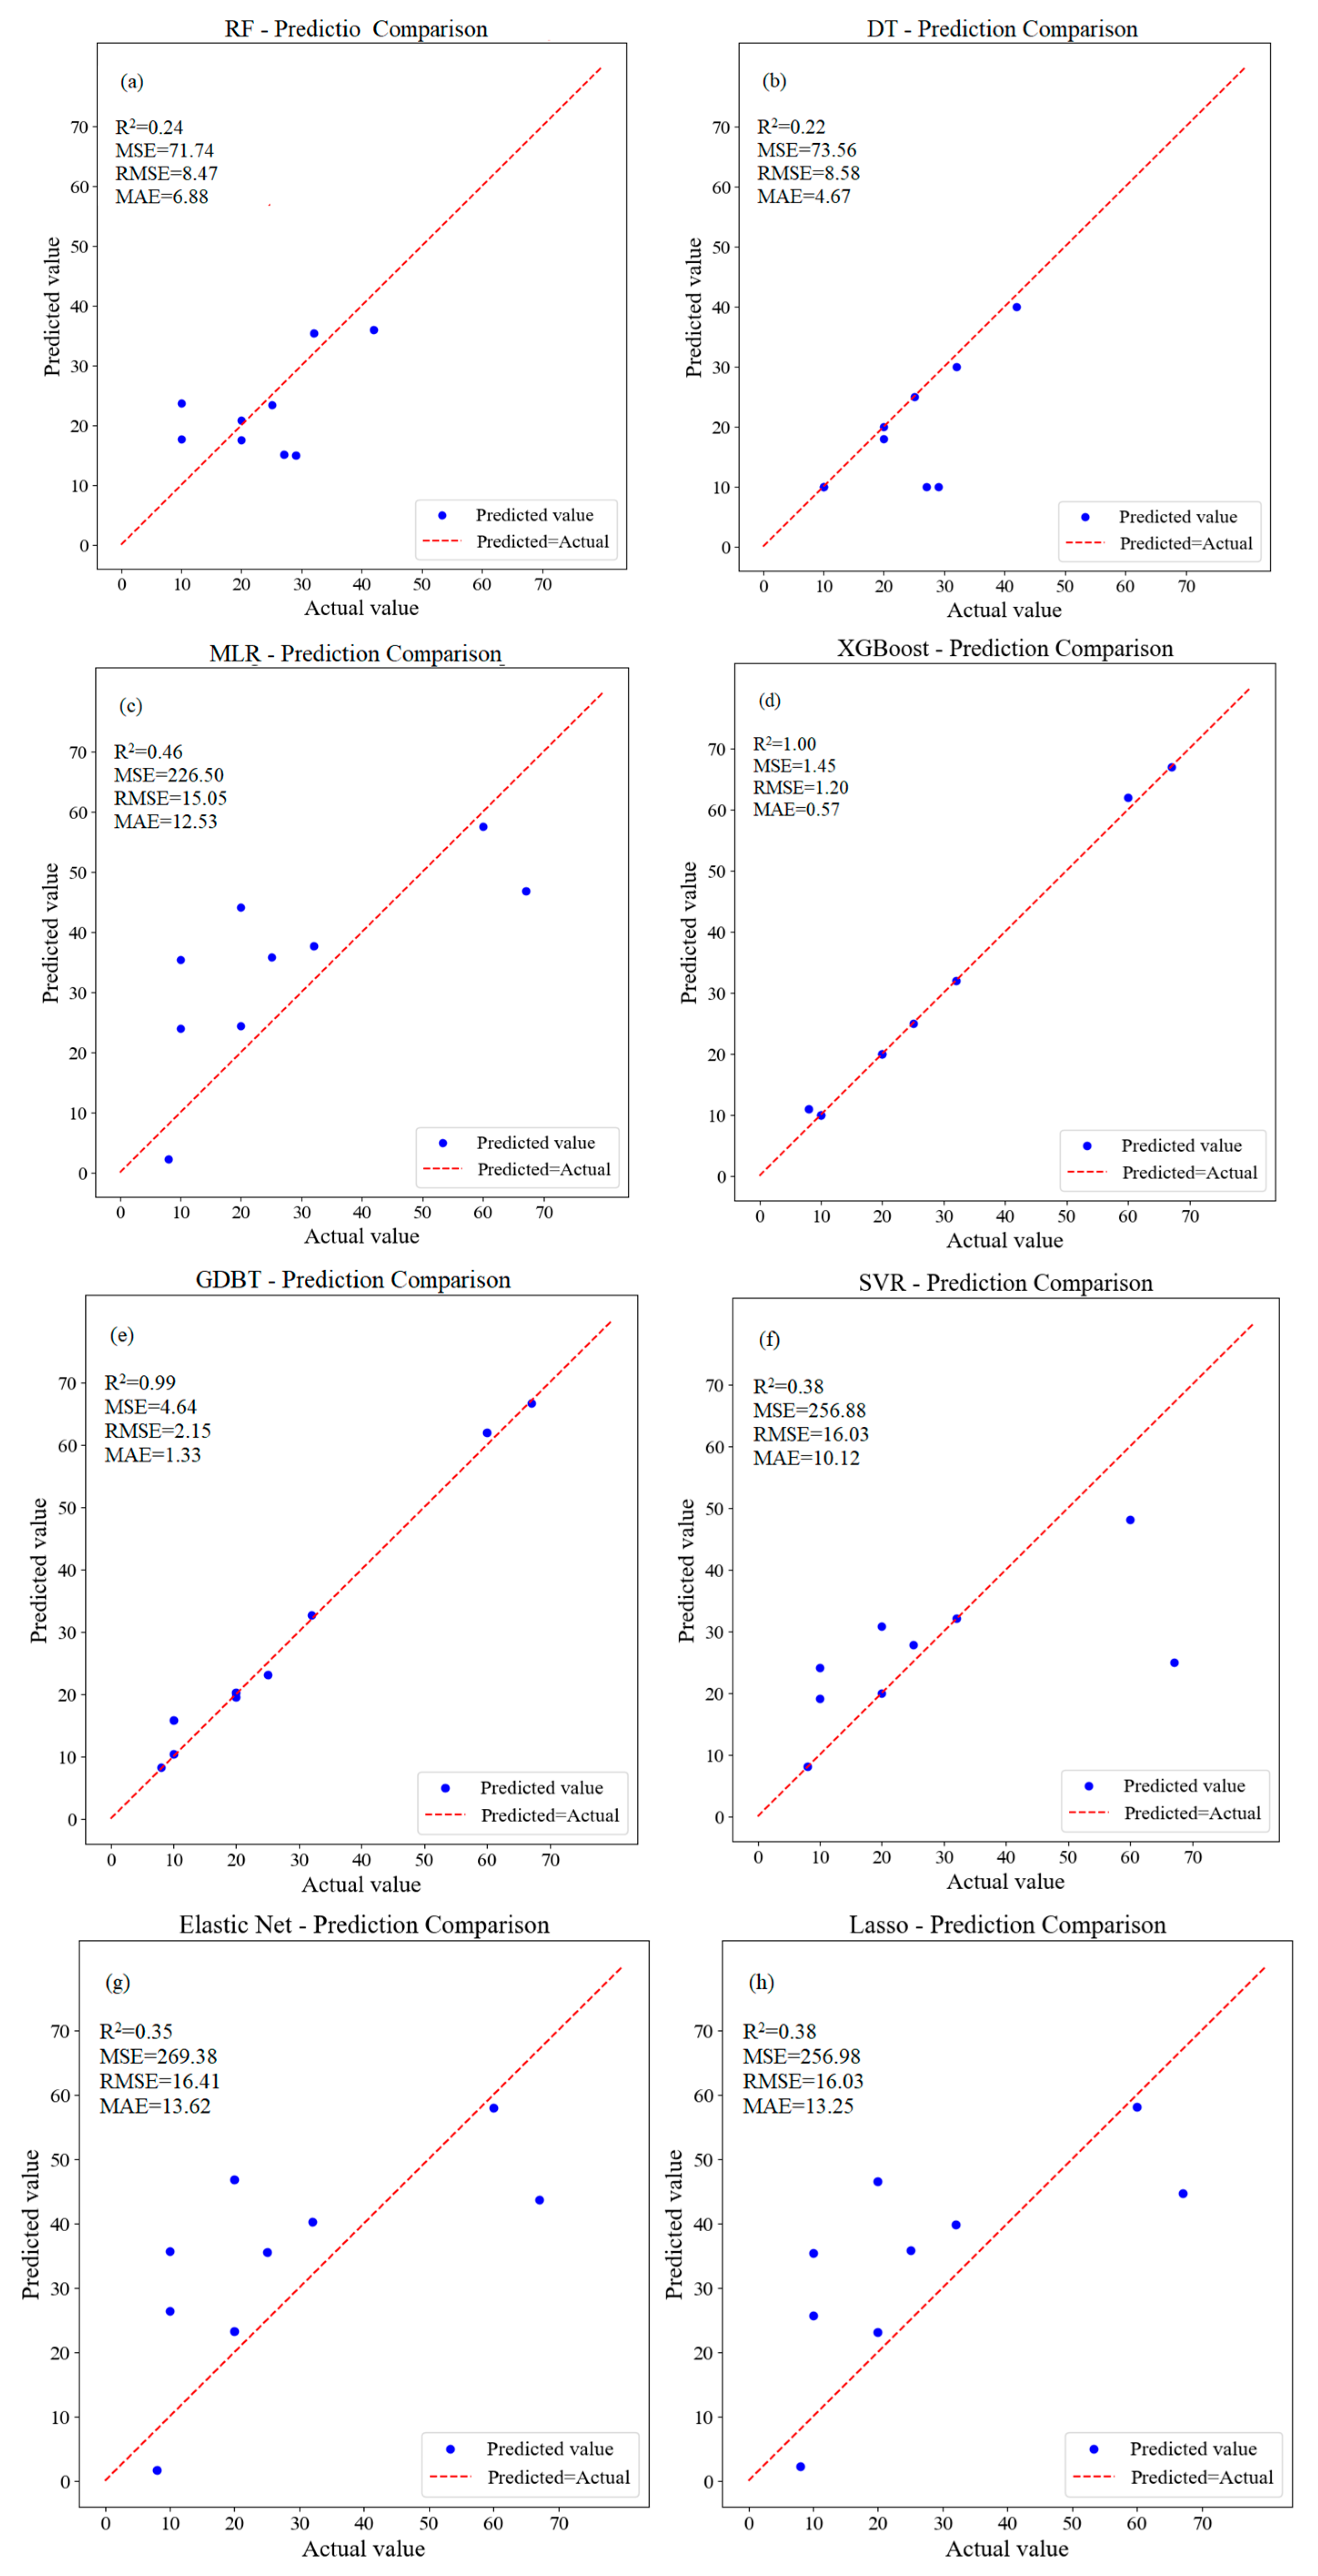
3.1.3. Prediction of Water Quality Parameters in Rainwater Storage Ponds Using Machine Learning

Figure 8 shows the performance of the test set for artificial ULLs with urban stormwater storage functions using a machine learning algorithm. The results show that the XGBOOST model outperformed the other models in the key performance indexes of R2 (1.00), MSE (1.45), RMSE (1.20), and MAE (0.57). Therefore, the XGBOOST model was used to analyze the importance of water quality factors based on the SD of the artificial ULLs with a rainwater storage tank function, and the importance rank of water quality parameters was obtained, as shown in Figure 9.
Figure 9 presents the XGBoost model results for water quality factors in ULLs with rainwater retention functions. The analysis identifies CODMn as the primary factor affecting water SD, with Chl-a and DO also playing significant roles. Nitrogen pollution is noted as a potential threat to water quality [40].

3.2. SD Fitting Analysis of Water Quality Parameters Based on ANN

This study identified the optimal hyperparameter combination through experimentation and assessed the model’s performance on both the training and validation sets. The best parameter combination was applied to the ANN model. The model’s predictive results were visually represented using 3D fitting surface plots and 2D SD contour maps, further validating the potential of the ANN model in water quality management.

3.2.1. Selection of Input Parameters

In Section 3.1, machine learning algorithms were employed to assess the influence of various water quality parameters on SD across different water sources, as illustrated in Figure 10. For ULLs supplemented by surface water, Chl-a, ISS, and HRT emerged as the primary factors. TSS, which captures the combined effects of ISS and Chl-a with stable and reliable measurements, was chosen along with HRT as a key fitting variable for further analysis. In water bodies supplemented by tap water, ISS, DO, HRT, TP, and Chl-a were identified as significant factors, with TSS contributing 41.9% to overall importance as a marker for suspended particle concentration, while HRT represents water renewal rates. For water bodies functioning as rainwater retention basins, CODMn and HRT were the most influential parameters and were thus selected for in-depth analysis.

3.2.2. Data Augmentation

Given the limited data for water bodies with rainwater storage functions, data augmentation was applied to improve the stability and accuracy of the ANN model for SD fitting. Validation results, shown in Table 1, confirm consistency between the augmented and original data through residual analysis, with no errors introduced. The difference test indicated no significant variation, and skewness and kurtosis analyses showed that data distribution remained stable. Overall, the augmentation process was validated as reliable.

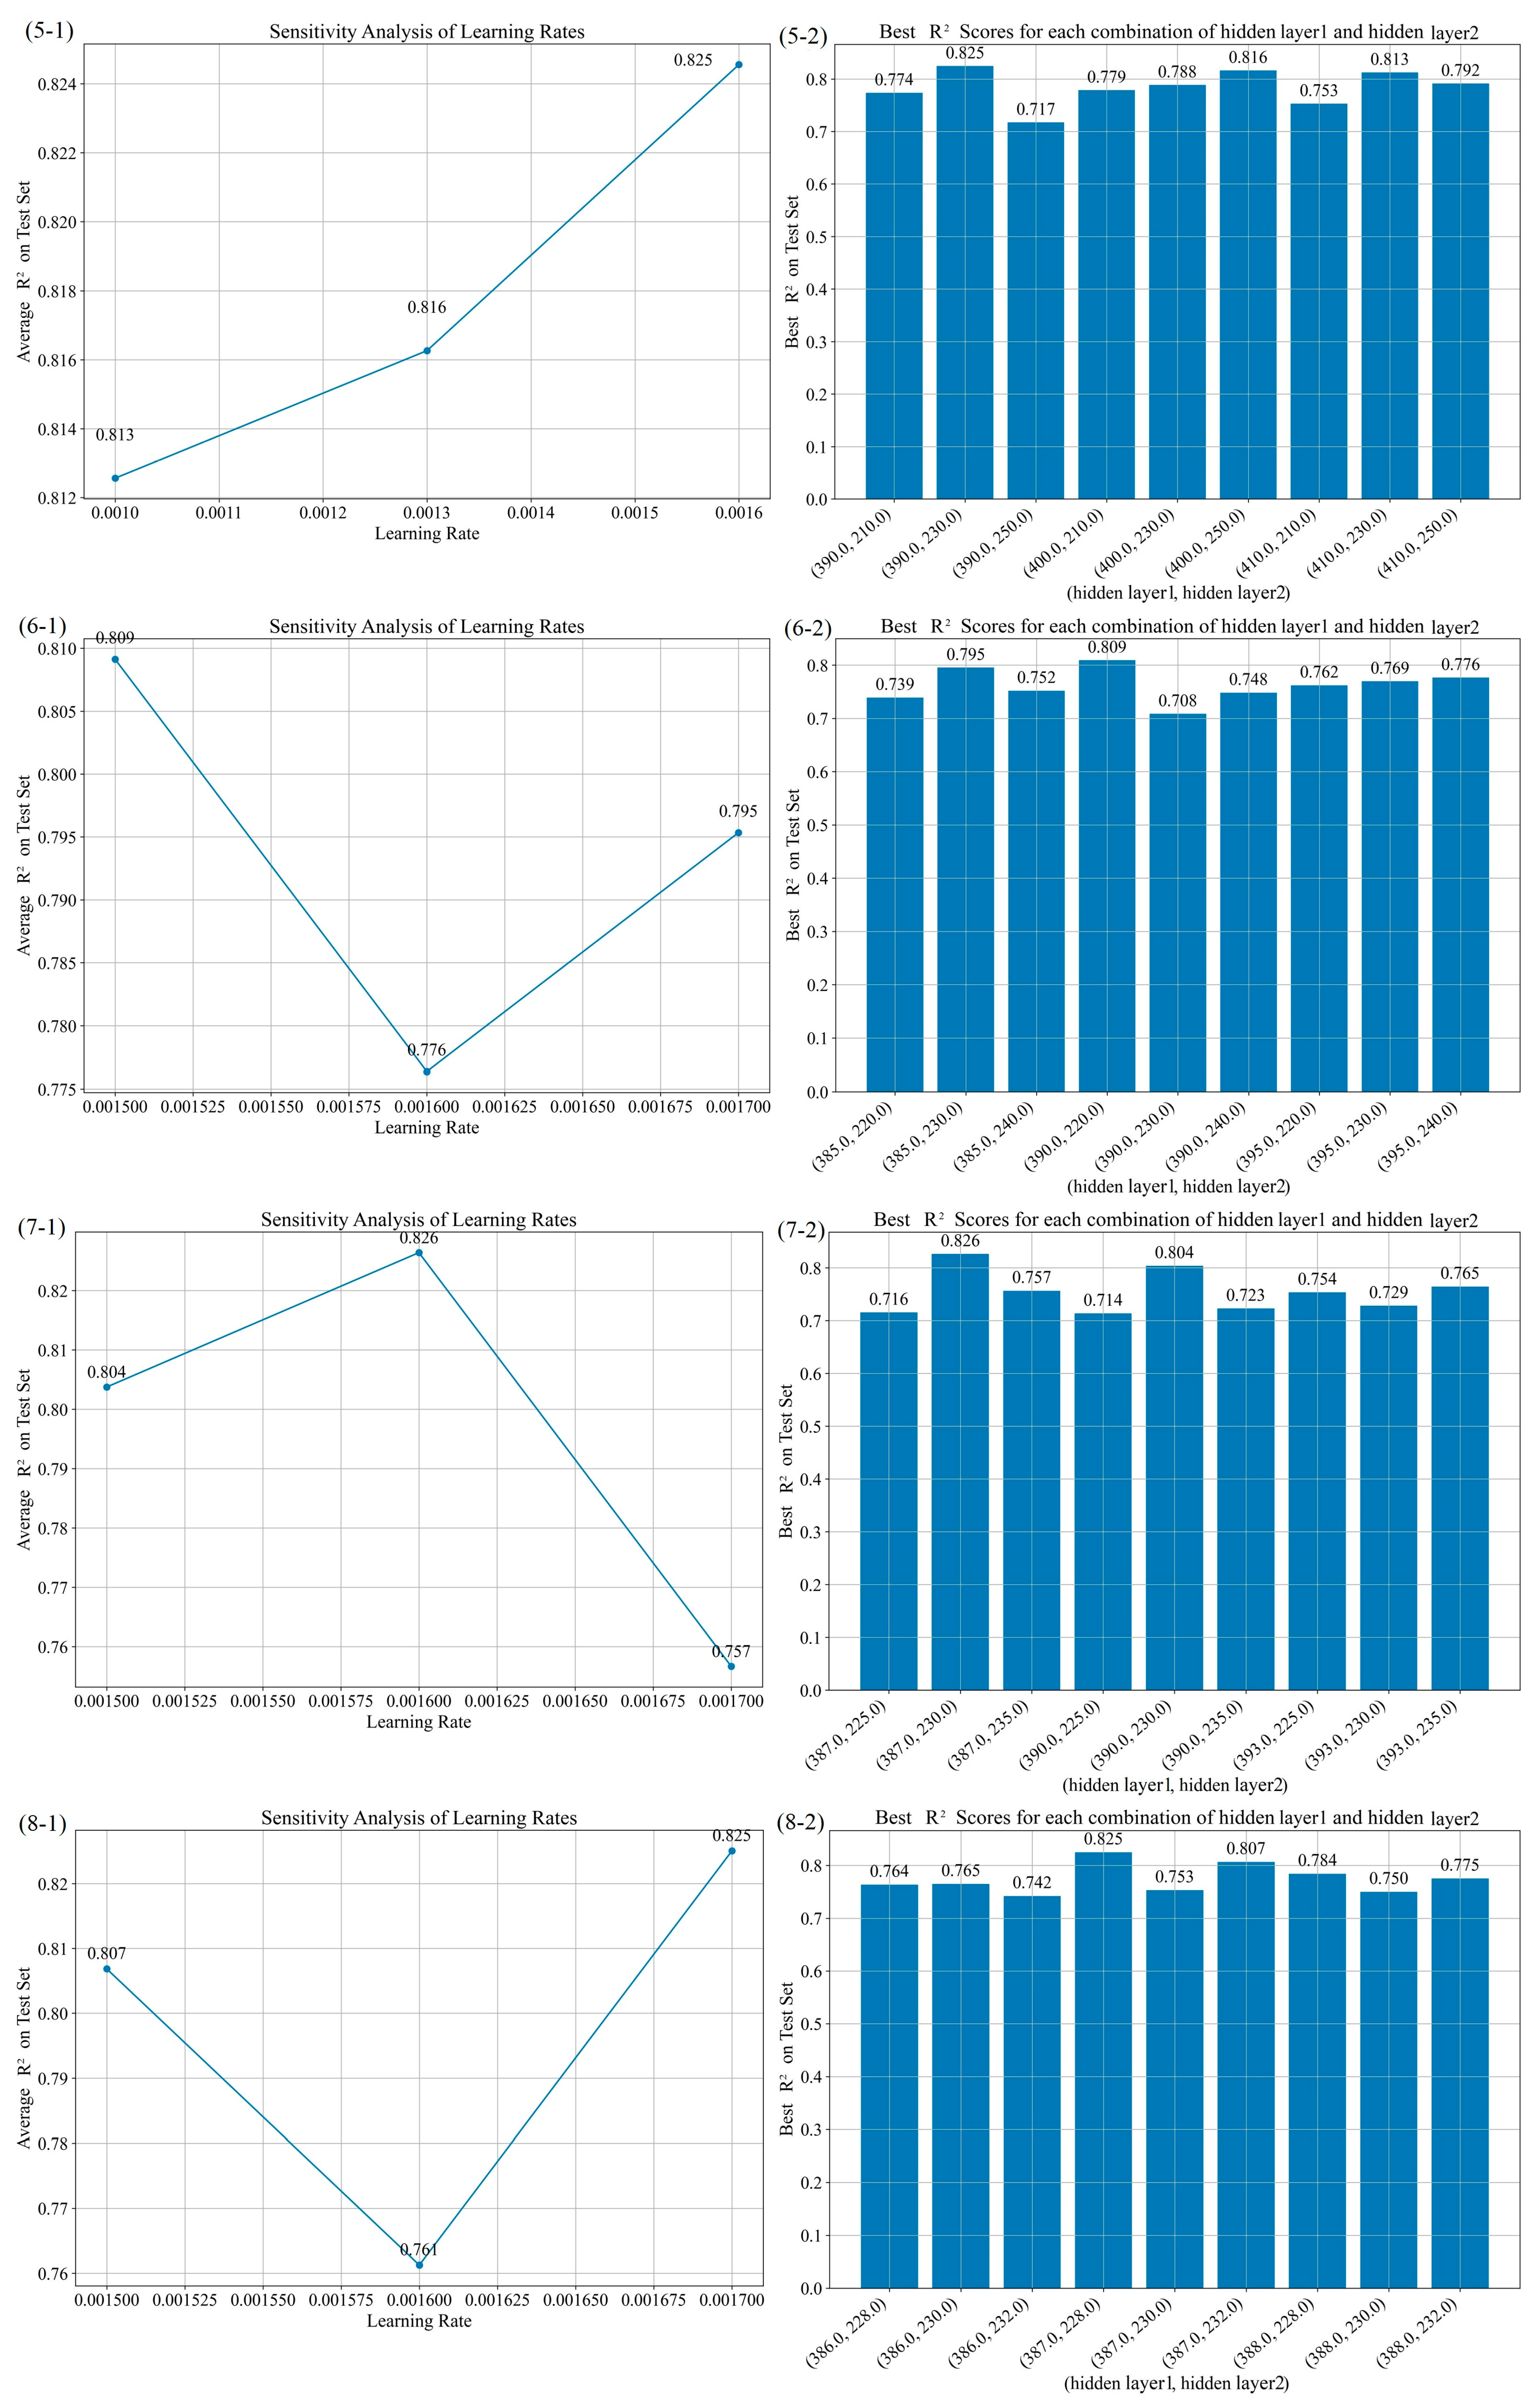
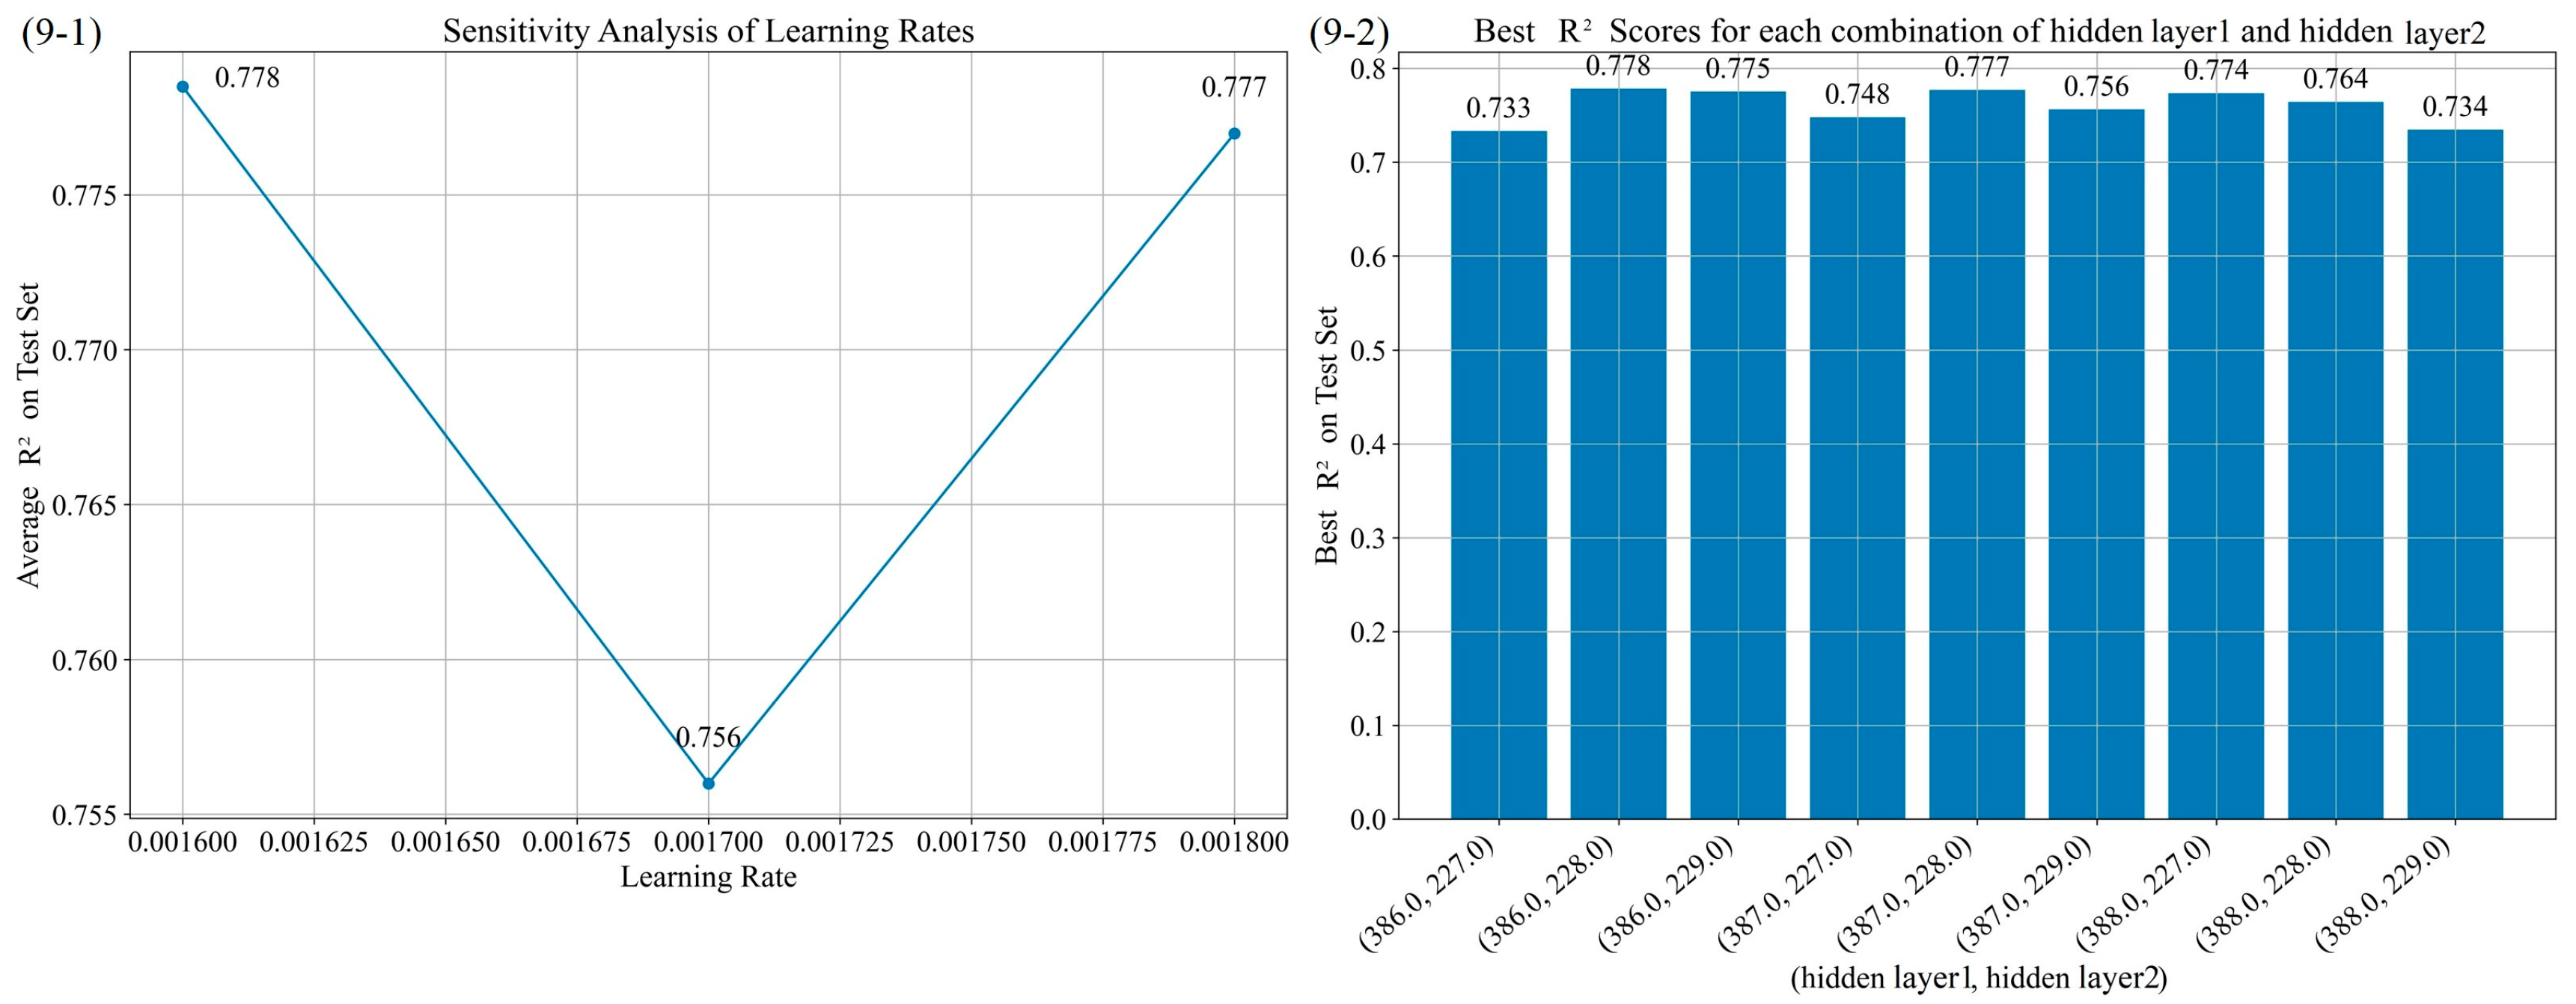
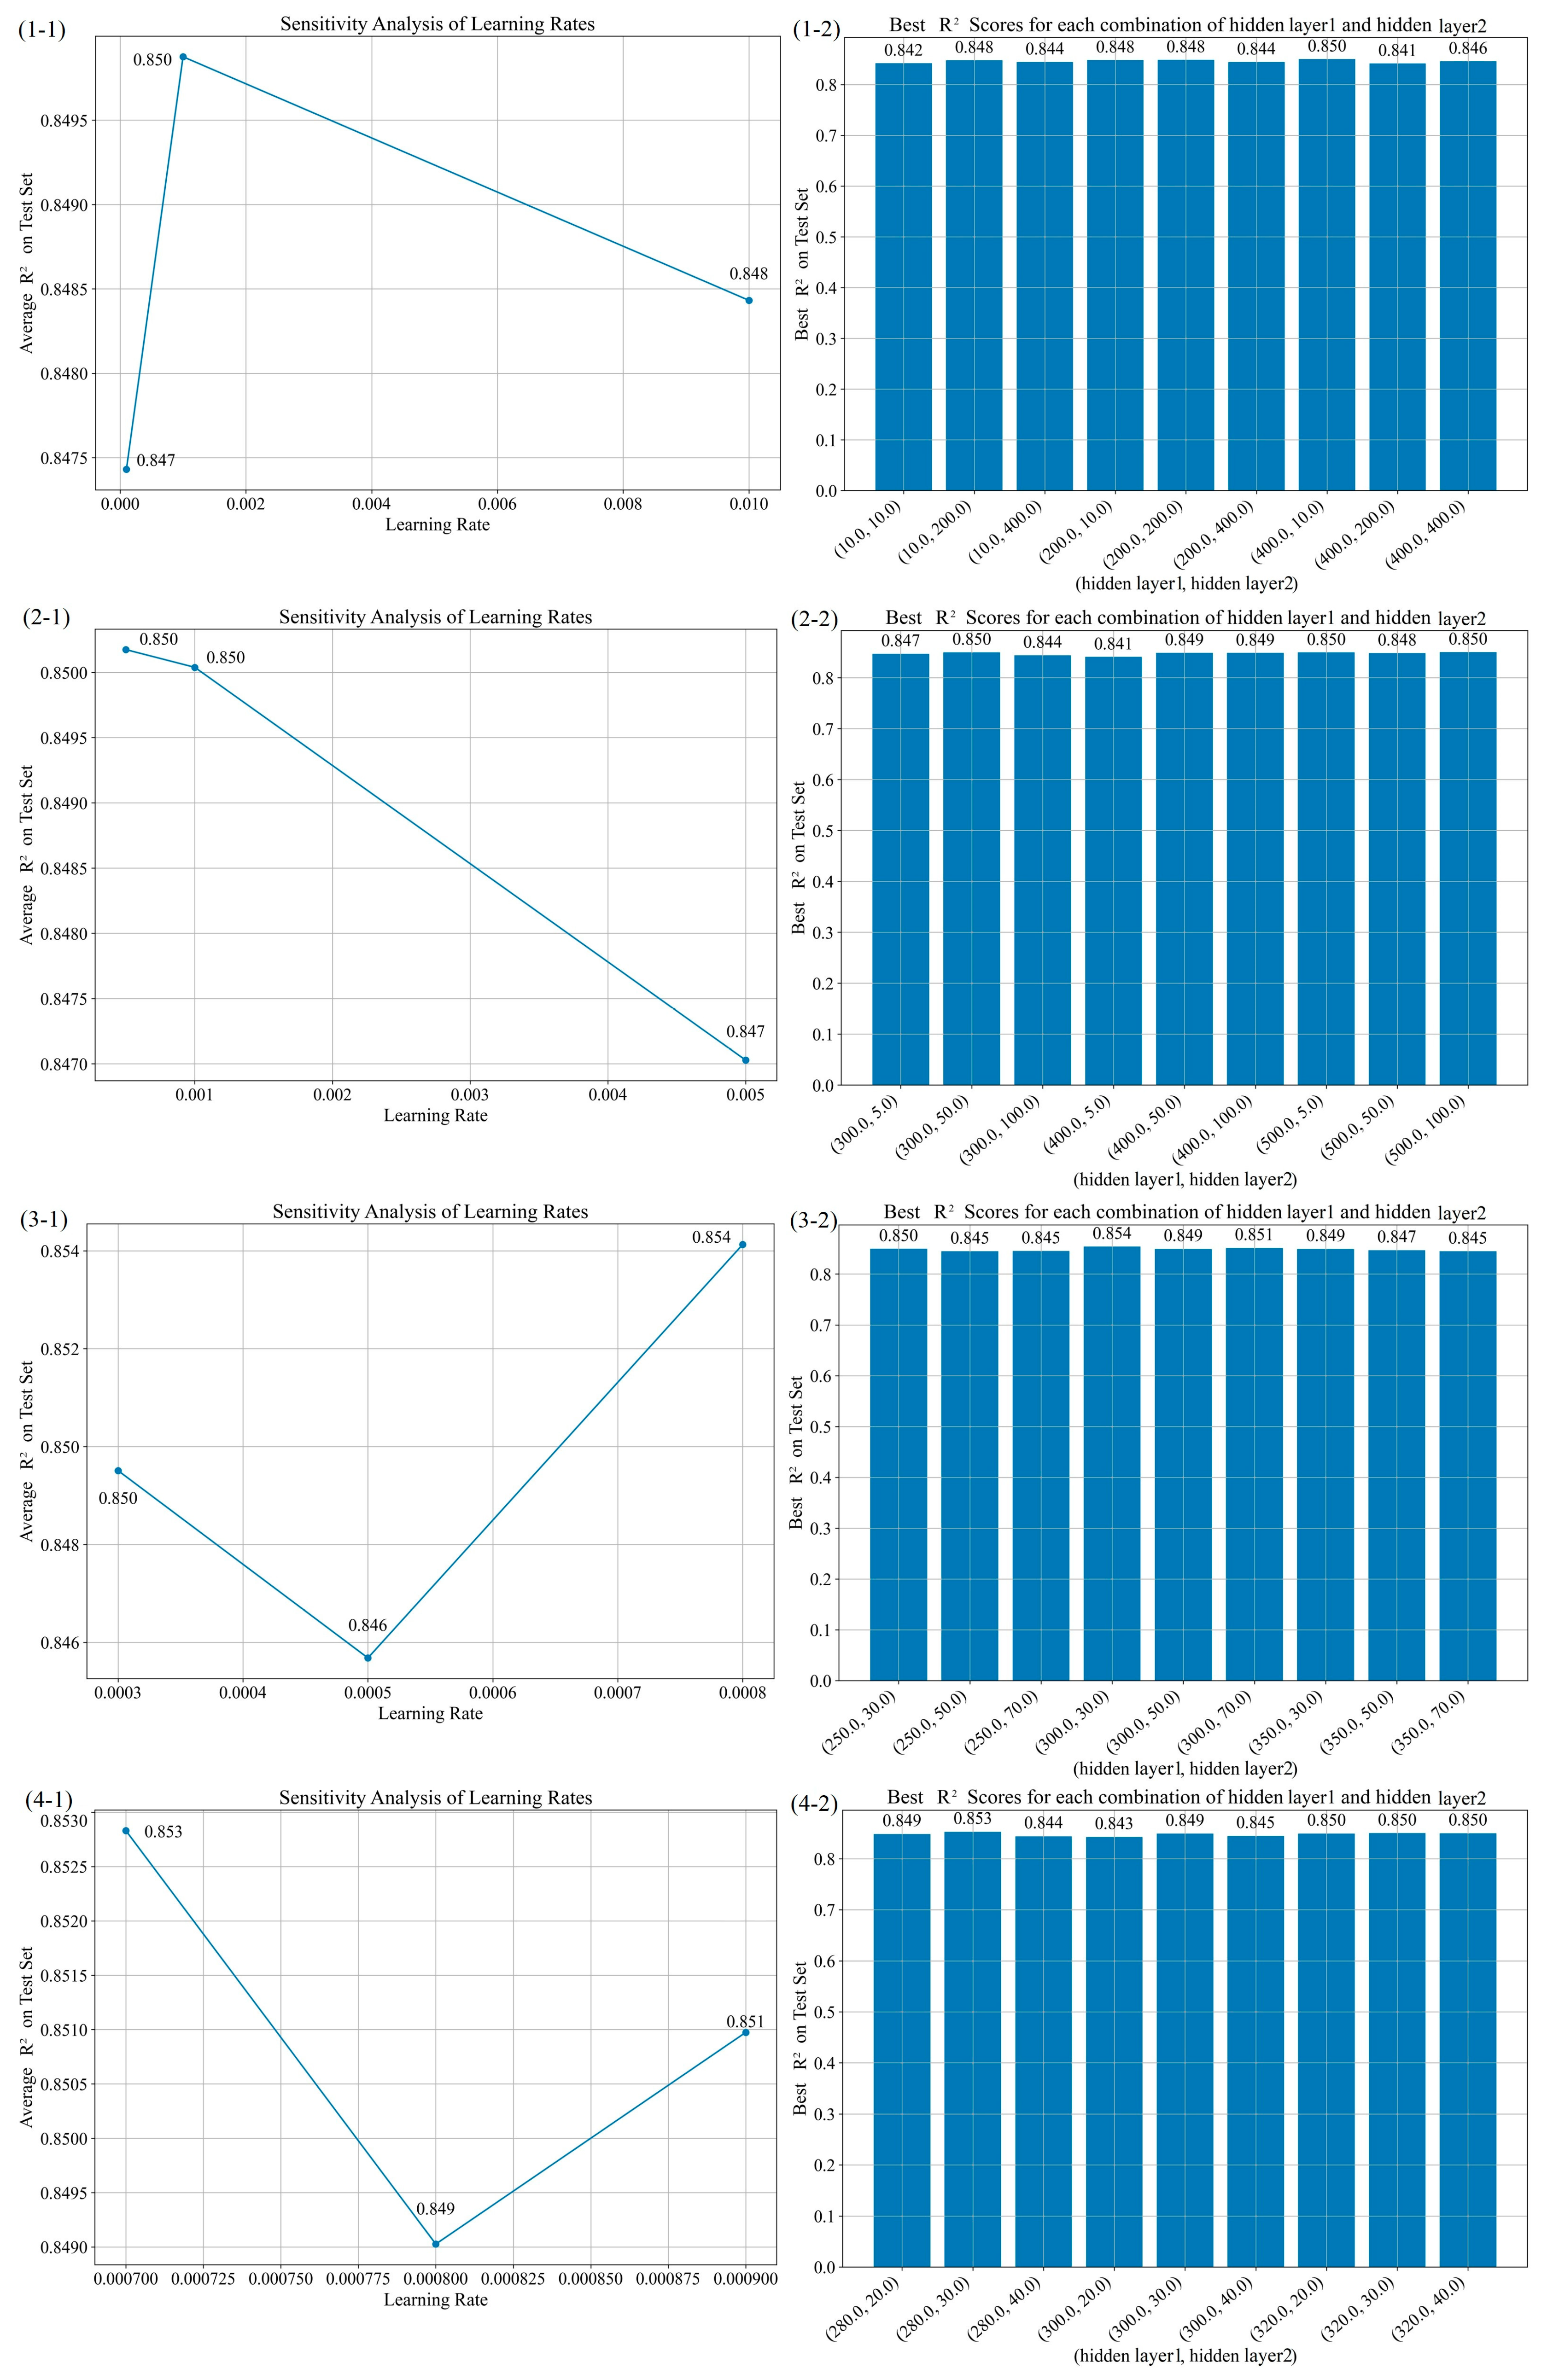
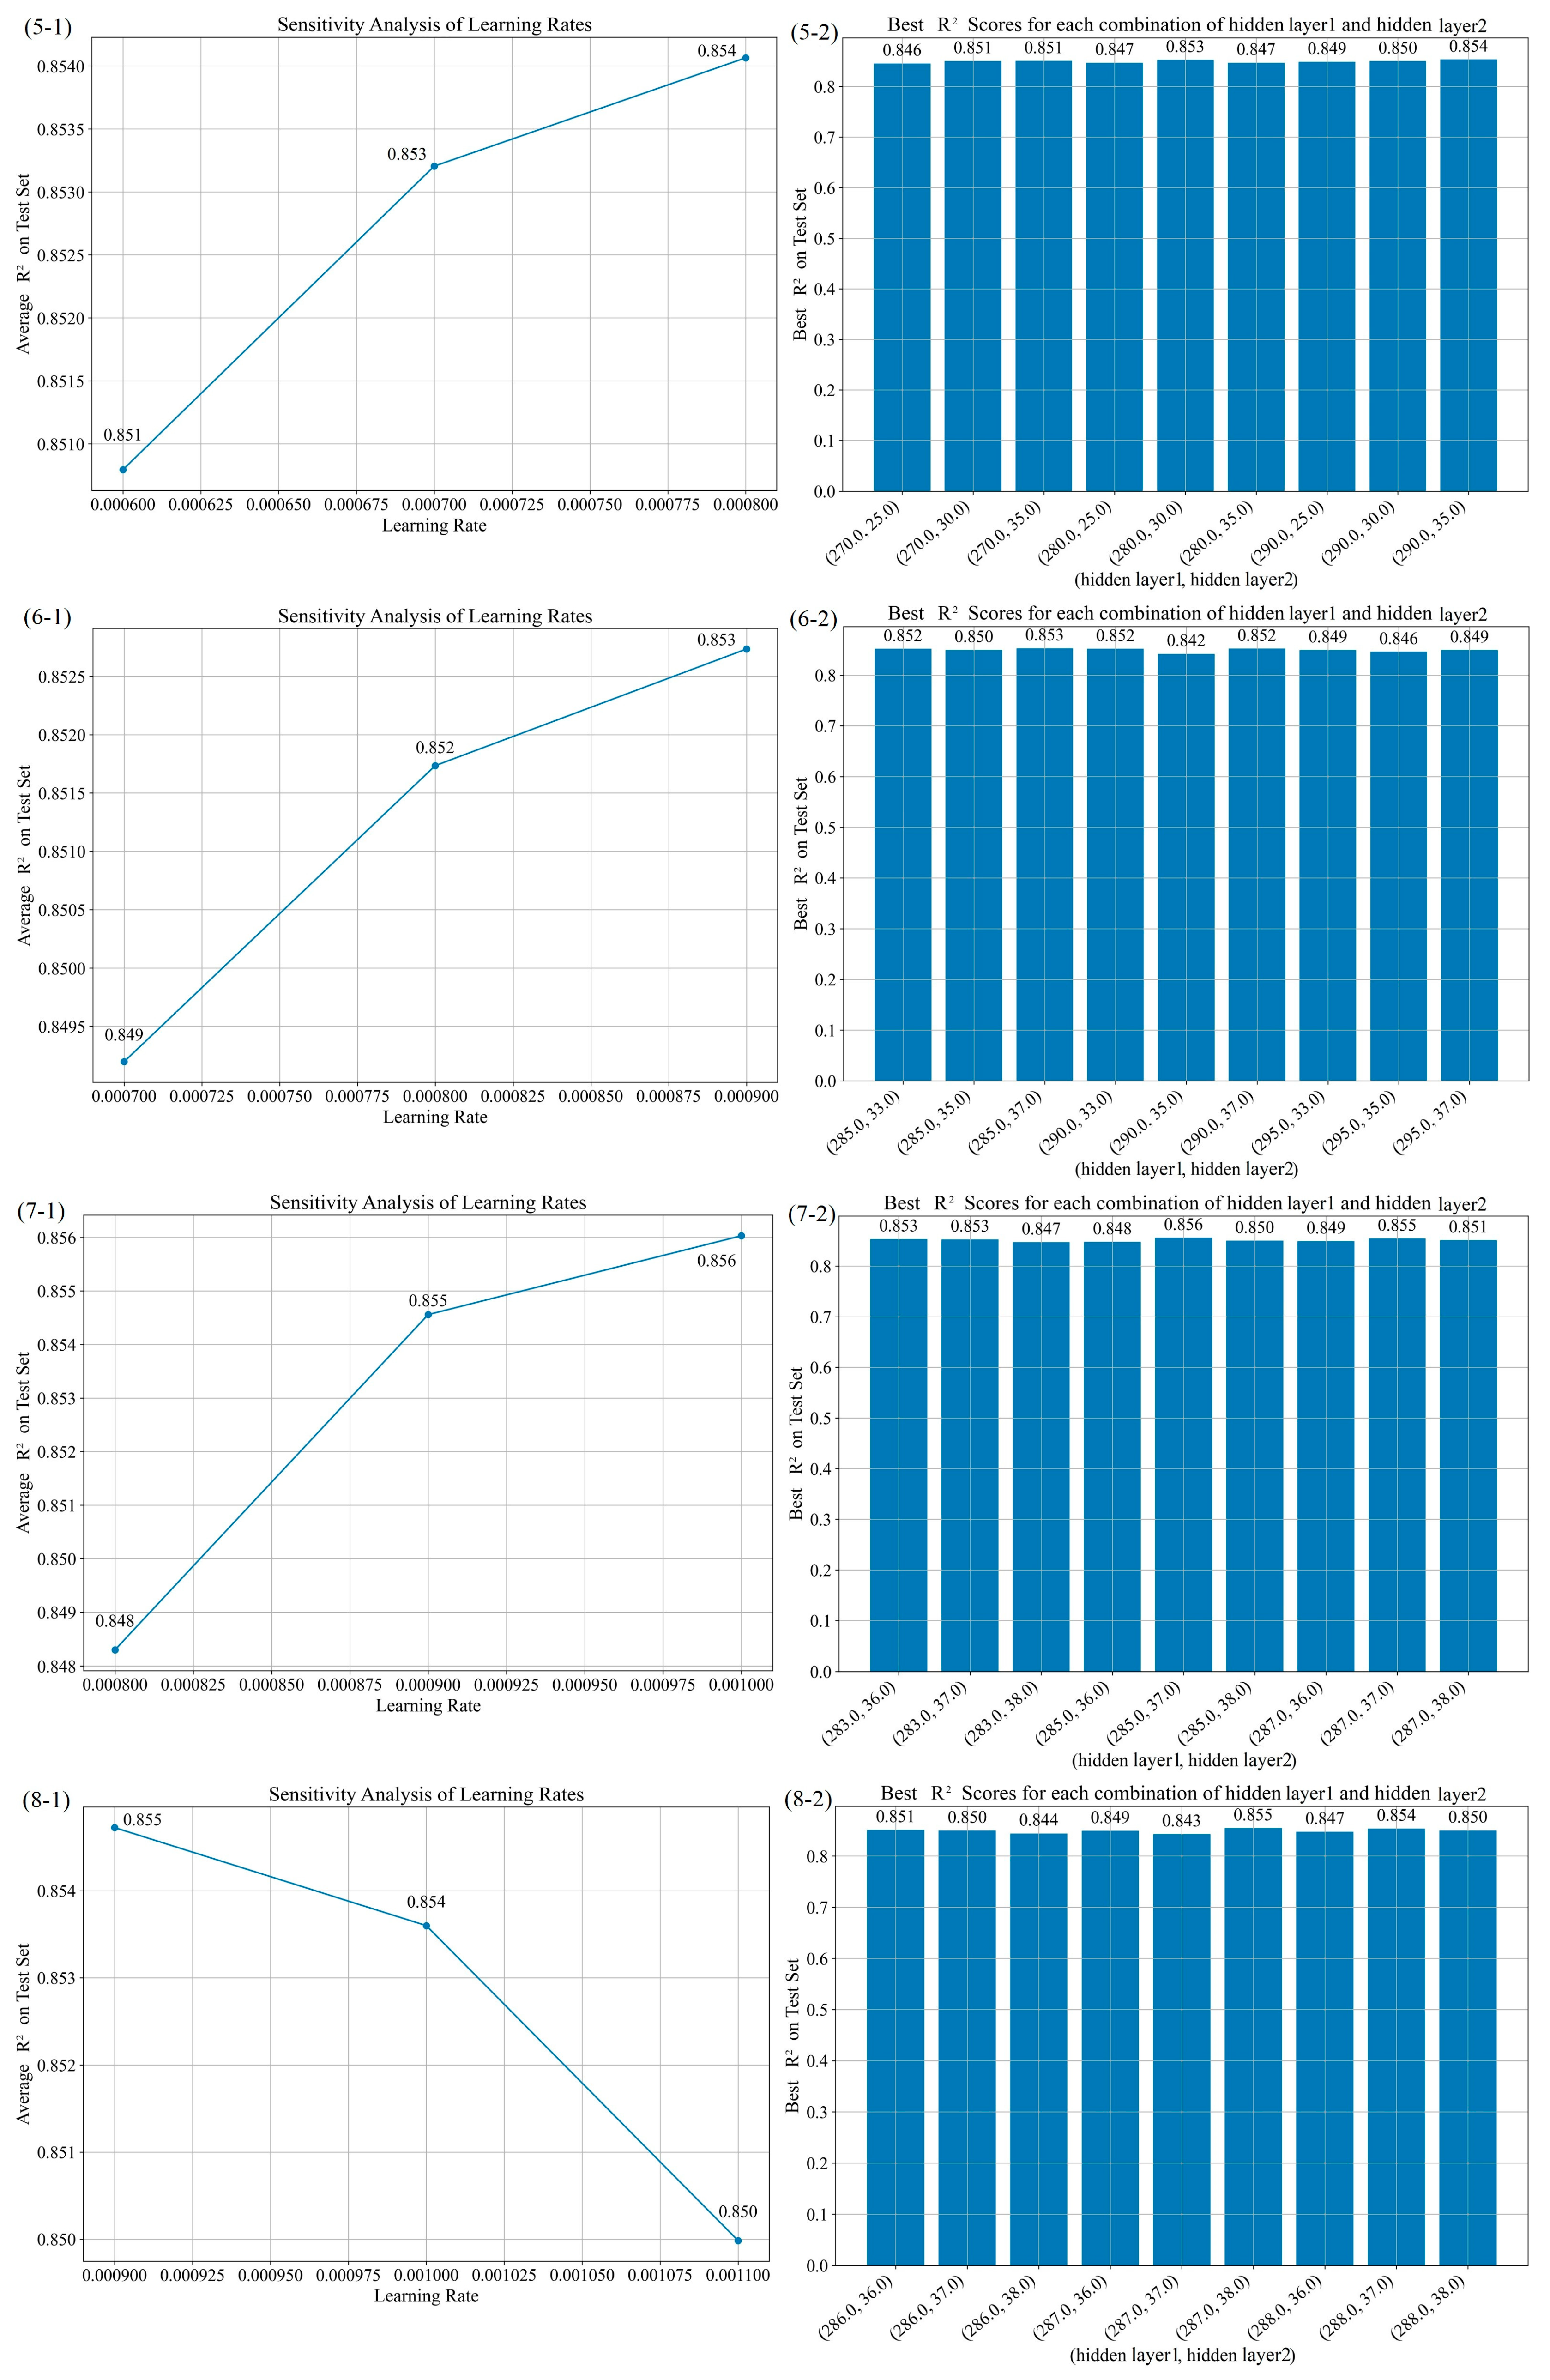
3.2.3. Hyperparameter Optimization Experiment Design

ANNs have been widely used across various fields due to their ability to analyze and correlate different parameters through multi-layer architectures, enabling precise performance prediction [24]. Unlike traditional equation-based models, an ANN can extract inherent relationships within large datasets without relying on complex formulas, and it requires only a few input parameters to operate efficiently—thereby saving modeling time and computational resources. Furthermore, ANNs demonstrates exceptional flexibility and adaptability in handling both linear and nonlinear relationships as well as high-dimensional data; since the model is built on empirical data, it is capable of predicting multiple scenarios [23].
In contrast, while tree-based models such as GBDT and XGBoost excel in managing nonlinear relationships and performing variable importance analysis, their predictions often exhibit stepwise constant behavior, which results in less-smooth predictive surfaces. ANNs, on the other hand, can generate smooth fitting surfaces by adjusting the network architecture (e.g., the number of layers and neurons per layer) and tuning training parameters. This smoothness is particularly critical when modeling continuous variables like water transparency (SD), where slight input variations should correspond to gradual output changes.
Moreover, an ANN automatically captures complex multivariate relationships through data training, eliminating the need for explicitly programmed solutions for nonlinear and multivariable modeling issues [41]. In recent years, ANNs have gained increasing attention in water quality management and water resource prediction, being applied to forecast parameters such as dissolved oxygen (DO), water quality indices, and algal bloom occurrences [21,22,25,26]. These studies underscore the advantages of ANNs in trend analysis, data prediction, and uncovering intricate interrelationships among water quality parameters.
Therefore, this study employed an ANN for simulating and predicting water transparency.
In the experiments, the same hyperparameter combinations appeared in different trials, showing variations in R2 values. This phenomenon may be attributed to several factors: first, even with fixed random seeds, stochastic elements in the neural network training process, such as mini-batch stochastic gradient descent and weight initialization, can lead to slight variations in results; second, minor differences in data splitting and normalization in each trial can affect model performance; lastly, models with different hyperparameter combinations may exhibit slight performance differences due to varying data splits or training iterations. To ensure result stability, this study conducted three experiments for each hyperparameter combination and reported the average R2 value and standard deviation, enhancing the credibility and reliability of the results.
(I) ULLs supplied by surface water
Based on the water quality parameter importance study, TSS and HRT were chosen to model and predict SD in ULLs supplemented by surface water. The experimental setup, optimal parameters, and validation set performance metrics are shown in Table 2 and Figure 11, where each index in Table 2 aligns with those in Figure 11. The optimal parameters identified include a learning rate of 0.016, with 45 neurons in hidden layer 1 and 73 neurons in hidden layer 2.
(II) ULLs supplied by tap water
Based on the water quality parameter importance study, TSS and HRT were selected to model and predict SD in ULLs supplied by tap water. The experimental setup, optimal parameter combination, and performance metrics for the validation set are presented in Table 3 and Figure 12, with each index in Table 3 corresponding to the same index in Figure 12. The optimal parameters identified are a learning rate of 0.016, 387 neurons in the first hidden layer, and 230 neurons in the second hidden layer.
(III) ULLs with rainwater storage functions
Based on the water quality parameter importance study, TSS and HRT were selected to model and predict SD in ULLs with rainwater storage functions. The experimental setup, optimal parameter combination, and performance metrics are presented in Table 4 and Figure 13, with each index in Table 4 corresponding to the same index in Figure 13. The optimal parameters identified include a learning rate of 0.001, 285 neurons in the first hidden layer, and 37 neurons in the second hidden layer.

3.2.4. Water SD Fitting with the ANN Model

(I) ULLs supplied by surface water
Using a hyperparameter combination of a 0.0008 learning rate, 290 neurons in hidden layer 1, and 35 neurons in hidden layer 2, this study fitted the SD of ULLs supplemented by surface water. The fitting and projection surfaces are shown in Figure 14.
The SD contour map indicates that, when TSS is low (especially under 45 mg/L), the contour lines show a clear diagonal trend. As SD exceeds 70 cm, the contour lines become denser, strengthening the diagonal trend, which reflects the interactive effect of TSS and HRT on SD. However, when TSS exceeds 45 mg/L, the contour lines become sparse, and the diagonal pattern weakens, suggesting that higher TSS levels diminish HRT’s regulatory effect, with TSS exerting a more dominant influence.
(II) ULLs supplied by tap water
Using a hyperparameter combination of a 0.0016 learning rate, 387 neurons in hidden layer 1, and 230 neurons in hidden layer 2, this study modeled the SD of ULLs supplemented by tap water. The fitting and projection surfaces are shown in Figure 15.
The SD contour map shows that, when TSS is below 100 mg/L, contour lines are dense, indicating that SD is primarily influenced by TSS under low suspended particle conditions. In this range, controlling TSS levels can significantly improve SD. Beyond 100 mg/L TSS, the contour lines become sparse with a reduced slope suggesting that, while TSS remains a key factor, the interaction between HRT and TSS starts to play a larger role in determining SD.
(III) ULLs with rainwater storage functions
Using a hyperparameter combination of a 0.0008 learning rate, 290 neurons in hidden layer 1, and 35 neurons in hidden layer 2, this study modeled the SD of ULLs with rainwater storage functions. The fitting and projection surfaces are shown in Figure 16.
The SD contour map shows that, when CODMn is below 80 mg/L, contour lines are densely packed with a clear vertical trend, indicating CODMn as the primary factor affecting SD under low pollutant levels. When CODMn exceeds 80 mg/L, contour density decreases, and the interaction between HRT and CODMn becomes more influential, though CODMn remains the dominant factor.

4. Discussion

4.1. Importance Analysis of Water Quality Parameters Using Machine Learning for Different Water Sources

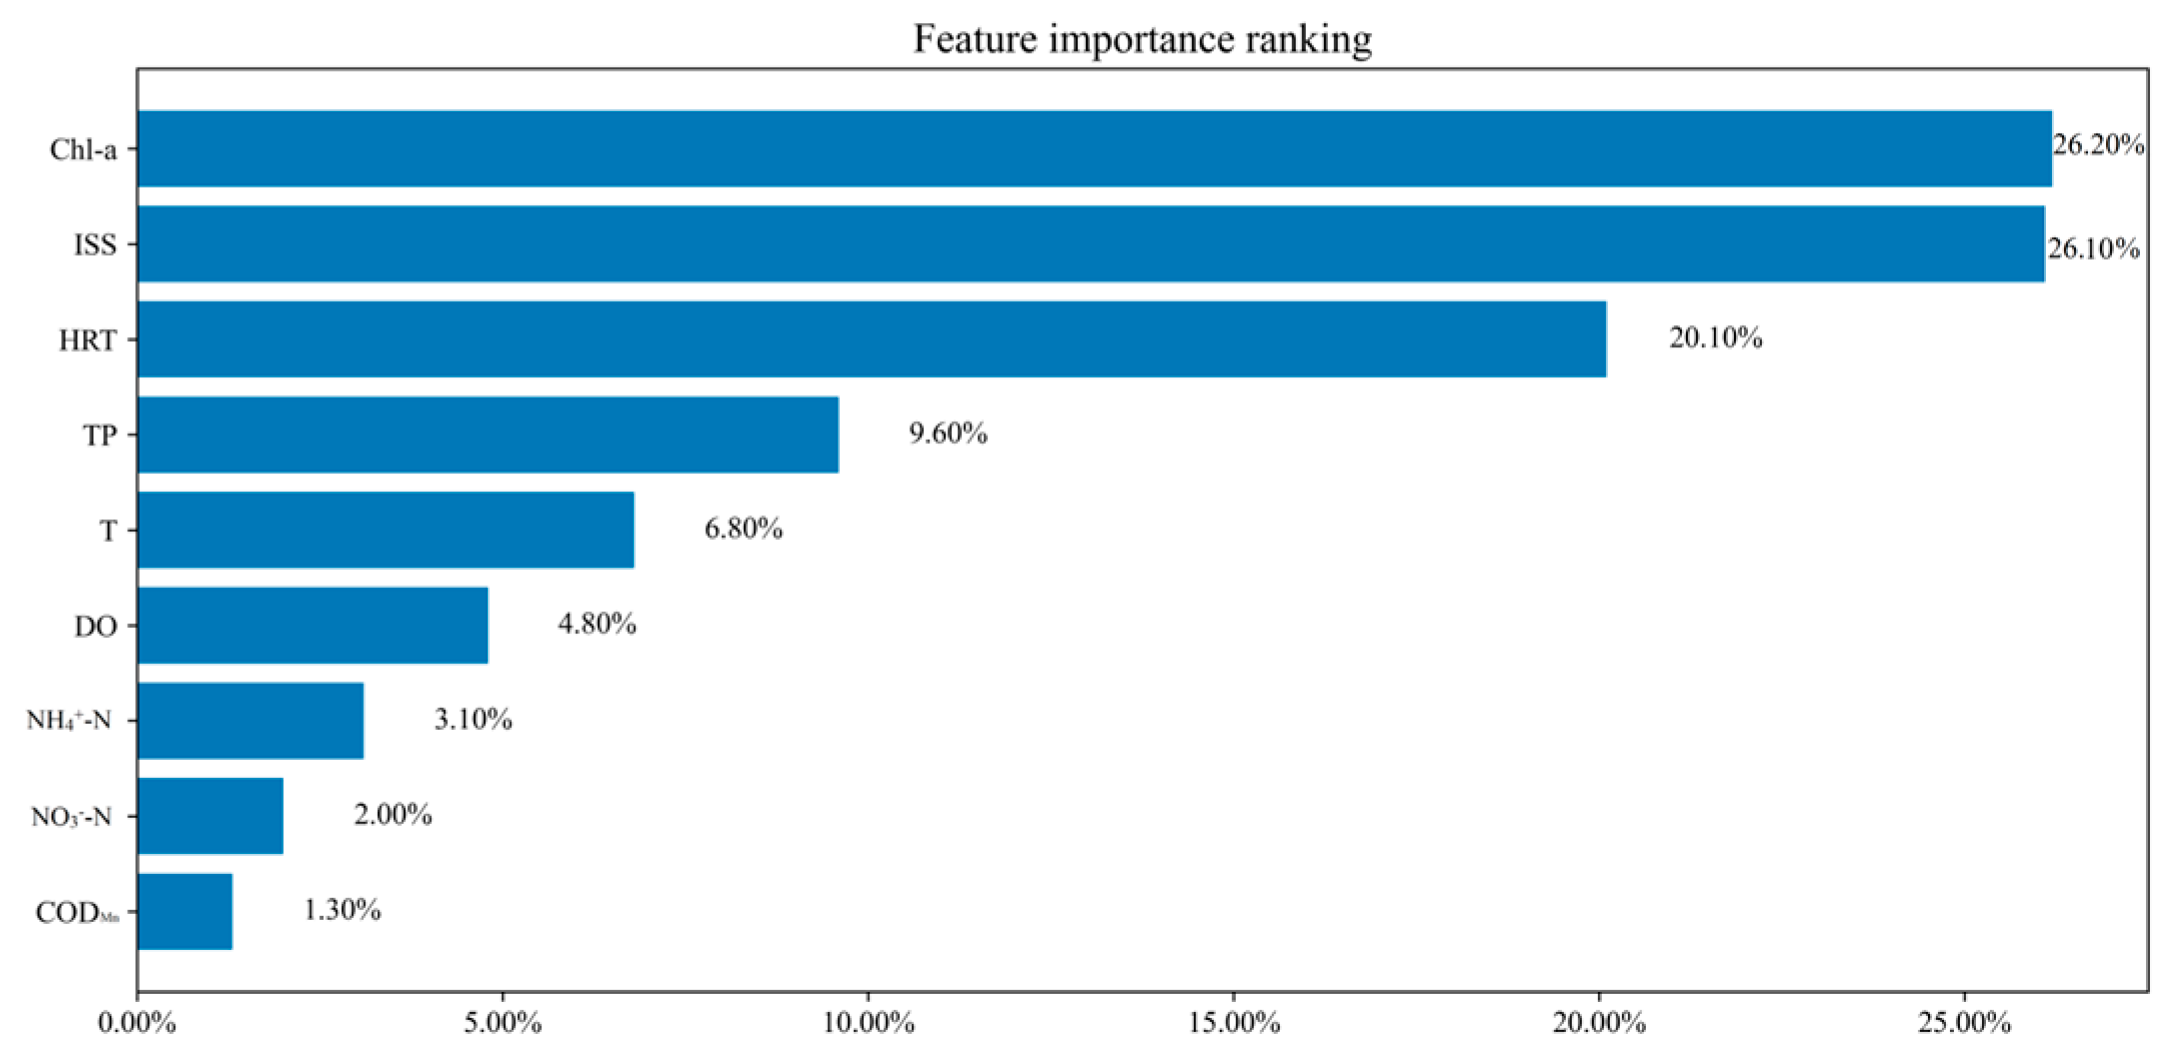
4.1.1. Importance Analysis of Key Water Quality Factors in ULLs Supplemented by Surface Water

Chl-a and ISS have a direct impact on SD by reflecting nutrient levels and turbidity [42]. Analyses indicate that even slight variations in Chl-a and ISS concentrations—within the observed range—correlate with significant changes in SD. This importance is consistent across various water bodies, from large lakes to smaller urban landscapes, underscoring their role as key determinants of water quality [43,44]. Nutrient input from human activities often accelerates algal growth, contributing to eutrophication and reduced SD [45]. Seasonal variations further affect SD, underscoring the importance of controlling algal proliferation to improve water clarity [44]. Additionally, nutrients in bottom sediments can intensify algal blooms, especially when nutrient-rich surface water is used for supplementation [46].
ISS primarily arises from surface runoff and anthropogenic activities, increasing turbidity and thereby reducing SD [47,48]. In lakes with sediment, inorganic suspended solids are readily disturbed; in lakes with hardened bottoms, ISS mainly originates from surface water and rainfall runoff [49]. Hydraulic residence time (HRT) is a critical factor in managing water exchange and pollutant dilution. Effective regulation of HRT prevents stagnation and mitigates the risk of algal and bacterial proliferation, thereby preserving SD [50].
In the water-scarce city of Xi’an, China, machine learning techniques were applied to analyze the water quality data of Hancheng Lake and Xingqing Lake, which are supplemented by surface water, as reported by Dong [5]. The results, shown in Table 5, indicate that the GBDT model performs the best. Consistent with the findings for ULLs in Taiyuan supplemented by surface water, Chl-a and ISS are highly important in maintaining water SD.
Additionally, Chang et al. [4] used MIKE 21 software to model the sensitivity of water bodies supplemented by surface water and normalized the water quality parameter weights. They found that, in ULLs supplemented by natural water, the most important water quality parameters are SS, HRT, and TP, in decreasing order of importance. The similarity of these results indicates consistency in water quality analysis across different methods, highlighting that algae growth and the presence of suspended solids are key influencing factors, particularly considering seasonal variations.

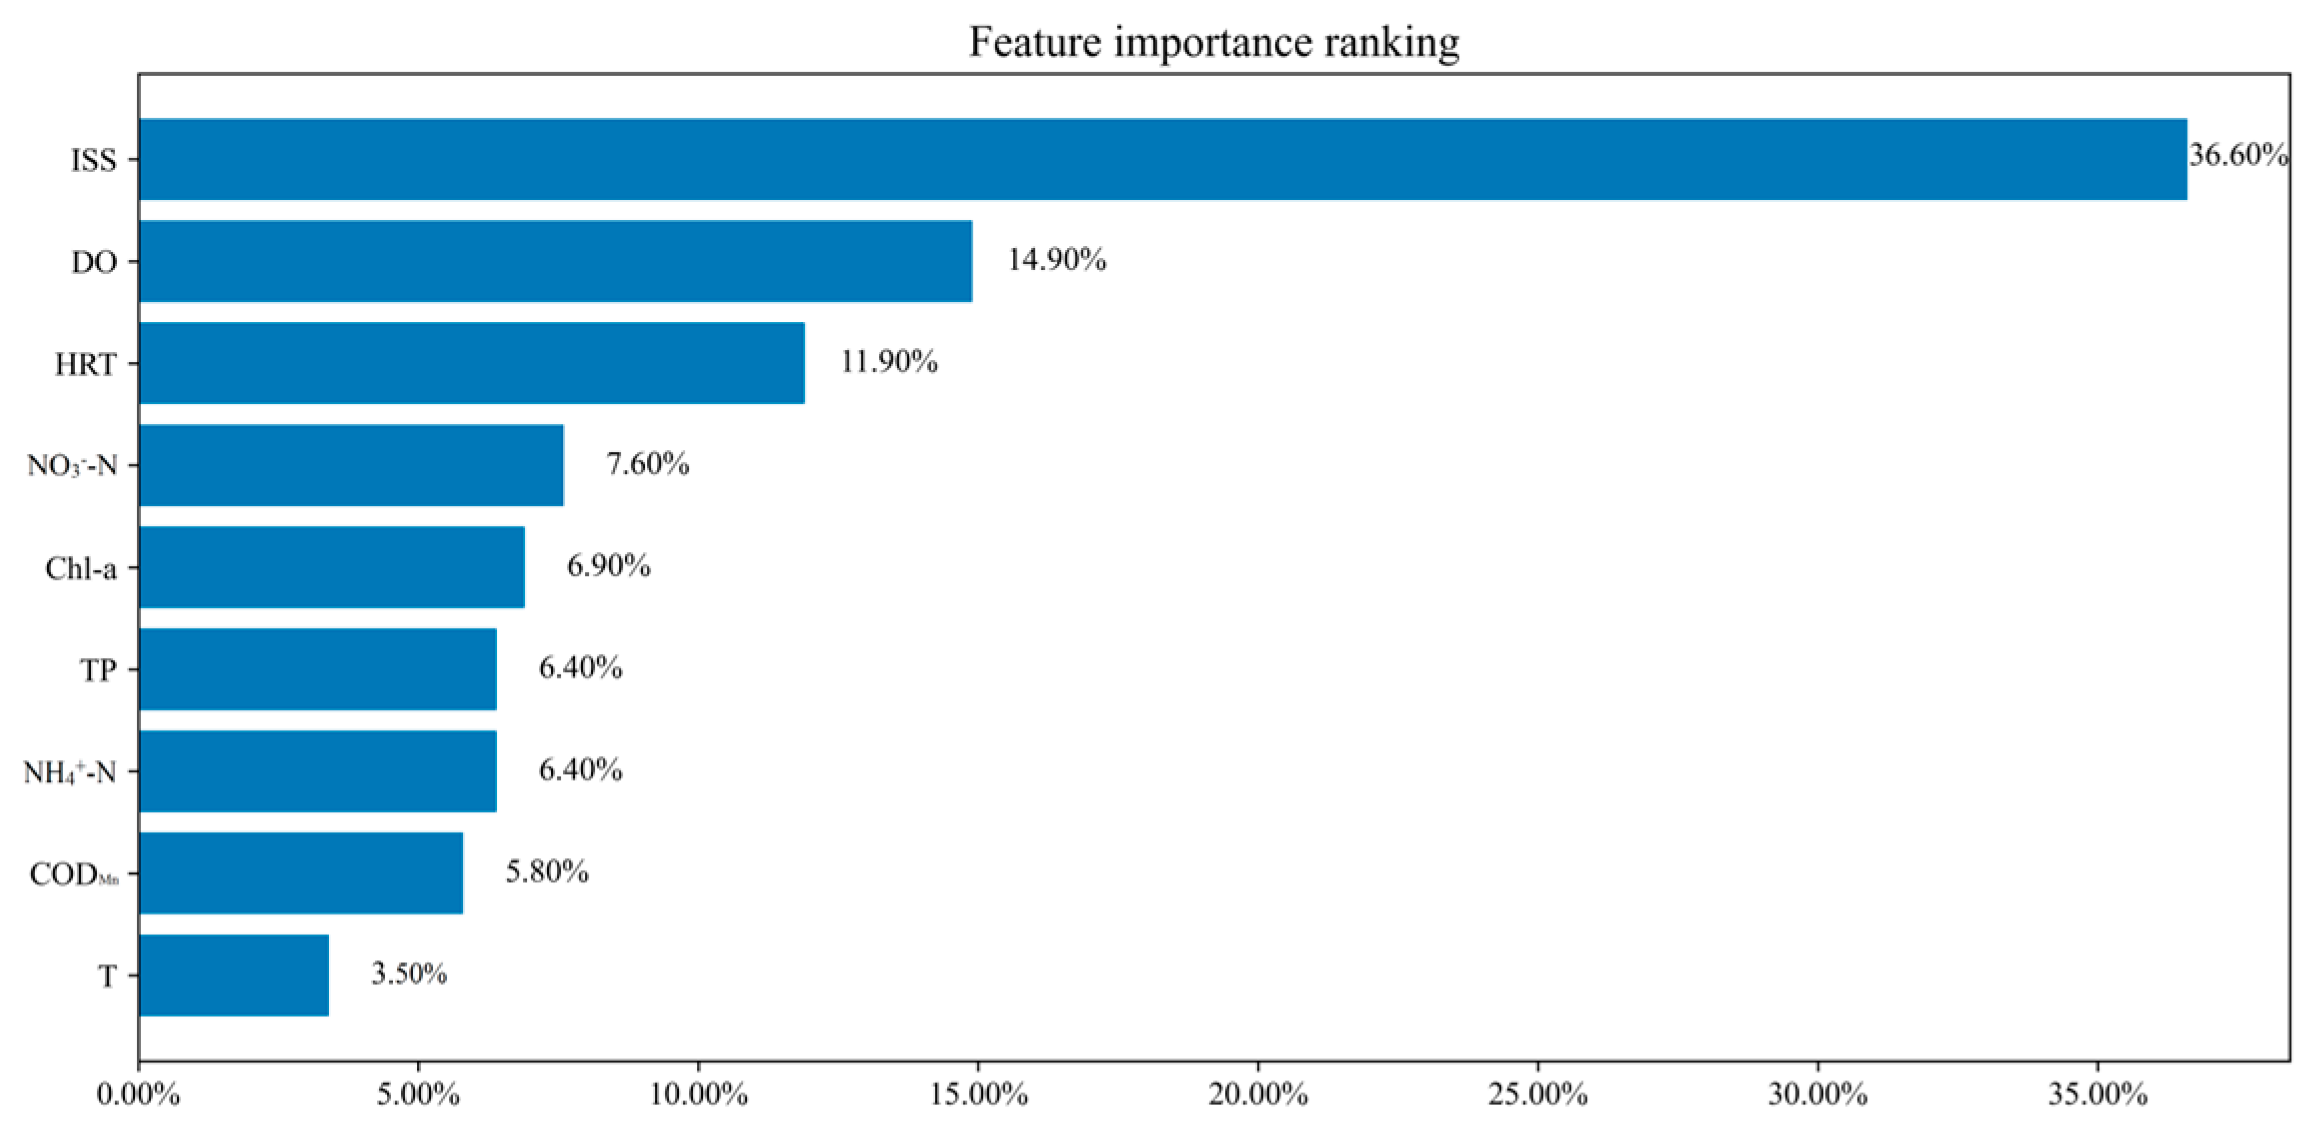
4.1.2. Importance Analysis of Key Water Quality Factors in ULLs Supplemented by Tap Water

Although tap water is generally of higher quality than surface water, water bodies supplemented by tap water often exhibit lower SD. This may be due to the continuous, small-scale addition of tap water, which is less effective in diluting pollutants compared to the large, periodic batches of surface water added during peak flow seasons [51,52]. Research confirms that extended batch supplementation significantly improves lake water quality, indicating the importance of supplementation methods [51].
Tap water, as a cleaner source, introduces fewer nutrients and suspended particles, stabilizing water quality, supporting high DO levels, and inhibiting algal growth. However, some suspended particles may still enter from lake runoff or water SD and, in lakes with no outflow, ISS can accumulate, impacting SD—especially in sediment-laden lakes where disturbances can elevate ISS levels [49]. While the high DO content in tap water generally enhances SD, organic decomposition and algal respiration can deplete DO, necessitating regular monitoring [53].
Due to the substantial costs associated with purification and treatment processes required to meet drinking water standards, using tap water as the primary source for ULLs may result in unnecessary expenses. Therefore, it is not advisable to utilize tap water as a supply source for ULLs.

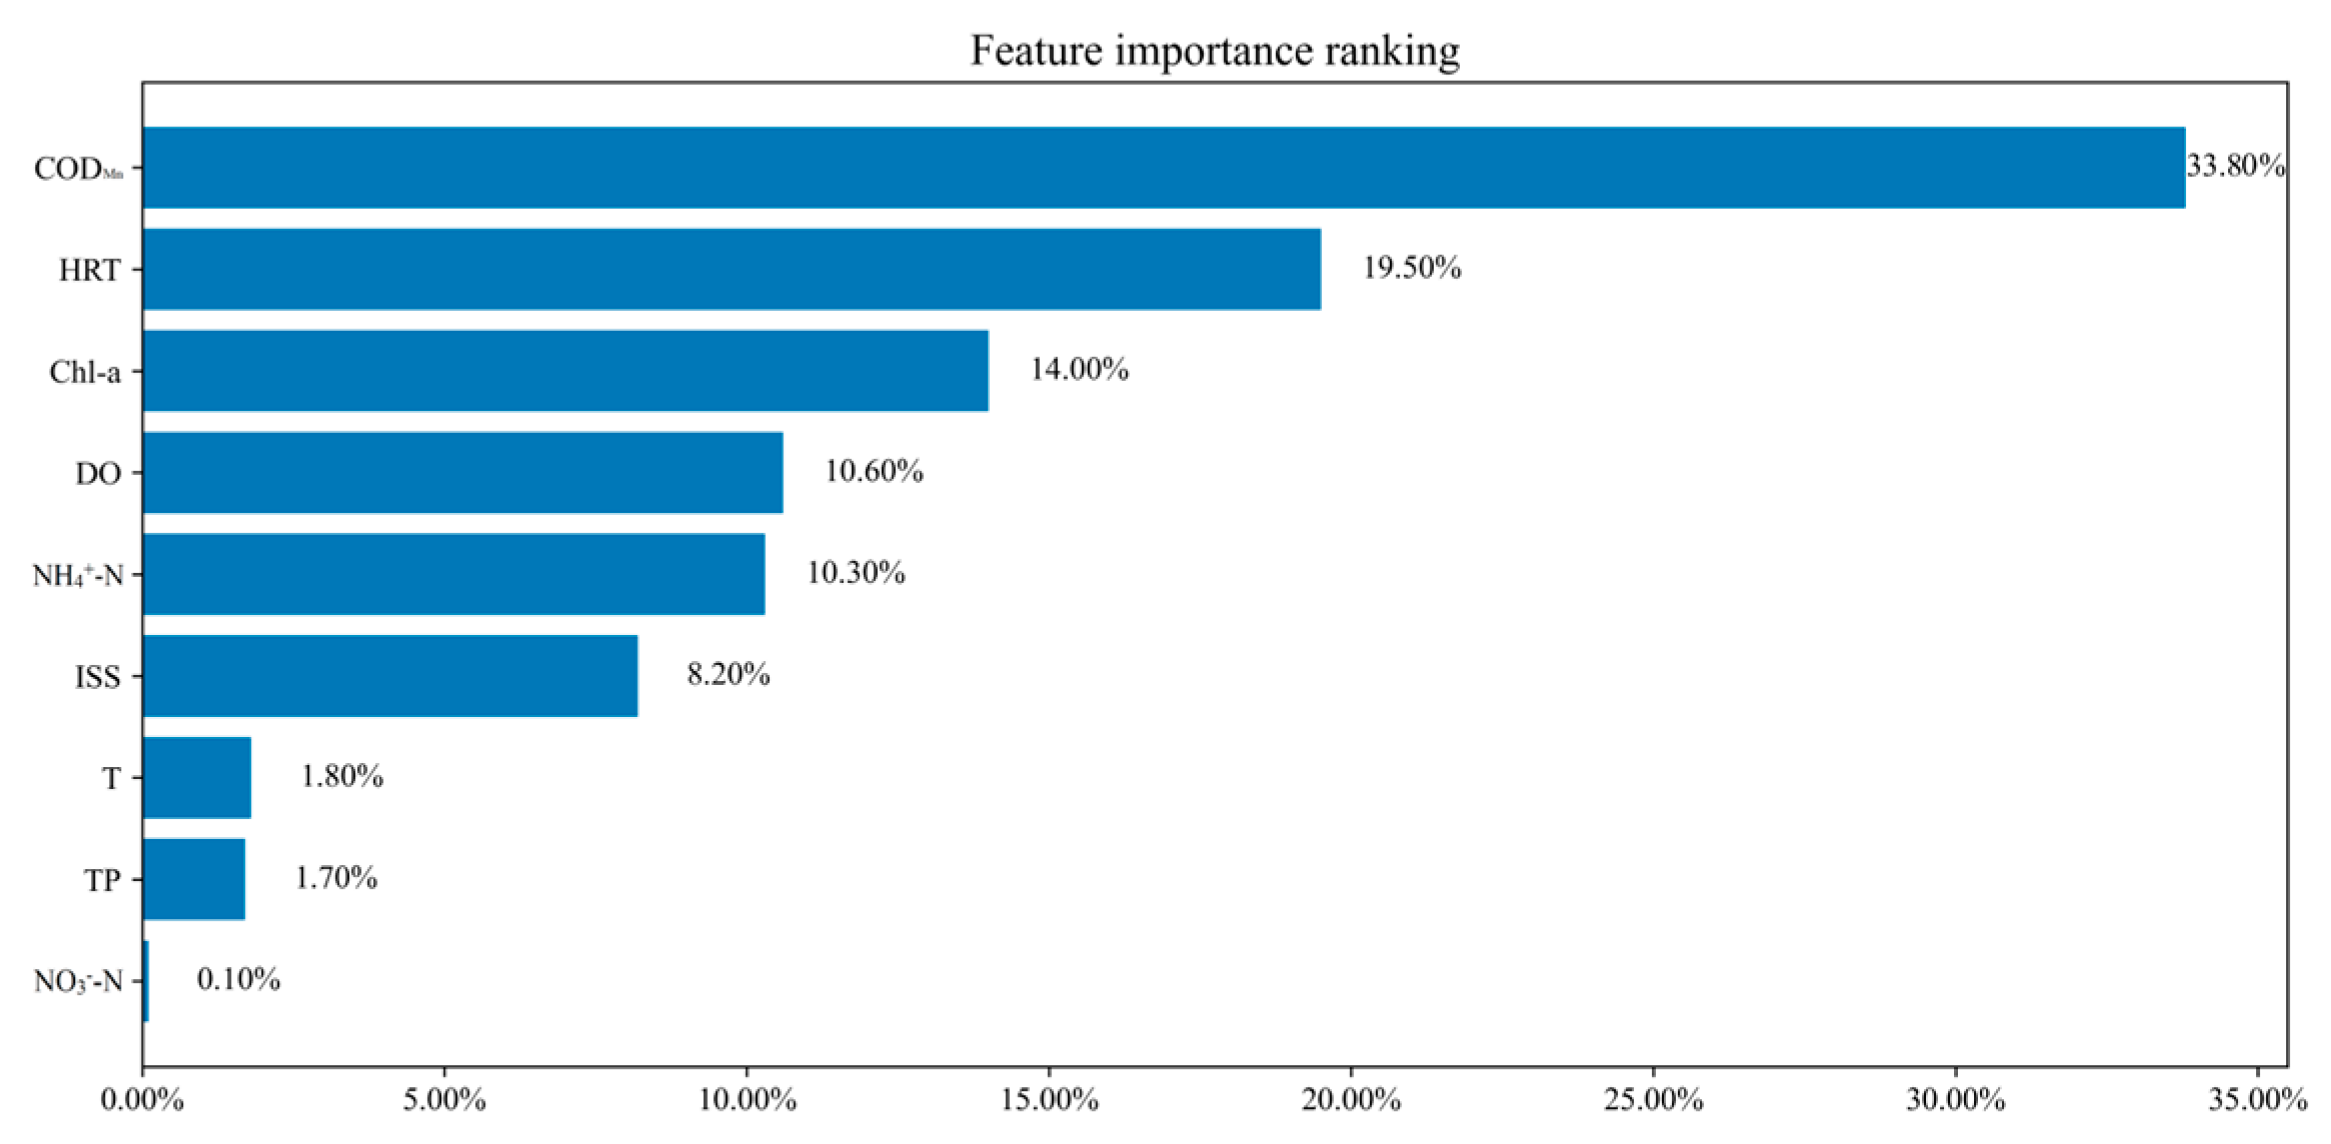
4.1.3. Importance Analysis of Key Water Quality Factors in ULLs with Rainwater Storage Functions

Rainwater retention ponds store large amounts of runoff during intense rainfall, alleviating urban drainage pressure and mitigating flooding [54]. However, this runoff carries organic pollutants and suspended particles, leading to reduced SD and water quality [55,56]. The decomposition of organic matter, which demands substantial DO, emphasizes CODMn’s critical impact on SD, as observed in prior studies [45,57].
HRT, or water renewal rate, is the second most important factor, reinforcing the need for effective water exchange to sustain SD. High CODMn and NH4+-N levels further exacerbate DO depletion, creating anoxic conditions that release sediment-bound pollutants, worsening water quality [40]. Nutrient accumulation also drives algal growth, underscoring the relevance of Chl-a and DO in managing SD in ULLs.

4.1.4. Analysis of Water Source Types and Algorithm Selection Reasons

This study applied machine learning models to analyze water quality parameters across three types of water bodies: those supplemented by surface water, tap water, and those with rainwater storage functions. For surface water-supplemented (144 data points) and tap water-supplemented bodies (163 data points), the GBDT model was chosen for its efficiency in handling complex, variable water quality parameters and its capability to accurately fit medium-sized datasets with high R2 values [58,59].
For rainwater storage ponds with smaller datasets (44 data points), XGBoost was selected due to its built-in regularization (L1 and L2), which mitigates overfitting risks. Given the variability in runoff sources, XGBoost’s adaptability is advantageous in managing unpredictable water quality fluctuations [60].
In summary, model selection is determined by dataset size, complexity, and regularization needs. GBDT is suited for medium or complex datasets, while XGBoost excels with smaller, more variable data and stronger regularization. Optimal models are identified by comparing multiple models, cross-validation, and parameter tuning.

4.2. SD Fitting Analysis of Water Quality Parameters Based on ANN

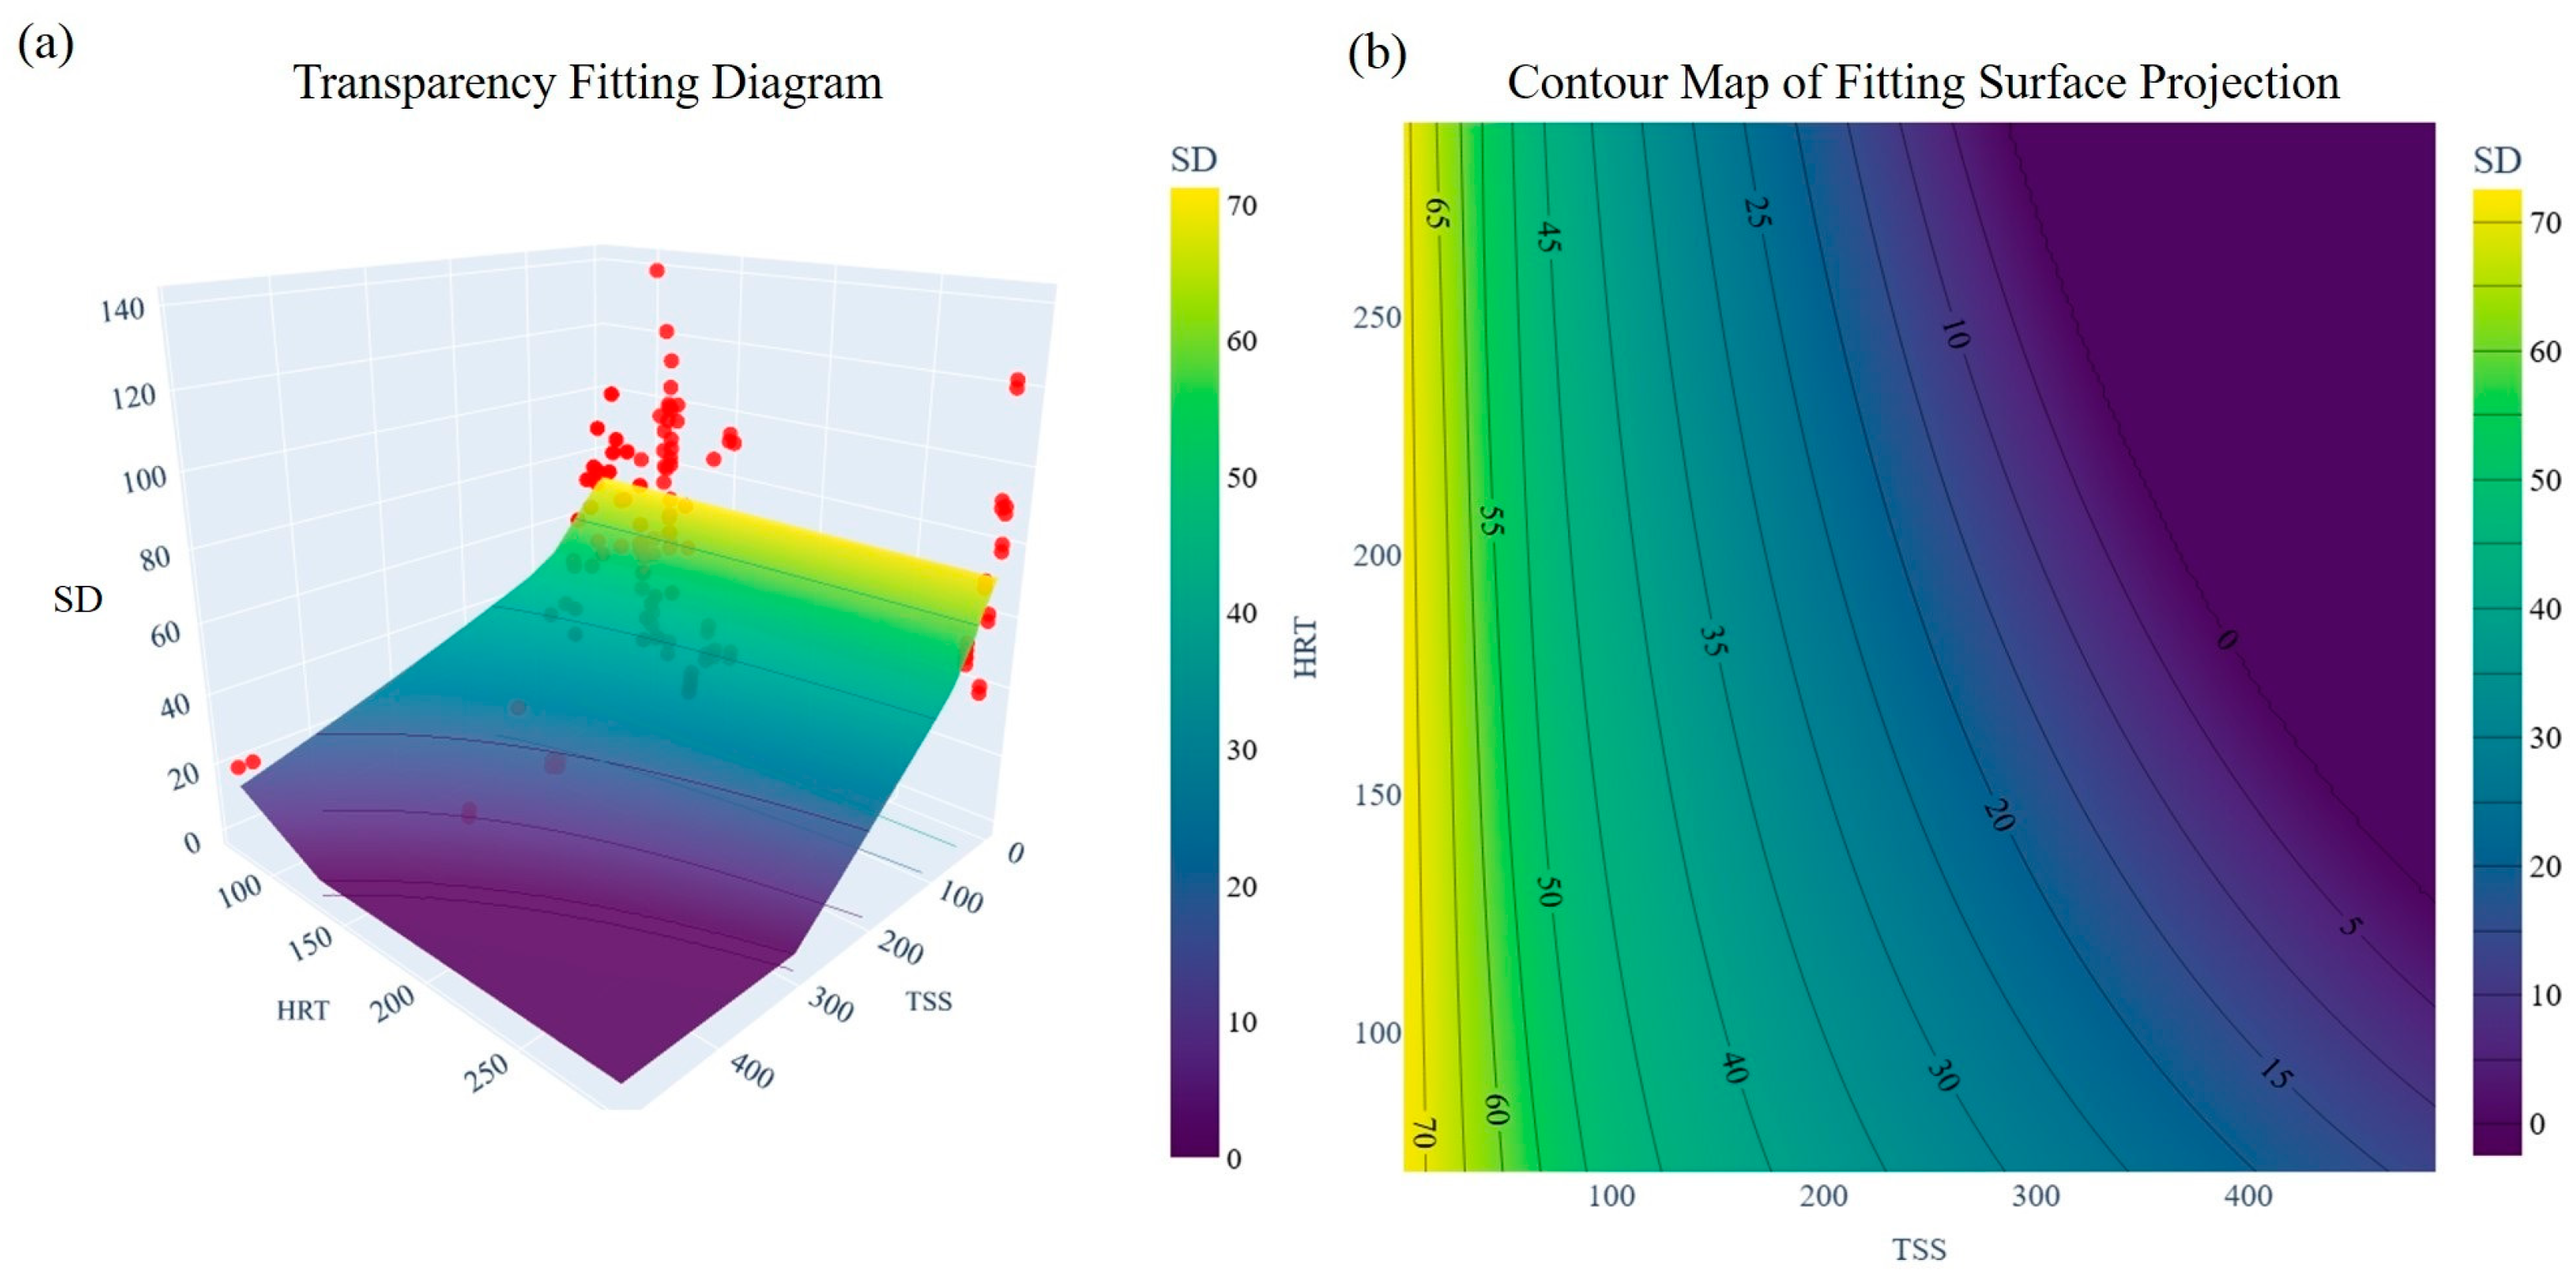
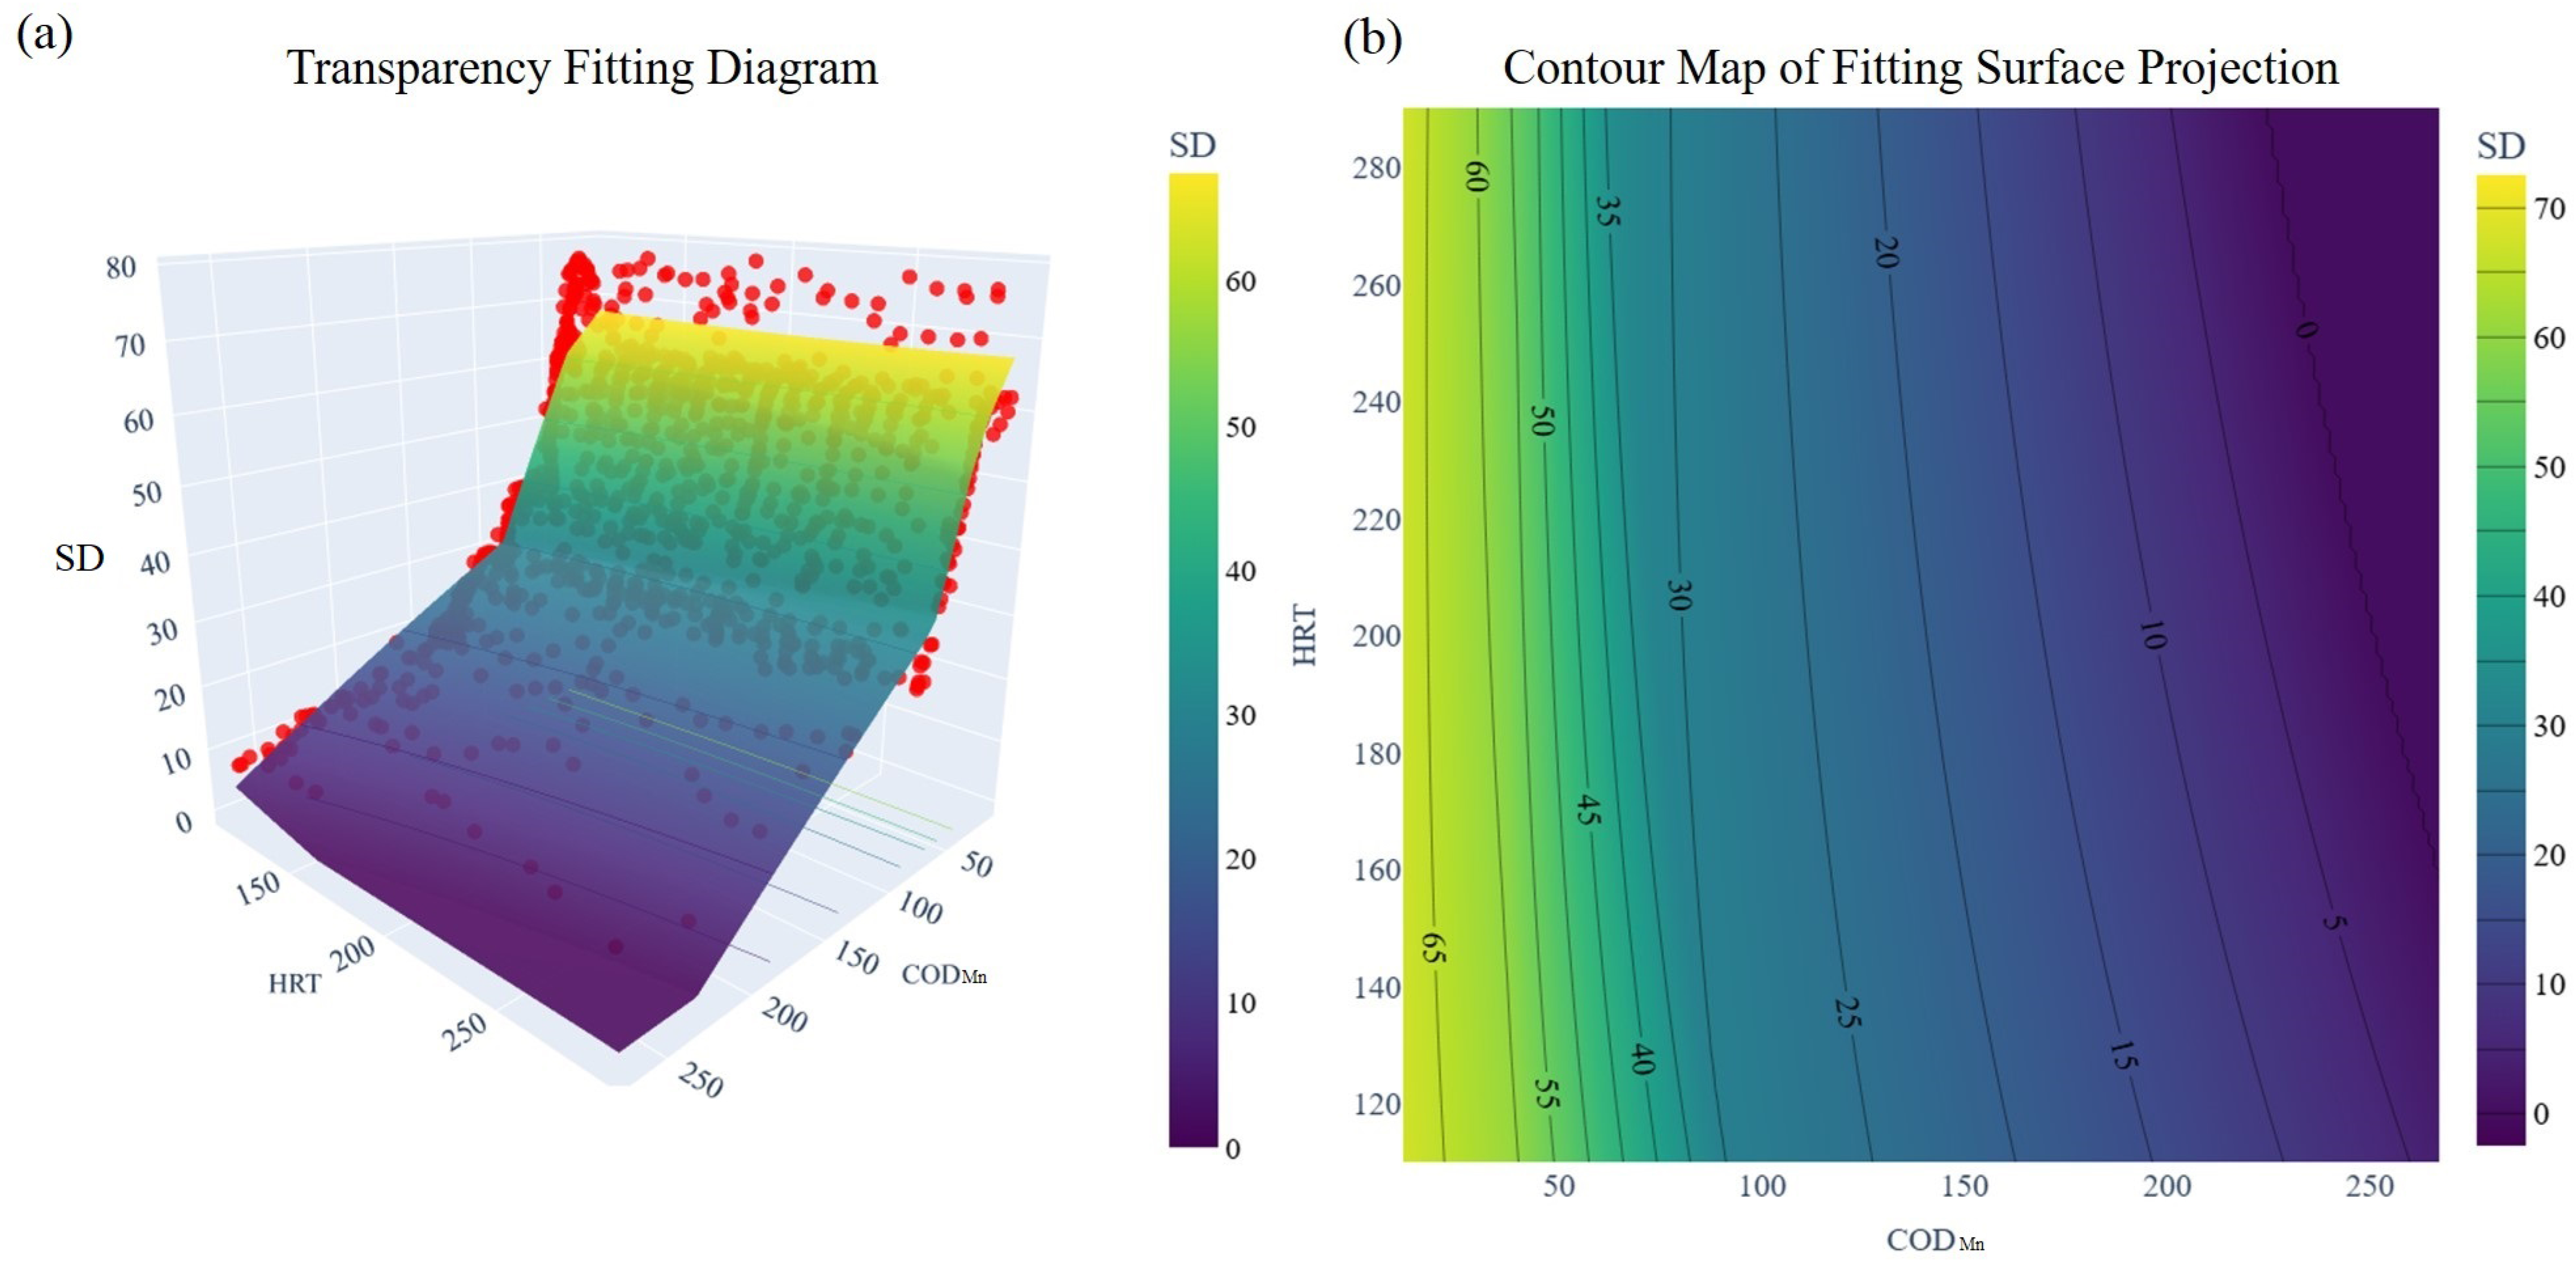
4.2.1. Fitting Key Water Quality Factors in Surface Water-Supplemented ULLs: Emphasis on TSS and HRT

In further analyzing water quality management strategies for ULLs supplemented by surface water, survey data from previous literature provides an important reference. Chang et al. [4] surveyed 166 ULLs across China, analyzing the sensitivity and weight of eight water quality parameters on SD with surface water supplementation. They found that TSS had the highest weight (0.216), followed by TP (0.153) and HRT (0.145), aligning with this study’s results and emphasizing the importance of managing TSS and HRT to maintain SD.
This study builds on prior findings with a more detailed numerical analysis, reaffirming the significance of TSS and HRT and providing specific ranges and management strategies. These findings offer practical guidance for water quality management, allowing practitioners to implement targeted measures based on operational conditions.

4.2.2. Key Water Quality Factors in Tap Water-Supplemented ULLs: Focusing on TSS and HRT

Tap water, despite its quality, is economically inefficient for ULLs and generally not recommended. However, some newer ULLs, built with city expansion and lacking natural water connections, rely solely on tap water. Fitting analysis shows that SD in these water bodies is typically lower than in those using surface water. Although tap water is treated, it does not significantly improve SD.
The reduced SD is likely due to the shallow depths, small areas, and limited self-purification capacity of these water bodies. These findings indicate that, for smaller, shallower ULLs with existing poor water quality, supplementation with clean sources has minimal impact. Emphasis should therefore be on intrinsic management and treatment of the water body itself to effectively enhance water quality.

4.2.3. Evaluation and Discussion of Key Water Quality Factors for ULLs with Different Water Supply Sources

Although rainwater supplementation offers a sustainable solution for ULLs, it presents unique challenges in water quality management. While using rainwater to replenish ULLs is sustainable and eco-friendly, runoff can introduce pollutants like oils, heavy metals, and organic matter. These water bodies exhibit the poorest quality, primarily due to pollutants in runoff during rainfall [56], resulting in high CODMn levels and severe eutrophication. This study aligns with previous findings [45,57], confirming CODMn’s critical role in water pollution.
For rainwater storage ponds, improving SD through supplementation is limited; controlling CODMn levels or exploring alternative water sources should be prioritized.

4.3. ULLs Quality Management Plan

When surface water is used as the supplementary source, it generally contains high concentrations of nutrients and suspended solids, which promote rapid algal growth. Consequently, Chl-a and ISS become key factors affecting the transparency of ULLs. In the case of tap water, although the water is pre-treated and thus relatively clean, the supply mode is typically a continuous, low-volume addition that does not provide timely replenishment. This leads to the accumulation of suspended solids, adversely affecting water transparency. For water bodies that also serve as rainwater detention ponds, rainfall carries a large amount of organic pollutants. The decomposition of these pollutants consumes substantial DO, disrupting the ecological balance and reducing transparency. Based on a systematic analysis of water quality characteristics under different supplementary water sources, this study proposes corresponding water management strategies aimed at improving water quality and enhancing transparency.
(1) Algae management: For ULLs supplemented by surface water, managing algae is essential, particularly when TSS levels are below 45 mg/L, as both algae and suspended particles significantly influence SD. Control measures include regular cleaning, use of algae inhibitors, and nutrient level management. Enhancing vegetation around water bodies can also help reduce nutrient inflow, supporting algae control efforts [61].
(2) In bodies supplemented by tap water, maintaining TSS levels below 100 mg/L can effectively enhance SD. Reducing soil erosion by increasing vegetation cover and installing sedimentation basins at water inlets can mitigate suspended solid inputs [54].
(3) HRT regulation is particularly important in high TSS or CODMn conditions. Increasing water flow rates, installing stirring devices, or adding pumps can improve flow and reduce retention time, promoting the settlement of suspended solids and natural water purification. When water supply is limited, supplementary sources, such as reclaimed water, may serve as viable alternatives for ULLs [9].
(4) For bodies supplemented by tap water, dissolved oxygen (DO) levels play a crucial role in maintaining SD. Installing aeration devices or utilizing aquatic plants to increase DO through photosynthesis can improve ecological health, supporting clearer water [62].
(5) Control of organic pollutants: Pollutant loads from the source by CODMn levels are a determining factor for SD in rainwater retention bodies, especially when CODMn is below 80 mg/L. Improving stormwater treatment facilities to reduce runoff-borne organic pollutants is essential. Additionally, enhancing the self-purification capacity of the water body through aquatic vegetation can provide further benefits [63,64].

5. Conclusions

This study applied machine learning algorithms to examine the relationship between transparency (SD) and water quality parameters in Taiyuan City’s urban landscape water lakes, each with different water sources and functional roles. For water bodies supplemented by surface water and tap water, the GBDT model performed optimally, identifying Chl-a, ISS, and HRT as primary factors in surface water bodies, and ISS and DO in tap water-supplemented bodies. For water bodies functioning as rainwater retention ponds, the XGBoost model was most effective, with CODMn and HRT emerging as key factors, and additional influences from Chl-a, DO, and NH4+-N.
Further analysis optimized ANN hyperparameters to fit SD levels across water sources. For surface water-supplemented bodies, SD was influenced mainly by the interaction of TSS and HRT when TSS levels were below 45 mg/L; but, as TSS increased, its influence became dominant, while the effect of HRT decreased. In tap water-supplemented bodies, SD was primarily affected by TSS at levels below 100 mg/L, with TSS-HRT interactions becoming more influential above this threshold. In rainwater retention ponds, CODMn was the most critical factor affecting SD, especially below 80 mg/L, while CODMn–HRT interactions became more significant as CODMn levels rose. This analysis suggests that, at lower TSS and CODMn levels, SD is largely influenced by individual factors, while the regulatory role of HRT intensifies at higher concentrations.
Key strategies proposed for enhancing SD in urban water bodies include improved algae control, reduction of suspended particles, optimized hydraulic retention times, and increased dissolved oxygen levels, all aimed at strengthening water quality and aesthetic appeal. These findings underscore the effectiveness of ANN models in capturing complex nonlinear relationships in water quality management and offer practical guidance for sustainable urban water management in water-scarce regions.
Overall, our study offers practical guidance for urban water management by applying machine learning to understand how water quality parameters affect water transparency. Our quantitative analysis identifies key factors that can be directly monitored and adjusted to improve the quality of urban landscape water bodies. These findings provide clear, data-driven recommendations—such as controlling suspended solids, optimizing hydraulic retention times, and managing nutrient levels—that can help water managers achieve better water clarity and support sustainable urban water management.

Author Contributions

Conceptualization, J.Y. and Y.L.; methodology, J.D.; software, Y.Z.; validation, Y.Z.; formal analysis, Y.Z.; investigation, J.D. and Y.Z.; resources, J.Y.; data curation, Y.Z.; writing—original draft preparation, Y.Z.; writing—review and editing, J.D.; visualization, Y.Z.; supervision, J.Y. and X.H.; project administration, J.Y. and J.D.; funding acquisition, J.Y. and J.D. All authors have read and agreed to the published version of the manuscript.

Funding

This work was financially supported by National Key Research and Development Program Project (No. 2019YFC0408602), Fundamental Research Program of Shanxi Province (No. 202103021224107), and Shanxi Province science and technology cooperation and exchange special project (No. 202304041101047).

Data Availability Statement

The data used in this study cannot be publicly disclosed due to policy requirements.

Conflicts of Interest

The authors declare no conflicts of interest in this study.

References

  1. Misstear, A.A.B.; Sterckx, A.; Vargas, C.R.; Scheihing, K.; Kukuric, N. The United Nations World Water Development Report 2022: Groundwater-Making the Invisible Visible; UNESCO: Paris, France, 2022. [Google Scholar]
  2. Marc Macias-Fauria, P.J.; Zimov, N.; Maihi, Y. Pleistocene Arctic megafaunal evological engineering as a natural climate solution? Philos. Trans. R. Soc. B 2020, 375, 20190122. [Google Scholar]
  3. Ek, K.; Persson, L. Priorities and Preferences in Water Quality Management—A Case Study of the Alsteran River Basin. Water Resour. Manag. 2020, 34, 155–173. [Google Scholar]
  4. Chang, N.; Luo, L.; Wang, X.C.; Song, J.; Han, J.; Ao, D. A novel index for assessing the water quality of urban landscape lakes based on water transparency. Sci. Total Environ. 2020, 735, 139351. [Google Scholar] [PubMed]
  5. Ao, D. Reclaimed Water Reuse for Replenishing Urban Waters in Water Dificient Cities: Theories and Technologies for Landscape Water Quality Control; Xi’an University of Architecture and Technology: Xi’an, China, 2018. [Google Scholar]
  6. Wu, Q.; Xia, X.; Li, X.; Mou, X. Impacts of meteorological variations on urban lake water quality: A sensitivity analysis for 12 urban lakes with different trophic states. Aquat. Sci. 2014, 76, 339–351. [Google Scholar]
  7. Liu, J.; Sun, D.; Zhang, Y.; Li, Y. Prelassification improves relationships between water clarity, light attenuation, and suspended particulates in turbid inland waters. Hydrobiologia 2013, 711, 71–86. [Google Scholar] [CrossRef]
  8. Lee, L.-H.; Lee, Y.-D. The impact of water quality on the visual and olfactory satisfaction of tourists. Ocean Coast. Manag. 2015, 105, 92–99. [Google Scholar]
  9. Chang, N.; Zhang, Q.; Wang, Q.; Luo, L.; Wang, X.C.; Xiong, J.; Han, J. Current status and characteristics of urban landscape lakes in China. Sci. Total Environ. 2020, 712, 135669. [Google Scholar] [CrossRef]
  10. Lee, L.-H. The relationship between visual satisfaction and water clarity and quality management in tourism fishing ports. J. Water Resour. Prot. 2016, 8, 787–796. [Google Scholar] [CrossRef]
  11. Li, N.; Zhang, Y.; Shi, K.; Zhang, Y.; Sun, X.; Wang, W.; Huang, X. Monitoring water transparency, total suspended matter and the beam attenuation coefficient in inland water using innovative ground-based proximal sensing technology. J. Environ. Manag. 2022, 306, 114477. [Google Scholar]
  12. Ao, D.; Luo, L.; Dzakpasu, M.; Chen, R.; Xue, T.; Wang, X.C. Replenishment of landscape water with reclaimed water: Optimization of supply scheme using transparency as an indicator. Ecol. Indic. 2018, 88, 503–511. [Google Scholar]
  13. Yang, H.; Wang, J.; Li, J.; Zhou, H.; Liu, Z. Modelling impacts of water diversion on water quality in an urban artificial lake. Environ. Pollut. 2021, 276, 116694. [Google Scholar] [CrossRef] [PubMed]
  14. Chang, N. Study on the comrehensive index for water landscape effect assessing of urban water bodies. In Envrionmental Science and Engineering; Xi’an University of Architecture and Technology: Xi’an, China, 2020. [Google Scholar]
  15. Doron, M.; Babin, M.; Hembise, O.; Mangin, A.; Garnesson, P. Ocean transparency from space: Validation of algorithms estimating Secchi depth using MERIS, MODIS and SeaWiFS data. Remote Sens. Environ. 2011, 115, 2986–3001. [Google Scholar] [CrossRef]
  16. Shen, M.; Duan, H.; Cao, Z.; Xue, K.; Qi, T.; Ma, J.; Liu, D.; Song, K.; Huang, C.; Song, X. Sentinel-3 OLCI observations of water clarity in large lakes in eastern China: Implications for SDG 6.3.2 evaluation. Remote Sens. Environ. 2020, 247, 111950. [Google Scholar] [CrossRef]
  17. Batur, E.; Maktav, D. Assessment of surface water quality by using satellite images fusion based on PCA method in the Lake Gala, Turkey. IEEE Trans. Geosci. Remote Sens. 2018, 57, 2983–2989. [Google Scholar] [CrossRef]
  18. Shamloo, A.; Sima, S. Investigating the potential of remote sensing-based machine-learning algorithms to model Secchi-disk depth, total phosphorus, and chlorophyll-a in Lake Urmia. J. Great Lakes Res. 2024, 50, 1023700. [Google Scholar] [CrossRef]
  19. He, Y.; Lu, Z.; Wang, W.; Zhang, D.; Zhang, Y.; Qin, B.; Shi, K.; Yang, X. Water clarity mapping of global lakes using a novel hybrid deep-learning-based recurrent model with Landsat OLI images. Water Res. 2022, 215, 118241. [Google Scholar] [CrossRef]
  20. Tiyasha; Tung, T.M.; Yaseen, Z.M. Deep learning for prediction of water quality index classification: Tropical catchment environmental assessment. Nat. Resour. Res. 2021, 30, 4235–4254. [Google Scholar] [CrossRef]
  21. Fuck, J.V.R.; Cechinel, M.A.P.; Neves, J.; de Andrade, R.C.; Tristão, R.; Spogis, N.; Riella, H.G.; Soares, C.; Padoin, N. Predicting effluent quality parameters for wastewater treatment plant: A machine learning-based methodology. Chemosphere 2024, 352, 141472. [Google Scholar] [CrossRef]
  22. Li, L.; Gu, M.; Gong, C.; Hu, Y.; Wang, X.; Yang, Z.; He, Z. An advanced remote sensing retrieval method for urban non-optically active water quality parameters: An example from Shanghai. Sci. Total Environ. 2023, 880, 163389. [Google Scholar] [CrossRef] [PubMed]
  23. Ma, S.; Wu, X.; Fan, L.; Xie, Z. Predicting water flux and reverse solute flux in forward osmosis processes using artificial neural networks (ANN) modelling with structural parameters. Sep. Purif. Technol. 2024, 351, 128092. [Google Scholar] [CrossRef]
  24. Tan, M.; He, G.; Li, X.; Liu, Y.; Dong, C.; Feng, J. Prediction of the effects of preparation conditions on pervaporation performances of polydimethylsiloxane(PDMS)/ceramic composite membranes by backpropagation neural network and genetic algorithm. Sep. Purif. Technol. 2012, 89, 142–146. [Google Scholar] [CrossRef]
  25. Uddin, M.G.; Nash, S.; Olbert, A.I. A review of water quality index models and their use for assessing surface water quality. Ecol. Indic. 2021, 122, 107218. [Google Scholar]
  26. Ma, Z.; Li, H.; Ye, Z.; Wen, J.; Hu, Y.; Liu, Y. Application of modified water quality index (WQI) in the assessment of coastal water quality in main aquaculture areas of Dalian, China. Mar. Pollut. Bull. 2020, 157, 111285. [Google Scholar] [PubMed]
  27. Miller, T.; Durlik, I.; Adrianna, K.; Kisiel, A.; Cembrowska-Lech, D.; Spychalski, I.; Tuński, T. Predictive modeling of urban lake water quality using machine learning: A 20-year study. Appl. Sci. 2023, 13, 11217. [Google Scholar] [CrossRef]
  28. Zhou, Y.; Lv, Y.; Dong, J.; Yuan, J.; Hui, X. Sensitivity analysis of urban landscape lake transparency based on machine learning in Taiyuan City. Sustainability 2024, 16, 7026. [Google Scholar] [CrossRef]
  29. GB 12998-91; Water Quality-Guidance on Sampling Techniques. Ministry of Ecology and Environment of the People’s Republic of China: Beijing, China, 2009.
  30. GB 3838-2002; Environmental Quality Standards for Surface Water. Ministry of Ecology and Environment of the People’s Republic of China: Beijing, China, 2002.
  31. Ministry of Environmental Protection of China. Standard Methods for the Examination of Water and Wastewater (Version 4); China Environmental Science Press: Beijing, China, 2002.
  32. Zhang, S.; Chen, X.; Ran, X.; Li, Z.; Cao, W. Prioritizing causation in decision trees: A framework for interpretable modeling. Eng. Appl. Artif. Intell. 2024, 133, 108224. [Google Scholar]
  33. Zhang, X.; Shen, H.; Huang, T.; Wu, Y.; Guo, B.; Liu, Z.; Luo, H.; Tang, J.; Zhou, H.; Wang, L.; et al. Improved random forest algorithms for increasing the accuracy of forest aboveground biomass estimation using Sentinel-2 imagery. Ecol. Indic. 2024, 159, 111752. [Google Scholar] [CrossRef]
  34. Shaik, N.B.; Jongkittinarukorn, K.; Bingi, K. XGBoost based enhanced predictive model for handling missing input parameters: A case study on gas turbine. Case Stud. Chem. Environ. Eng. 2024, 10, 100775. [Google Scholar]
  35. Yu, Z.; Wang, Z.; Zeng, F.; Song, P.; Baffour, B.A.; Wang, P.; Wang, W.; Li, L. Volcanic lithology identification based on parameter-optimized GBDT algorithm: A case study in the Jilin Oilfield, Songliao Basin, NE China. J. Appl. Geophys. 2021, 194, 104443. [Google Scholar] [CrossRef]
  36. Zhang, J.; Lin, C.; Tang, H.; Wen, T.; Tannant, D.D.; Zhang, B. Input-parameter optimization using a SVR based ensemble model to predict landslide displacements in a reservoir area—A comparative study. Appl. Soft Comput. 2024, 150, 111107. [Google Scholar]
  37. Mignan, A.; Rinaldi, A.P.; Lanza, F.; Wiemer, S. A multi-LASSO model to forecast induced seismicity at enhanced geothermal systems. Geoenergy Sci. Eng. 2024, 236, 212746. [Google Scholar]
  38. Liu, J.; Geng, T.; Jiang, W.; Fan, S.; Chen, J.; Jia, C.; Ji, S. A new application of Elasticnet regression based near-infrared spectroscopy model: Prediction and analysis of 2,3,5,4′-tetrahydroxy stilbene-2-o-β-D-glucoside and moisture in Polygonum multiflorum. Microchem. J. 2024, 199, 110095. [Google Scholar]
  39. Li, X.; Wang, X.; He, Z.; Chen, X.; Li, Z. Combining physical laws and ANN for predicting energy consumption of data center cooling systems. Energy Build. 2024, 311, 114170. [Google Scholar]
  40. Shan, X.; Li, C.-G.; Li, F.-M. Water quality variation of a typical urban landscape river replenished with reclaimed water. Water Cycle 2023, 4, 137–144. [Google Scholar]
  41. Taheri-Garavand, A.; Beiranvandi, M.; Ahmadi, A.; Nikoloudakis, N. Predictive modeling of Satureja rechingeri essential oil yield and composition under water deficit and soil amendment conditions using artificial neural networks (ANNs). Comput. Electron. Agric. 2024, 222, 109072. [Google Scholar] [CrossRef]
  42. Ma, J.; Song, K.; Wen, Z.; Zhao, Y.; Shang, Y.; Fang, C.; Du, J. Spatial distribution of diffuse attenuation of photosynthetic active radiation and its main regulating factors in Inland Waters of Northeast China. Remote Sens. 2016, 8, 964. [Google Scholar] [CrossRef]
  43. Yang, J.; Zheng, Y.; Zhang, W.; Zhou, Y.; Zhang, Y. Comparative analysis of machine learning methods for prediction of chlorophyll-a in a river with different hydrology characteristics: A case study in Fuchun River, China. J. Environ. Manag. 2024, 364, 121386. [Google Scholar] [CrossRef]
  44. Feng, L.; Hou, X.; Zheng, Y. Monitoring and understanding the water transparency changes of fifty large lakes on the Yangtze Plain based on long-term MODIS observations. Remote Sens. Environ. 2019, 221, 675–686. [Google Scholar] [CrossRef]
  45. Zhou, Q.; Zhang, Y.; Li, K.; Huang, L.; Yang, F.; Zhou, Y.; Chang, J. Seasonal and spatial distributions of euphotic zone and long-term variations in water transparency in a clear oligotrophic Lake Fuxian, China. J. Environ. Sci. 2018, 72, 185–197. [Google Scholar] [CrossRef]
  46. Kim, J.S.; Seo, I.W.; Baek, D. Seasonally varying effects of environmental factors on phytoplankton abundance in the regulated rivers. Sci. Rep. 2019, 9, 9266. [Google Scholar] [CrossRef]
  47. Cannizzaro, J.P.; Carlson, P.R.; Yarbro, L.A.; Hu, C. Optical variability along a river plume gradient: Implications for management and remote sensing. Estuar. Coast. Shelf Sci. 2013, 131, 149–161. [Google Scholar] [CrossRef]
  48. Geng, M.; Qian, Z.; Jiang, H.; Huang, B.; Huang, S.; Deng, B.; Peng, Y.; Xie, Y.; Li, F.; Zou, Y.; et al. Assessing the impact of water-sediment factors on water quality to guide river-connected lake water environment improvement. Sci. Total Environ. 2024, 912, 168866. [Google Scholar] [CrossRef] [PubMed]
  49. Yu, Z.; Yang, K.; Luo, Y.; Yang, Y. Secchi depth inversion and its temporal and spatial variation analysis—A case study of nine plateau lakes in Yunnan Province of China. Int. J. Appl. Earth Obs. Geoinf. 2021, 100, 102344. [Google Scholar]
  50. Zheng, X.-N.; Wu, D.-X.; Huang, C.-Q.; Wu, Q.-Y.; Guan, Y.-T. Impacts of hydraulic retention time and inflow water quality on algal growth in a shallow lake supplied with reclaimed water. Water Cycle 2022, 3, 71–78. [Google Scholar]
  51. Zhou, X.; Sun, B.; Chen, G.; Zhang, Y.; Wang, H.; Gao, X.; Han, Z.; Liu, X. Water quality evolution of water-receiving lakes under the impact of multi-source water replenishments. J. Hydrol. Reg. Stud. 2024, 53, 101832. [Google Scholar]
  52. Wu, Y.; Peng, C.; Li, G.; He, F.; Huang, L.; Sun, X.; Wu, S. Integrated evaluation of the impact of water diversion on water quality index and phytoplankton assemblages of eutrophic lake: A case study of Yilong Lake. J. Environ. Manag. 2024, 357, 120707. [Google Scholar] [CrossRef]
  53. He, B.-N.; He, J.-T.; Wang, J.; Li, J.; Wang, F. Abnormal pH elevation in the Chaobai River, a reclaimed water intake area. Environ. Sci. Process. Impacts 2017, 19, 111–122. [Google Scholar]
  54. Chen, X.; Huang, X.; He, S.; Yu, X.; Sun, M.; Wang, X.; Kong, H. Pilot-scale study on preserving eutrophic landscape pond water with a combined recycling purification system. Ecol. Eng. 2013, 61, 383–389. [Google Scholar] [CrossRef]
  55. Cao, J.; Hou, Z.; Li, Z.; Chu, Z.; Yang, P.; Zheng, B. Succession of phytoplankton functional groups and their driving factors in a subtropical plateau lake. Sci. Total Environ. 2018, 631–632, 1127–1137. [Google Scholar]
  56. Zhang, Y.; Shi, K.; Zhou, Y.; Liu, X.; Qin, B. Monitoring the river plume induced by heavy rainfall events in large, shallow, Lake Taihu using MODIS 250m imagery. Remote Sens. Environ. 2016, 173, 109–121. [Google Scholar]
  57. Gao, C.; Xu, Z.; Yan, X.; Wang, G.; Lin, X.; Zhang, J.; Guo, X. Coupling the measures of pollution source control and water replenishment to improve water quality in the catchment scale of Qianshan River Basin. Environ. Pollut. 2024, 341, 122899. [Google Scholar] [PubMed]
  58. Rao, H.; Shi, X.; Rodrigue, A.K.; Feng, J.; Xia, Y.; Elhoseny, M.; Yuan, X.; Gu, L. Feature selection based on artificial bee colony and gradient boosting decision tree. Appl. Soft Comput. 2019, 74, 634–642. [Google Scholar]
  59. Sun, S.; Zhang, H.; Zhou, L.; Wang, K. Is the relationship between the perceived service quality and passenger loyalty linear or non-linear? A novel model-independent interpretation method is applied. Transp. Policy 2023, 144, 65–79. [Google Scholar]
  60. Sun, Z.; Li, Y.; Yang, Y.; Su, L.; Xie, S. Splitting tensile strength of basalt fiber reinforced coral aggregate concrete: Optimized XGBoost models and experimental validation. Constr. Build. Mater. 2024, 416, 135133. [Google Scholar]
  61. Zhang, S.; Gitungo, S.W.; Axe, L.; Raczko, R.F.; Dyksen, J.E. Biologically active filters—An advanced water treatment process for contaminants of emerging concern. Water Res. 2017, 114, 31–41. [Google Scholar]
  62. Parr, L.B.; Perkins, R.G.; Mason, C.F. Reduction in photosynthetic efficiency of Cladophora glomerata, induced by overlying canopies of Lemna spp. Water Res. 2002, 36, 1735–1742. [Google Scholar] [PubMed]
  63. Wang, Q.; Zhang, Q.; Dzakpasu, M.; Lian, B.; Wu, Y.; Wang, X.C. Development of an indicator for characterizing particle size distribution and quality of stormwater runoff. Environ. Sci. Pollut. Res. 2018, 25, 7991–8001. [Google Scholar]
  64. Dunalska, J.A. Abiotic–biotic method of water treatment in a shore of lake—A new strategy for protection of urban lakes. Ecohydrol. Hydrobiol. 2018, 18, 454–458. [Google Scholar]
Figure 1. Sampling point map: geographical focus from China to Taiyuan, Shanxi Province.
Sustainability 17 03126 g001
Figure 2. Workflow for fitting the transparency of urban landscape water bodies in Taiyuan City.
Sustainability 17 03126 g002
Figure 3. ANN topology diagram.
Sustainability 17 03126 g003
Figure 4. Evaluation of prediction accuracy for water SD in water bodies supplemented by surface water using different machine learning models: (a) RF; (b) DT; (c) MLR; (d) XGBoost; (e) GBDT; (f) SVR; (g) Elastic Net; (h) Lasso.
Sustainability 17 03126 g004
Figure 5. GBDT model calculation of the importance of water quality factors for ULLs supplemented primarily by surface water.
Sustainability 17 03126 g005
Figure 6. Evaluation of prediction accuracy for water SD in water bodies supplemented by tap water using different machine learning models: (a) RF; (b) DT; (c) MLR; (d) XGBoost; (e) GBDT; (f) SVR; (g) Elastic Net; (h) Lasso.
Sustainability 17 03126 g006
Figure 7. GBDT model calculation of the importance of water quality factors for ULLs primarily supplemented by tap water.
Sustainability 17 03126 g007
Figure 8. Evaluation of the accuracy of different machine learning models in predicting the SD of ULLs with rainwater storage functions: (a) RF; (b) DT; (c) MLR; (d) XGBoost; (e) GBDT; (f) SVR; (g) Elastic Net; (h) Lasso.
Sustainability 17 03126 g008
Figure 9. XGBoost model results for the importance of water quality factors in ULLs with rainwater storage functions.
Sustainability 17 03126 g009
Figure 10. Key factor analysis of ULLs with different water supply sources based on water transparency indicators.
Sustainability 17 03126 g010
Figure 11. Experimental process diagram for parameter optimization in simulating the transparency of ULLs supplied by surface water using the ANN model. Subfigures numbered 1 to 9 correspond to the experiment numbers in Table 2, where subfigures with the suffix “-1” display the sensitivity analysis of learning rates, while those with the suffix “-2” show the best R2 scores obtained under different hidden layer combinations.
Sustainability 17 03126 g011aSustainability 17 03126 g011bSustainability 17 03126 g011c
Figure 12. Experimental process diagram for parameter optimization in simulating the transparency of ULLs supplied by tap water using the ANN model. Subfigures numbered 1 to 9 correspond to the experiment numbers in Table 3, where subfigures with the suffix “-1” display the sensitivity analysis of learning rates, while those with the suffix “-2” show the best R2 scores obtained under different hidden layer combinations.
Sustainability 17 03126 g012aSustainability 17 03126 g012bSustainability 17 03126 g012c
Figure 13. Experimental process diagram for parameter optimization in simulating the transparency of ULLs with rainwater storage using the ANN model. Subfigures numbered 1 to 8 correspond to the experiment numbers in Table 4, where subfigures with the suffix “-1” display the sensitivity analysis of learning rates, while those with the suffix “-2” show the best R2 scores obtained under different hidden layer combinations.
Sustainability 17 03126 g013aSustainability 17 03126 g013b
Figure 14. ANN-based SD fitting and projection for ULLs supplied by surface water: (a) ANN-fitted SD surface; (b) projection and SD contour map.
Sustainability 17 03126 g014
Figure 15. ANN-based SD fitting and projection for ULLs supplied by tap water: (a) ANN-fitted SD surface; (b) projection and SD contour map.
Sustainability 17 03126 g015
Figure 16. ANN-based SD fitting and projection for ULLs with rainwater storage functions: (a) ANN-fitted SD surface; (b) projection and SD contour map.
Sustainability 17 03126 g016
Table 1. Validation results of data augmentation for Xuefu Park and Wenying Park water quality data.
Xuefu ParkIndicatorsSDCODMnHRT
Original DataAugmented DataOriginal DataAugmented DataOriginal DataAugmented Data
Xuefu ParkResidual AnalysisResidual Mean0 0 0
Residual Standard Deviation0 0 0
Difference TestT-statistic−0.03 −0.30 −0.38
p-value0.97 0.77 0.73
Skewness1.311.271.641.16−2.85−3.44
Kurtosis0.220.181.840.806.1011.01
Wenying ParkResidual AnalysisResidual Mean0 0 0
Residual Standard Deviation0 0 0
Difference TestT-statistic0.06 0.04 −0.36
p-value0.96 0.97 0.73
Skewness0.450.45−0.260.01−2.85−3.44
Kurtosis−1.19−1.25−0.26−0.646.1011.00
Table 2. Experimental and performance results of the best parameters for simulating the SD of ULLs supplied by surface water using the ANN model.
No.Experiment CombinationsOptimal CombinationPerformance Parameters
Learning RateHidden Layers 1Hidden Layers 2Learning RateHidden Layers 1Hidden Layers 2R2RMSEMAE
10.00001, 0.0001, 0.001, 0.0110, 100, 200, 40010, 100, 200, 4000.011001000.65416.29013.297
20.008, 0.01, 0.150, 100, 15050, 100, 1500.008501000.66815.94713.205
30.005, 0.007, 0.00930, 50, 7080, 100, 1200.00950800.67415.80112.691
40.008, 0.009, 0.0140, 50, 6070, 80, 900.0160800.67115.87413.319
50.0095, 0.01, 0.01555, 60, 6575, 80, 850.01555850.68415.56312.489
60.01, 0.015, 0.0250, 55, 6080, 85, 900.0250800.68615.51113.031
70.017, 0.02, 0.02545, 50, 5575, 80, 850.01745750.65016.38813.278
80.016, 0.017, 0.01843, 45, 4773, 75, 770.01645730.68715.48612.241
90.015, 0.016, 0.01744, 45, 4672, 73, 740.01545730.68615.52312.939
Table 3. Experimental and performance results of the best parameters for simulating the SD of ULLs supplied by tap water using the ANN model.
No.Experiment CombinationsOptimal CombinationPerformance Parameters
Learning RateHidden Layers 1Hidden Layers 2Learning RateHidden Layers 1Hidden Layers 2Learning RateHidden Layers 1Learning Rate
10.0001, 0.001, 0.0110, 200, 40010, 200, 4000.0014002000.79711.6869.238
20.0005, 0.001, 0.005300, 400, 500100, 200, 3000.0024002000.81011.2999.069
30.0008, 0.002, 0.004350, 400, 550150, 200, 2500.0024002500.80611.4318.744
40.0013, 0.002, 0.003380, 400, 420230, 250, 2700.00134002300.81411.1748.759
50.001, 0.0013, 0.0016390, 400, 410210, 230, 2500.00163902300.82510.8639.195
60.0015, 0.0016, 0.0017385, 390, 395220, 230, 2400.00153902200.80911.3319.038
70.0015, 0.0016, 0.0017387, 390, 393225, 230, 2350.00163872300.82610.8067.909
80.0015, 0.0016, 0.0017386, 387, 388228, 230, 2320.00163872280.82510.8498.361
90.0015, 0.0016, 0.0017386, 387, 388227, 228, 2290.00163862280.77812.2079.359
Table 4. Experimental and performance results of the best parameters for simulating the SD of ULLs with rainwater storage functions using the ANN model.
No.Experiment CombinationsOptimal CombinationPerformance Parameters
Learning RateHidden Layers 1Hidden Layers 2Learning RateHidden Layers 1Hidden Layers 2Learning RateHidden Layers 1Hidden Layers 2
10.0001, 0.001, 0.0110, 200, 40010, 200, 4000.001400100.8506.6743.662
20.0005, 0.001, 0.005300, 400, 5005, 50 1000.001300500.8506.6673.661
30.0003, 0.0005, 0.0008250, 300, 35030, 50, 700.0008300300.8546.5793.560
40.0007, 0.0008, 0.0009280, 300, 32020, 30, 400.0007280300.8536.6083.580
50.0006, 0.0007, 0.0008270, 280, 29025, 30, 350.0008290350.8546.5803.631
60.0007, 0.0008, 0.0009285, 290, 29533, 35, 370.0009285370.8536.6103.426
70.0008, 0.0009, 0.0010283, 285, 28736, 37, 380.0010285370.8566.5363.493
80.0009, 0.0010, 0.0011286, 287, 28836, 37, 380.0009287380.8556.5653.670
Table 5. Results and performance metrics of machine learning models for ULLs in Xi’an [5].
Data CollectionResearch AreaMonitoring ParametersData PointsOptimal ModelHighest Contribution (Only Those Greater Than 20%)R2MESRMESMAE
From October 2013 to September 2015Hancheng LakeSD, ISS, Chl-a, AN, NN, IP24GBDTChla (34.3%), ISS (28.3%), 0.790.000.050.03
From January to December 2015Xingqing LakeSD, ISS, Chl-a, AN, NN, IP12GBDTISS (79%)0.810.010.080.08
Disclaimer/Publisher’s Note: The statements, opinions and data contained in all publications are solely those of the individual author(s) and contributor(s) and not of MDPI and/or the editor(s). MDPI and/or the editor(s) disclaim responsibility for any injury to people or property resulting from any ideas, methods, instructions or products referred to in the content.

