
Sustainable Mobility and Shared Autonomous Vehicles: A Systematic Literature Review of Travel Behavior Impacts


Abstract
1. Introduction

| Autonomous Taxi/Robo-Taxi | Autonomous Ride-Sharing/Pooled Robo-Taxi | Autonomous Shuttle | Autonomous Bus | |
|---|---|---|---|---|
| Vehicle Type |  |  |  |  |
| Vehicle Size | 1–4 pax | 1–4 pax | 1–11 pax | 1–40 pax |
| Sharing | No public sharing | Ride-sharing | Public service | Public service |
| Service | On-demand and flexible pickup/dropoff points | On-demand and flexible pickup/dropoff points | Scheduled and Fixed pickup/dropoff points | Fixed-route scheduled or on-demand flexible service |
| Usage | Taxi | Ride-sharing | Short-distances and Access/Egress | Urban and long-distance transport |
2. Methodology
2.1. Systematic Literature Review Design
2.2. Search Strategy and Selection Criteria
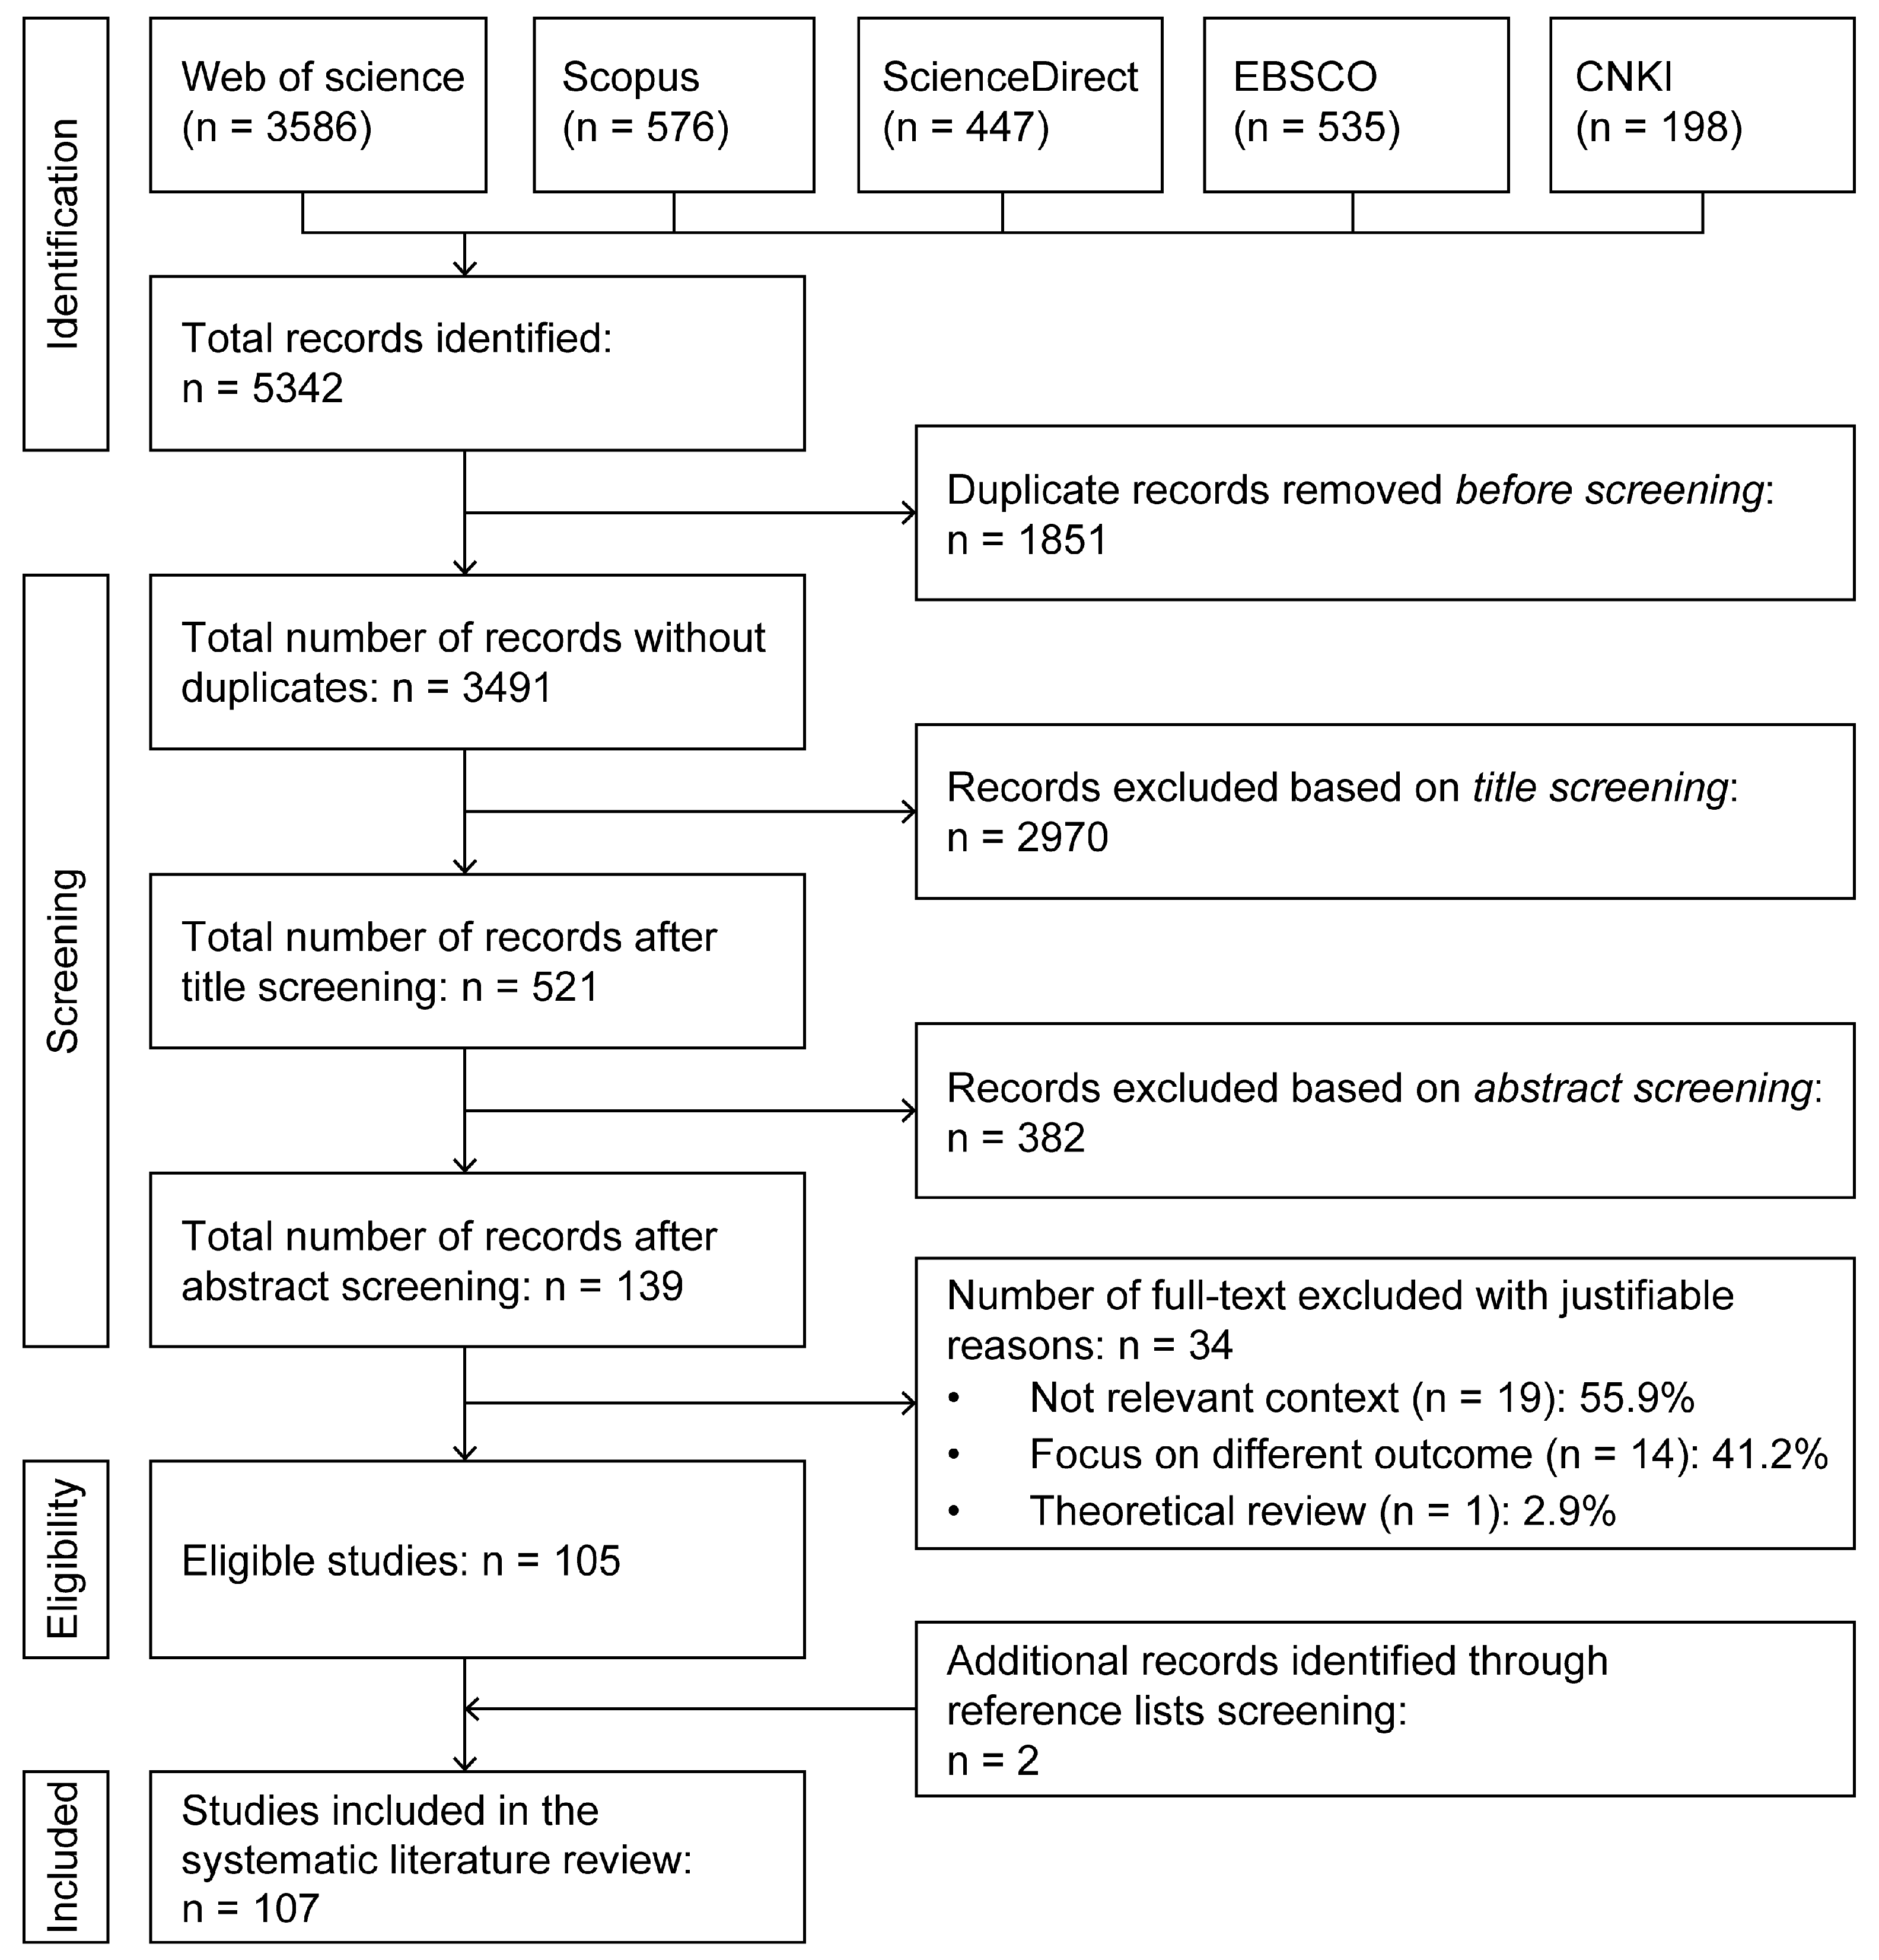
2.3. Data Collection and Screening Process
3. Findings
3.1. Descriptive Analysis
3.1.1. Temporal Distribution of Publications
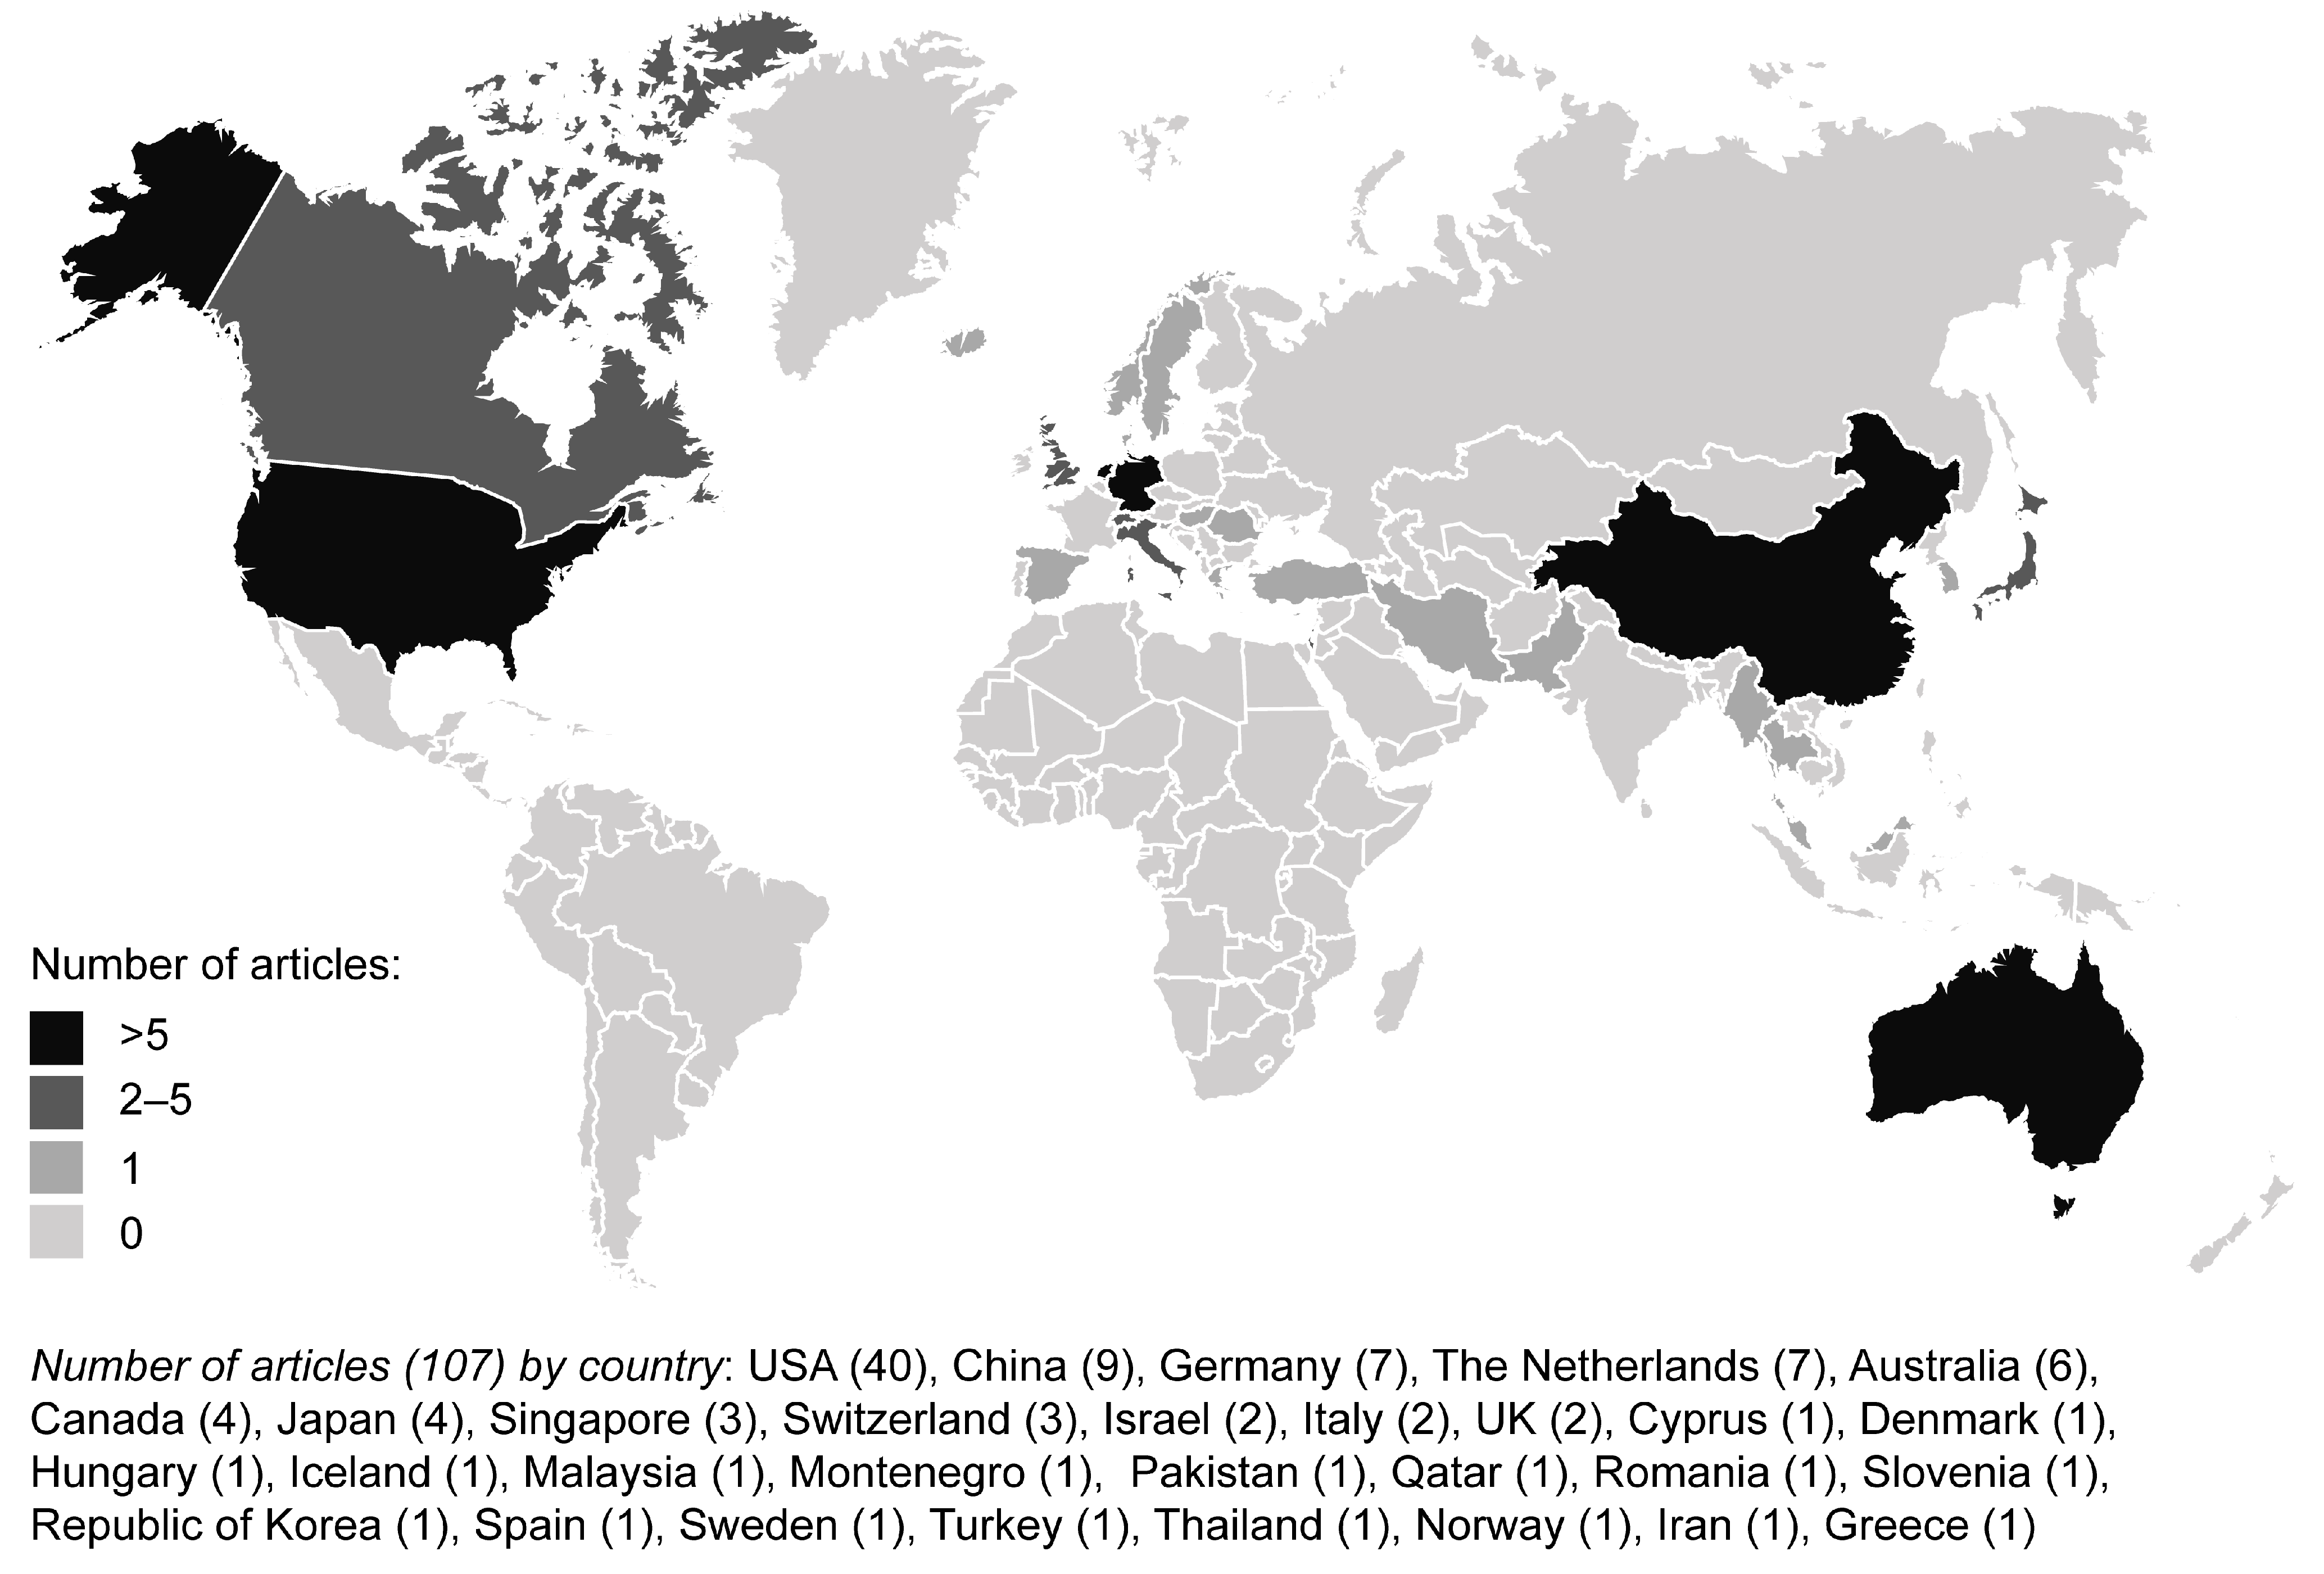
3.1.2. Geographical Distribution
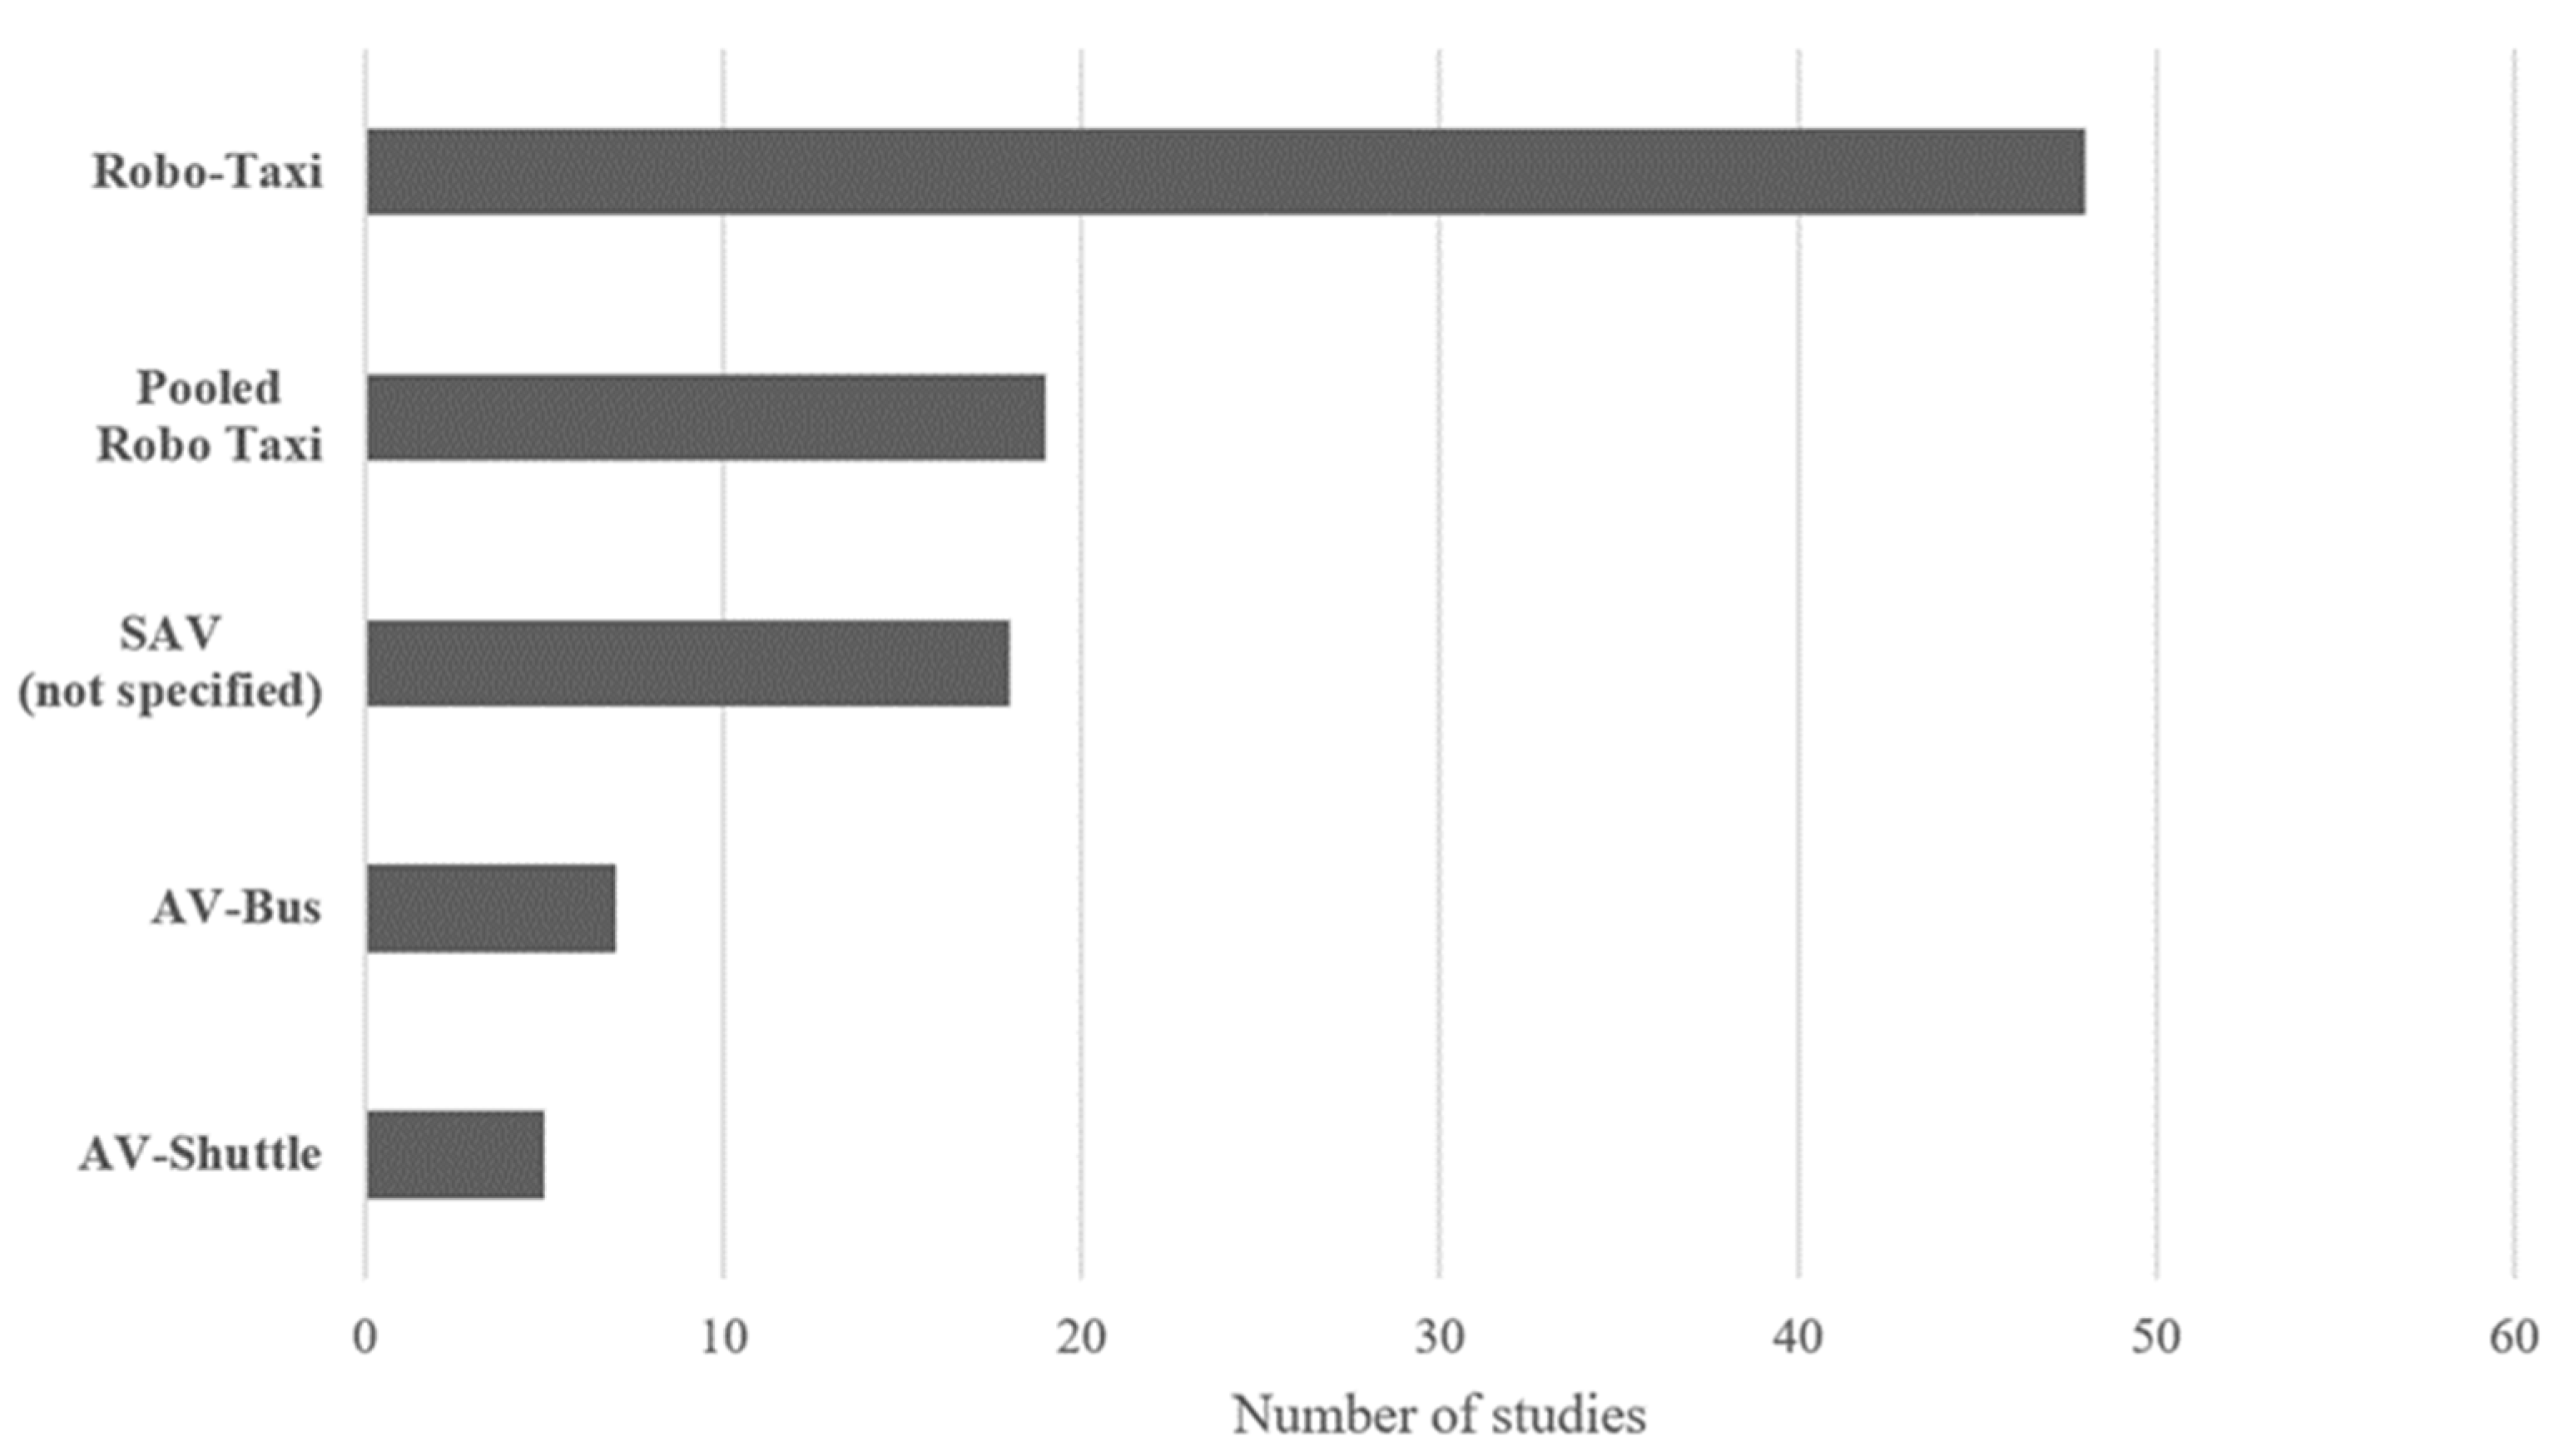
3.1.3. SAV Typologies
3.2. Impact on Travel Demand (Vehicle Miles Traveled)
3.3. Factors Influencing Travel Mode Choice and SAV Acceptability
3.3.1. User-Centric Factors of SAV Adoption
3.3.2. Contextual Factors of SAV Adoption
3.3.3. Psycho-Attitudinal Factors and SAV Acceptability
- Safety and Security Acceptance
- Social Acceptance
- Technology Acceptance
3.4. Use of Travel Time and Value of Time
4. Future Research Directions
4.1. Mode Substitution Dynamics and Travel Behavior
4.2. Geographical, Cultural, and Social Considerations
4.3. Overcoming the Intention–Behavior Gap Through Data Collection
5. Conclusions
Author Contributions
Funding
Data Availability Statement
Conflicts of Interest
Appendix A. Studies Included in the Systematic Literature Review
| No. | References | City | Country | Sample Details | Robo-Taxi | Pooled Robo-Taxi | AV-Shuttle (PAX) | AV-Bus (PAX) | SAV (n.s.) |
| 1 | Aasvik et al., 2024 [95] | Oslo | Norway | ● | |||||
| 2 | Abe et al., 2020 [143] | - | Japan | 2000 | |||||
| 3 | Abe, 2021 [106] | Tokyo | Japan | 1800 | ● | ||||
| 4 | Alhajyaseen et al., 2021 [98] | - | Qatar | 315 | ● | ||||
| 5 | Andrei et al., 2022 [100] | - | Romania | 309 | ● | ||||
| 6 | Asgari et al., 2018 [117] | - | USA | 878 | ● | ||||
| 7 | Ashkrof et al., 2019 [150] | - | The Netherlands | 663 | ● | ||||
| 8 | Asmussen et al., 2020 [148] | Austin, Texas | USA | 1127 | ● | ||||
| 9 | Bakioglu et al., 2022 [60] | Istanbul | Turkey | 323 | ● | ● | |||
| 10 | Bansal and Daziano, 2018 [129] | New York City | USA | 298 | ● | ● | |||
| 11 | Bansal et al., 2016 [47] | Austin, Texas | USA | 510 | ● | ||||
| 12 | Barbour et al., 2019 [109] | - | USA | 782 | ● | ||||
| 13 | Booth et al., 2019 [45] | Perth | Australia | 1621 | ● | ||||
| 14 | Cai et al., 2019 [92] | - | Singapore | 927 | ● | ● | |||
| 15 | Carrese et al., 2019 [68] | Rome | Italy | 201 | ● | ||||
| 16 | Cartenì, 2020 [53] | Naples | Italy | 3140 | ● | ||||
| 17 | Cordera et al., 2022 [113] | Cantabria | Spain | 296 | ● | ||||
| 18 | Correia et al., 2019 [130] | - | The Netherlands | 252 | ● | ||||
| 19 | Ding et al., 2022 [50] | - | China | 1132 | ● | ||||
| 20 | Etminani-Ghasrodashti et al., 2023 [134] | Arlington, Texas | USA | ● | |||||
| 21 | Etzioni et al., 2020 [90] | - | Cyprus, UK, Slovenia, Montenegro, Hungary, Iceland | 1669 | ● | ● | |||
| 22 | Etzioni et al., 2021 [136] | - | Israel | 713 | ● | ● | |||
| 23 | Farmer et al., 2024 [144] | Chungju | Republic of Korea | ● | |||||
| 24 | Frei et al., 2017 [118] | Chicago | USA | 103 | ● | ||||
| 25 | Fu et al., 2022 [91] | University of Alabama | USA | 424 | ● | ||||
| 26 | Gao et al., 2019 [131] | - | USA | 502 | ● | ||||
| 27 | Gkartzonikas et al., 2022 [99] | Chicago | USA | 400 | ● | ● | |||
| 28 | Guo et al., 2021 [131] | Stockholm | Sweden | 568 | ● | ||||
| 29 | Gurumurthy and Kockelman, 2020 [48] | - | USA | 2588 | ● | ● | |||
| 30 | Haboucha et al., 2017 [111] | - | Israel | 721 | ● | ||||
| 31 | Hao and Yamamoto, 2017 [19] | Nagoya | Japan | 4294 | ● | ||||
| 32 | Hao et al., 2019 [114] | Nagoya | Japan | 136 | ● | ||||
| 33 | Huo et al., 2021 [121] | - | China | 964 | ● | ||||
| 34 | Irannezhad and Mahadevan, 2022 [61] | - | Australia | 777 | ● | ● | |||
| 35 | Jabbari et al., 2022 [93] | - | USA | 757 | ● | ||||
| 36 | Kang et al., 2021 [62] | Austin, Texas | USA | 953 | ● | ● | |||
| 37 | Kashani et al., 2023 [145] | - | Iran | ● | |||||
| 38 | Kim2019 [85] | Georgia | USA | 2890 | ● | ||||
| 39 | Kolarova and Cherchi, 2021 [23] | - | Germany | 484 | ● | ||||
| 40 | Kolarova et al., 2018 [54] | - | Germany | 485 | ● | ● | |||
| 41 | Kolarova, 2019 [127] | - | Germany | 511 | ● | ||||
| 42 | König and Grippenkoven, 2020 [88] | - | Germany | 150 | ● | ● | |||
| 43 | Kontar et al., 2021 [120] | Madison, Wisconsin | USA | 805 | ● | ||||
| 44 | Krueger et al., 2016 [12] | - | Australia | 435 | ● | ● | |||
| 45 | Krueger et al., 2019 [97] | Sydney | Australia | 512 | ● | ||||
| 46 | Lavieri and Bhat, 2019 [22] | Dallas-Fort Worth Arlington, Texas | USA | 1607 | ● | ● | |||
| 47 | Li et al., 2023 [51] | Shanghai | China | 627 | ● (8–12) | ||||
| 48 | Liao et al., 2023 [142] | Chengdu | China | ● | |||||
| 49 | Maeng and Cho, 2022 [139] | - | Republic of Korea | 1000 | ● | ||||
| 50 | Nair et al., 2018 [49] | Puget Sound region | USA | 4786 | ● | ||||
| 51 | Nazari et al., 2018 [87] | Puget Sound region | USA | 4481 | ● | ||||
| 52 | Nickkar et al., 2023 [137] | - | USA | 216 | ● | ● | |||
| 53 | Paddeu et al., 2021 [24] | Bristol | UK | 123 | ● | ● | ● (15) | ||
| 54 | Pakusch et al., 2018 [11] | - | Germany | 302 | ● | ||||
| 55 | Patel et al., 2023 [146] | Arlington, Texas | USA | ● | |||||
| 56 | Piatkowski, 2021 [96] | Lincoln, Nebraska. | USA | 551 | ● | ||||
| 57 | Saeed et al., 2020 [103] | - | USA | 1922 | ● | ● | |||
| 58 | Sheldon and Dua, 2024 [132] | - | USA | 750 | ● | ||||
| 59 | Si et al., 2024 [147] | - | China | ● | |||||
| 60 | Steck et al., 2018 [128] | - | Germany | 485 | ● | ● | |||
| 61 | Stoiber et al., 2019 [124] | - | Switzerland | 709 | ● | ● | ● (4) | ||
| 62 | Susilawati and Lim, 2021 [94] | Kuala Lumpur | Malaysia | 161 | ● | ||||
| 63 | Sweet, 2021 [104] | Toronto and Hamilton, Southern Ontario | Canada | 1684 | ● | ● | |||
| 64 | Sweet, 2021 [104] | Kopenhagen | Denmark | 249 | ● (12) | ||||
| 65 | Thaithatkul et al., 2024 [89] | Bangkok | Thailand | ● | ● | ||||
| 66 | Tian et al., 2021 [17] | Dalian | China | 708 | ● | ||||
| 67 | Triantafillidi et al., 2023 [125] | Athens | Greece | ● | |||||
| 68 | Wang and Zhao, 2019 [141] | - | Singapore | 1142 | ● | ||||
| 69 | Wang et al., 2021 [116] | Greater Toronto Area | Canada | 190 | ● | ||||
| 70 | Wang et al., 2021 [116] | Lahore and Dalian | Pakistan and China | 910 | ● | ||||
| 71 | Webb et al., 2019 [101] | Brisbane, Queensland | Australia | 447 | ● | ||||
| 72 | Weiss et al., 2019 [133] | Greater Toronto Area | Canada | 217 | ● | ||||
| 73 | Weschke et al., 2021 [123] | Braunschweig and Berlin | Germany | 98 | ● | ||||
| 74 | Wicki et al., 2019 [108] | Schaffhausen | Switzerland | 773 | ● (11) | ||||
| 75 | Winter et al., 2019 [135] | - | The Netherlands | 282 | ● | ||||
| 76 | Winter et al., 2020 [55] | - | The Netherlands | 796 | ● | ||||
| 77 | Yan et al., 2024 [44] | - | China | ● | |||||
| 78 | Yao et al., 2021 [105] | - | China | 459 | ● | ||||
| 79 | Yao et al., 2022 [126] | - | China | 311 | ● | ||||
| 80 | Yap et al., 2016 [112] | - | The Netherlands | 1053 | ● | ||||
| 81 | Yin and Cherchi, 2024 [52] | - | China | 450 | ● | ||||
| 82 | Yu et al., 2023 [122] | Nanjing | China | ● | |||||
| 83 | Zhong et al., 2020 [102] | - | USA | 1881 | ● | ||||
| 84 | Zhou et al., 2020 [46] | Beijing | China | 566 | ● | ||||
| 85 | Zhou et al., 2023 [86] | - | Australia | 1433 | ● | ● |
Appendix B. Changes in Travel Demand
| Reference | City | Country | Change of Travel Demand | Reason |
| Alam et al., 2018 [63] | Halifax | Canada | 15–20% of trips served by SAVs with a corresponding 1.73–14% increase in VKT | Relocation of a shared vehicle to the next client leads to empty vehicle miles |
| Brown et al., 2014 [74] | - | USA | 50% increase in VMT among individuals aged 16–85 years | New demand from underserved populations including youth, disabled, and elderly |
| Carrese et al., 2019 [68] | Rome | Italy | VKT could decrease by 19% or increase by 13% due to SAV | Due to suburban relocation |
| Chen et al., 2016 [75] | Austin, Texas | USA | 7–9.4% increase in VMT due to SAV charging and traveler pickup | Empty vehicle miles due to charging and traveler pick-up |
| Childress et al., 2015 [69] | Puget Sound region | USA | VMT could decrease by 35% or increase by 19.6% with automated vehicles | Improved traffic flow, reduced travel times, and decreased parking costs |
| Fagnant et al., 2015 [5] | Austin, Texas | USA | 2–9% increase in VMT | Empty vehicle miles |
| Fagnant et al., 2014 [21] | Austin, Texas | USA | Up to 11% increase in VMT | Relocation results in empty vehicle miles |
| Gelauff et al., 2019 [67] | - | The Netherlands | 5–25% increase in VKT | Due to suburban relocation |
| Harb et al., 2018 [76] | San Francisco Bay Area | USA | VMT increases ranging from 4–341% | New demand from specific groups (elderly, drunk) leads to more trips |
| Harper et al., 2016 [77] | - | USA | 2–14% increase in VMT among those aged 19 years and above | New demand from underserved populations aged 19 years and above |
| Hörl et al., 2017 [78] | - | Switzerland | 28.01% and 30.57% of VKT are empty in Taxi and Taxi Pool with 1000 SAVs | Empty VKT in Taxi and Taxi Pool within a fleet of 1000 SAVs |
| Levin et al., 2017 [65] | City center Austin, Texas | USA | Up to 125% increase in VMT, dependent on fleet size | Empty vehicle miles due to repositioning dependent on fleet size |
| Loeb et al., 2019 [72] | Austin, Texas | USA | 6.7–19.54% increase in empty VMT per SAV | Empty vehicle miles resulting from SAV relocation and charging |
| Loeb et al., 2018 [71] | Austin, Texas 6-county region | USA | 9.6–31.5% increase in vacant VMT with SAV | SAEV generates more vacant VMT due to relocation and charging |
| Ma et al., 2017 [70] | New York City | USA | 2–14% increase in daily travel VMT | Empty vehicle miles due to relocation of sharing vehicles, compensated by reduced AV fleet size and optimized AV trip chains |
| Oh et al., 2020 [79] | Singapore | Singapore | 11–42% increase in VKT in different adoption scenarios, with a decrease of 8.8–20.2% in private car VKT | Empty vehicle miles under different pricing scenarios, with decreases in private car VKT |
| Pudane et al., 2018 [66] | - | The Netherlands | Increases in VMT | Reduced stress and fatigue, increased comfort, and ability to engage in non-driving activities |
| Schoettle et al., 2015 [73] | - | USA | 75% increase in annual VMT | Reductions in household vehicle ownership |
| Wadud et al., 2016 [80] | - | USA | 60% increase in overall VMT and 2–10% additional increase from new travelers | Reduction of travel cost and new demand from additional user groups (e.g., older people) |
| Zhang et al., 2017 [64] | Atlanta, Georgia | USA | 5–14% increase in VMT | Empty vehicle miles due to relocation and parking |
| Zhang et al., 2018 [81] | Atlanta Metropolitan Area | USA | 3.3% increase in VMT | Relocation of a shared vehicle to the next client leads to empty vehicle miles |
| Zhang et al., 2015 [82] | Atlanta, Georgia | USA | Up to 62.6% increase in daily VMT | Empty vehicle miles from cruising to avoid parking costs |
Appendix C. User-Centric Factors of SAV Adoption
| Categories | User-Centric Factors | |||||||||||||||||||||||
| Sub-Categories | Sociodemographic | Current Travel Habits and Mobility Needs | ||||||||||||||||||||||
| No. | References/Factors | Age (Young) | Gender (Male) | Education (High) | Income (High) | Household (Children) | Employment (Yes) | Disability/Impairment | Level of Physical Activity | Driver’s License (Yes) | Vehicle Ownership (Yes) | Transport Mode (Private Vehicle) | Transport Mode (Public Transport) | Transport Mode (Active Transport) | PT Card Owner | Car Crash History | Familiarity Ride-Sharing | Familiarity AV/SAV | Trip Purpose (Commute) | Trip Purpose (Leisure) | Commute Time | First Class Train Travel | Need to Carry Items | Yearly Mileage/Usage Freq. (High) |
| 1 | Aasvik et al., 2024 [95] | ● | ● | ● | ● | ● | ● | |||||||||||||||||
| 2 | Abe et al., 2020 [143] | ● | ● | ● | ● | ● | ● | ● | ● | ● | ||||||||||||||
| 3 | Abe, 2021 [106] | ● | ● | ● | ● | ● | ● | ● | ● | ● | ● | ● | ● | ● | ||||||||||
| 4 | Alhajyaseen et al., 2021 [98] | ● | ● | ● | ● | ● | ● | ● | ||||||||||||||||
| 5 | Andrei et al., 2022 [100] | ● | ● | ● | ● | ● | ● | ● | ● | |||||||||||||||
| 6 | Asgari et al., 2018 [117] | ● | ● | ● | ● | ● | ● | |||||||||||||||||
| 7 | Ashkrof et al., 2019 [150] | ● | ● | ● | ● | ● | ● | ● | ● | ● | ||||||||||||||
| 8 | Asmussen et al., 2020 [148] | ● | ● | ● | ● | ● | ||||||||||||||||||
| 9 | Bakioglu et al., 2022 [60] | ● | ● | ● | ● | |||||||||||||||||||
| 10 | Bansal and Daziano, 2018 [129] | |||||||||||||||||||||||
| 11 | Bansal et al., 2016 [47] | ● | ● | ● | ● | ● | ● | ● | ● | ● | ● | ● | ● | ● | ||||||||||
| 12 | Barbour et al., 2019 [109] | ● | ● | ● | ● | ● | ● | ● | ● | ● | ● | ● | ● | |||||||||||
| 13 | Booth et al., 2019 [45] | ● | ● | ● | ● | ● | ● | ● | ||||||||||||||||
| 14 | Cai et al., 2019 [92] | ● | ● | ● | ● | ● | ● | ● | ||||||||||||||||
| 15 | Carrese et al., 2019 [68] | ● | ● | ● | ● | |||||||||||||||||||
| 16 | Cartenì, 2020 [53] | ● | ● | ● | ● | ● | ● | ● | ● | ● | ||||||||||||||
| 17 | Cordera et al., 2022 [113] | ● | ● | ● | ● | ● | ● | ● | ● | |||||||||||||||
| 18 | Correia et al., 2019 [130] | ● | ● | ● | ● | ● | ● | ● | ● | ● | ● | ● | ● | |||||||||||
| 19 | Ding et al., 2022 [50] | ● | ● | ● | ● | ● | ||||||||||||||||||
| 20 | Etminani-Ghasrodashti et al., 2023 [134] | ● | ● | ● | ● | |||||||||||||||||||
| 21 | Etzioni et al., 2020 [90] | ● | ● | ● | ● | ● | ● | ● | ● | ● | ● | |||||||||||||
| 22 | Etzioni et al., 2021 [136] | ● | ● | ● | ● | ● | ● | ● | ● | |||||||||||||||
| 23 | Farmer et al., 2024 [144] | ● | ||||||||||||||||||||||
| 24 | Frei et al., 2017 [118] | ● | ● | ● | ● | ● | ● | ● | ● | ● | ● | ● | ||||||||||||
| 25 | Fu et al., 2022 [91] | ● | ● | ● | ● | ● | ● | ● | ● | ● | ||||||||||||||
| 26 | Gao et al., 2019 [131] | ● | ● | ● | ● | ● | ● | |||||||||||||||||
| 27 | Gkartzonikas et al., 2022 [99] | ● | ● | ● | ● | ● | ● | ● | ● | ● | ● | |||||||||||||
| 28 | Guo et al., 2021 [131] | ● | ● | ● | ● | ● | ● | ● | ● | |||||||||||||||
| 29 | Gurumurthy and Kockelman, 2020 [48] | ● | ● | ● | ● | ● | ● | ● | ● | ● | ● | |||||||||||||
| 30 | Haboucha et al., 2017 [111] | ● | ● | ● | ● | ● | ● | ● | ● | ● | ● | ● | ||||||||||||
| 31 | Hao and Yamamoto, 2017 [19] | ● | ● | ● | ● | ● | ● | ● | ● | |||||||||||||||
| 32 | Hao et al., 2019 [114] | ● | ● | ● | ● | ● | ||||||||||||||||||
| 33 | Huo et al., 2021 [121] | ● | ● | ● | ● | ● | ● | ● | ||||||||||||||||
| 34 | Irannezhad and Mahadevan, 2022 [61] | ● | ● | ● | ● | ● | ● | ● | ● | ● | ||||||||||||||
| 35 | Jabbari et al., 2022 [93] | ● | ● | ● | ● | ● | ● | ● | ● | ● | ||||||||||||||
| 36 | Kang et al., 2021 [62] | ● | ● | ● | ● | ● | ● | ● | ● | |||||||||||||||
| 37 | Kashani et al., 2023 [145] | ● | ||||||||||||||||||||||
| 38 | Kim2019 [85] | ● | ● | ● | ● | ● | ● | ● | ● | ● | ● | |||||||||||||
| 39 | Kolarova and Cherchi, 2021 [23] | ● | ● | ● | ● | ● | ● | ● | ● | ● | ● | ● | ||||||||||||
| 40 | Kolarova et al., 2018 [54] | ● | ● | ● | ● | ● | ● | |||||||||||||||||
| 40 | Kolarova2019 [127] | ● | ● | ● | ● | ● | ● | ● | ● | |||||||||||||||
| 42 | König and Grippenkoven, 2020 [88] | ● | ● | ● | ● | ● | ||||||||||||||||||
| 43 | Kontar et al., 2021 [120] | ● | ● | ● | ● | ● | ● | ● | ● | ● | ● | |||||||||||||
| 44 | Krueger et al., 2016 [12] | ● | ● | ● | ● | ● | ● | ● | ● | ● | ● | ● | ||||||||||||
| 45 | Krueger et al., 2019 [97] | ● | ● | ● | ● | ● | ● | ● | ● | ● | ||||||||||||||
| 46 | Lavieri and Bhat, 2019 [22] | ● | ● | ● | ● | ● | ● | ● | ● | ● | ● | ● | ● | |||||||||||
| 47 | Li et al., 2023 [51] | ● | ● | ● | ● | ● | ● | ● | ● | |||||||||||||||
| 48 | Liao et al., 2023 [142] | |||||||||||||||||||||||
| 49 | Maeng and Cho, 2022 [139] | ● | ● | ● | ● | |||||||||||||||||||
| 50 | Nair et al., 2018 [49] | ● | ● | ● | ● | ● | ● | ● | ● | |||||||||||||||
| 51 | Nazari et al., 2018 [87] | ● | ● | ● | ● | ● | ● | ● | ● | ● | ● | ● | ● | |||||||||||
| 52 | Nickkar et al., 2023 [137] | ● | ● | |||||||||||||||||||||
| 53 | Paddeu et al., 2021 [24] | ● | ● | ● | ● | ● | ● | |||||||||||||||||
| 54 | Pakusch et al., 2018 [11] | ● | ● | ● | ● | ● | ● | ● | ||||||||||||||||
| 55 | Patel et al., 2023 [146] | ● | ||||||||||||||||||||||
| 56 | Piatkowski, 2021 [96] | ● | ● | ● | ● | |||||||||||||||||||
| 57 | Saeed et al., 2020 [103] | ● | ● | ● | ● | ● | ● | ● | ||||||||||||||||
| 58 | Sheldon and Dua, 2024 [132] | ● | ● | ● | ● | ● | ● | ● | ||||||||||||||||
| 59 | Si et al., 2024 [147] | |||||||||||||||||||||||
| 60 | Steck et al., 2018 [128] | ● | ● | ● | ● | ● | ● | ● | ● | ● | ||||||||||||||
| 61 | Stoiber et al., 2019 [124] | ● | ● | |||||||||||||||||||||
| 62 | Susilawati and Lim, 2021 [94] | ● | ● | ● | ● | ● | ● | ● | ● | ● | ● | ● | ||||||||||||
| 63 | Sweet, 2021 [104] | ● | ● | ● | ● | ● | ● | ● | ● | ● | ● | ● | ● | ● | ● | ● | ||||||||
| 64 | Sweet, 2021 [104] | ● | ● | ● | ● | ● | ● | ● | ||||||||||||||||
| 65 | Thaithatkul et al., 2024 [89] | ● | ● | ● | ● | ● | ● | ● | ● | ● | ||||||||||||||
| 66 | Tian et al., 2021 [17] | ● | ● | ● | ● | ● | ● | ● | ||||||||||||||||
| 67 | Triantafillidi et al., 2023 [125] | ● | ● | ● | ● | |||||||||||||||||||
| 68 | Wang and Zhao, 2019 [141] | ● | ● | ● | ● | ● | ||||||||||||||||||
| 69 | Wang et al., 2021 [116] | ● | ● | ● | ● | ● | ● | ● | ● | ● | ● | ● | ● | |||||||||||
| 70 | Wang et al., 2021 [116] | ● | ● | ● | ● | ● | ● | ● | ● | ● | ● | |||||||||||||
| 71 | Webb et al., 2019 [101] | ● | ● | ● | ● | ● | ● | ● | ● | ● | ● | ● | ||||||||||||
| 72 | Weiss et al., 2019 [133] | ● | ● | |||||||||||||||||||||
| 73 | Weschke et al., 2021 [123] | ● | ● | ● | ● | ● | ● | ● | ● | ● | ● | |||||||||||||
| 74 | Wicki et al., 2019 [108] | ● | ● | ● | ● | ● | ● | ● | ||||||||||||||||
| 75 | Winter et al., 2019 [135] | ● | ● | ● | ● | ● | ● | |||||||||||||||||
| 76 | Winter et al., 2020 [55] | ● | ● | ● | ● | ● | ● | ● | ● | ● | ● | ● | ● | |||||||||||
| 77 | Yan et al., 2024 [44] | ● | ● | |||||||||||||||||||||
| 78 | Yao et al., 2021 [105] | ● | ● | ● | ● | ● | ● | ● | ● | ● | ● | ● | ● | |||||||||||
| 79 | Yao et al., 2022 [126] | ● | ● | ● | ● | ● | ● | ● | ● | ● | ● | ● | ||||||||||||
| 80 | Yap et al., 2016 [112] | ● | ● | ● | ● | ● | ● | ● | ● | ● | ● | ● | ● | ● | ● | |||||||||
| 81 | Yin and Cherchi, 2024 [52] | ● | ● | ● | ● | ● | ● | ● | ● | ● | ||||||||||||||
| 82 | Yu et al., 2023 [122] | ● | ● | ● | ● | ● | ||||||||||||||||||
| 83 | Zhong et al., 2020 [102] | ● | ● | ● | ● | ● | ● | |||||||||||||||||
| 84 | Zhou et al., 2020 [46] | ● | ● | ● | ● | ● | ● | ● | ● | ● | ● | ● | ● | ● | ||||||||||
| 85 | Zhou et al., 2023 [86] | ● | ● | ● | ● | ● | ● | ● | ● | ● | ||||||||||||||
Appendix D. Contextual Factors of SAV Adoption
| Categories | Contextual Factors | |||||||||||||||||||||||||
| Sub-Categories | Operational Travel Factors | SAV-Specific Features | Built Environment | |||||||||||||||||||||||
| No. | References/Factors | Travel Distance (Long Distance) | Travel Time (Higher) | Travel Cost | Accessibility/Service | Reliability (Trip Detour and Delay) | Travel Speed | Access/Egress Time | Waiting Time | Congestion Time | In-Vehicle-Time | Parking Time | Parking Cost | Weather (Bad/Cold) | Vehicle Interior | Chauffer /Monitoring | Seating | Trip delay Insurance | Preferred Lane | Liability Holder | Multitasking | Willingness-to-Pay for Automation | VOT | City size (Metropolis) | Neighborhood Density | Center vs. Rural |
| 1 | Aasvik et al., 2024 [95] | |||||||||||||||||||||||||
| 2 | Abe et al., 2020 [143] | ● | ● | ● | ● | ● | ||||||||||||||||||||
| 3 | Abe, 2021 [106] | ● | ● | ● | ● | ● | ● | ● | ● | ● | ||||||||||||||||
| 4 | Alhajyaseen et al., 2021 [98] | ● | ● | ● | ||||||||||||||||||||||
| 5 | Andrei et al., 2022 [100] | ● | ● | ● | ||||||||||||||||||||||
| 6 | Asgari et al., 2018 [117] | ● | ● | ● | ● | ● | ● | ● | ● | |||||||||||||||||
| 7 | Ashkrof et al., 2019 [150] | ● | ● | ● | ● | ● | ● | |||||||||||||||||||
| 8 | Asmussen et al., 2020 [148] | ● | ||||||||||||||||||||||||
| 9 | Bakioglu et al., 2022 [60] | ● | ● | ● | ||||||||||||||||||||||
| 10 | Bansal and Daziano, 2018 [129] | ● | ● | ● | ● | |||||||||||||||||||||
| 11 | Bansal et al., 2016 [47] | ● | ● | ● | ● | ● | ● | |||||||||||||||||||
| 12 | Barbour et al., 2019 [109] | ● | ● | ● | ● | ● | ● | |||||||||||||||||||
| 13 | Booth et al., 2019 [45] | ● | ||||||||||||||||||||||||
| 14 | Cai et al., 2019 [92] | ● | ● | ● | ● | ● | ||||||||||||||||||||
| 15 | Carrese et al., 2019 [68] | ● | ● | ● | ● | ● | ● | ● | ||||||||||||||||||
| 16 | Cartenì, 2020 [53] | ● | ● | ● | ● | ● | ||||||||||||||||||||
| 17 | Cordera et al., 2022 [113] | ● | ● | ● | ● | ● | ● | |||||||||||||||||||
| 18 | Correia et al., 2019 [130] | ● | ● | ● | ● | ● | ● | ● | ||||||||||||||||||
| 19 | Ding et al., 2022 [50] | |||||||||||||||||||||||||
| 20 | Etminani-Ghasrodashti et al., 2023 [134] | ● | ● | ● | ● | ● | ● | ● | ● | ● | ● | |||||||||||||||
| 21 | Etzioni et al., 2020 [90] | ● | ● | ● | ● | |||||||||||||||||||||
| 22 | Etzioni et al., 2021 [136] | ● | ● | ● | ● | ● | ● | ● | ● | ● | ||||||||||||||||
| 23 | Farmer et al., 2024 [144] | |||||||||||||||||||||||||
| 24 | Frei et al., 2017 [118] | ● | ● | ● | ● | ● | ● | ● | ● | ● | ● | ● | ● | |||||||||||||
| 25 | Fu et al., 2022 [91] | ● | ||||||||||||||||||||||||
| 26 | Gao et al., 2019 [131] | ● | ● | ● | ● | ● | ||||||||||||||||||||
| 27 | Gkartzonikas et al., 2022 [99] | ● | ● | ● | ||||||||||||||||||||||
| 28 | Guo et al., 2021 [131] | ● | ● | ● | ● | ● | ● | |||||||||||||||||||
| 29 | Gurumurthy and Kockelman, 2020 [48] | ● | ● | ● | ● | ● | ● | |||||||||||||||||||
| 30 | Haboucha et al., 2017 [111] | ● | ● | ● | ||||||||||||||||||||||
| 31 | Hao and Yamamoto, 2017 [19] | ● | ● | ● | ● | ● | ||||||||||||||||||||
| 32 | Hao et al., 2019 [114] | ● | ● | |||||||||||||||||||||||
| 33 | Huo et al., 2021 [121] | ● | ● | ● | ● | ● | ● | |||||||||||||||||||
| 34 | Irannezhad and Mahadevan, 2022 [61] | ● | ● | |||||||||||||||||||||||
| 35 | Jabbari et al., 2022 [93] | ● | ● | ● | ● | |||||||||||||||||||||
| 36 | Kang et al., 2021 [62] | ● | ● | ● | ● | ● | ● | |||||||||||||||||||
| 37 | Kashani et al., 2023 [145] | ● | ● | ● | ● | ● | ● | ● | ● | |||||||||||||||||
| 38 | Kim2019 [85] | ● | ● | ● | ● | |||||||||||||||||||||
| 39 | Kolarova and Cherchi, 2021 [23] | ● | ● | ● | ● | ● | ||||||||||||||||||||
| 40 | Kolarova et al., 2018 [54] | ● | ● | ● | ● | |||||||||||||||||||||
| 40 | Kolarova2019 [127] | ● | ● | ● | ● | ● | ● | |||||||||||||||||||
| 42 | König and Grippenkoven, 2020 [88] | ● | ● | ● | ||||||||||||||||||||||
| 43 | Kontar et al., 2021 [120] | ● | ● | ● | ● | ● | ||||||||||||||||||||
| 44 | Krueger et al., 2016 [12] | ● | ● | ● | ● | ● | ||||||||||||||||||||
| 45 | Krueger et al., 2019 [97] | ● | ● | ● | ● | ● | ● | |||||||||||||||||||
| 46 | Lavieri and Bhat, 2019 [22] | ● | ● | ● | ● | ● | ● | |||||||||||||||||||
| 47 | Li et al., 2023 [51] | ● | ● | ● | ● | ● | ||||||||||||||||||||
| 48 | Liao et al., 2023 [142] | |||||||||||||||||||||||||
| 49 | Maeng and Cho, 2022 [139] | ● | ● | ● | ● | |||||||||||||||||||||
| 50 | Nair et al., 2018 [49] | ● | ||||||||||||||||||||||||
| 51 | Nazari et al., 2018 [87] | ● | ● | ● | ||||||||||||||||||||||
| 52 | Nickkar et al., 2023 [137] | ● | ● | ● | ● | ● | ● | ● | ● | ● | ● | |||||||||||||||
| 53 | Paddeu et al., 2021 [24] | ● | ● | ● | ● | ● | ● | |||||||||||||||||||
| 54 | Pakusch et al., 2018 [11] | ● | ||||||||||||||||||||||||
| 55 | Patel et al., 2023 [146] | ● | ● | ● | ● | ● | ● | ● | ● | ● | ● | ● | ● | ● | ● | |||||||||||
| 56 | Piatkowski, 2021 [96] | ● | ● | ● | ● | |||||||||||||||||||||
| 57 | Saeed et al., 2020 [103] | ● | ||||||||||||||||||||||||
| 58 | Sheldon and Dua, 2024 [132] | ● | ● | ● | ● | ● | ||||||||||||||||||||
| 59 | Si et al., 2024 [147] | ● | ||||||||||||||||||||||||
| 60 | Steck et al., 2018 [128] | ● | ● | ● | ● | ● | ● | |||||||||||||||||||
| 61 | Stoiber et al., 2019 [124] | ● | ● | ● | ● | ● | ● | |||||||||||||||||||
| 62 | Susilawati and Lim, 2021 [94] | ● | ● | ● | ● | ● | ||||||||||||||||||||
| 63 | Sweet, 2021 [104] | ● | ● | ● | ● | ● | ||||||||||||||||||||
| 64 | Sweet, 2021 [104] | ● | ● | ● | ● | ● | ● | ● | ||||||||||||||||||
| 65 | Thaithatkul et al., 2024 [89] | ● | ● | |||||||||||||||||||||||
| 66 | Tian et al., 2021 [17] | ● | ● | ● | ● | ● | ||||||||||||||||||||
| 67 | Triantafillidi et al., 2023 [125] | ● | ● | ● | ● | ● | ● | ● | ● | ● | ● | |||||||||||||||
| 68 | Wang and Zhao, 2019 [141] | ● | ● | ● | ||||||||||||||||||||||
| 69 | Wang et al., 2021 [116] | ● | ● | ● | ● | |||||||||||||||||||||
| 70 | Wang et al., 2021 [116] | ● | ● | ● | ● | ● | ||||||||||||||||||||
| 71 | Webb et al., 2019 [101] | ● | ● | ● | ● | |||||||||||||||||||||
| 72 | Weiss et al., 2019 [133] | ● | ● | ● | ● | |||||||||||||||||||||
| 73 | Weschke et al., 2021 [123] | ● | ● | ● | ● | ● | ● | |||||||||||||||||||
| 74 | Wicki et al., 2019 [108] | ● | ● | ● | ● | ● | ● | ● | ||||||||||||||||||
| 75 | Winter et al., 2019 [135] | ● | ● | ● | ● | ● | ● | ● | ||||||||||||||||||
| 76 | Winter et al., 2020 [55] | ● | ● | ● | ● | ● | ● | ● | ● | |||||||||||||||||
| 77 | Yan et al., 2024 [44] | |||||||||||||||||||||||||
| 78 | Yao et al., 2021 [105] | ● | ● | ● | ● | ● | ● | ● | ● | |||||||||||||||||
| 79 | Yao et al., 2022 [126] | ● | ● | ● | ||||||||||||||||||||||
| 80 | Yap et al., 2016 [112] | ● | ● | ● | ● | ● | ● | ● | ● | |||||||||||||||||
| 81 | Yin and Cherchi, 2024 [52] | ● | ● | ● | ● | ● | ● | ● | ● | |||||||||||||||||
| 82 | Yu et al., 2023 [122] | |||||||||||||||||||||||||
| 83 | Zhong et al., 2020 [102] | ● | ● | ● | ● | ● | ||||||||||||||||||||
| 84 | Zhou et al., 2020 [46] | ● | ● | ● | ||||||||||||||||||||||
| 85 | Zhou et al., 2023 [86] | ● | ● | ● | ● | ● | ||||||||||||||||||||
Appendix E. Psycho-Attitudinal Factors
| Categories | Psycho-Attitudinal Influences | |||||||||||
| Sub-Categories | Attitude | |||||||||||
| No. | References/Factors | Ride-Sharing (Strangers) | Ride-Sharing (Family/Friends) | Safety Concerns/Trust | Time Sensitivity | Attitude towards PT | Attitude towards SAV | Technology Interest | Enjoyment Driving | Environmental Attitude | Privacy Concern | Social Influence |
| 1 | Aasvik et al., 2024 [95] | ● | ● | ● | ● | ● | ||||||
| 2 | Abe et al., 2020 [143] | ● | ● | ● | ||||||||
| 3 | Abe, 2021 [106] | ● | ● | |||||||||
| 4 | Alhajyaseen et al., 2021 [98] | |||||||||||
| 5 | Andrei et al., 2022 [100] | |||||||||||
| 6 | Asgari et al., 2018 [117] | ● | ● | ● | ● | |||||||
| 7 | Ashkrof et al., 2019 [150] | ● | ● | ● | ● | ● | ||||||
| 8 | Asmussen et al., 2020 [148] | ● | ● | ● | ● | |||||||
| 9 | Bakioglu et al., 2022 [60] | ● | ● | |||||||||
| 10 | Bansal and Daziano, 2018 [129] | ● | ||||||||||
| 11 | Bansal et al., 2016 [47] | ● | ● | ● | ● | ● | ● | ● | ● | |||
| 12 | Barbour et al., 2019 [109] | ● | ● | |||||||||
| 13 | Booth et al., 2019 [45] | ● | ● | |||||||||
| 14 | Cai et al., 2019 [92] | ● | ● | ● | ● | |||||||
| 15 | Carrese et al., 2019 [68] | ● | ● | |||||||||
| 16 | Cartenì, 2020 [53] | ● | ● | ● | ● | |||||||
| 17 | Cordera et al., 2022 [113] | |||||||||||
| 18 | Correia et al., 2019 [130] | ● | ● | ● | ● | ● | ||||||
| 19 | Ding et al., 2022 [50] | ● | ● | ● | ||||||||
| 20 | Etminani-Ghasrodashti et al., 2023 [134] | ● | ● | ● | ● | ● | ● | ● | ||||
| 21 | Etzioni et al., 2020 [90] | ● | ||||||||||
| 22 | Etzioni et al., 2021 [136] | ● | ● | ● | ● | |||||||
| 23 | Farmer et al., 2024 [144] | ● | ● | ● | ||||||||
| 24 | Frei et al., 2017 [118] | ● | ||||||||||
| 25 | Fu et al., 2022 [91] | ● | ● | ● | ● | ● | ||||||
| 26 | Gao et al., 2019 [131] | |||||||||||
| 27 | Gkartzonikas et al., 2022 [99] | ● | ● | ● | ● | ● | ● | |||||
| 28 | Guo et al., 2021 [131] | ● | ● | ● | ● | |||||||
| 29 | Gurumurthy and Kockelman, 2020 [48] | ● | ● | ● | ||||||||
| 30 | Haboucha et al., 2017 [111] | ● | ● | ● | ● | ● | ● | |||||
| 31 | Hao and Yamamoto, 2017 [19] | |||||||||||
| 32 | Hao et al., 2019 [114] | ● | ● | |||||||||
| 33 | Huo et al., 2021 [121] | ● | ● | |||||||||
| 34 | Irannezhad and Mahadevan, 2022 [61] | ● | ● | ● | ● | |||||||
| 35 | Jabbari et al., 2022 [93] | ● | ||||||||||
| 36 | Kang et al., 2021 [62] | ● | ● | ● | ● | |||||||
| 37 | Kashani et al., 2023 [145] | ● | ● | ● | ● | ● | ● | ● | ||||
| 38 | Kim2019 [85] | ● | ● | ● | ● | ● | ||||||
| 39 | Kolarova and Cherchi, 2021 [23] | ● | ● | |||||||||
| 40 | Kolarova et al., 2018 [54] | ● | ||||||||||
| 40 | Kolarova2019 [127] | ● | ||||||||||
| 42 | König and Grippenkoven, 2020 [88] | ● | ||||||||||
| 43 | Kontar et al., 2021 [120] | |||||||||||
| 44 | Krueger et al., 2016 [12] | ● | ||||||||||
| 45 | Krueger et al., 2019 [97] | |||||||||||
| 46 | Lavieri and Bhat, 2019 [22] | ● | ● | ● | ● | ● | ||||||
| 47 | Li et al., 2023 [51] | ● | ● | ● | ● | ● | ||||||
| 48 | Liao et al., 2023 [142] | ● | ● | ● | ● | |||||||
| 49 | Maeng and Cho, 2022 [139] | |||||||||||
| 50 | Nair et al., 2018 [49] | |||||||||||
| 51 | Nazari et al., 2018 [87] | ● | ● | ● | ● | |||||||
| 52 | Nickkar et al., 2023 [137] | ● | ● | |||||||||
| 53 | Paddeu et al., 2021 [24] | ● | ● | ● | ||||||||
| 54 | Pakusch et al., 2018 [11] | ● | ||||||||||
| 55 | Patel et al., 2023 [146] | ● | ● | ● | ● | ● | ● | ● | ● | |||
| 56 | Piatkowski, 2021 [96] | ● | ● | |||||||||
| 57 | Saeed et al., 2020 [103] | ● | ● | ● | ||||||||
| 58 | Sheldon and Dua, 2024 [132] | ● | ● | ● | ||||||||
| 59 | Si et al., 2024 [147] | ● | ● | ● | ● | ● | ||||||
| 60 | Steck et al., 2018 [128] | ● | ||||||||||
| 61 | Stoiber et al., 2019 [124] | ● | ||||||||||
| 62 | Susilawati and Lim, 2021 [94] | ● | ● | |||||||||
| 63 | Sweet, 2021 [104] | ● | ||||||||||
| 64 | Sweet, 2021 [104] | |||||||||||
| 65 | Thaithatkul et al., 2024 [89] | ● | ||||||||||
| 66 | Tian et al., 2021 [17] | |||||||||||
| 67 | Triantafillidi et al., 2023 [125] | ● | ● | ● | ● | |||||||
| 68 | Wang and Zhao, 2019 [141] | ● | ● | ● | ||||||||
| 69 | Wang et al., 2021 [116] | |||||||||||
| 70 | Wang et al., 2021 [116] | |||||||||||
| 71 | Webb et al., 2019 [101] | ● | ● | |||||||||
| 72 | Weiss et al., 2019 [133] | ● | ● | |||||||||
| 73 | Weschke et al., 2021 [123] | ● | ||||||||||
| 74 | Wicki et al., 2019 [108] | ● | ● | ● | ||||||||
| 75 | Winter et al., 2019 [135] | ● | ● | |||||||||
| 76 | Winter et al., 2020 [55] | ● | ||||||||||
| 77 | Yan et al., 2024 [44] | ● | ● | ● | ● | ● | ● | |||||
| 78 | Yao et al., 2021 [105] | ● | ● | |||||||||
| 79 | Yao et al., 2022 [126] | ● | ● | ● | ||||||||
| 80 | Yap et al., 2016 [112] | ● | ● | ● | ● | ● | ● | |||||
| 81 | Yin and Cherchi, 2024 [52] | ● | ||||||||||
| 82 | Yu et al., 2023 [122] | ● | ● | |||||||||
| 83 | Zhong et al., 2020 [102] | |||||||||||
| 84 | Zhou et al., 2020 [46] | ● | ● | |||||||||
| 85 | Zhou et al., 2023 [86] | ● | ● | |||||||||
Appendix F. Usage of Travel Time and Value of Time
| City | Country | Usage of Travel Time and Value of Time | Comparison | |
| Andrei et al., 2022 [100] | - | Romania | VOT is 34.4% lower than cars. | SAV vs. Car |
| Asgari et al., 2018 [117] | - | USA | Median travel time savings of 15.9 min per trip for SAVs. | SAV vs. Car |
| Correia et al., 2019 [130] | - | The Netherlands | VOT for AV-office travelers is 26% lower (EUR 5.50/h); for AV-leisure, it is 9.4% higher (EUR 8.17/h) than conventional cars. | SAV-office/SAV-leisure vs. Car |
| Etzioni et al., 2020 [90] | - | Slovenia, Cyprus, UK, Hungary, Montenegro | Variations in VOT among seven EU countries could relate to cultural differences, sample size, or economic disparities. | VOT across EU Countries vs. GDP Per Capita |
| Etzioni et al., 2020 (Iceland) [90] | - | Iceland | Iceland’s VOT for SAVs is notably higher than for cars, reflecting possible wealth and user type effects. | SAV vs. Car in Iceland |
| Frei et al., 2017 [118] | Chicago | USA | SAV VOT is 29% higher than cars, 15% higher than public transport. | SAV vs. Car and Public Transport |
| Gao et al., 2019 [131] | - | USA | Multitasking reduces VOT by approximately 50% in SAVs, though VOT remains 15% higher than that for personal cars. | SAV vs. Car (Mentioning Multitasking) |
| Gkartzonikas et al., 2022 [99] | Chicago | USA | VTTS is lower for SAVs than for single-passenger AVs. | Robo-taxi vs. Pooled |
| Kang et al., 2021 [62] | Austin, Texas | USA | VOT is USD 27.80/hr for commute, USD 19.40/h for shopping, USD 10.70/h for leisure; willingness to share costs is USD 0.62, USD 1.70, and USD 1.32, respectively. | Different Trip Types |
| Kolarova et al., 2018 [54] | - | Germany | SAV VOT is 30% lower for low income, 13% for high income compared to cars. | SAV vs. Car across Income Levels |
| Kolarova et al., 2019 [127] | - | Germany | In-vehicle time differences not found across trip purposes or income classes; SAV VOT EUR 6.2 (low), EUR 11 (high). | SAV vs. AV and Car (across Trip Types and Income Classes) |
| Kolarova et al., 2021 [23] | - | Germany | SAV VTTS is 18% lower for public transport, 28% for personal AVs; age, education, and ADAS experience influence VTTS. | Psychological Factors in AV vs. PAV and PT |
| Krueger et al., 2016 [12] | - | Australia | Robo-taxi travel time around 25% lower than pooled. | Robo-taxi vs. Pooled |
| Lavieri et al., 2019 [22] | Dallas-Fort Worth, Arlington, Texas | USA | Willing to pay 14% more to reduce commute time vs. leisure in private AVs, 84% more to avoid additional passenger in leisure trips. | Private AV vs. Shared AV (Commute vs. Leisure) |
| Paddeu et al., 2021 [24] | Bristol | UK | Post-experiment VOT for own car increased by 15.3%, for AV taxi by 29.2%; shared AV taxi decreased by 0.07%. | VOT Pre- and Post-Experiment across Various SAV Modes |
| Steck et al., 2018 [128] | - | Germany | VTTS for SAVs higher than for AVs but 10% lower than for driving oneself. | SAV vs. AV and Car |
| Sweet et al., 2021 [104] | Toronto and Hamilton, Ontario | Canada | Driverless cars are seen as a penalty by commuters compared to public transport. | SAV vs. Public Transport |
| Weschke et al., 2021 [123] | Braunschweig and Berlin | Germany | VOT after exposure changed to EUR 5.25/h in Braunschweig and EUR 3.68/h in Berlin. | VOT Pre and Post Experiment in Germany |
| Wicki et al., 2019 [108] | Schaffhausen | Switzerland | VTTS for travel time is CHF 10.2 to 10.8/h, and for waiting time CHF 15.6 to 16.8/h. | AV-Bus vs. Regular Bus |
| Winter et al., 2019 [135] | - | The Netherlands | Preference for self-driving buses over regular buses for short trips due to higher VOT. | AV-Bus vs. Regular Bus for Short Trips |
| Yap et al., 2016 [112] | - | The Netherlands | SAV is 28% higher VOT than cars; egress VOT is three times public transport, 17% higher than bikes. | SAV vs. First-Mile Alternatives and Car |
| Yin et al., 2024 [52] | - | China | Chinese respondents willing to pay on average EUR 3.61 to save one hour of travel time. | AV Features in China |
References
- Fagnant, D.J.; Kockelman, K.M. Dynamic ride-sharing and fleet sizing for a system of shared autonomous vehicles in Austin, Texas. Transportation 2018, 45, 143–158. [Google Scholar] [CrossRef]
- Meyer, J.; Becker, H.; Bösch, P.M.; Axhausen, K.W. Autonomous vehicles: The next jump in accessibilities? Res. Transp. Econ. 2017, 62, 80–91. [Google Scholar] [CrossRef]
- Shaheen, S.; Cohen, A. Shared ride services in North America: Definitions, impacts, and the future of pooling. Transp. Rev. 2019, 39, 427–442. [Google Scholar] [CrossRef]
- Bansal, P.; Kockelman, K.M. Are we ready to embrace connected and self-driving vehicles? A case study of Texans. Transportation 2018, 45, 641–675. [Google Scholar] [CrossRef]
- Fagnant, D.J.; Kockelman, K. Preparing a nation for autonomous vehicles: Opportunities, barriers and policy recommendations. Transp. Res. Part A Policy Pract. 2015, 77, 167–181. [Google Scholar] [CrossRef]
- Dai, J.; Li, R.; Liu, Z.; Lin, S. Impacts of the introduction of autonomous taxi on travel behaviors of the experienced user: Evidence from a one-year paid taxi service in Guangzhou, China. Transp. Res. Part C Emerg. Technol. 2021, 130, 103311. [Google Scholar] [CrossRef]
- Webb, N.; Smith, D.; Ludwick, C.; Victor, T.; Hommes, Q.; Favaro, F.; Ivanov, G.; Daniel, T. Waymo’s Safety Methodologies and Safety Readiness Determinations. arXiv 2020, arXiv:2011.00054. Available online: http://arxiv.org/abs/2011.00054 (accessed on 5 May 2024).
- Yao, X.; Ma, S.; Bai, Y.; Jia, N. When are new energy vehicle incentives effective? Empirical evidence from 88 pilot cities in China. Transp. Res. Part A Policy Pract. 2022, 165, 207–224. [Google Scholar] [CrossRef]
- Californian Department of Motor Vehicles “Disengagement Reports” California DMV. Available online: https://www.dmv.ca.gov/portal/vehicle-industry-services/autonomous-vehicles/disengagement-reports/ (accessed on 30 April 2024).
- Zhou, R.; Zhang, G.; Huang, H.; Wei, Z.; Zhou, H.; Jin, J.; Chang, F.; Chen, J. How would autonomous vehicles behave in real-world crash scenarios? Accid. Anal. Prev. 2024, 202, 107572. [Google Scholar] [CrossRef]
- Pakusch, C.; Stevens, G.; Boden, A.; Bossauer, P. Unintended Effects of Autonomous Driving: A Study on Mobility Preferences in the Future. Sustainability 2018, 10, 2404. [Google Scholar] [CrossRef]
- Krueger, R.; Rashidi, T.H.; Rose, J.M. Preferences for shared autonomous vehicles. Transp. Res. Part C Emerg. Technol. 2016, 69, 343–355. [Google Scholar] [CrossRef]
- Mao, W.; Shepherd, S.; Harrison, G.; Xu, M. Autonomous vehicle market development in Beijing: A system dynamics approach. Transp. Res. Part A Policy Pract. 2024, 179, 103889. [Google Scholar] [CrossRef]
- Golbabaei, F.; Yigitcanlar, T.; Bunker, J. The role of shared autonomous vehicle systems in delivering smart urban mobility: A systematic review of the literature. Int. J. Sustain. Transp. 2021, 15, 731–748. [Google Scholar] [CrossRef]
- Jing, P.; Xu, G.; Chen, Y.; Shi, Y.; Zhan, F. The determinants behind the acceptance of autonomous vehicles: A systematic review. Sustainability 2020, 12, 1719. [Google Scholar] [CrossRef]
- Narayanan, S.; Chaniotakis, E.; Antoniou, C. Shared autonomous vehicle services: A comprehensive review. Transp. Res. Part C Emerg. Technol. 2020, 111, 255–293. [Google Scholar] [CrossRef]
- Tian, Z.; Feng, T.; Timmermans, H.J.P.; Yao, B. Using autonomous vehicles or shared cars? Results of a stated choice experiment. Transp. Res. Part C Emerg. Technol. 2021, 128, 103117. [Google Scholar] [CrossRef]
- Chng, S.; Anowar, S.; Cheah, L. Understanding Shared Autonomous Vehicle Preferences: A Comparison between Shuttles, Buses, Ridesharing and Taxis. Sustainability 2022, 14, 13656. [Google Scholar] [CrossRef]
- Hao, M.; Yamamoto, T. Analysis on supply and demand of shared autonomous vehicles considering household vehicle ownership and shared use. In Proceedings of the 2017 IEEE 20th International Conference on Intelligent Transportation Systems (ITSC), Yokohama, Japan, 16–19 October 2017; pp. 185–190. [Google Scholar]
- Shaheen, S.A. Mobility and the sharing economy. Transp. Policy 2016, 51, 141–142. [Google Scholar] [CrossRef]
- Fagnant, D.J.; Kockelman, K.M. The travel and environmental implications of shared autonomous vehicles, using agent-based model scenarios. Transp. Res. Part C Emerg. Technol. 2014, 40, 1–13. [Google Scholar] [CrossRef]
- Lavieri, P.S.; Bhat, C.R. Modeling individuals’ willingness to share trips with strangers in an autonomous vehicle future. Transp. Res. Part A Policy Pract. 2019, 124, 242–261. [Google Scholar] [CrossRef]
- Kolarova, V.; Cherchi, E. Impact of trust and travel experiences on the value of travel time savings for autonomous driving. Transp. Res. Part C Emerg. Technol. 2021, 131, 103354. [Google Scholar] [CrossRef]
- Paddeu, D.; Tsouros, I.; Parkhurst, G.; Polydoropoulou, A.; Shergold, I. A study of users’ preferences after a brief exposure in a Shared Autonomous Vehicle (SAV). Transp. Res. Procedia 2021, 52, 533–540. [Google Scholar] [CrossRef]
- Becker, F.; Axhausen, K.W. Literature review on surveys investigating the acceptance of automated vehicles. Transportation 2017, 44, 1293–1306. [Google Scholar] [CrossRef]
- Carrese, F.; Sportiello, S.; Zhaksylykov, T.; Colombaroni, C.; Carrese, S.; Papaveri, M.; Patella, S.M. The Integration of Shared Autonomous Vehicles in Public Transportation Services: A Systematic Review. Sustainability 2023, 15, 13023. [Google Scholar] [CrossRef]
- Gkartzonikas, C.; Gkritza, K. What have we learned? A review of stated preference and choice studies on autonomous vehicles. Transp. Res. Part C Emerg. Technol. 2019, 98, 323–337. [Google Scholar] [CrossRef]
- Rahman, M.; Thill, J.-C. What Drives People’s Willingness to Adopt Autonomous Vehicles? A Review of Internal and External Factors. Sustainability 2023, 15, 11541. [Google Scholar] [CrossRef]
- Soteropoulos, A.; Berger, M.; Ciari, F. Impacts of automated vehicles on travel behaviour and land use: An international review of modelling studies. Transp. Rev. 2019, 39, 29–49. [Google Scholar] [CrossRef]
- Bala, H.; Anowar, S.; Chng, S.; Cheah, L. Review of studies on public acceptability and acceptance of shared autonomous mobility services: Past, present and future. Transp. Rev. 2023, 0, 1–27. [Google Scholar] [CrossRef]
- Hao, M.; Yamamoto, T. Shared Autonomous Vehicles: A Review Considering Car Sharing and Autonomous Vehicles. Asian Transp. Stud. 2018, 5, 47–63. [Google Scholar] [CrossRef]
- Cook, D.J. The Relation between Systematic Reviews and Practice Guidelines. Ann. Intern. Med. 1997, 127, 210. [Google Scholar] [CrossRef]
- Cook, D.J.; Mulrow, C.D.; Haynes, R.B. Systematic Reviews: Synthesis of Best Evidence for Clinical Decisions. Ann. Intern. Med. 1997, 126, 376–380. [Google Scholar] [CrossRef] [PubMed]
- Snyder, H. Literature review as a research methodology: An overview and guidelines. J. Bus. Res. 2019, 104, 333–339. [Google Scholar] [CrossRef]
- Snyder, H. Designing the literature review for a strong contribution. J. Decis. Syst. 2023, 33, 551–558. [Google Scholar] [CrossRef]
- Tranfield, D.; Denyer, D.; Smart, P. Towards a Methodology for Developing Evidence-Informed Management Knowledge by Means of Systematic Review. Br. J. Manag. 2003, 14, 207–222. [Google Scholar] [CrossRef]
- Denyer, D.; Tranfield, D. Producing a systematic review. In The Sage Handbook of Organizational Research Methods; Sage Publications Ltd.: Thousand Oaks, CA, USA, 2009; pp. 671–689. ISBN 978-1-4129-3118-2. [Google Scholar]
- Rousseau, D.M.; Manning, J.; Denyer, D. Evidence in Management and Organizational Science: Assembling the Field’s Full Weight of Scientific Knowledge through Syntheses. SSRN Electron. J. 2008, 2, 475–515. [Google Scholar] [CrossRef]
- Whittemore, R.; Knafl, K. The integrative review: Updated methodology. J. Adv. Nurs. 2005, 52, 546–553. [Google Scholar] [CrossRef]
- Faisal, A.; Yigitcanlar, T.; Kamruzzaman; Currie, G. Understanding autonomous vehicles: A systematic literature review on capability, impact, planning and policy. J. Transp. Land Use 2019, 12, 45–72. [Google Scholar] [CrossRef]
- Ali, A.; Mahfouz, A.; Arisha, A. Analysing supply chain resilience: Integrating the constructs in a concept mapping framework via a systematic literature review. Supply Chain Manag. Int. J. 2017, 22, 16–39. [Google Scholar] [CrossRef]
- Hossain, M. Sharing economy: A comprehensive literature review. Int. J. Hosp. Manag. 2020, 87, 102470. [Google Scholar] [CrossRef]
- Scipioni, S.; Dini, G.; Niccolini, F. Exploring circular shipbuilding: A systematic review on circular economy business models and supporting technologies. J. Clean. Prod. 2023, 422, 138470. [Google Scholar] [CrossRef]
- Yan, F.; Shi, Z.; Liu, J. Do Sustainability Concerns Play a Key Role in Influencing Individuals’ Acceptance after Experiencing Shared Autonomous Vehicles? A Field Experiment in China. Int. J. Hum.–Comput. Interact. 2024, 41, 834–847. [Google Scholar] [CrossRef]
- Booth, L.; Norman, R.; Pettigrew, S. The potential implications of autonomous vehicles for active transport. J. Transp. Health 2019, 15, 100623. [Google Scholar] [CrossRef]
- Zhou, F.; Zheng, Z.; Whitehead, J.; Washington, S.; Perrons, R.K.; Page, L. Preference heterogeneity in mode choice for car-sharing and shared automated vehicles. Transp. Res. Part A Policy Pract. 2020, 132, 633–650. [Google Scholar] [CrossRef]
- Bansal, P.; Kockelman, K.M.; Singh, A. Assessing public opinions of and interest in new vehicle technologies: An Austin perspective. Transp. Res. Part C Emerg. Technol. 2016, 67, 1–14. [Google Scholar] [CrossRef]
- Gurumurthy, K.M.; Kockelman, K.M. Modeling Americans’ autonomous vehicle preferences: A focus on dynamic ride-sharing, privacy & long-distance mode choices. Technol. Forecast. Soc. Change 2020, 150, 119792. [Google Scholar] [CrossRef]
- Nair, G.S.; Astroza, S.; Bhat, C.R.; Khoeini, S.; Pendyala, R.M. An application of a rank ordered probit modeling approach to understanding level of interest in autonomous vehicles. Transportation 2018, 45, 1623–1637. [Google Scholar] [CrossRef]
- Ding, Y.; Li, R.; Wang, X.; Schmid, J. Heterogeneity of autonomous vehicle adoption behavior due to peer effects and prior-AV knowledge. Transportation 2022, 49, 1837–1860. [Google Scholar] [CrossRef]
- Li, H.; Jin, Z.; Cui, H.; Tu, H. An exploration of the preferences and mode choice behavior between autonomous demand-responsive transit and traditional buses. Int. J. Transp. Sci. Technol. 2023, 15, 81–101. [Google Scholar] [CrossRef]
- Yin, H.; Cherchi, E. Willingness to pay for automated taxis: A stated choice experiment to measure the impact of in-vehicle features and customer reviews. Transportation 2024, 51, 51–72. [Google Scholar] [CrossRef]
- Cartenì, A. The acceptability value of autonomous vehicles: A quantitative analysis of the willingness to pay for shared autonomous vehicles (SAVs) mobility services. Transp. Res. Interdiscip. Perspect. 2020, 8, 100224. [Google Scholar] [CrossRef]
- Kolarova, V.; Steck, F.; Cyganski, R.; Trommer, S. Estimation of the value of time for automated driving using revealed and stated preference methods. Assess. Wider Impacts Transp. Policies 2018, 31, 35–46. [Google Scholar] [CrossRef]
- Winter, K.; Cats, O.; Martens, K.; Van Arem, B. Identifying user classes for shared and automated mobility services. Eur. Transp. Res. Rev. 2020, 12, 36. [Google Scholar] [CrossRef]
- Jain, D.; Tiwari, G. Explaining travel behaviour with limited socio-economic data: Case study of Vishakhapatnam, India. Travel Behav. Soc. 2019, 15, 44–53. [Google Scholar] [CrossRef]
- Pojani, D.; Stead, D. Sustainable Urban Transport in the Developing World: Beyond Megacities. Sustainability 2015, 7, 7784–7805. [Google Scholar] [CrossRef]
- Manaugh, K.; Badami, M.G.; El-Geneidy, A.M. Integrating social equity into urban transportation planning: A critical evaluation of equity objectives and measures in transportation plans in North America. Transp. Policy 2015, 37, 167–176. [Google Scholar] [CrossRef]
- Rode, P.; Heeckt, C.; Ahrend, R.; Huerta Melchor, O.; Alexis, R.; Badstuber, N.E.; Hoolachan, A.A.R.; Kwami, C.S. Integrating National Policies to Deliver Compact, Connected Cities: An Overview of Transport and Housing. Coalition for Urban Transit: Washington, DC, USA, 2017; Available online: https://eprints.lse.ac.uk/100124/1/Rode_Integrating_National_Policies_Published_2017.pdf (accessed on 1 May 2024).
- Bakioglu, G.; Salehin, M.F.; Wang, K.; Atahan, A.O.; Habib, K.N. Examination of the role of safety concerns from autonomous vehicle ownership choice: Results of a stated choice experiment in Istanbul, Turkey. Transp. Lett. 2022, 14, 1172–1183. [Google Scholar] [CrossRef]
- Irannezhad, E.; Mahadevan, R. Examining factors influencing the adoption of solo, pooling and autonomous ride-hailing services in Australia. Transp. Res. Part C Emerg. Technol. 2022, 136, 103524. [Google Scholar] [CrossRef]
- Kang, S.; Mondal, A.; Bhat, A.C.; Bhat, C.R. Pooled versus private ride-hailing: A joint revealed and stated preference analysis recognizing psycho-social factors. Transp. Res. Part C Emerg. Technol. 2021, 124, 102906. [Google Scholar] [CrossRef]
- Alam, M.J.; Habib, M.A. Investigation of the Impacts of Shared Autonomous Vehicle Operation in Halifax, Canada Using a Dynamic Traffic Microsimulation Model. Procedia Comput. Sci. 2018, 130, 496–503. [Google Scholar] [CrossRef]
- Zhang, W.; Guhathakurta, S. Parking Spaces in the Age of Shared Autonomous Vehicles: How Much Parking Will We Need and Where? Transp. Res. Rec. J. Transp. Res. Board 2017, 2651, 80–91. [Google Scholar] [CrossRef]
- Levin, M.W.; Kockelman, K.M.; Boyles, S.D.; Li, T. A general framework for modeling shared autonomous vehicles with dynamic network-loading and dynamic ride-sharing application. Comput. Environ. Urban Syst. 2017, 64, 373–383. [Google Scholar] [CrossRef]
- Pudāne, B.; Molin, E.J.E.; Arentze, T.A.; Maknoon, Y.; Chorus, C.G. A Time-use Model for the Automated Vehicle-era. Transp. Res. Part C Emerg. Technol. 2018, 93, 102–114. [Google Scholar] [CrossRef]
- Gelauff, G.; Ossokina, I.; Teulings, C. Spatial and welfare effects of automated driving: Will cities grow, decline or both? Transp. Res. Part A Policy Pract. 2019, 121, 277–294. [Google Scholar] [CrossRef]
- Carrese, S.; Nigro, M.; Patella, S.M.; Toniolo, E. A preliminary study of the potential impact of autonomous vehicles on residential location in Rome. Res. Transp. Econ. 2019, 75, 55–61. [Google Scholar] [CrossRef]
- Childress, S.; Nichols, B.; Charlton, B.; Coe, S. Using an Activity-Based Model to Explore the Potential Impacts of Automated Vehicles. Transp. Res. Rec. J. Transp. Res. Board 2015, 2493, 99–106. [Google Scholar] [CrossRef]
- Ma, J.; Li, X.; Zhou, F.; Hao, W. Designing optimal autonomous vehicle sharing and reservation systems: A linear programming approach. Transp. Res. Part C Emerg. Technol. 2017, 84, 124–141. [Google Scholar] [CrossRef]
- Loeb, B.; Kockelman, K.M.; Liu, J. Shared autonomous electric vehicle (SAEV) operations across the Austin, Texas network with charging infrastructure decisions. Transp. Res. Part C Emerg. Technol. 2018, 89, 222–233. [Google Scholar] [CrossRef]
- Loeb, B.; Kockelman, K.M. Fleet performance and cost evaluation of a shared autonomous electric vehicle (SAEV) fleet: A case study for Austin, Texas. Transp. Res. Part A Policy Pract. 2019, 121, 374–385. [Google Scholar] [CrossRef]
- Schoettle, B.; Sivak, M. Potential Impact of Self-Driving Vehicles on Household Vehicle Demand and Usage; University of Michigan, Ann Arbor, Transportation Research Institute: Ann Arbor, MI, USA, 2015; Technical Report; Available online: http://deepblue.lib.umich.edu/handle/2027.42/110789 (accessed on 24 February 2024).
- Brown, A.; Gonder, J.; Repac, B. An Analysis of Possible Energy Impacts of Automated Vehicles. In Road Vehicle Automation; Meyer, G., Beiker, S., Eds.; Springer International Publishing: Cham, Switzerland, 2014; pp. 137–153. [Google Scholar] [CrossRef]
- Chen, T.D.; Kockelman, K.M. Management of a Shared Autonomous Electric Vehicle Fleet: Implications of Pricing Schemes. Transp. Res. Rec. J. Transp. Res. Board 2016, 2572, 37–46. [Google Scholar] [CrossRef]
- Harb, M.; Xiao, Y.; Circella, G.; Mokhtarian, P.L.; Walker, J.L. Projecting travelers into a world of self-driving vehicles: Estimating travel behavior implications via a naturalistic experiment. Transportation 2018, 45, 1671–1685. [Google Scholar]
- Harper, C.D.; Hendrickson, C.T.; Mangones, S.; Samaras, C. Estimating potential increases in travel with autonomous vehicles for the non-driving, elderly and people with travel-restrictive medical conditions. Transp. Res. Part C Emerg. Technol. 2016, 72, 1–9. [Google Scholar] [CrossRef]
- Hörl, S. Agent-based simulation of autonomous taxi services with dynamic demand responses. In Proceedings of the 8th International Conference on Ambient Systems, Networks and Technologies, ANT-2017 and the 7th International Conference on Sustainable Energy Information Technology, SEIT 2017, Madeira, Portugal, 16–19 May 2017; Volume 109, pp. 899–904. [Google Scholar] [CrossRef]
- Oh, S.; Seshadri, R.; Azevedo, C.L.; Kumar, N.; Basak, K.; Ben-Akiva, M. Assessing the impacts of automated mobility-on-demand through agent-based simulation: A study of Singapore. Transp. Res. Part A Policy Pract. 2020, 138, 367–388. [Google Scholar] [CrossRef]
- Wadud, Z.; MacKenzie, D.; Leiby, P. Help or hindrance? The travel, energy and carbon impacts of highly automated vehicles. Transp. Res. Part A Policy Pract. 2016, 86, 1–18. [Google Scholar] [CrossRef]
- Zhang, W.; Guhathakurta, S.; Khalil, E.B. The impact of private autonomous vehicles on vehicle ownership and unoccupied VMT generation. Transp. Res. Part C Emerg. Technol. 2018, 90, 156–165. [Google Scholar] [CrossRef]
- Zhang, W.; Guhathakurta, S.; Fang, J.; Zhang, G. Exploring the impact of shared autonomous vehicles on urban parking demand: An agent-based simulation approach. Sustain. Cities Soc. 2015, 19, 34–45. [Google Scholar] [CrossRef]
- Murphy, J.J.; Allen, P.G.; Stevens, T.; Weatherhead, D.A. A Meta-Analysis of Hypothetical Bias in Stated Preference Valuation. SSRN Electron. J. 2003, 30, 313–325. [Google Scholar] [CrossRef]
- Loomis, J. What’s to Know About Hypothetical Bias in Stated Preference Valuation Studies? J. Econ. Surv. 2011, 25, 363–370. [Google Scholar] [CrossRef]
- Kim, S.H.; Circella, G.; Mokhtarian, P.L. Identifying latent mode-use propensity segments in an all-AV era. Transp. Res. Part Policy Pract. 2019, 130, 192–207. [Google Scholar] [CrossRef]
- Zhou, C.; Zhao, X.; Xie, D.; Bi, J. Understanding individuals’ choice-making mechanism in trip chains of shared autonomous vehicles. Travel Behav. Soc. 2023, 33, 100619. [Google Scholar] [CrossRef]
- Nazari, F.; Noruzoliaee, M.; Mohammadian, A. (Kouros) Shared versus private mobility: Modeling public interest in autonomous vehicles accounting for latent attitudes. Transp. Res. Part C Emerg. Technol. 2018, 97, 456–477. [Google Scholar] [CrossRef]
- König, A.; Grippenkoven, J. Travellers’ willingness to share rides in autonomous mobility on demand systems depending on travel distance and detour. Travel Behav. Soc. 2020, 21, 188–202. [Google Scholar] [CrossRef]
- Thaithatkul, P.; Chalermpong, S.; Kenney, L.; Ratanawaraha, A. Understanding determinants of preferences for autonomous vehicles in the global south: Private, shared, or pooled rides in Bangkok, Thailand. Transp. Res. Interdiscip. Perspect. 2024, 28, 101290. [Google Scholar] [CrossRef]
- Etzioni, S.; Hamadneh, J.; Elvarsson, A.B.; Esztergár-Kiss, D.; Djukanovic, M.; Neophytou, S.N.; Sodnik, J.; Polydoropoulou, A.; Tsouros, I.; Pronello, C.; et al. Modeling Cross-National Differences in Automated Vehicle Acceptance. Sustainability 2020, 12, 9765. [Google Scholar] [CrossRef]
- Fu, X.; Nie, Q.; Liu, J.; Zhang, Z.; Jones, S. How do college students perceive future shared mobility with autonomous Vehicles? A survey of the University of Alabama students. Int. J. Transp. Sci. Technol. 2022, 11, 189–204. [Google Scholar] [CrossRef]
- Cai, Y.; Wang, H.; Ong, G.P.; Meng, Q.; Lee, D.-H. Investigating user perception on autonomous vehicle (AV) based mobility-on-demand (MOD) services in Singapore using the logit kernel approach. Transportation 2019, 46, 2063–2080. [Google Scholar] [CrossRef]
- Jabbari, P.; Auld, J.; MacKenzie, D. How do perceptions of safety and car ownership importance affect autonomous vehicle adoption? Travel Behav. Soc. 2022, 28, 128–140. [Google Scholar] [CrossRef]
- Susilawati; Lim, T.S. A study of the scheduling effect on shared autonomous vehicles adoption. Transp. Res. Interdiscip. Perspect. 2021, 10, 100394. [Google Scholar] [CrossRef]
- Aasvik, O.; Ulleberg, P.; Hagenzieker, M. Simplifying acceptance: A general acceptance factor predicting intentions to use shared autonomous vehicles. Transp. Res. Part F Traffic Psychol. Behav. 2024, 107, 1125–1143. [Google Scholar] [CrossRef]
- Piatkowski, D.P. Autonomous Shuttles: What Do Users Expect and How Will They Use Them? J. Urban Technol. 2021, 28, 97–115. [Google Scholar] [CrossRef]
- Krueger, R.; Rashidi, T.H.; Dixit, V.V. Autonomous driving and residential location preferences: Evidence from a stated choice survey. Transp. Res. Part C Emerg. Technol. 2019, 108, 255–268. [Google Scholar] [CrossRef]
- Alhajyaseen, W.; Adnan, M.; Abuhejleh, A.; Onat, N.; Tarlochan, F. Travelers’ preferences regarding autonomous mobility in the State of Qatar. Pers. Ubiquitous Comput. 2021, 25, 141–149. [Google Scholar] [CrossRef]
- Gkartzonikas, C.; Losada-Rojas, L.; Christ, S.; Pyrialakou, V.D.; Gkritza, K. A multi-group analysis of the behavioral intention to ride in autonomous vehicles: Evidence from three U.S. metropolitan areas. Transportation 2022, 50, 635–675. [Google Scholar] [CrossRef]
- Andrei, L.; Luca, O.; Gaman, F. Insights from User Preferences on Automated Vehicles: Influence of Socio-Demographic Factors on Value of Time in Romania Case. Sustainability 2022, 14, 10828. [Google Scholar] [CrossRef]
- Webb, J.; Wilson, C.; Kularatne, T. Will people accept shared autonomous electric vehicles? A survey before and after receipt of the costs and benefits. Econ. Anal. Policy 2019, 61, 118–135. [Google Scholar] [CrossRef]
- Zhong, H.; Li, W.; Burris, M.W.; Talebpour, A.; Sinha, K.C. Will autonomous vehicles change auto commuters’ value of travel time? Transp. Res. Part A Transp. Environ. 2020, 83, 102303. [Google Scholar] [CrossRef]
- Saeed, T.U.; Burris, M.W.; Labi, S.; Sinha, K.C. An empirical discourse on forecasting the use of autonomous vehicles using consumers’ preferences. Technol. Forecast. Soc. Change 2020, 158, 120130. [Google Scholar] [CrossRef]
- Sweet, M.N. User interest in on-demand, shared, and driverless mobility: Evidence from stated preference choice experiments in Southern Ontario. Travel Behav. Soc. 2021, 23, 120–133. [Google Scholar] [CrossRef]
- Yao, R.; Yang, L.; Wang, Z. Leasing Behavior for Autonomous Vehicles Considering Latent Variables. Dalian Univ. Technol. 2021, 56, 1153–1160. [Google Scholar]
- Abe, R. Preferences of urban rail users for first- and last-mile autonomous vehicles: Price and service elasticities of demand in a multimodal environment. Transp. Res. Part C Emerg. Technol. 2021, 126, 103105. [Google Scholar] [CrossRef]
- Wang, K.; Salehin, M.F.; Nurul Habib, K. A discrete choice experiment on consumer’s willingness-to-pay for vehicle automation in the Greater Toronto Area. Transp. Res. Part A Policy Pract. 2021, 149, 12–30. [Google Scholar] [CrossRef]
- Wicki, M.; Guidon, S.; Becker, F.; Axhausen, K.; Bernauer, T. How technology commitment affects mode choice for a self-driving shuttle service. Res. Transp. Bus. Manag. 2019, 32, 100458. [Google Scholar] [CrossRef]
- Barbour, N.; Menon, N.; Zhang, Y.; Mannering, F. Shared automated vehicles: A statistical analysis of consumer use likelihoods and concerns. Transp. Policy 2019, 80, 86–93. [Google Scholar] [CrossRef]
- Wang, X.; Lin, X.; Li, M. Aggregate modeling and equilibrium analysis of the crowdsourcing market for autonomous vehicles. Transp. Res. Part C Emerg. Technol. 2021, 132, 103362. [Google Scholar] [CrossRef]
- Haboucha, C.J.; Ishaq, R.; Shiftan, Y. User preferences regarding autonomous vehicles. Transp. Res. Part C Emerg. Technol. 2017, 78, 37–49. [Google Scholar] [CrossRef]
- Yap, M.D.; Correia, G.; van Arem, B. Preferences of travellers for using automated vehicles as last mile public transport of multimodal train trips. Transp. Res. Part A Policy Pract. 2016, 94, 1–16. [Google Scholar] [CrossRef]
- Cordera, R.; González-González, E.; Nogués, S.; Arellana, J.; Moura, J.L. Modal Choice for the Driverless City: Scenario Simulation Based on a Stated Preference Survey. J. Adv. Transp. 2022, 2022, e1108272. [Google Scholar] [CrossRef]
- Hao, M.; Li, Y.; Yamamoto, T. Public Preferences and Willingness to Pay for Shared Autonomous Vehicles Services in Nagoya, Japan. Smart Cities 2019, 2, 230–244. [Google Scholar] [CrossRef]
- Thorhauge, M.; Fjendbo Jensen, A.; Rich, J. Effects of autonomous first- and last mile transport in the transport chain. Transp. Res. Interdiscip. Perspect. 2022, 15, 100623. [Google Scholar] [CrossRef]
- Wang, Z.; Safdar, M.; Zhong, S.; Liu, J.; Xiao, F. Public Preferences of Shared Autonomous Vehicles in Developing Countries: A Cross-National Study of Pakistan and China. J. Adv. Transp. 2021, 2021, e5141798. [Google Scholar] [CrossRef]
- Asgari, H.; Jin, X.; Corkery, T. A Stated Preference Survey Approach to Understanding Mobility Choices in Light of Shared Mobility Services and Automated Vehicle Technologies in the U.S. Transp. Res. Rec. J. Transp. Res. Board 2018, 2672, 12–22. [Google Scholar] [CrossRef]
- Frei, C.; Hyland, M.; Mahmassani, H.S. Flexing service schedules: Assessing the potential for demand-adaptive hybrid transit via a stated preference approach. Transp. Res. Part C Emerg. Technol. 2017, 76, 71–89. [Google Scholar] [CrossRef]
- Tian, L.-J.; Sheu, J.-B.; Huang, H.-J. The morning commute problem with endogenous shared autonomous vehicle penetration and parking space constraint. Transp. Res. Part B Methodol. 2019, 123, 258–278. [Google Scholar] [CrossRef]
- Kontar, W.; Ahn, S.; Hicks, A. Autonomous vehicle adoption: Use phase environmental implications. Environ. Res. Lett. 2021, 16, 064010. [Google Scholar] [CrossRef]
- Huo, Y.; Guo, C.; Zhu, Y.; Feng, C. Use Intention Model of Shared Autonomous Vehicles and Its Impact Factors. Dongbei Univ. 2021, 42, 1057–1064. [Google Scholar]
- Yu, J.; Li, W.; Song, Z.; Wang, S.; Ma, J.; Wang, B. The role of attitudinal features on shared autonomous vehicles. Res. Transp. Bus. Manag. 2023, 50, 101032. [Google Scholar] [CrossRef]
- Weschke, J.; Bahamonde-Birke, F.J.; Gade, K.; Kazagli, E. Asking the Wizard-of-Oz: How experiencing autonomous buses affects preferences towards their use for feeder trips in public transport. Transp. Res. Part C Emerg. Technol. 2021, 133, 103454. [Google Scholar] [CrossRef]
- Stoiber, T.; Schubert, I.; Hoerler, R.; Burger, P. Will consumers prefer shared and pooled-use autonomous vehicles? A stated choice experiment with Swiss households. Transp. Res. Part A Transp. Environ. 2019, 71, 265–282. [Google Scholar] [CrossRef]
- Triantafillidi, E.; Tzouras, P.G.; Spyropoulou, I.; Kepaptsoglou, K. Identification of Contributory Factors That Affect the Willingness to Use Shared Autonomous Vehicles. Future Transp. 2023, 3, 970–985. [Google Scholar] [CrossRef]
- Yao, R.; Long, M.; Zhang, W.; Qi, W. User Preferences for Shared Autonomous Vehicles Based on Latent-Class Logit Model. Dalian Univ. Technol. 2022, 40, 135–144. [Google Scholar]
- Kolarova, V.; Steck, F.; Bahamonde-Birke, F.J. Assessing the effect of autonomous driving on value of travel time savings: A comparison between current and future preferences. Transp. Res. Part A Policy Pract. 2019, 129, 155–169. [Google Scholar] [CrossRef]
- Steck, F.; Kolarova, V.; Bahamonde-Birke, F.; Trommer, S.; Lenz, B. How Autonomous Driving May Affect the Value of Travel Time Savings for Commuting. Transp. Res. Rec. J. Transp. Res. Board 2018, 2672, 11–20. [Google Scholar] [CrossRef]
- Bansal, P.; Daziano, R.A. Influence of choice experiment designs on eliciting preferences for autonomous vehicles. Transp. Surv. Methods Era Big Datafacing Chall. 2018, 32, 474–481. [Google Scholar] [CrossRef]
- Correia, G.H.D.A.; Looff, E.; Van Cranenburgh, S.; Snelder, M.; Van Arem, B. On the impact of vehicle automation on the value of travel time while performing work and leisure activities in a car: Theoretical insights and results from a stated preference survey. Transp. Res. Part A Policy Pract. 2019, 119, 359–382. [Google Scholar] [CrossRef]
- Gao, J.; Ranjbari, A.; MacKenzie, D. Would being driven by others affect the value of travel time? Ridehailing as an analogy for automated vehicles. Transportation 2019, 46, 2103–2116. [Google Scholar] [CrossRef]
- Sheldon, T.L.; Dua, R. Consumer preferences for ride-hailing: Barriers to an autonomous, shared, and electric future. J. Clean. Prod. 2024, 434, 140251. [Google Scholar] [CrossRef]
- Weiss, A.; Salehin, M.F.; Nurul Habib, K. A Joint RP-off-SP Survey to Understand the Impacts of Autonomous Vehicle 1 on Travel Mode Choices in the Greater Toronto Area. In Proceedings of the Transportation Research Board 98th Annual Meeting, Washington, DC, USA, 13–17 January 2019. [Google Scholar]
- Etminani-Ghasrodashti, R.; Kermanshachi, S.; Rosenberger, J.M.; Foss, A. Exploring motivating factors and constraints of using and adoption of shared autonomous vehicles (SAVs). Transp. Res. Interdiscip. Perspect. 2023, 18, 100794. [Google Scholar] [CrossRef]
- Winter, K.; Wien, J.; Molin, E.; Cats, O.; Morsink, P.; Van Arem, B. Taking The Self-Driving Bus: A Passenger Choice Experiment. In Proceedings of the 2019 6th International Conference on Models and Technologies for Intelligent Transportation Systems (MT-ITS), Cracow, Poland, 5–7 June 2019; IEEE: Cracow, Poland, 2019; pp. 1–8. [Google Scholar]
- Etzioni, S.; Daziano, R.A.; Ben-Elia, E.; Shiftan, Y. Preferences for shared automated vehicles: A hybrid latent class modeling approach. Transp. Res. Part C Emerg. Technol. 2021, 125, 103013. [Google Scholar] [CrossRef]
- Nickkar, A.; Lee, Y.-J.; Shin, H.-S. Willingness-to-pay for shared automated mobility using an adaptive choice-based conjoint analysis during the COVID-19 period. Travel Behav. Soc. 2023, 30, 11–20. [Google Scholar] [CrossRef]
- Guo, J.; Susilo, Y.; Antoniou, C.; Pernestål, A. When and why do people choose automated buses over conventional buses? Results of a context-dependent stated choice experiment. Sustain. Cities Soc. 2021, 69, 102842. [Google Scholar] [CrossRef]
- Maeng, K.; Cho, Y. Who will want to use shared autonomous vehicle service and how much? A consumer experiment in South Korea. Travel Behav. Soc. 2022, 26, 9–17. [Google Scholar] [CrossRef]
- Payre, W.; Cestac, J.; Delhomme, P. Fully Automated Driving: Impact of Trust and Practice on Manual Control Recovery. Hum. Factors J. Hum. Factors Ergon. Soc. 2016, 58, 229–241. [Google Scholar] [CrossRef] [PubMed]
- Wang, S.; Zhao, J. Risk preference and adoption of autonomous vehicles. Transp. Res. Part Policy Pract. 2019, 126, 215–229. [Google Scholar] [CrossRef]
- Liao, Y.; Guo, H.; Liu, X. A Study of Young People’s Intention to Use Shared Autonomous Vehicles: A Quantitative Analysis Model Based on the Extended TPB-TAM. Sustainability 2023, 15, 11825. [Google Scholar] [CrossRef]
- Abe, R.; Kita, Y.; Fukuda, D. An Experimental Approach to Understanding the Impacts of Monitoring Methods on Use Intentions for Autonomous Vehicle Services: Survey Evidence from Japan. Sustainability 2020, 12, 2157. [Google Scholar] [CrossRef]
- Farmer, D.; Kim, H.; Lee, J. The Relationship Between Exposure to and Trust in Automated Transport Technologies and Intention to Use a Shared Autonomous Vehicle. Int. J. Hum.–Comput. Interact. 2024, 40, 5897–5909. [Google Scholar] [CrossRef]
- Kashani, M.A.; Abbasi, M.; Mamdoohi, A.R.; Sierpiński, G. The Role of Attitude, Travel-Related, and Socioeconomic Characteristics in Modal Shift to Shared Autonomous Vehicles with Ride Sharing. World Electr. Veh. J. 2023, 14, 23. [Google Scholar] [CrossRef]
- Patel, R.K.; Etminani-Ghasrodashti, R.; Kermanshachi, S.; Rosenberger, J.M.; Pamidimukkala, A.; Foss, A. Identifying individuals’ perceptions, attitudes, preferences, and concerns of shared autonomous vehicles: During- and post-implementation evidence. Transp. Res. Interdiscip. Perspect. 2023, 18, 100785. [Google Scholar] [CrossRef]
- Si, H.; Duan, X.; Cheng, L.; De Vos, J. Adoption of shared autonomous vehicles: Combined effects of the external environment and personal attributes. Travel Behav. Soc. 2024, 34, 100688. [Google Scholar] [CrossRef]
- Asmussen, K.E.; Mondal, A.; Bhat, C.R. A socio-technical model of autonomous vehicle adoption using ranked choice stated preference data. Transp. Res. Part C Emerg. Technol. 2020, 121, 102835. [Google Scholar] [CrossRef]
- Milakis, D.; van Arem, B.; van Wee, B. Policy and society related implications of automated driving: A review of literature and directions for future research. J. Intell. Transp. Syst. 2017, 21, 324–348. [Google Scholar] [CrossRef]
- Ashkrof, P.; Homem De Almeida Correia, G.; Cats, O.; Van Arem, B. Impact of Automated Vehicles on Travel Mode Preference for Different Trip Purposes and Distances. Transp. Res. Rec. J. Transp. Res. Board 2019, 2673, 607–616. [Google Scholar] [CrossRef]
- Harb, M.; Stathopoulos, A.; Shiftan, Y.; Walker, J.L. What do we (Not) know about our future with automated vehicles? Transp. Res. Part C Emerg. Technol. 2021, 123, 102948. [Google Scholar] [CrossRef]
- Singleton, P.A. Validating the Satisfaction with Travel Scale as a measure of hedonic subjective well-being for commuting in a U.S. city. Transp. Res. Part F Traffic Psychol. Behav. 2019, 60, 399–414. [Google Scholar] [CrossRef]
- Schoettle, B.; Sivak, M. A Survey of Public Opinion About Autonomous and Self-Driving Vehicles in the US, the UK, and Australia; University of Michigan, Ann Arbor, Transportation Research Institute: Ann Arbor, MI, USA, 2014. [Google Scholar]
- Becker, H.; Balac, M.; Ciari, F.; Axhausen, K.W. Assessing the welfare impacts of Shared Mobility and Mobility as a Service (MaaS). Transp. Res. Part Policy Pract. 2020, 131, 228–243. [Google Scholar] [CrossRef]
- Kassens-Noor, E.; Kotval-Karamchandani, Z.; Cai, M. Willingness to ride and perceptions of autonomous public transit. Transp. Res. Part Policy Pract. 2020, 138, 92–104. [Google Scholar] [CrossRef]
- Zhang, W.; Guhathakurta, S. Residential Location Choice in the Era of Shared Autonomous Vehicles. J. Plan. Educ. Res. 2021, 41, 135–148. [Google Scholar] [CrossRef]
- Milakis, D.; Kroesen, M.; Van Wee, B. Implications of automated vehicles for accessibility and location choices: Evidence from an expert-based experiment. J. Transp. Geogr. 2018, 68, 142–148. [Google Scholar] [CrossRef]
- Simoni, M.D.; Kockelman, K.M.; Gurumurthy, K.M.; Bischoff, J. Congestion pricing in a world of self-driving vehicles: An analysis of different strategies in alternative future scenarios. Transp. Res. Part C Emerg. Technol. 2019, 98, 167–185. [Google Scholar] [CrossRef]


| (shared OR automated OR autonomous OR driverless OR self-driving OR robo) |
| AND (car OR vehicle OR taxi OR shuttle OR van OR bus OR mobility OR car-sharing OR ride-hailing) |
| Categories | Factors | N |
|---|---|---|
| User-Centric Factors | ||
| Socio-demographic | Age, Gender, Education, Income, Household, Employment, Disability/Impairment, Level of physical activity | 8 |
| Current Travel Habits and Mobility Needs | Driver’s License, Vehicle ownership, Common transport mode (private vehicle, public transport, active transport), Public transport card owner, car crash history, Familiarity Ride-sharing, Familiarity AV/SAV, Trip purpose (commute, leisure), Commute Time, First Class Train travel, Need to carry items, Yearly Mileage/Usage Frequency | 15 |
| Contextual Factors | ||
| Operational Travel Factors | Travel distance, Travel time, Travel cost, Accessibility/Service, Reliability, Travel speed, Access/Egress time, Waiting time, Congestion time, In-vehicle-time, Parking time, Parking cost, Weather | 13 |
| SAV-specific Features | Vehicle interior, Chauffer/Monitoring, Seating, Trip delay insurance, Liability holder, Preferred lane, Multitasking, Willingness-to-pay for automation, VOT | 9 |
| Built Environment | City size, Neighbourhood density, Centre vs. Rural | 3 |
| Psycho-Attitudinal Influences | ||
| Attitude | Ride-sharing (strangers, family/friends), Safety concerns/Trust, Time sensitivity, Attitude towards public transport, Attitude towards SAV, Technology interest, Enjoyment driving, Environmental attitude, Privacy concern, Social influence | 11 |
| Travel Behavior Aspect | Current Evidence | Research Gaps and Future Research |
|---|---|---|
| Total Travel Demand |
|
|
|
| |
|
| |
| ||
| Mode Choice |
|
|
|
| |
|
| |
|
| |
| Travel Time Use |
|
|
|
| |
|
| |
|
|
Disclaimer/Publisher’s Note: The statements, opinions and data contained in all publications are solely those of the individual author(s) and contributor(s) and not of MDPI and/or the editor(s). MDPI and/or the editor(s) disclaim responsibility for any injury to people or property resulting from any ideas, methods, instructions or products referred to in the content. |
© 2025 by the authors. Licensee MDPI, Basel, Switzerland. This article is an open access article distributed under the terms and conditions of the Creative Commons Attribution (CC BY) license (https://creativecommons.org/licenses/by/4.0/).
Share and Cite
La Delfa, A.; Han, Z. Sustainable Mobility and Shared Autonomous Vehicles: A Systematic Literature Review of Travel Behavior Impacts. Sustainability 2025, 17, 3092. https://doi.org/10.3390/su17073092
La Delfa A, Han Z. Sustainable Mobility and Shared Autonomous Vehicles: A Systematic Literature Review of Travel Behavior Impacts. Sustainability. 2025; 17(7):3092. https://doi.org/10.3390/su17073092
Chicago/Turabian StyleLa Delfa, Alessandro, and Zheng Han. 2025. "Sustainable Mobility and Shared Autonomous Vehicles: A Systematic Literature Review of Travel Behavior Impacts" Sustainability 17, no. 7: 3092. https://doi.org/10.3390/su17073092
APA StyleLa Delfa, A., & Han, Z. (2025). Sustainable Mobility and Shared Autonomous Vehicles: A Systematic Literature Review of Travel Behavior Impacts. Sustainability, 17(7), 3092. https://doi.org/10.3390/su17073092