Abstract
HVDC cable systems are becoming an upscaled technical option, compared to AC, because of various factors, including easier interconnections, lower losses, and longer transmission distances. In addition, renewables providing direct DC energy, electrified transportation, and aerospace where DC can be favored because of higher carried specific power all point in the direction of broad future usage of HV and MV DC links. However, contrary to AC, there is little return from on-field installation as regards long-term cable reliability and aging processes. This gap must be covered by intensive research, and contributing to this research is the purpose of this paper. The focus is on key points for HVDC (and MVDC) cable reliability and sustainability, from design modeling able to account for voltage transients and extrinsic aging (such as that caused by partial discharges) to the impact of aging on insulation conductivity (which rules the electric field distribution, thus aging rate). Also, recyclable and nanostructured materials, as well as health conditions, are considered. It is shown how cable design can account for accelerated aging due to voltage transients, as well as for aging-time dependence of conductivity, and how design can be free of extrinsic aging caused by PDs. Algorithms for health condition evaluations, which have additional value in a relatively new technology such as HVDC polymeric cables, are applied to insulation system aging under partial discharges, showing how they can provide an indication of insulation degradation globally or locally (weak spots) and of possible maintenance times. All of this can effectively contribute to reducing the risk of major cable breakdown and damage under operation, which would significantly affect the return on investment (ROI).
1. Introduction
HVDC and MVDC links are taking over AC transmission and distribution because of some favorable factors. First of all, HVDC converters are becoming as reliable as power transformers but featuring much more flexibility and efficiency, even at EHV levels. Second, cable can transmit and distribute energy over longer distances, but with lower losses (for conductor and insulation). In addition, interconnections of AC networks through DC links are easier [1,2,3,4,5,6,7,8,9,10]. The integration of renewable energy sources into the electrical grid is crucial for global sustainability [11,12,13,14,15]. The usage of HVDC cable systems is making the whole grid smarter by promoting flexibility and sustainability through the grid connection of renewable energy sources which, in general, are present in remote locations far from large consumption areas. Even in power distribution networks, MVDC technology is becoming a preferable option because of its high power transfer capacity, superior controllability, and operational flexibility [16].
So far so good, but a big question mark overshadows this fast-developing framework. While for AC there is a span of many decades of feedback from the field as regards cable design, performance, maintenance, and reliability, very little is available for DC cables, especially those using polymeric insulation [17]. Return on investment, ROI, relies upon expected cable system life, maintenance plans, outage rate, and operation effectiveness; thus, possessing design and diagnostic models and tools is fundamental for evaluating the long-term impact of HVDC investment and associated sustainability. In this picture, involving thermoplastic, recyclable insulation over oil–paper insulation can be seen as a must, rather than an option. This is due to their advantages, such as being environmentally friendly (no oil leakage and partially or totally recyclable), lower maintenance costs, higher maximum service temperature, and simpler cable jointing [18,19,20,21,22].
This paper focuses on key features for HVDC (and MVDC) cable system sustainability and ROI, from design to condition maintenance.
Section 2 deals with life modeling, able to provide a fundamental tool for an effective design even when voltage transients can be foreseen during cable operation (as energization and voltage polarity inversion). The model can account for extrinsic aging phenomena, which are deleterious for insulation reliability, such as partial discharges (PDs).
Section 3 unravels a hidden issue for long-term cable reliability that is posed by variation with time under stress (operation) of a key property for DC insulation, i.e., conductivity. Since under DC the electric field distribution is driven by conductivity, if this quantity varies with aging and non-uniformly along insulation volume, the electric field profile can also change, determining increased risks of intrinsic and extrinsic accelerated aging.
Section 4 introduces the concept of PD-free design, using an innovative procedure that allows the inception voltage of PDs, both in internal defects and on insulation surfaces/interfaces, to be estimated. According to the so-called three-leg approach, cable design can account for intrinsic aging, evaluating and minimizing the risk of extrinsic PD aging, even when conductivity variations are expected to affect both intrinsic and extrinsic life.
Section 5 faces the aspect of insulating materials, from the use of thermoplastics, which are fully recyclable and feature a long life cycle, to that of nano–micro filling to improve cable endurance even when PDs may incept and occur steadily or intermittently. The concept of reliability redundancy, at least for cable accessories, is introduced.
Eventually, Section 6 addresses the fundamental point of cable health condition evaluation and the diagnostic quantities that can be monitored during cable operation in order to carry out effective maintenance plans. In the case of PD-based diagnostics and condition maintenance, it is essential not only to measure signals corresponding to PDs but also to identify the type of defect that has generated the PD [23,24,25]. Diagnostic studies, which include a series of assessments ranging from residual life estimation to health condition or health index, can be effective following the proper identification of the typology of the PD source. Considering these aspects, a new definition of dynamic health index, DHI, is discussed, with a derivation focusing on PD-associated markers as diagnostic quantities. An application on accelerated cable aging under PDs is shown.
2. Dependence of Life on Voltage and Current Transients
Power flow direction can be managed by inverting voltage polarity with line commutated converters (LCC) or reversing the direction of the current with voltage source converters (VSC). In the case of LCC, the insulation system is subjected to slow voltage transients at energization and at voltage polarity inversion, while the latter are absent cables fed by VSC.
Each voltage transient changes electric field distribution in insulation, from conductivity (DC steady state) to permittivity driven, during transients. At the beginning of each energization or voltage polarity inversion, the electric field profile can therefore differ considerably from that in steady state, on which cable design is generally based. This electric field variation can last hours or days, depending on insulating material characteristics and insulation volume, being the time constant, , of the electric field transient (response to an ideal step voltage),
where rs, req, and ceq are the equivalent circuit parameters depending on insulation system volume/surface and material characteristics (such as surface conductivity σs, bulk conductivity σb, and absolute permittivity ε0εrb). Specifically, is the insulation surface layer resistance, and are the equivalent resistance and capacitance values for bulk insulation (or the combination of the bulk layer of insulation and cavity in the case of internal discharges) [17]. Calculations show that, as mentioned above, can go from hundreds of seconds for surface insulation to many hours for internal cavities.
As shown in the literature [17], partial discharges generally incept under AC at a lower voltage than in DC; that is, the partial discharge inception voltage in AC, PDIVAC < PDIVDC. Therefore, even for a DC insulation system that is PD-free at nominal voltage, partial discharges can be incept during energization and voltage polarity inversion, with magnitude and repetition rate that increase with voltage slew rate [17].
Such behavior must be taken into account when designing insulation systems that are fed by LLC or VSC.
Life specs in cable design are met using, mostly, the inverse power model at constant electrical and thermal stress [26,27,28],
where E is the electrical stress (maximum field), n is the so-called voltage endurance coefficient (VEC), is the reference electric field, and is the corresponding life. Equation (2) provides a straight lifeline in a log-log plot, whose inverse slope is n. Parameter values depend on temperature, and, in general, their values at maximum operating temperature are chosen for design (conservative approach). To establish an electrical stress life model, two parameters are required, i.e., n and (ER and tR), which is a point of the lifeline (generally corresponding to high-stress aging). Accelerated life tests are carried out to estimate model parameters for a given cable material and design, and extrapolation of the lifeline is used, at specified failure probability, to estimate the maximum design field corresponding to the specified life (e.g., 30 years).
It must be remembered that Equation (2) is generally used for intrinsic aging, that is, the type of aging that occurs globally in an insulation system and determines insulation design parameters (ED, LD, i.e., design field and life). However, it also works in the presence of extrinsic aging, as that occurs under PDs. In the latter case, in general, the voltage endurance coefficient n and reference life point (ER, tR) are lower than for intrinsic aging (as shown later in Table 1).

Table 1.
Model parameters of HVDC (XLPE) cable for electrical DC and AC life.
In order to take into account voltage transients, thus a time dependence of electrical stress, an expression accounting for the superposition of DC and energization/voltage polarity inversion (based on the superposition effect, thus of the Miner law [29]) is as follows:
where is part of the lifetime during which aging occurs under constant DC stress and is the relevant life; is, likewise, operating time under-voltage transients and life under permanent transients. and are provided by Equation (2) as follows:
where , and and and are reference fields and relevant lifetimes considering the life model with DC and AC parameters, respectively. The underlying assumption is that during voltage transients, since the electric field is driven by permittivity and it is time variable, failure time obeys the same life law as for AC sinusoidal, thus subscript t could be replaced by AC. and , or , correspond to the voltage endurance coefficient in DC and AC, respectively, where suffix x indicates (as for ER and tR) the absence or presence of PDs during that specific portion of life. Hence, the general model can feature and when PDs are absent, and when PDs are present, or a combination of them. The same holds for ERDC and tRDC and ERDC and tRDC.
The total life, accounting for DC regime and transients, is given by the following:
is unknown, since it depends on the number of expected voltage transients during life. Having preliminary information at the design stage of the expected transient rate, , besides the transient duration, , t2 can be expressed as follows:
and in Equation (4) becomes the following:
Coefficient h in Equation (7) can be taken, in general, <1 because the main contribution of transients to life reduction (with and without PDs) occurs in the first part of them, where is larger; thus, it could be assumed, e.g., that 0.1 < h < 0.5 (depending on transient slew rate). For the cases shown, h was considered as 0.1.
Examples of the effect of field transients on life reduction for DC cable in relation to the specified life (30 years at failure probability 1%), obtained by applying Model (4), are shown in Figure 1 and Figure 2. Model parameters are summarized in Table 1. They include the cable design field, ED, obtained from Model (2) with L = LD, i.e., specified life.
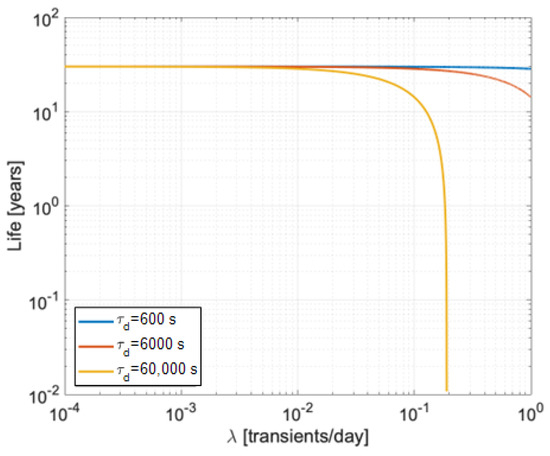
Figure 1.
Example of electrical life behavior of a DC cable, without PDs in steady state and with PDs during transients, considering mean values of , 6000 s, and 60,000 s, as a function of the mean rate of transients. The design life under steady DC voltage is 30 years at a design field of 26.7 kV/mm and failure probability of P = 1%.
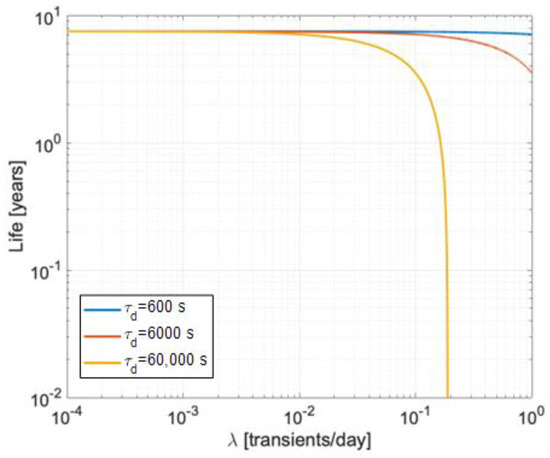
Figure 2.
Example of electrical life behavior of a DC cable, with PDs both in steady state and during transients, considering mean values of , 6000 s, and 60,000 s, as a function of the mean rate of transients (same design parameters as Figure 1).
Figure 1 addresses the case of a cable supplied in DC in steady state without PDs (intrinsic aging) and subjected to voltage transients (energization or voltage polarity inversion) with PDs (extrinsic aging due to PDs). The curves represent the decrease in life, compared to specification, when transient rate per day () and field time constant, , increase.
Figure 2 refers to the same case as Figure 1, but when PDs also occur in the DC steady state. As can be seen, life can decrease considerably in the presence of PDs, both in transient and in steady state, with reference to design specifications, as the number of transients per day and the electric field time constant increase. For example, life drops down to 7.5 years at a probability of 1% (from 30 years) when PDs are present in a steady state and very few voltage transients occur, but it will further drop to 3 years for 1 transient/day and a time constant of 100 min.
The risk of triggering extrinsic aging during transients and/or in a steady state can be predicted based on AC and DC PDIV measurements on cable models or estimation, as described in the next section. If PDIV values under AC (relevant to transients) or DC (steady state) are lower than cable nominal voltage, actions shall be taken at the design stage to match specifications. They can include changing the design (of cable and accessories, e.g., increasing insulation thickness and reducing electric field at accessory interfaces), materials (PD-resistant materials, see Section 5), and using life model (Equation (4)) to reach the expected life and reliability even if, and when, PD might be present under cable operation (depending on transient rate and duration).
3. Insulation Aging Impact on Conductivity and Cable Field Distribution
Since electric field distribution in DC insulation is driven by conductivity, and maximum field in cable insulation must be lower than design field ED determined by life modeling, knowledge of conductivity dependence on electric field and temperature is a key point for correct cable design. An approximate expression of such dependence is given by [23] the following:
where and are the temperature and electric field coefficients and is the reference volume conductivity (theoretically at and ).
Contrarily to AC (where the field is driven by permittivity which has negligible dependence on field and temperature), significant variations in electric field profile along insulation thickness with cable load (i.e., temperature gradient) are expected in DC [30,31,32], which may impact on the intrinsic aging rate and on extrinsic aging (due to PD inception) [33]. This can be taken into account at the design stage including a time variation in electrical stress (field) E in model (4).
An expression, based on the superposition effect and Equation (2), that considers stress time variation as the approximated summation for the stress-time convolution integral, is as follows:
where the first summation (from left) relates to the types of stresses, e.g., electrical and thermal , (thus to each relevant life model, ), the second to their time variation (, ), being the number of stress typologies and the discretized time-variation in stress magnitude . This can account also for the type of supply voltage as regards electrical stress, e.g., AC sinusoidal, DC, transient DC (Equation (4)), thus including the presence of PDs.
However, since aging mechanisms and their rate for HV and MV DC cables are not fully known, design should also take into account the possibility that insulation properties/parameters may vary with cable operation and aging, which could have a non-negligible impact on cable system reliability. Considering that electric field distribution, which drives intrinsic and extrinsic aging, depends significantly on conductivity, Equation (8), this becomes the main insulation property that should be watched carefully as a function of cable aging. Indeed, if conductivity value and its dependence on temperature and field would vary with aging time, unpredicted values of the maximum electric field in insulation, viz at interfaces, on cable surface and at bulk defects, may be generated, which could increase the intrinsic aging rate and cause inception of PDs at nominal voltage. Cable life and reliability could not, therefore, be achieved anymore.
As shown in reference [33], conductivity measurements performed at various electric fields and temperatures on specimens cut from HVDC polymeric cable laboratory-aged for 1 year, indicated clearly that conductivity can display large variations with time under stress (operation time). An example is shown in Figure 3, where the quasi-steady state value (that used to provide the conductivity value) varies around 3 times from unaged and aged specimens.
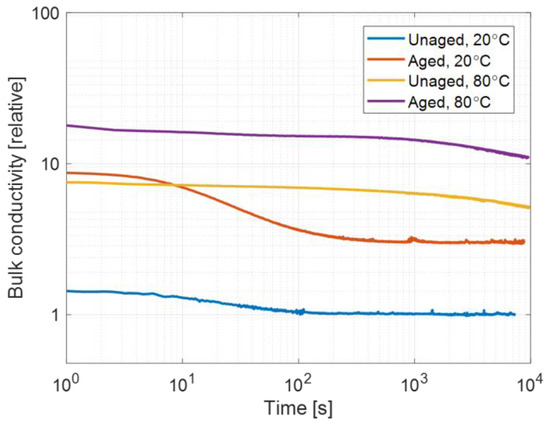
Figure 3.
Charging current from bulk conductivity measurements performed on specimens taken near the inner semiconductor of electrothermally aged HVDC polymeric cable at different temperatures (20 °C, and 80 °C) and under electric field of 20 kV/mm. Unaged and aged specimens. Relative values referred to unaged measurement results.
The consequence can involve both intrinsic and extrinsic aging. As regards the former, it might occur that, due to inhomogeneous variation in conductivity along cable thickness (see Figure 4), the electric field distribution in aged cable insulation differs from that for unaged cable, which was used for the design. If the maximum field would increase in the aged cable, as shown in Figure 5 which is relevant to the same aged cable of Figure 3, considering full load and, hence, a temperature gradient of 30 °C (from 95 °C on the conductor to 65° on the outer semiconductor), life can be reduced, according to Models (2) or (4). As an example, considering the maximum field of Figure 5, constant with time, and based on Equation (2) referred to the maximum field, life would diminish considerably due to the increase in the maximum field caused by conductivity variation with aging, as obtained from the lab accelerated life test. Using Equation (2) with model parameters provided by Table 1, life could decrease to an extent that can go up to ≈60% compared to design life. These, however, are just qualitative numbers, based on the assumptions that the value of a maximum field of Figure 5 is applied from the beginning of cable operation (while it increases progressively with aging) and that life is associated with the maximum field (even in the presence of a field gradient as in Figure 5). Even if a more complex life model than (2) should be used to consider the progressive variation in the maximum field with time (e.g., a general model as (9)), this result indicates that the intrinsic aging rate can increase with time under operation, due to conductivity inhomogeneous variation in insulation bulk. This could cause noticeable life reduction with respect to specifications.
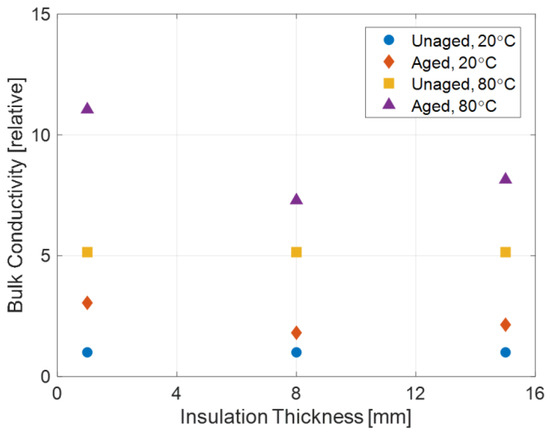
Figure 4.
Variation along cable thickness of quasi-steady state bulk conductivity for unaged and aged cable, at 20 kV/mm and 20 °C and 80 °C. Relative values referred to unaged measurement results.
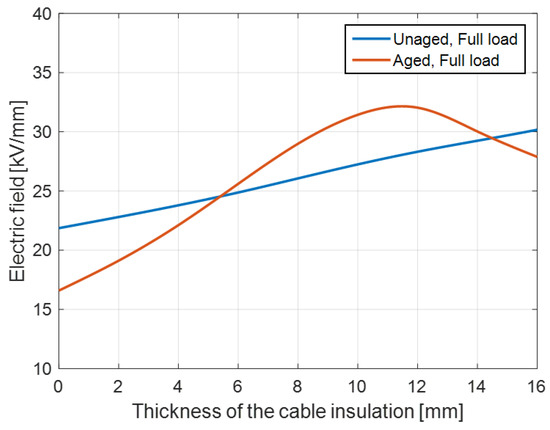
Figure 5.
Electric field profile in cable insulation under DC voltage = 400 kV (insulation thickness = 16 mm), variable conductivity with aging and thickness, as in Figure 4. Unaged and aged cable, full load (temperature gradient 30 °C).
As regards extrinsic aging, that is, partial discharges, since they are promoted by electric fields it is evident that electric field variation with aging can impact the voltage at which PDs incept, i.e., PDIV, for both bulk defects (cavities generating internal discharges) and surface triple points/interfaces (as at accessories). Recently, a deterministic PD inception model, valid for both internal and surface discharges, has been proposed and validated for different insulation systems under AC and DC supply (see, e.g., references [34,35]). It can be written as follows:
where PDIE is the inception field, is the critical reduced field, is pressure, and are known parameters related to discharge physics, and is a scale factor that localizes PD inception probability around the volume/surface where the electric field is maximum (e.g., triple points). can be calculated from the field profile at the defect location ( for internal defects and uniform surface field distribution). Hence, the only unknown parameter in Equation (10) is l, that is, the distance from the triple point on the surface (between the HV and ground electrode) or cavity height. Notably, parameter values change for internal or surface discharges. The parameter values in Equation (10) are known for both surface and internal discharges, having been estimated empirically by a wealth of experiments performed on insulation systems with artificial defects of different shapes and locations. The voltage at which the inception field calculated by Equation (10) matches the value of the maximum electric field in the defect is the partial discharge inception voltage, PDIV.
Devising a type of defect, its size and location, in any insulation system (such as DC cables dealt with here), calculating the electric field, and matching with Equation (10) would allow mean PDIV estimation for both internal and surface insulation sub-systems to be achieved. As an example, Figure 6 displays estimated values of PDIVDC for cables having the same geometry as that simulated for intrinsic aging evaluation, with a cavity of radius placed near the inner semiconductor (1 mm far) and in the middle of insulation. The full-load condition is considered the same as in Figure 5. As can be seen, the PDIVDC of aged specimens is lower than those of unaged, particularly when the cavity is in the middle of the insulation. This may indicate that in the presence of manufacturing or structural defects, an initially PD-free design can turn into an operation mode that is affected by PDs, likely depending on load conditions. For instance, a cable with a conductor and 16 mm insulation thickness has PDIVDC = 174 kV when unaged (with a defect located in the central part of insulation thickness and full load), while PDIVDC = 134 kV is the expected value after the accelerated aging causing the conductivity variation discussed above. Similar results are obtained by considering interfaces and surface defects.
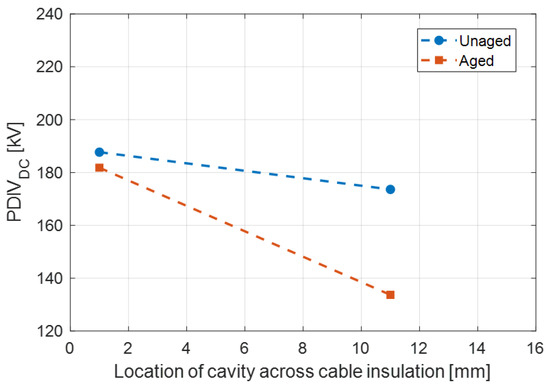
Figure 6.
PDIVDC modeling estimates for a 0.03 mm spherical cavity located 1 mm from the inner semiconductor or in the middle of the insulation for unaged and aged cables with a 2400 mm2 conductor and 16 mm insulation thickness. Full load conditions.
The message here is that when counting on a PD-free insulation system for all operating life, the possible conductivity evolution with aging must be evaluated and properly taken into account. The other takeaway is that since such conductivity increase with aging is likely caused by diffusion of contaminants from semiconductors, care should be taken in the HVDC selection of semiconductive materials. The aspect of PD-free design is developed in the next section.
4. Extrinsic Aging-Free Cable Design
While intrinsic aging can be accounted for by appropriate modeling in order to provide the specified life and reliability, the risk of extrinsic aging could be minimized at the design stage knowing the impact of bulk defects and surface insulation triple points on PDIV. The PD inception field and voltage model is now available, Equation (10), and it can be used in the so-called “three-leg approach” framework holding for any type of voltage and insulation system. This approach is valid for both AC and DC systems, and it is based on three steps (the “legs”), which are as follows:
- Electric field simulation of the insulation system/object under study;
- Modeling of the PD inception field and voltage, PDIE and PDIV, respectively;
- Perform PD measurements to validate the results predicted by leg 2.
Legs 1 and 2 were, in practice, mentioned above when defining the PD inception model (10), i.e., leg 2, and the need to calculate the electric field distribution at the defect, leg 1, in order to estimate the PDIV. Leg 3 is, indeed, validation of the PDIV estimate by PD detection and analytics, which must be able to identify the type of defect-generating PDs (a crucial point for the sake of proper design and condition maintenance) [35]. Figure 7 shows examples of PDIVDC estimation for a DC cable with surface and internal defects, as mentioned above and described in [35]. The mean measured values are also reported, showing the good capabilities of the three-leg approach to predict PDIV under DC supply (actually, the accuracy under sinusoidal AC and modulated has been verified).
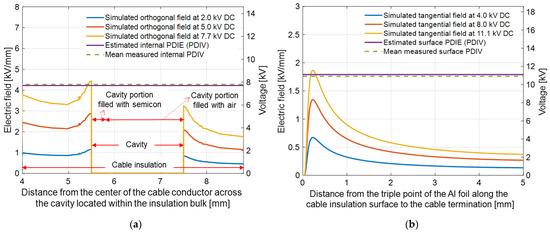
Figure 7.
PDIVDC estimation for a DC cable model with an internal defect (a cavity drilled radially in insulation), (a), and a surface defect (realized by a folded aluminum, Al, foil placed on the insulation surface) [35], (b). The PDIV experimental mean values are reported. In order to increase the interface electric field, the cavity is partially filled with semiconducting material.
Through this innovative approach, any type of internal defect (e.g., cavities that can be too small to be detected by other quality control tools like RX, or butt gaps in laminated DC cables, interfaces, joint field deflectors, etc.) can be simulated, and the relevant expected PDIV calculated so that the final design would be PD-free. To account for conductivity variation, the electric field distribution (leg 1) must be calculated on the basis of the estimated conductivity variations and in the worst conditions for temperature gradient (load).
5. Materials
Cable insulating materials have been transitioning from oil-impregnated paper to polymeric tapes, mixed polymeric-paper tapes, and extruded polymers. Polymers are, typically, HDPE or XLPE (high-density or cross-linked polyethylene) and, recently, thermoplastic polypropylene, PP [36], the latter displaying the interesting sustainability feature of a long life cycle.
New types of polymeric materials are being developed, and some of those made available commercially contain micron or nano inorganic fillers [37]. Since partial discharges damage insulating material through polymer chain bond breakdown, with energies up to 100 eV [38], inorganic particles cannot be attached by PDs, having larger bond energy. This delays the PD aging rate or, in other words, will increase the nDCPD to values close to those related to intrinsic aging (nDC in Table 1). Commercially, these new materials were named “corona resistant” because improperly PDs were confused with corona discharges. More appropriately, they should be defined as PD-resistant materials.
Figure 8 displays the results of accelerated life tests performed on commercially available PD (or corona) resistant polyimide, i.e., Kapton CR, compared with the same material free of microfilters (Kapton NCR). Electrical lifelines, at a failure probability of 1%, are reported and obtained upon applying model (2) by least square regression fitting (those lines that, properly extrapolated, would provide the design field). As can be seen, the slope (inversely proportional to n) of the lifeline with and without PDs is almost the same for Kapton CR, but much lower when PDs are continuously present for Kapton NCR.
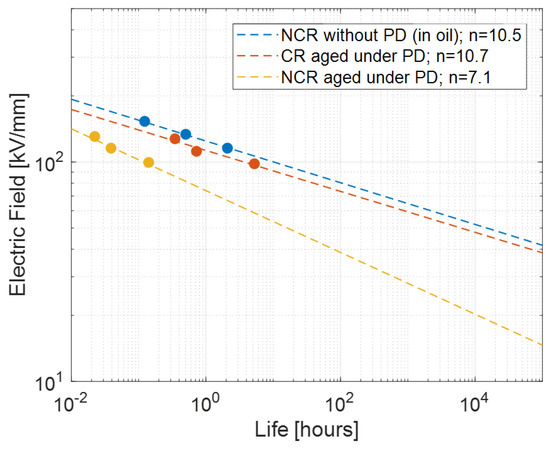
Figure 8.
Lifelines at a probability of 1% for CR and NCR materials aged under PDs, and without PDs (in oil) for Kapton NCR.
If using CR material for a whole HVDC cable insulation might be too expensive and needless (bulk defects are generally uncommon) and since most failures occur in accessories, thinking of manufacturing joints and terminations with PD-resistant materials can be a significant upgrade for delivering the specified life and reliability.
Relying upon such innovative materials, a new concept for insulation system design can be introduced, i.e., that of reliability redundancy.
The concept of reliability redundancy is quite simple. It can occur that real stresses in service could be larger than those considered for design, that electrothermal and mechanical aging change insulating material characteristic values (as for conductivity), as well as create or grow defects (at interfaces). Eventually, environmental changes can occur during operation, and there is always the risk that the on-field assembly of cable accessories is flawed. All of this can cause unexpected, or not-controllable, extrinsic accelerated aging, as provided by PD inception, failing life specification. Here is where the PD-resistant materials can help. Using insulating materials that have a large value of n, even if PDs are permanently or sporadically active (nPD), the design is more robust in terms of extrinsic aging endurance, thus providing additional reliability or reliability redundancy. Indeed, specifications can be fulfilled even if PDs are permanently or sporadically active, while in the absence of PDs during service life, the design will result in being conservative; thus, life will be even longer than specs (or reliability larger).
6. Diagnostics and Health Condition Evaluation
Extrinsic aging in DC cables has a much slower rate than under AC, since the PD repetition rate in DC is generally much smaller than in AC [17,23], and the magnitude can be slightly higher or equivalent. Indeed, the PD global damage is proportional to the product magnitude per repetition rate, such as the following:
where is damage density per unit time, / and mean repetition rate and amplitude, in relative value, is a coefficient accounting for probability and effectiveness that an electron involved in a PD with a certain amplitude exceeding an energy level, e.g., 8 eV for most polyolefins, and causing permanent and irreversible degradation (for Polyethylene ≈ 0.02, according to [38]). As an example, from PD measurements performed on a model cable with an internal defect as in Figure 7, = 0.2 in DC and 89.6 in AC.
Therefore, while for HVAC cables the presence of PD, if internal, calls for immediate maintenance, under DC PDs can be withstood for a longer time. This is highlighted by Figure 2, where life drops to 7.5 years, from 30, when DC PDs are permanently occurring under service, while in AC, at the same maximum field, life would drop to 115 h, based on nACPD, ERACPD, and tRACPD values of Table 1.
As regards MV, oil–paper insulation and polymeric cables can last a significant time before failure in the presence of some internal discharges of limited amount, and for even large surface discharges, both in DC and AC. In addition, the large number of MV asset components and the cost of maintaining or replacing them when PDs appear suggest that maintenance actions must be planned based on real cable health conditions and failure risk. Any action could be taken, then, only when strictly needed, possibly avoiding catastrophic failures, reaching an optimum condition for ROI, and associated cable asset sustainability.
As a consequence, both HV and MV DC cable typologies would benefit from condition maintenance based on health index algorithms, which will allow maintenance costs to be minimized while increasing ROI and operation costs, and decreasing environmental risk.
A general definition of dynamic health index (DHI) was developed, e.g., in reference [39]. The main difference compared to other contributions in the literature (e.g., references [40,41]) is that the logic OR condition in the buildup of the HI algorithm replaces the logic AND in order to attribute more importance (weight) to the extrinsic aging effect of PD occurrence and variation as regards health condition worsening. As an example, if a cable has significant internal PD activity, but other markers such as insulation temperature, sheath current, dissipation factor, etc., are good, cable condition would be seen as satisfactory (high health index) through AND logic, while maintenance would be required likely very fast (as portrayed by the new DHI). In summary, an expression for DHI evolution with time is given by the following:
where is the reliability of each subcomponent i, given by the following:
and are the maximum and minimum score (magnitude) values for the diagnostic marker j, for the subcomponent , and takes into account the weight of such marker on the aging rate (higher weight means that the property diagnoses a stronger aging mechanism). The significance of a specific aging mechanism is defined as a combination of a diagnostic marker magnitude, or score, Si,j,k (e.g., PD amplitude or repetition rate) and its weight, Wi,j,k (related to the type of defect, in the case of PDs). The latter expresses the harmfulness of the degradation process associated with the diagnostic quantity.
Equations (12)–(14) hold for any type of diagnostic quantity (and voltage waveshape), and (12) can include other information that can be useful to define a global DHI, such as results of previous forensic inspections, history of previous failures/outages, and environmental conditions [39].
If PDs are the only diagnostic quantity, j = 1, and considering one sub-system, i.e., i = 1, only one component is present in (13), (14). Since the main factors associated with PDs as a diagnostic quantity are amplitude A, repetition rate RR, and the PD typology (i.e., whether internal or surface type of discharge, the former being more harmful than the latter, at the same amplitude and repetition rate), a new score algorithm was proposed [42], that is the following:
where signs are the sign of the quantity vs. time slope, that is, =1 if increasing, =−1 if decreasing. is a reference PD amplitude, and is a reference repetition rate. is the likelihood percentage provided by the identification of the PD typology (through an approach to PD analytics as that described in [35]), being k = 1, 2, that is, P1 = likelihood of surface, P2 = likelihood of internal. Weight can be expressed by the following:
The final expression of DHI, referring to PDs as monitored diagnostic properties, becomes, from Equation (12), the following:
Figure 9 and Figure 10 show a case of accelerated aging of DC cable with surface discharges, where PD monitoring is carried out online till breakdown. As can be seen from Figure 9, PD amplitude, A, and repetition rate, RR, vary in a non-monotone way with time under stress. As often occurs, PD magnitude does not increase with aging even before breakdown (in this case, however, the repetition rate grows constantly, but sometimes even this quantity has no clear trend). Such behavior would not support the use of PDs as a diagnostic quantity, referring only to magnitude, A, or RR. However, using the DHI algorithm of Equation (17), Figure 10 is obtained. DHI decreases with time under stress, whatever the time trend of PDs and repetition rate, which means that it can constitute a valid diagnostic marker. Extrapolating the DHI trend and establishing endpoints, maintenance times can be automatically selected. As an example, Figure 10 highlights three zones: green (no action) for DHI down to 75%, yellow (action to be planned) for 0.75 ≤ DHI < 0.25, and maintenance to be executed as soon as possible for DHI ≤ 0.25.
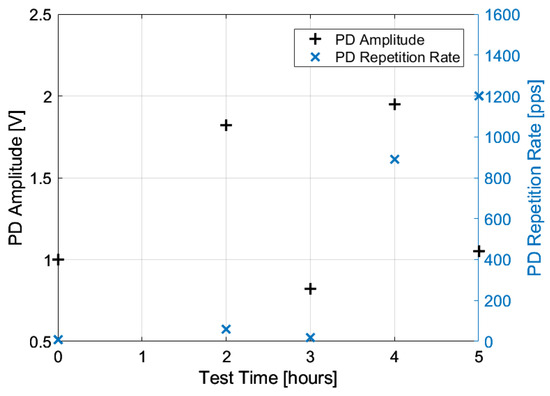
Figure 9.
PD amplitude and repetition rate as a function of time under electrical stress for a cable subjected to surface discharges.
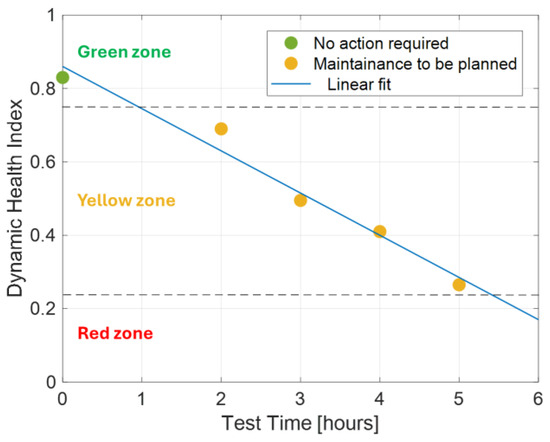
Figure 10.
DHIPD is obtained by Equation (17), with a PD amplitude and repetition rate of Figure 9. Green, yellow, and red zones indicate no action required, plan maintenance, and execute maintenance as soon as possible, respectively.
This can be the basis for a thorough condition assessment and maintenance approach for DC cables, which can be extended to any quantity that can have relations with aging and cable reliability. Planning maintenance before failures and relevant outages would be beneficial for a sustainable, reliable, and safe approach to DC cable management.
7. Conclusions
The main purpose of this paper was to provide a picture of potential issues and remedies for proper design and maintenance of HV (and MV) DC cables, focusing on polymeric insulation and in light of better sustainability of cable asset investment. Oil–paper insulation is considered, indeed, to have higher reliability, but the risk, in case of failure, of fire and fluid oil spilling does not make them environmentally friendly and sustainable.
It is shown that innovative life modeling, accounting for both extrinsic and intrinsic aging, design, based on the three-leg approach, and diagnostics, where a global health condition index has been developed, can likely increase confidence in this new, and yet unavoidable, technology. Indeed, HV and MV polymeric DC cables will be key players in renewable generation and T&D, as well as in electrified transportation.
This DHI methodology can possibly be implemented in large-scale HVDC networks, as well as in critical MV links and networks. It requires effective online diagnostic monitoring and AI-based predictive analytic techniques able to provide automated alerts, which can potentially enable grid operators to prioritize maintenance action accordingly.
Having the possibility to plan maintenance effectively before major damages to cable systems impacting the environment, human safety, and energy service quality is a must for the sustainability of this technology. In addition, this would contribute to reducing management costs that will reflect on energy prices and, globally, on improving ROI.
The views expressed are those of the author and do not reflect the official policy or position of the Department of Defense or the U.S. Government.
Author Contributions
Conceptualization, G.C.M.; methodology, G.C.M. and S.B.M.; software, S.B.M.; validation, G.C.M. and S.B.M.; formal analysis, G.C.M. and S.B.M.; investigation, G.C.M. and S.B.M.; resources, G.C.M.; data curation, S.B.M.; writing—original draft preparation, G.C.M.; writing—review and editing, G.C.M. and S.B.M.; visualization, S.B.M.; supervision, G.C.M.; project administration, G.C.M.; funding acquisition, G.C.M. All authors have read and agreed to the published version of the manuscript.
Funding
This research was supported in part by the Office of Naval Research under grant number N00014-21-1-2124, and in part by the U.S. Department of Energy (DOE) under contracts DE-AC36-08GO28308 and DE-FOA-0002238.
Institutional Review Board Statement
Not applicable.
Informed Consent Statement
Not applicable.
Data Availability Statement
The original contributions presented in the study are included in the article; further inquiries can be directed to the corresponding author.
Conflicts of Interest
The authors declare no conflicts of interest.
Abbreviations
The following abbreviations are used in this manuscript:
| ROI | return on investment |
| PD | partial discharge |
| LCC | line commutated converter |
| VSC | voltage source converter |
| VEC | voltage endurance coefficient |
| PDIV | partial discharge inception voltage |
| PDIE | partial discharge inception field |
| DHI | dynamic health index |
References
- Farhangi, H. The path of the smart grid. IEEE Power Energy Mag. 2009, 8, 18–28. [Google Scholar]
- Loh, P.C.; Li, D.; Chai, Y.K.; Blaabjerg, F. Autonomous control of interlinking converter with energy storage in hybrid AC–DC microgrid. IEEE Trans. Ind. Appl. 2013, 49, 1374–1382. [Google Scholar]
- Guerrero, J.M.; Vasquez, J.C.; Matas, J.; De Vicuña, L.G.; Castilla, M. Hierarchical control of droop-controlled AC and DC microgrids—A general approach toward standardization. IEEE Trans. Ind. Electron. 2010, 58, 158–172. [Google Scholar]
- Wunder, B.; Ott, L.; Kaiser, J.; Han, Y.; Fersterra, F.; März, M. Overview of different topologies and control strategies for DC micro grids. In Proceedings of the IEEE International Conference on DC Microgrids (ICDCM), Atlanta, GA, USA, 7–10 June 2015. [Google Scholar]
- Jiayi, H.; Chuanwen, J.; Rong, X. A review on distributed energy resources and MicroGrid. Renew. Sustain. Energy Rev. 2008, 12, 2472–2483. [Google Scholar]
- Mazzanti, G.; Marzinotto, M. Extruded Cables for High-Voltage Direct-Current Transmission: Advances in Research and Development; John Wiley & Sons, Inc.: Hoboken, NJ, USA, 2013. [Google Scholar]
- Kumar, D.; Zare, F.; Ghosh, A. DC microgrid technology: System architectures, AC grid interfaces, grounding schemes, power quality, communication networks, applications, and standardizations aspects. IEEE Access 2017, 5, 12230–12256. [Google Scholar]
- Justo, J.J.; Mwasilu, F.; Lee, J.; Jung, J.W. AC-microgrids versus DC-microgrids with distributed energy resources: A review. Renew. Sustain. Energy Rev. 2013, 24, 387–405. [Google Scholar]
- Mirsaeidi, S.; Dong, X.; Shi, S.; Tzelepis, D. Challenges, advances and future directions in protection of hybrid AC/DC microgrids. IET Renew. Power Gener. 2017, 11, 1495–1502. [Google Scholar]
- Nejabatkhah, F.; Li, Y.W. Overview of power management strategies of hybrid AC/DC microgrid. IEEE Trans. Power Electron. 2014, 30, 7072–7089. [Google Scholar]
- Mansouri, A.; Ammar, A.; El Magri, A.; Elaadouli, N.; Lajouad, R.; Giri, F. An adaptive control strategy for integration of wind farm using a VSC-HVDC transmission system. Results Eng. 2024, 23, 102359. [Google Scholar]
- Haegel, N.M.; Kurtz, S.R. Global progress toward renewable electricity: Tracking the role of solar. IEEE J. Photovolt. 2021, 11, 1335–1342. [Google Scholar]
- Van Hertem, D.; Ghandhari, M. Multi-terminal VSC HVDC for the European supergrid: Obstacles. Renew. Sustain. Energy Rev. 2010, 14, 3156–3163. [Google Scholar] [CrossRef]
- Wu, D.; Seo, G.S.; Xu, L.; Su, C.; Kocewiak, Ł.; Sun, Y.; Qin, Z. Grid integration of offshore wind power: Standards, control, power quality and transmission. IEEE Open J. Power Electron. 2024, 5, 583–604. [Google Scholar] [CrossRef]
- Gbadega, P.A.; Balogun, O.A. Transactive Energy Management for Efficient Scheduling and Storage Utilization in a Grid-connected Renewable Energy-based Microgrid. e-Prime-Adv. Electr. Eng. Electron. Energy 2025, 11, 100914. [Google Scholar] [CrossRef]
- Abeynayake, G.; Li, G.; Joseph, T.; Liang, J.; Ming, W. Reliability and cost-oriented analysis, comparison and selection of multi-level MVDC converters. IEEE Trans. Power Deliv. 2021, 36, 3945–3955. [Google Scholar] [CrossRef]
- Montanari, G.C.; Myneni, S.B.; Berardi, G.; Albertini, M.; Franchi Bononi, S. Investigating New Approaches for Optimal Energizations of DC Cables: The Stepwise Energization Technique. High Voltage 2025, Accepted. [Google Scholar]
- Mazzanti, G. Issues and challenges for HVDC extruded cable systems. Energies 2021, 14, 4504. [Google Scholar] [CrossRef]
- Bartnikas, R.; Eichhorn, R.M. Electrical Properties of Solid Insulating Materials (No. 783); ASTM International: Baltimore, MD, USA, 1987. [Google Scholar]
- CIGRÉ. Recommendations for Testing DC Extruded Cable Systems for Power Transmission at a Rated Voltage Up to 500 kV; CIGRÉ Technical Brochure 496: Paris, France, 2012. [Google Scholar]
- Jeroense, M.; Bergelin, P.; Quist, T.; Abbasi, A.; Rapp, H.; Wang, L. Fully Qualified 640 kV Underground Extruded DC Cable System; Paper B1-309; CIGRÉ Session: Paris, France, 2018. [Google Scholar]
- IEC 62067; Power Cables with Extruded Insulation and Their Accessories for Rated Voltages Above 150 kV (Um = 170 kV) Up to 500 kV (Um = 550 kV)—Test Methods and Requirements. 3rd ed. IEC: Geneva, Switzerland, 2022.
- Kreuger, F.H. Partial Discharge Detection in High-Voltage Equipment; Butterworth-Heinemann: London, UK, 1990. [Google Scholar]
- IEC 60034-27-1; Rotating Electrical Machines. Off-Line Partial Discharge Measurements on the Winding Insulation. IEC: Geneva, Switzerland, 2019.
- Stone, G.C.; Boggs, S.A. Propagation of partial discharge pulses in shielded power cable. In Proceedings of the IEEE Conference on Electrical Insulation & Dielectric Phenomena-Annual Report, Amherst, MA, USA, 17–21 October 1982; pp. 275–280. [Google Scholar]
- IEC 60505; Evaluation and Qualification of Electrical Insulation Systems. 4th ed. IEC: Geneva, Switzerland, 2011.
- IEC 61251; Electrical Insulating Materials and Systems—AC Voltage Endurance Evaluation. 1st ed. IEC: Geneva, Switzerland, 2015.
- Montanari, G.C. Notes on theoretical and practical aspects of polymeric insulation aging. IEEE Electr. Insul. Mag. 2013, 29, 30–40. [Google Scholar] [CrossRef]
- Miner, M.A. Cumulative damage in fatigue. J. Appl. Mech. 1945, 12, 159–164. [Google Scholar] [CrossRef]
- Buller, F.H. Calculation of electrical stress in DC cable insulation. IEEE Trans. Pow. App. Syst. 1967, 86, 1169–1178. [Google Scholar] [CrossRef]
- Eoll, C.K. Theory of stress distribution in insulation of high-voltage DC cables: Part I. IEEE Trans. Electr. Insul. 1975, 1, 27–35. [Google Scholar] [CrossRef]
- Mazzanti, G. Including the calculation of transient electric field in the life estimation of HVDC cables subjected to load cycles. IEEE Electr. Insul. Mag. 2018, 34, 27–37. [Google Scholar]
- Montanari, G.C.; Myneni, S.B.; Pabbati, V.; Berardi, G.; Albertini, M.; Franchi Bononi, S. Impact of electrothermal aging on HVDC polymeric cable life. In Proceedings of the Jicable HVDC, Torino, Italy, 20–22 October 2025. [Google Scholar]
- Niemeyer, L. A generalized approach to partial discharge modeling. IEEE Trans. Dielectr. Electr. Insul. 1995, 2, 510–528. [Google Scholar]
- Montanari, G.C.; Shafiq, M.; Myneni, S.B. Insulation Defect Modelling and Partial Discharge Typology Identification: A Robust and Automatic Approach. Appl. Sci. 2024, 14, 6715. [Google Scholar] [CrossRef]
- Mazzanti, G.; Castellon, J.; Chen, G.; Fothergill, J.C.; Fu, M.; Hozumi, N.; Lee, J.H.; Li, J.; Marzinotto, M.; Mauseth, F.; et al. The insulation of HVDC extruded cable system joints. Part 1: Review of materials, design and testing procedures. IEEE Trans. Dielectr. Electr. Insul. 2019, 26, 964–972. [Google Scholar]
- Zhang, M.; Wang, Y.; Jiang, H. New method to prepare corona resistant polyimide composite film. J. Phys. Conf. Ser. 2021, 1948, 012229. [Google Scholar]
- Sanche, L. Nanoscopic aspects of electronic aging in dielectrics. IEEE Trans. Dielectr. Electr. Insul. 1997, 4, 507–543. [Google Scholar]
- Montanari, G.C.; Seri, P. A partial discharge–based health index for rotating machine condition evaluation. IEEE Electr. Insul. Mag. 2018, 34, 17–23. [Google Scholar]
- Hudon, C.; Amyot, N.; Levesque, M.; Essalihi, M.; Millet, C. Using integrated generator diagnosis to perform condition based maintenance. In Proceedings of the IEEE Electrical Insulation Conference (EIC), Seattle, WA, USA, 7–10 June 2015. [Google Scholar]
- Jahromi, A.; Piercy, R.; Cress, S.; Service, J.; Fan, W. An approach to power transformer asset management using health index. IEEE Electr. Insul. Mag. 2009, 25, 20–34. [Google Scholar]
- Montanari, G.C.; Shafiq, M.; Chen, Z.; Kolesar, S. Monitoring partial discharges in MV electrical asset components supplied by PWM voltage: An unsupervised approach providing dynamic health index for maintenance purposes. In Proceedings of the IEEE ESTS, Old Town Alexandria, VA, USA, 5 August 2025. [Google Scholar]
Disclaimer/Publisher’s Note: The statements, opinions and data contained in all publications are solely those of the individual author(s) and contributor(s) and not of MDPI and/or the editor(s). MDPI and/or the editor(s) disclaim responsibility for any injury to people or property resulting from any ideas, methods, instructions or products referred to in the content. |
© 2025 by the authors. Licensee MDPI, Basel, Switzerland. This article is an open access article distributed under the terms and conditions of the Creative Commons Attribution (CC BY) license (https://creativecommons.org/licenses/by/4.0/).