
Exploring the Performance and Interpretability of an Enhanced Data-Driven Model to Assess Surface Flooding Susceptibility


Abstract
1. Introduction
- (1)
- A framework En-XGBoost was constructed to achieve flood susceptibility mapping in urban scale, data-driven models inside En-XGBoost were compared to each other, and the indices of the model were evaluated.
- (2)
- Different feature extraction approaches were compared, and several groups of receptive fields were used to recognize the optimal neighborhood range. The flood susceptibility distributions were simulated, and the risk maps were implemented at multiple resolutions.
- (3)
- The crucial driving factors were provided, and the importances of explanatory features were evaluated. Subsequently, we conducted a detailed analysis of the interpretability of En-XGBoost in relation to flood susceptibility.
- (4)
- Several concepts were introduced and discussed, primarily including random strategies, local enhancement strategies, and data augmentation strategies. These ideas were incorporated into En-XGBoost. This research provides a detailed discussion of the combined benefits of these strategies, parameters, and their combinations.
2. Material and Methodology
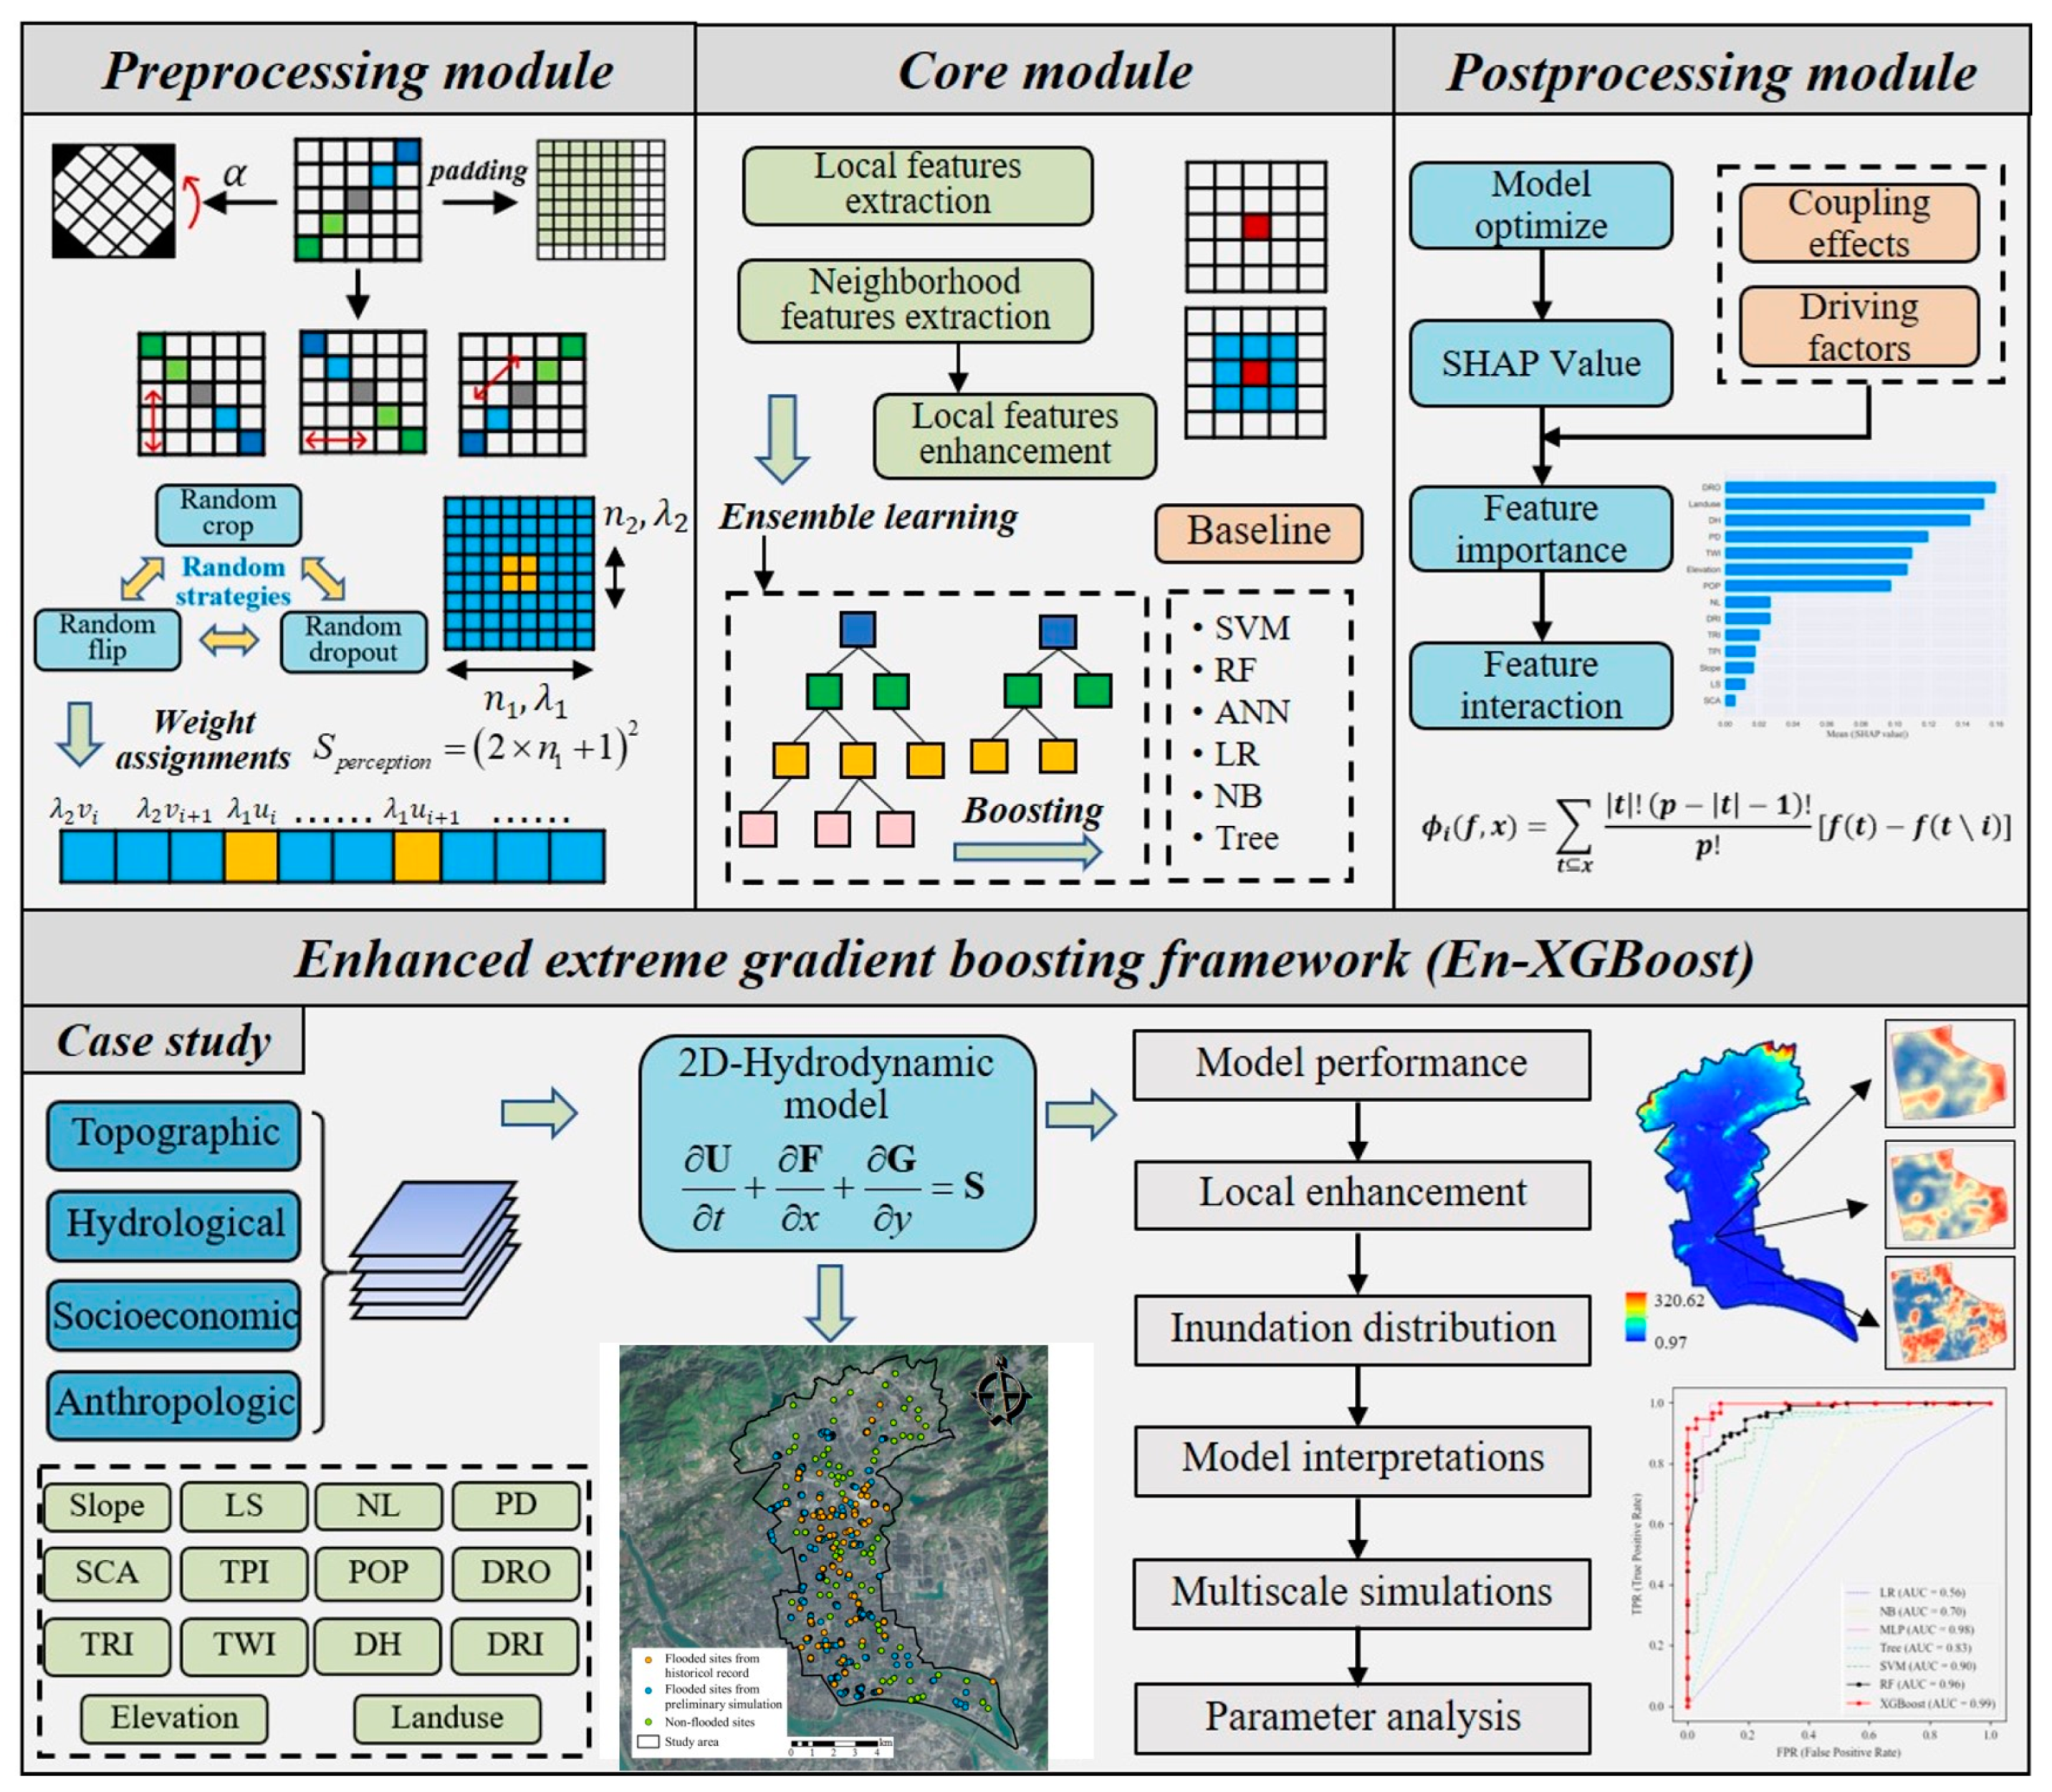
2.1. Modules Description in En-XGBoost
2.1.1. Core Module
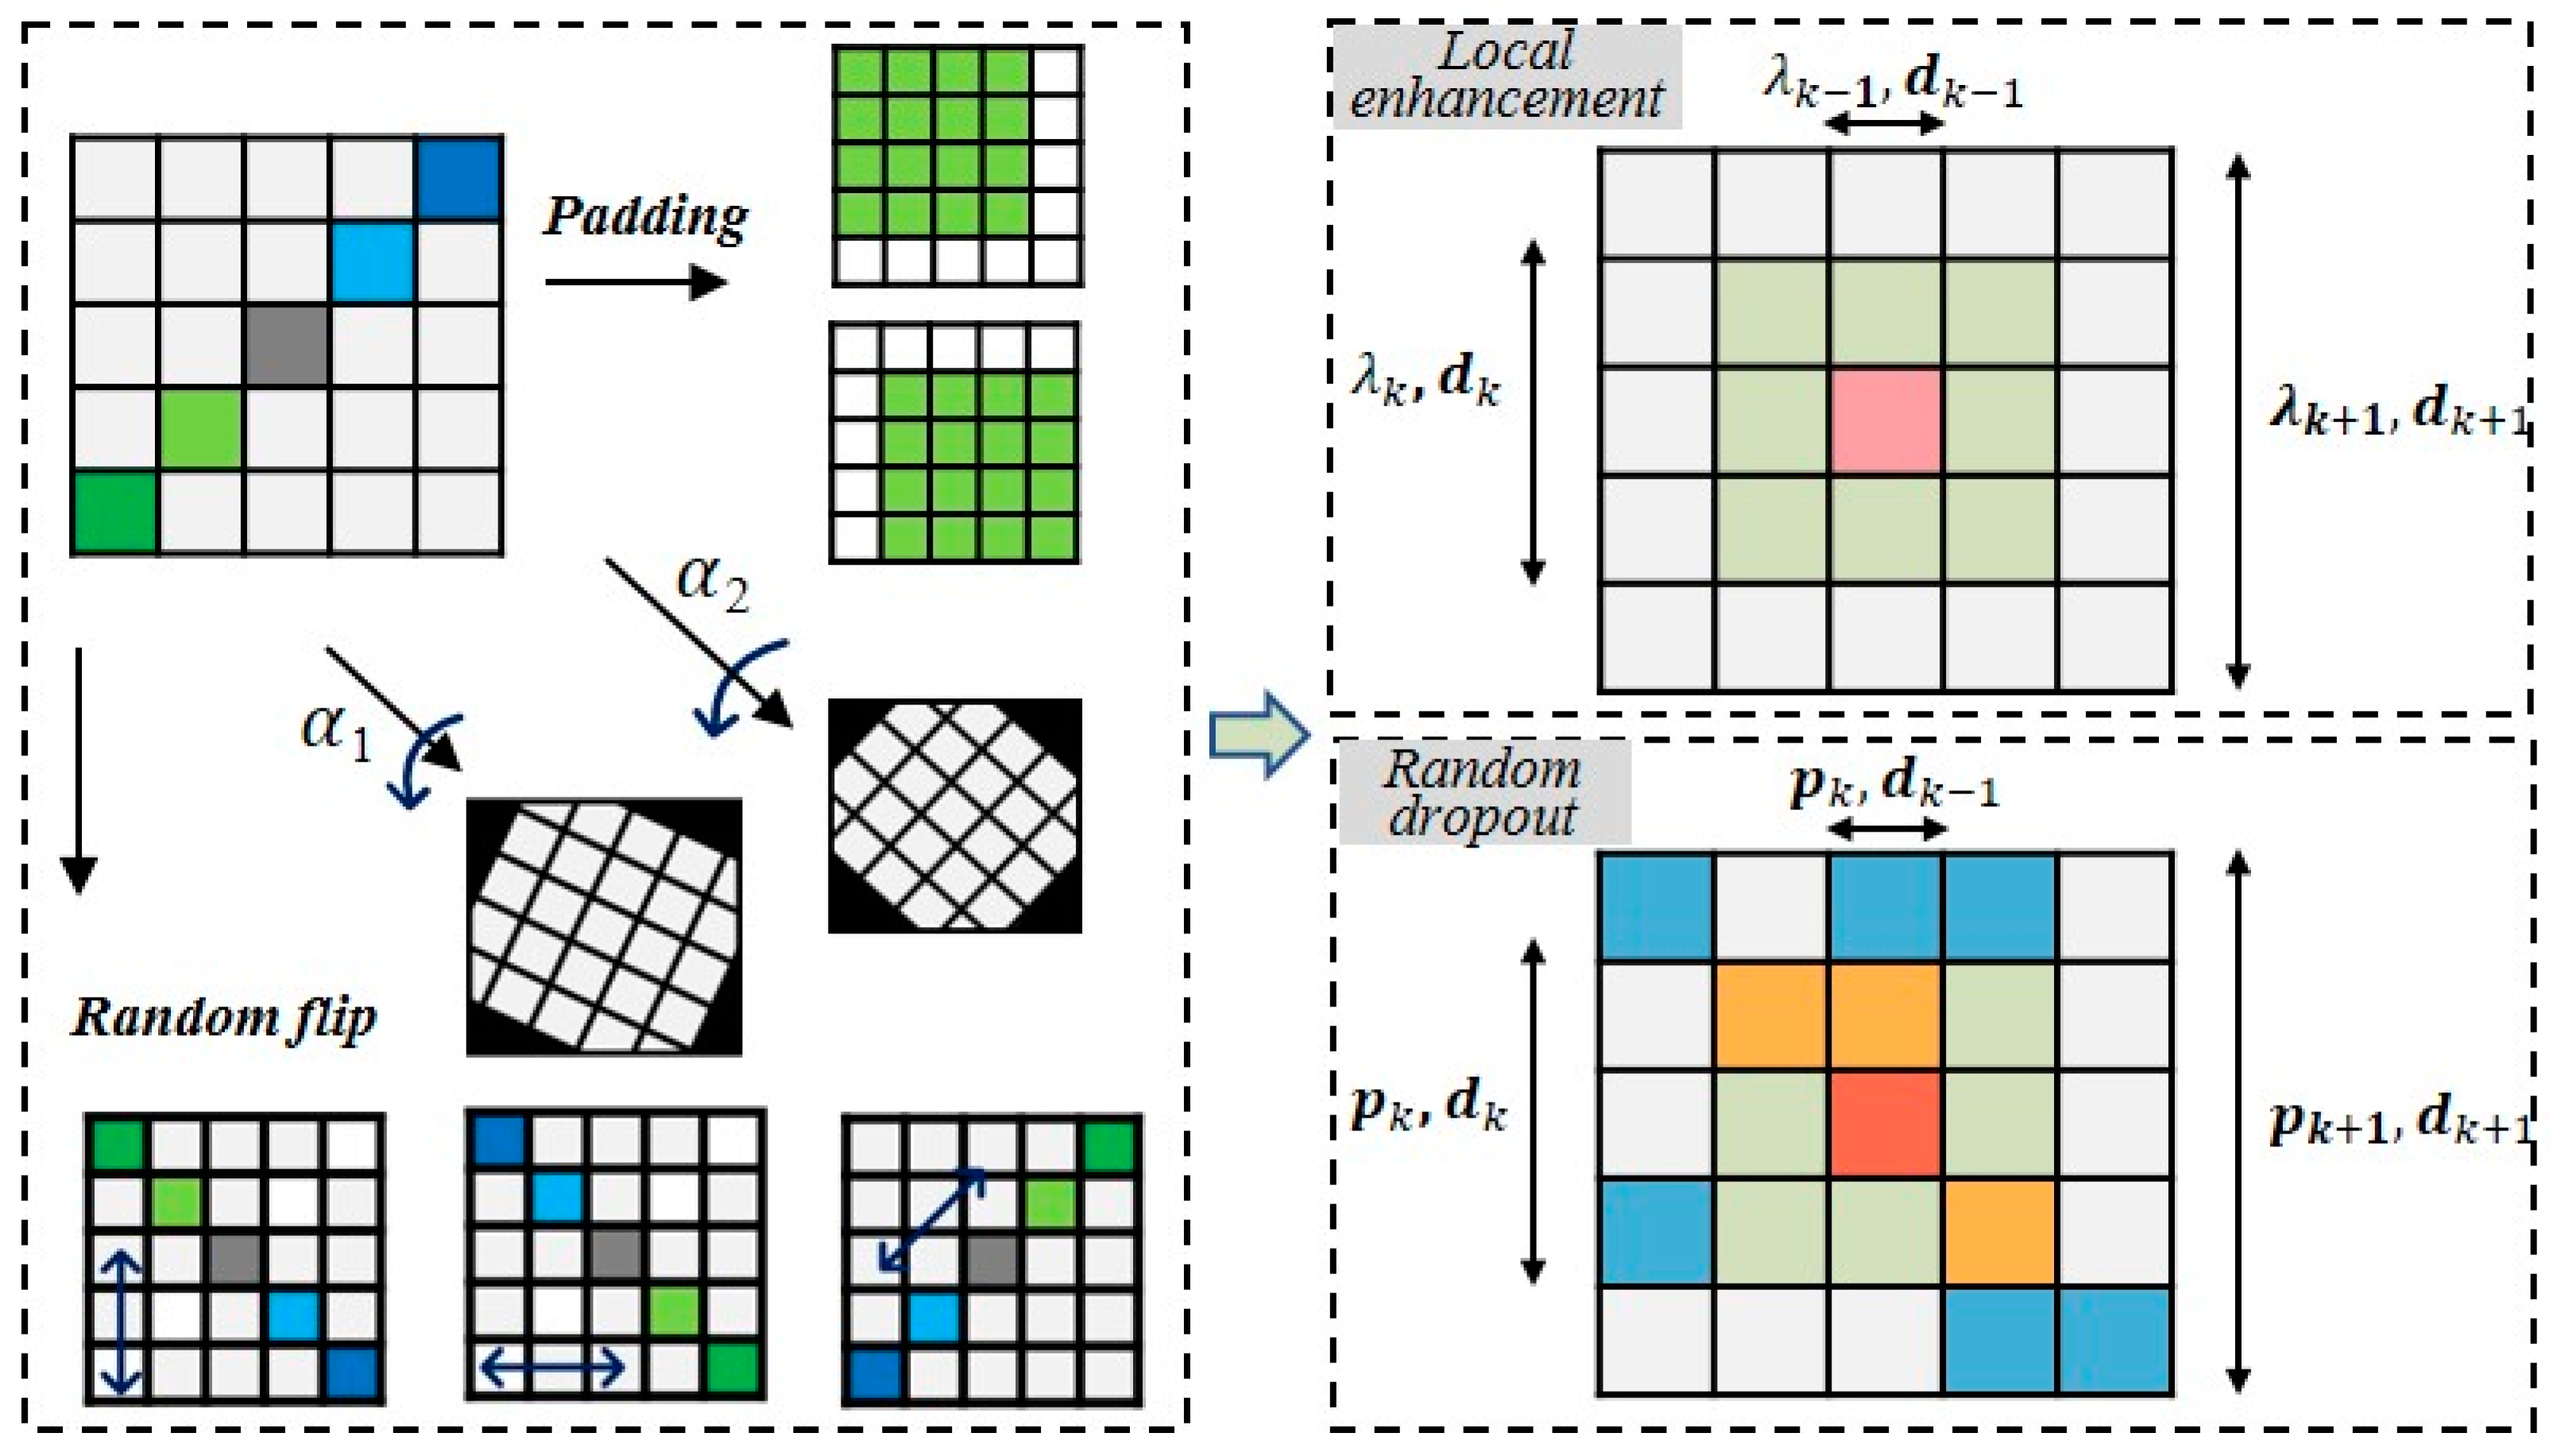
2.1.2. Preprocessing Module
2.1.3. Postprocessing Module
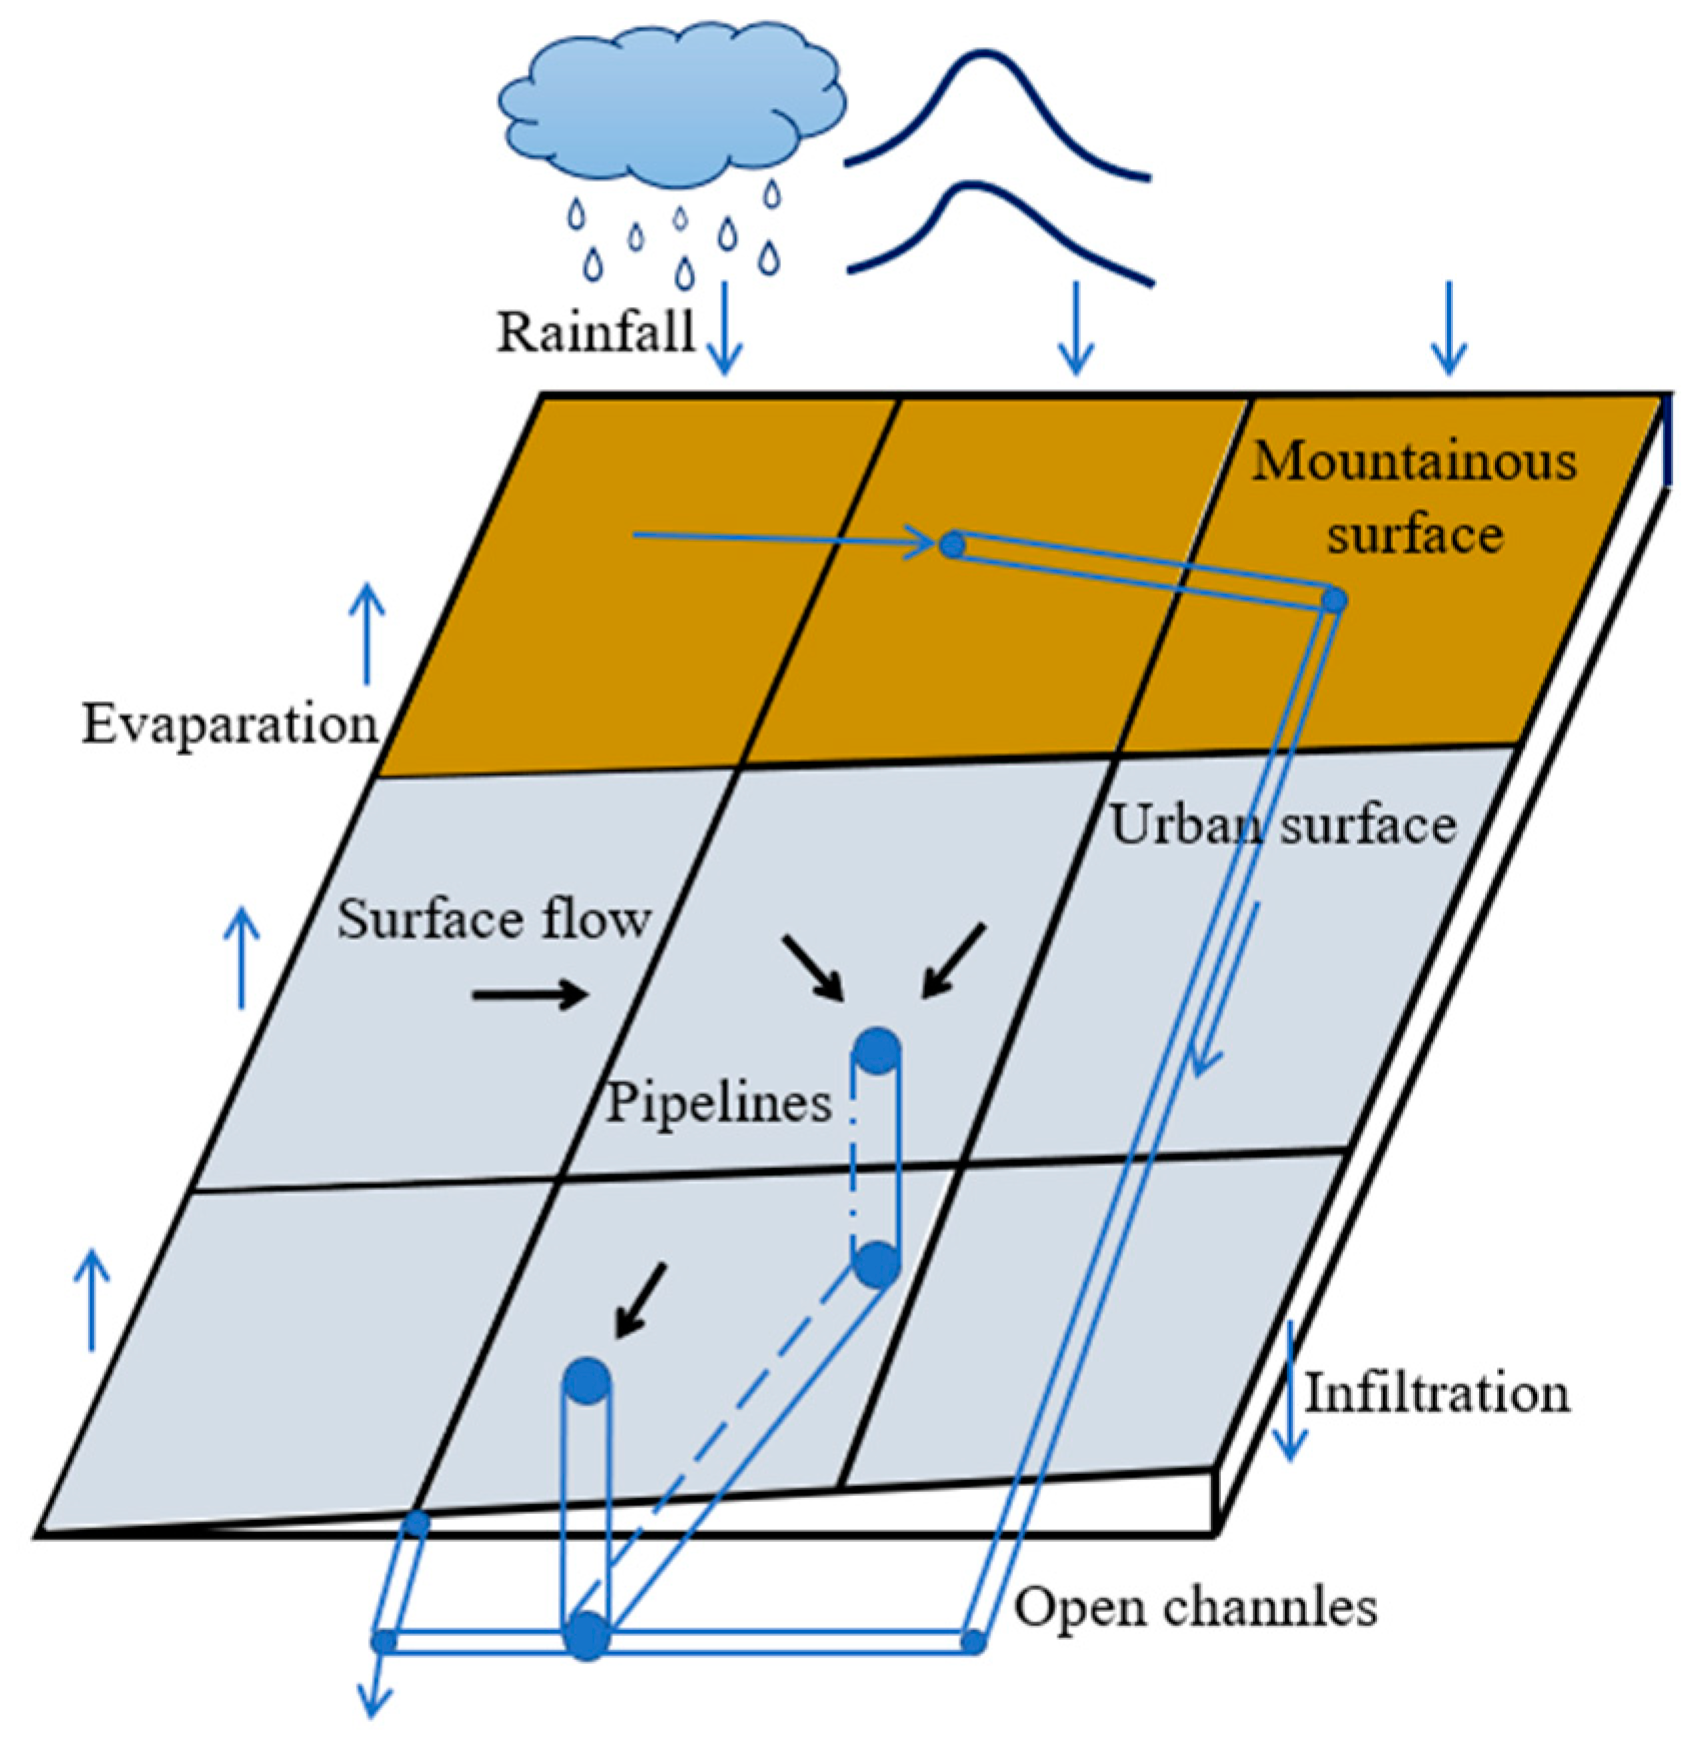
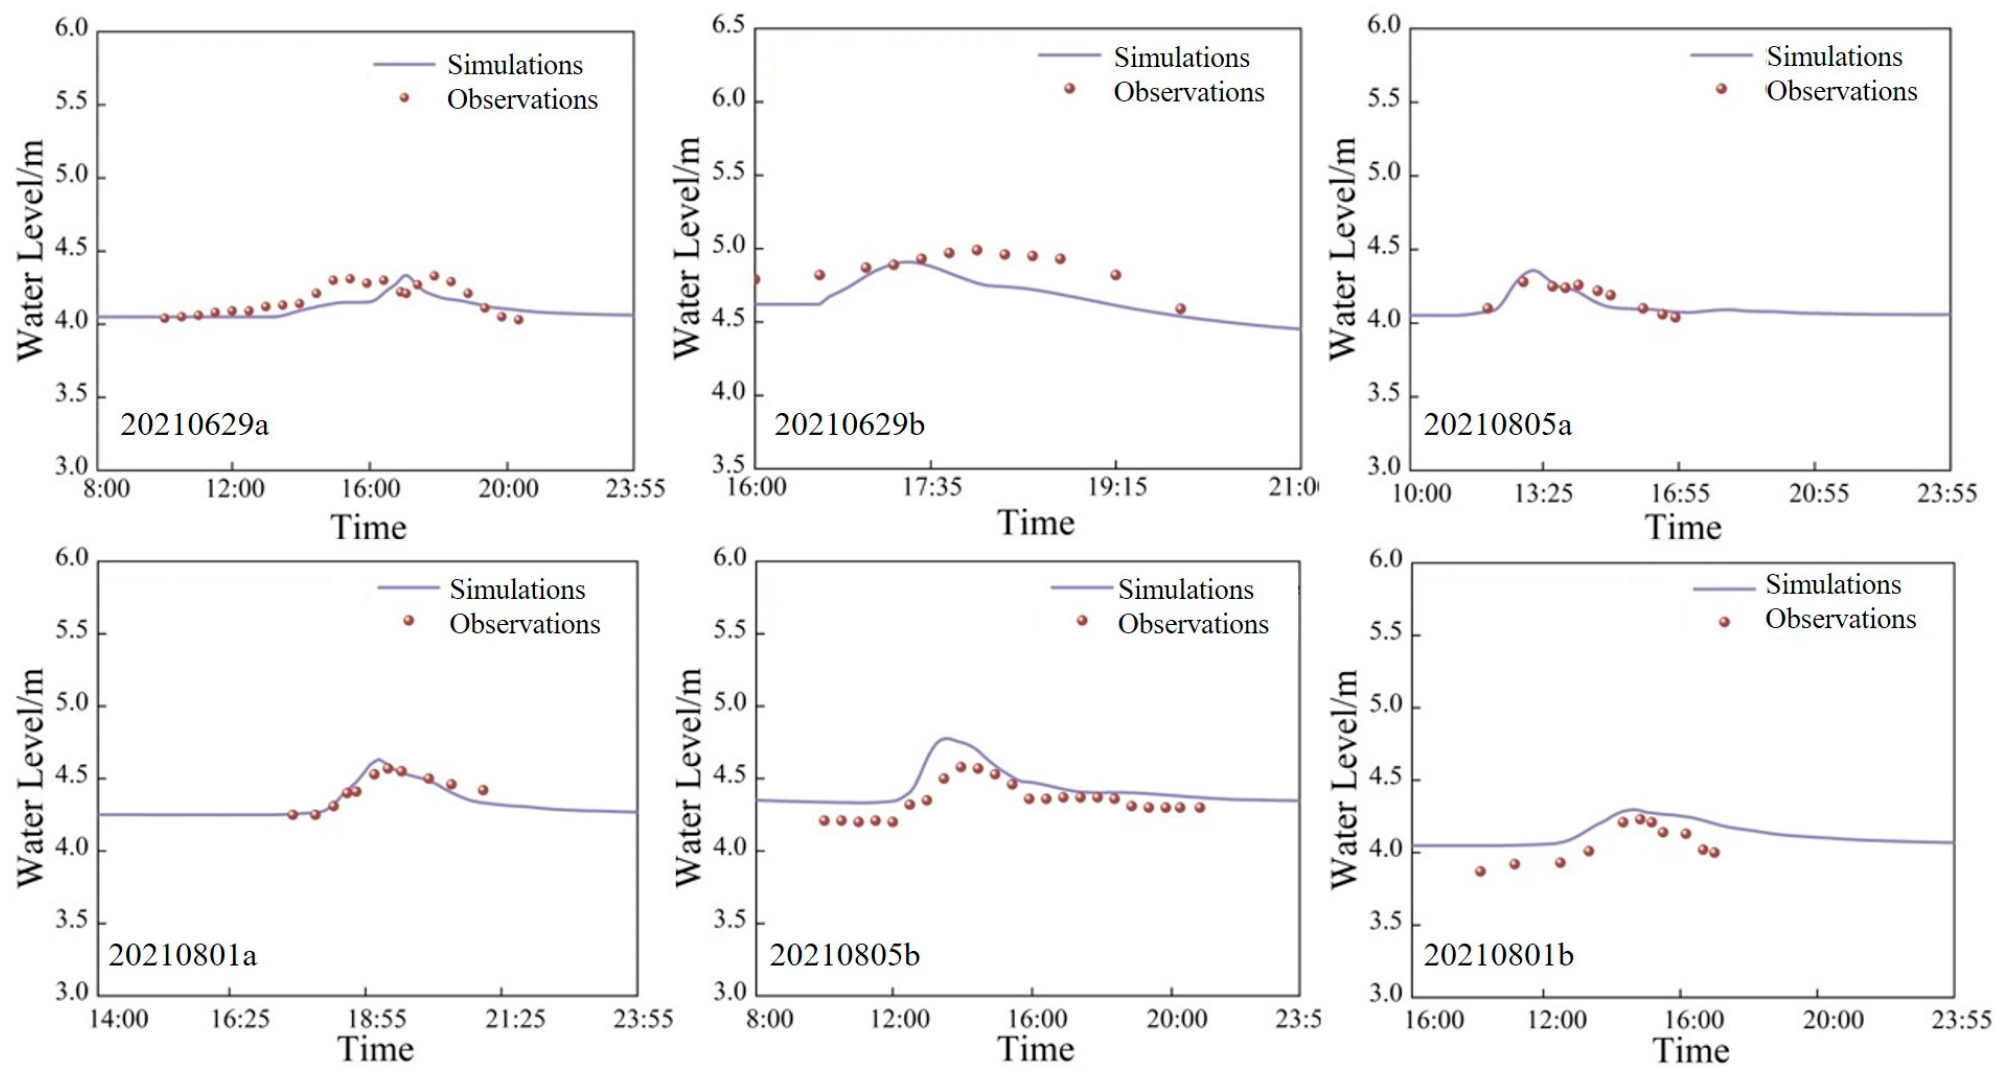
2.1.4. Hydrodynamic Module
2.1.5. Baseline Module
- (1)
- SVM
- (2)
- MLP
- (3)
- Other models
2.2. Evaluation Indices
2.3. Study Area Description
2.4. Data Preparation
2.4.1. Flood Inventories
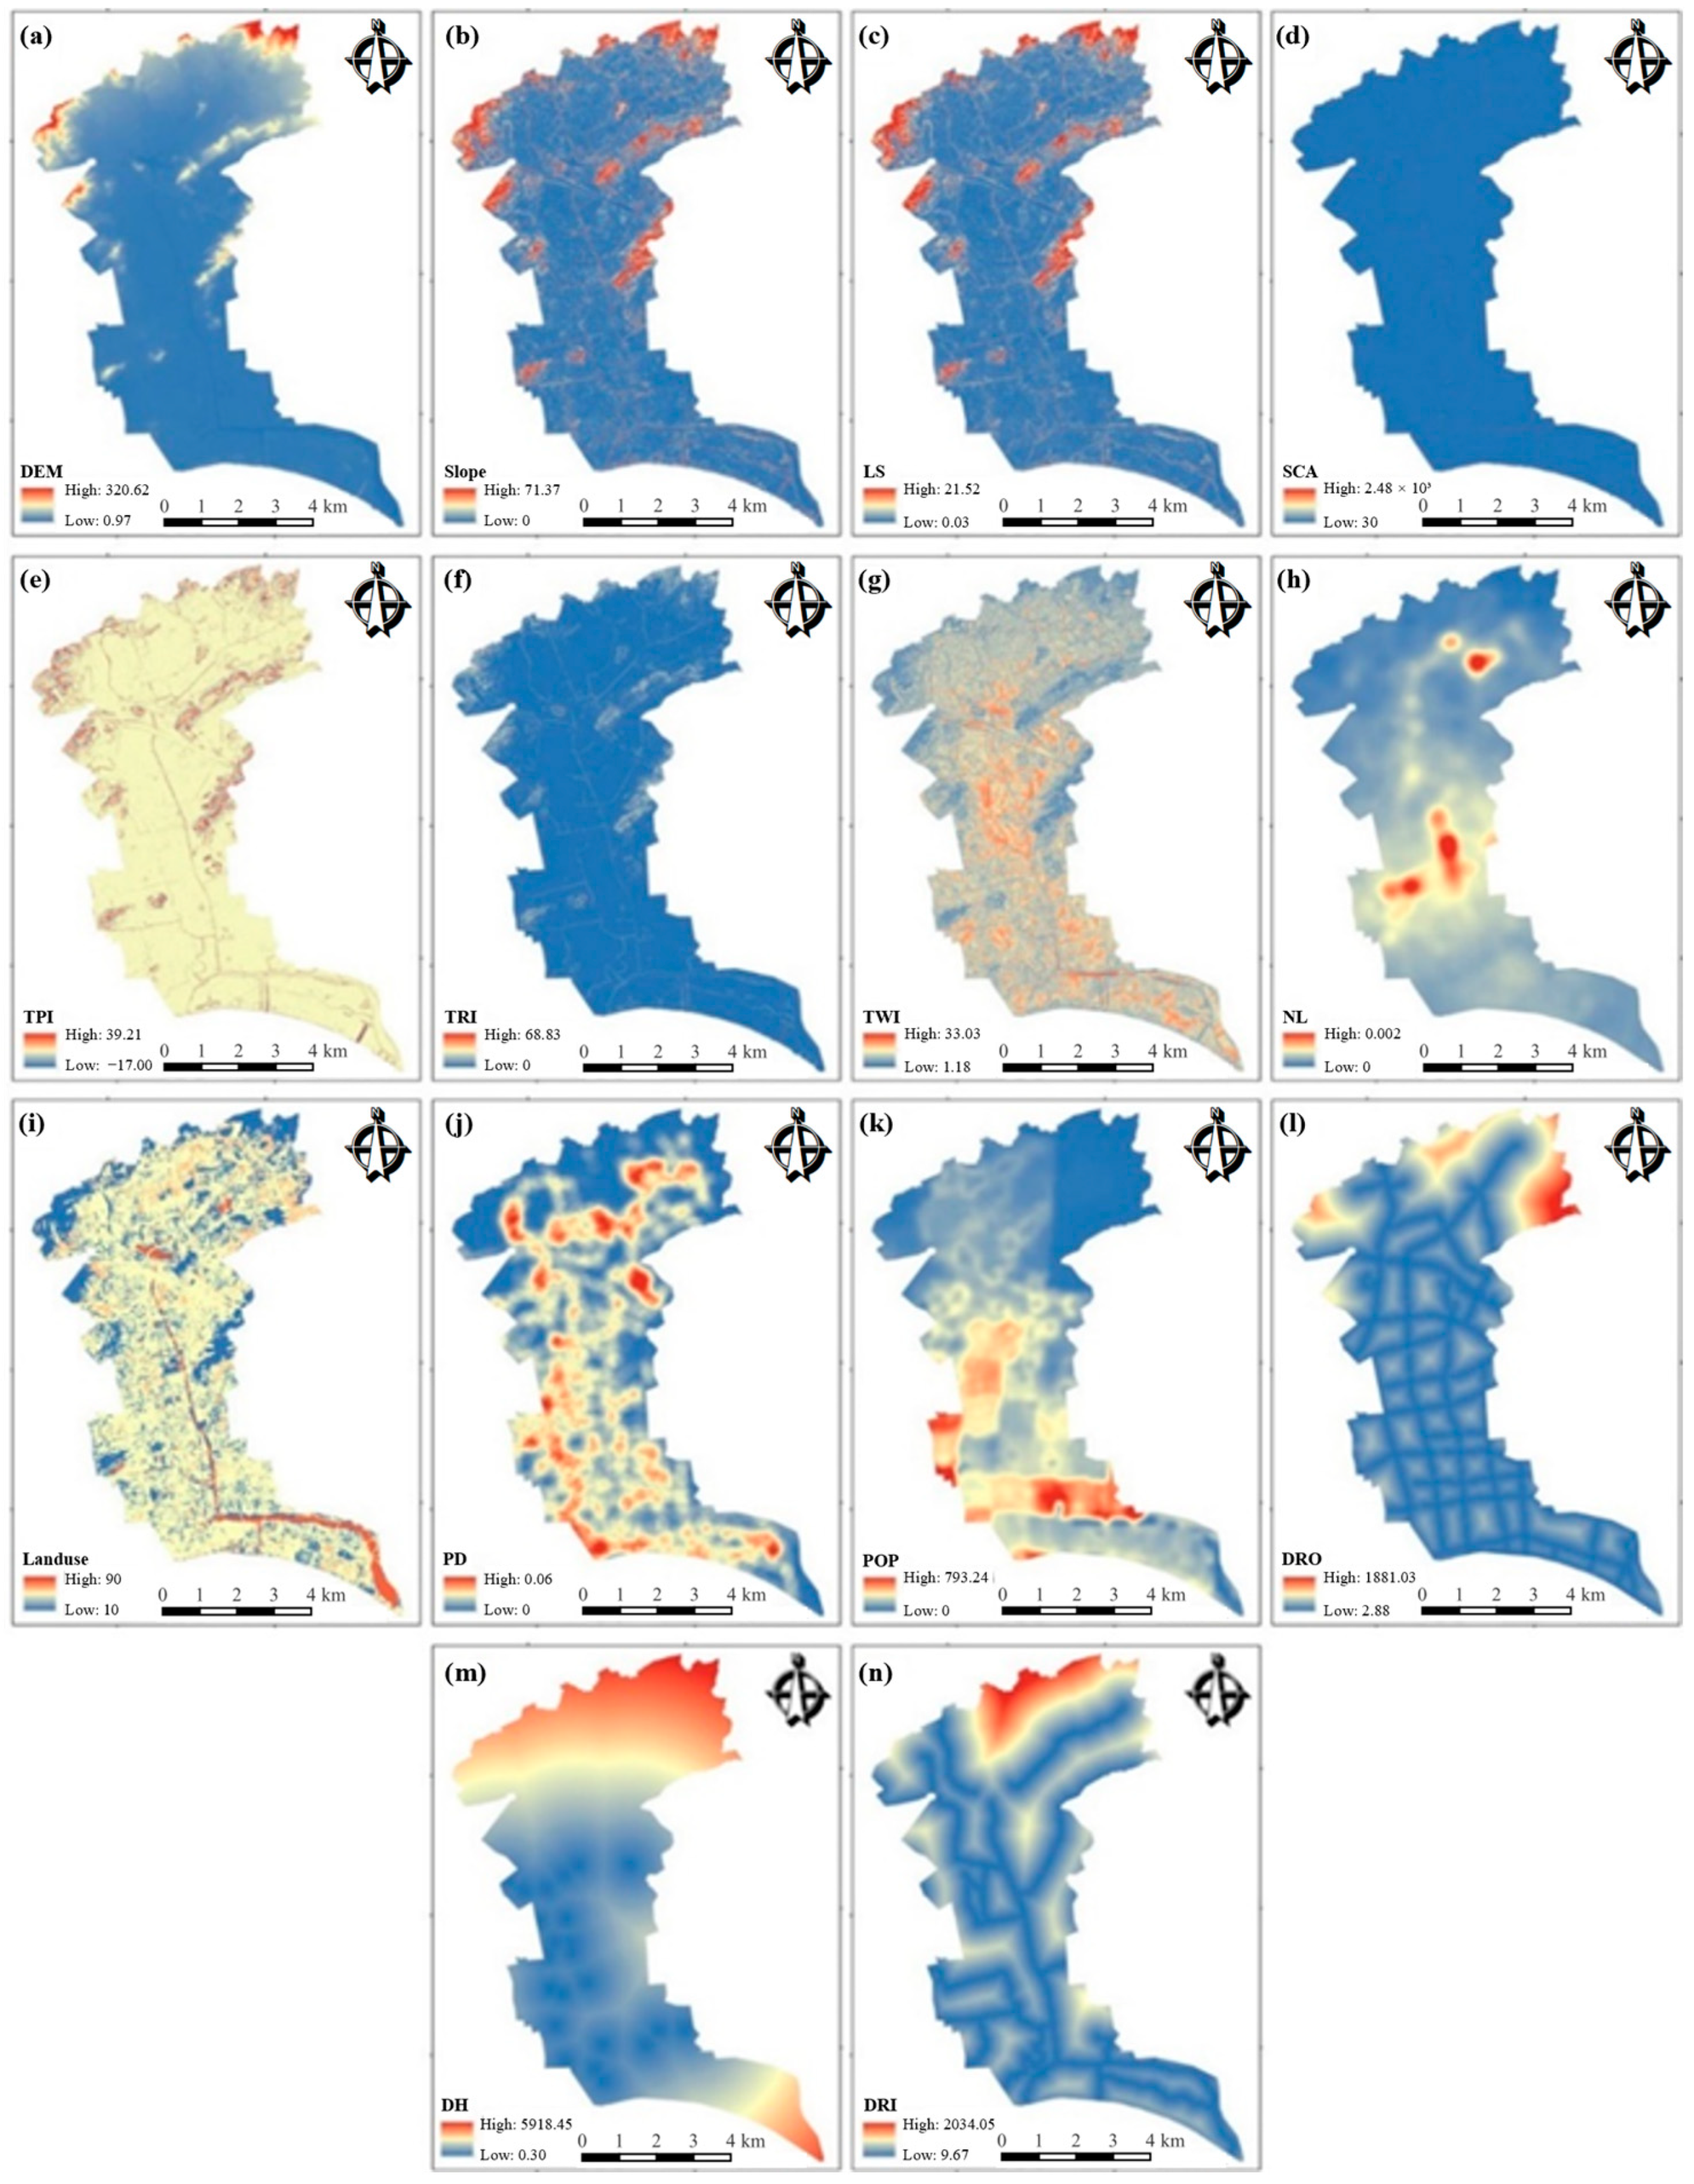
2.4.2. Explanatory Factors
- (1)
- Topographic and hydrological factors
- (2)
- Socioeconomic and anthropologic factors
3. Results and Discussion
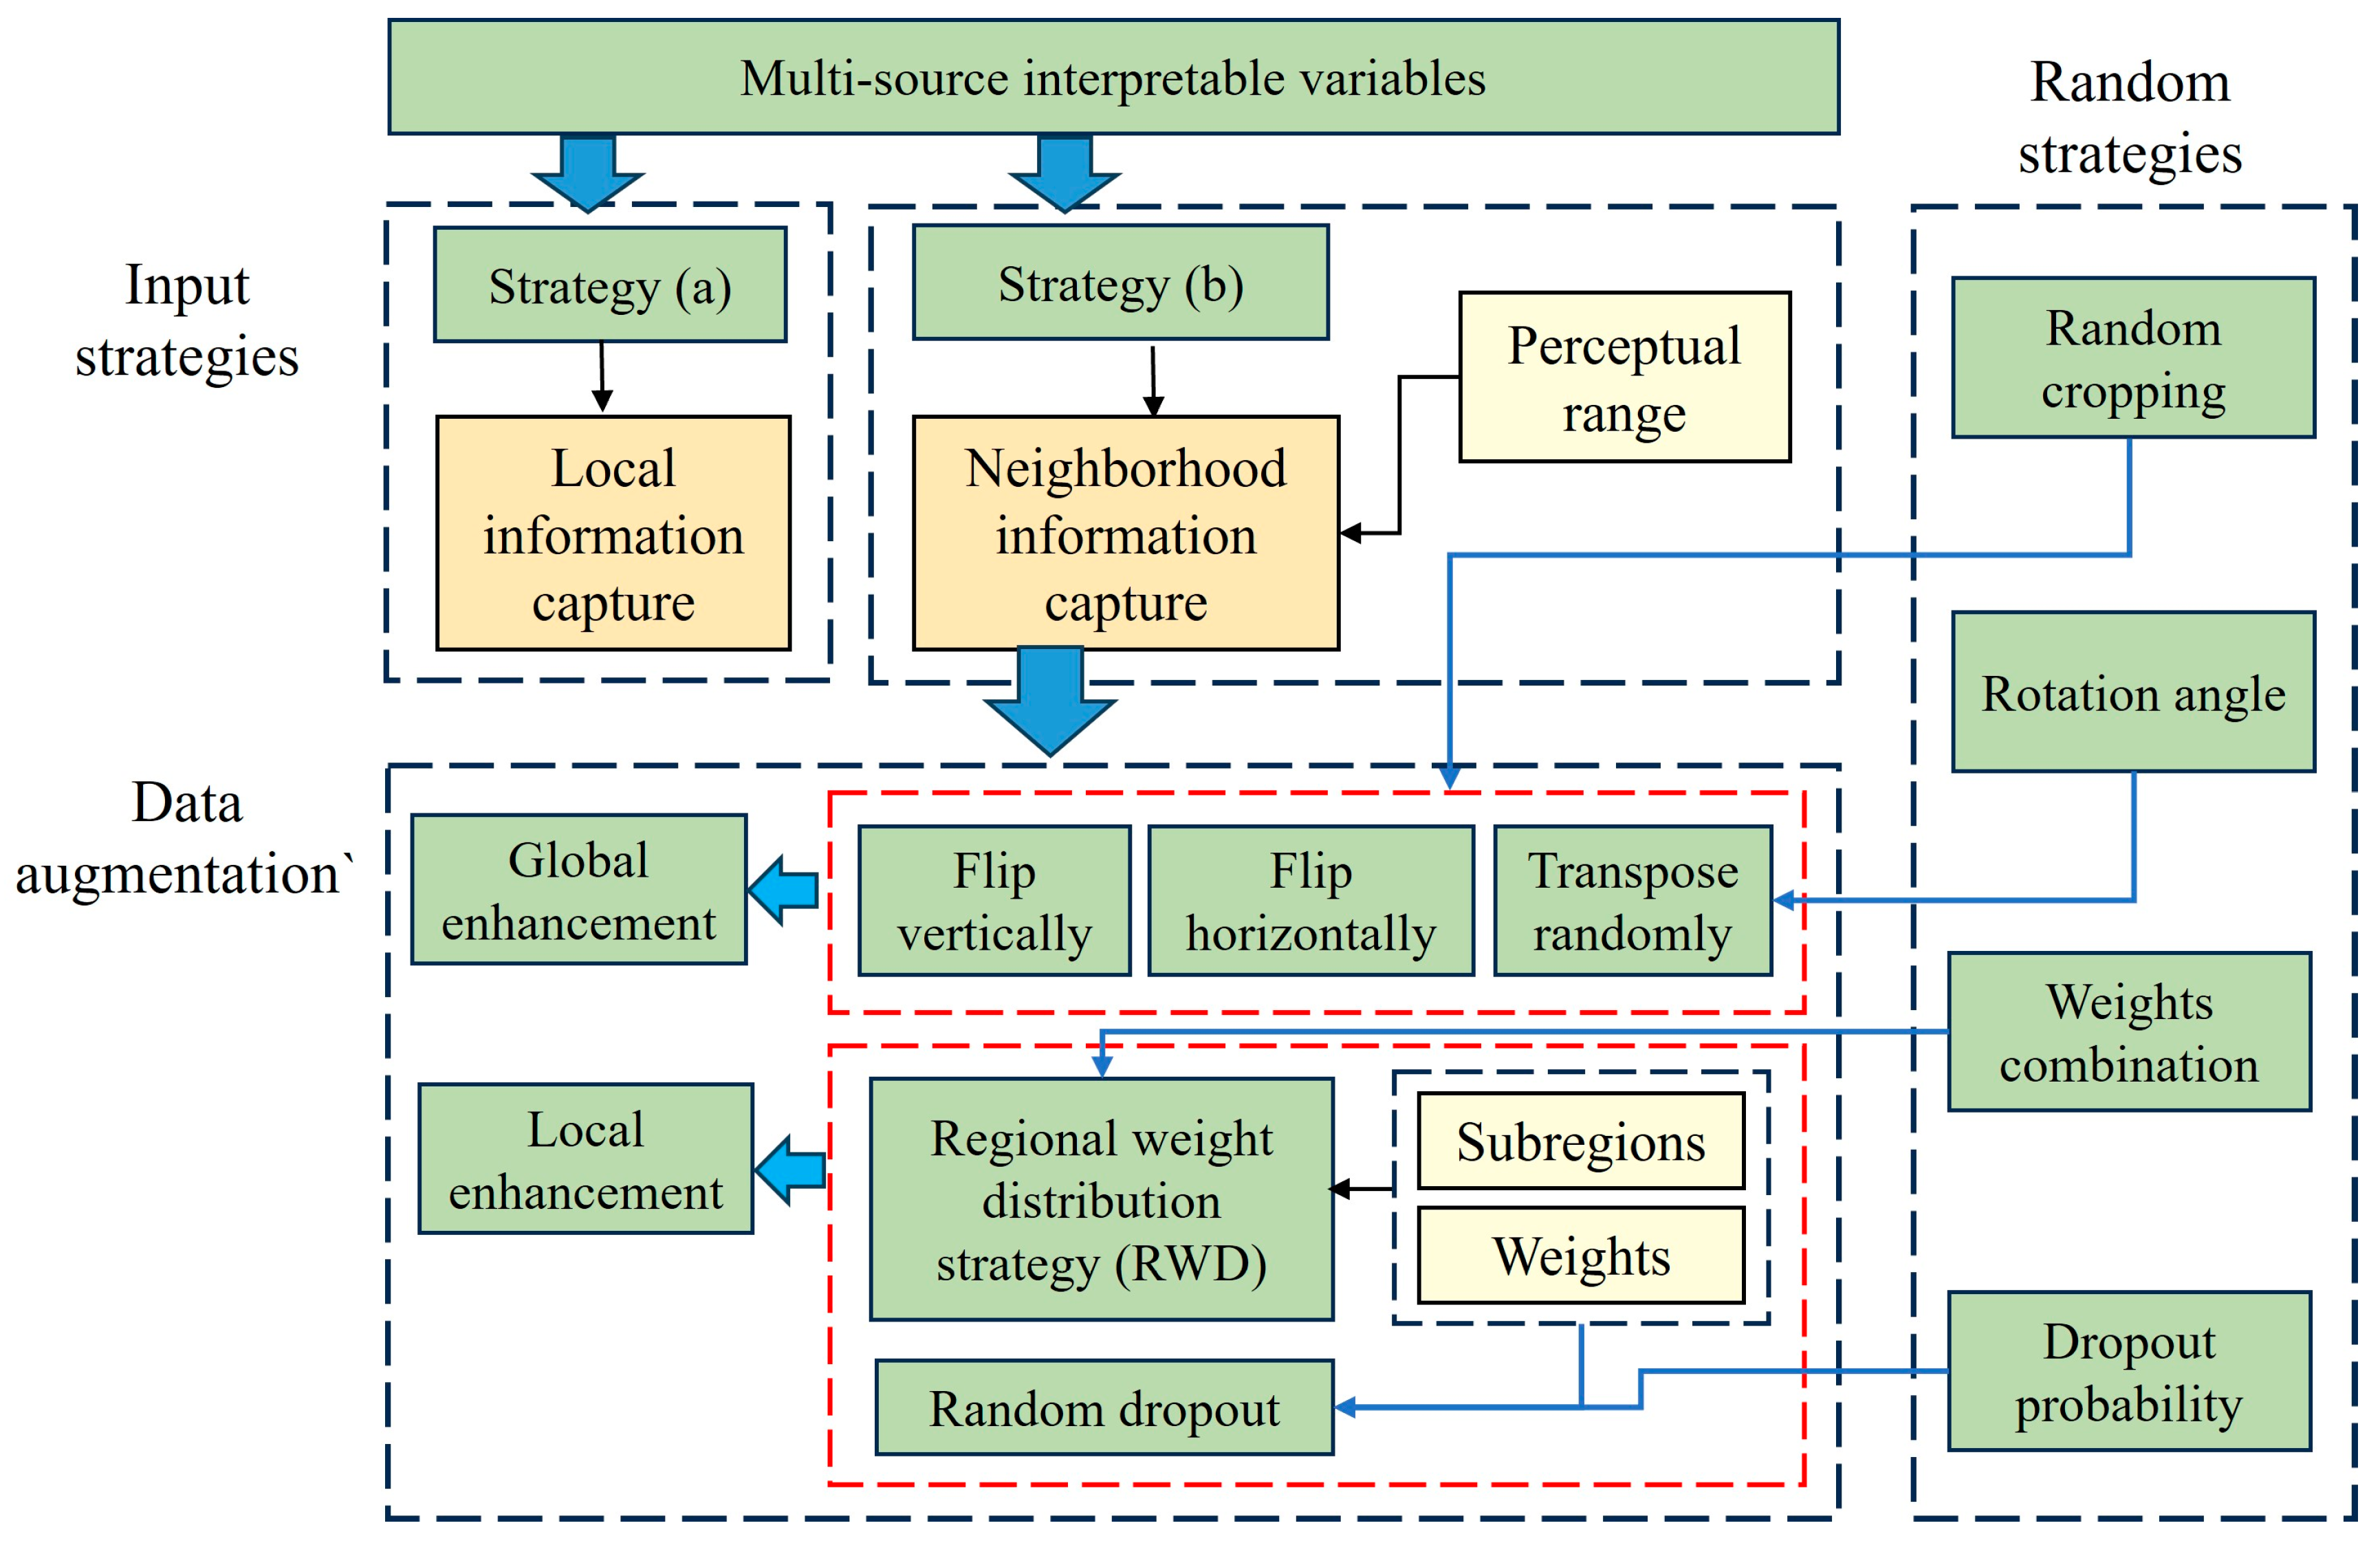
3.1. Performance Comparison Driven by Two Input Strategies
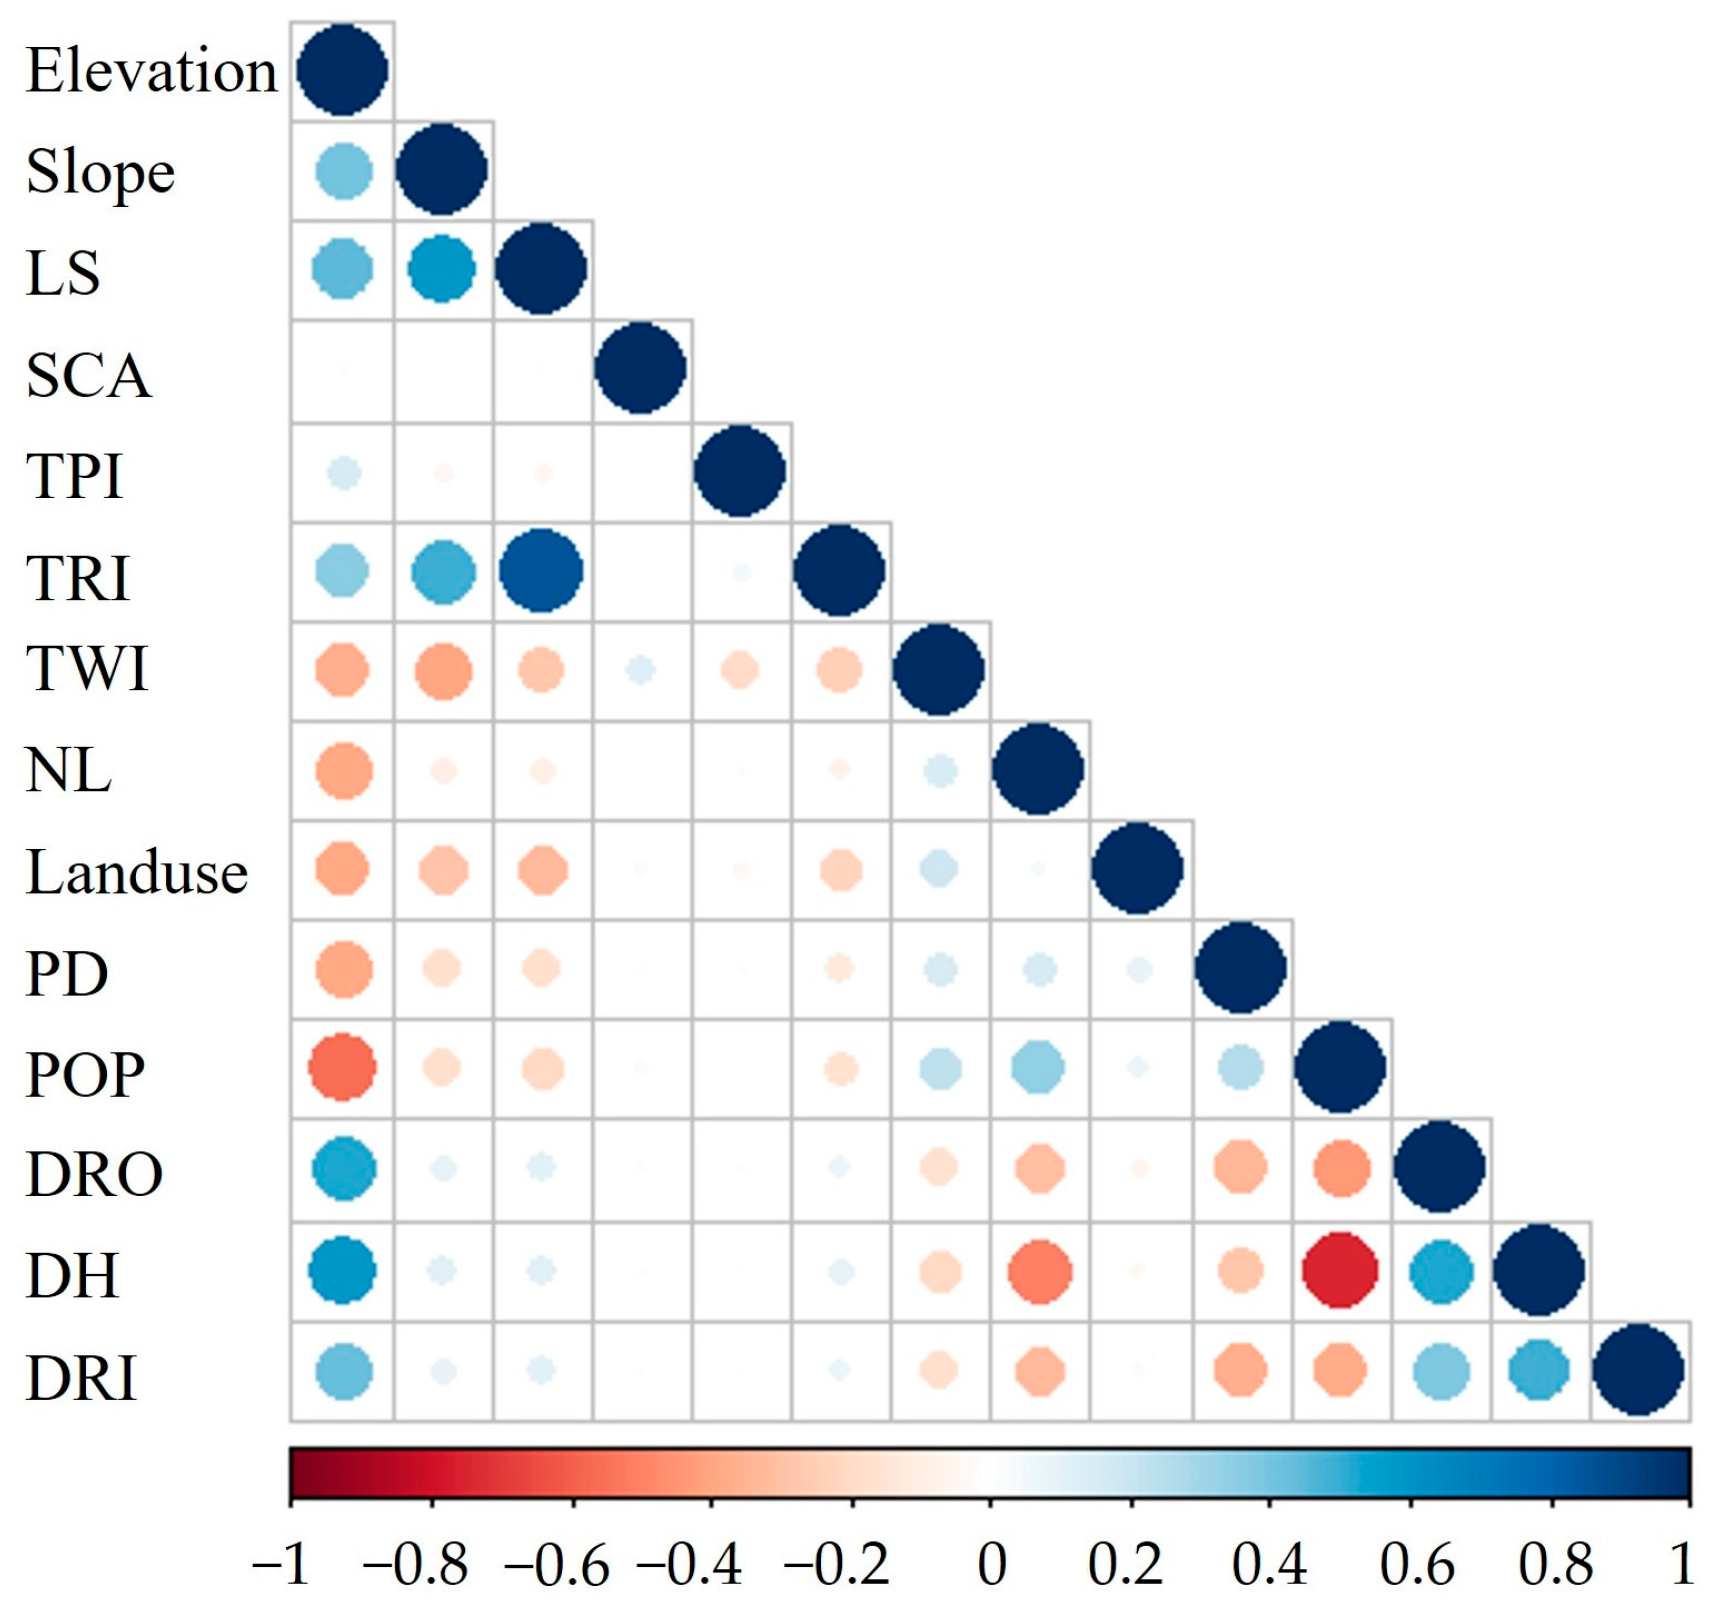
3.1.1. Correlation Analysis of Features
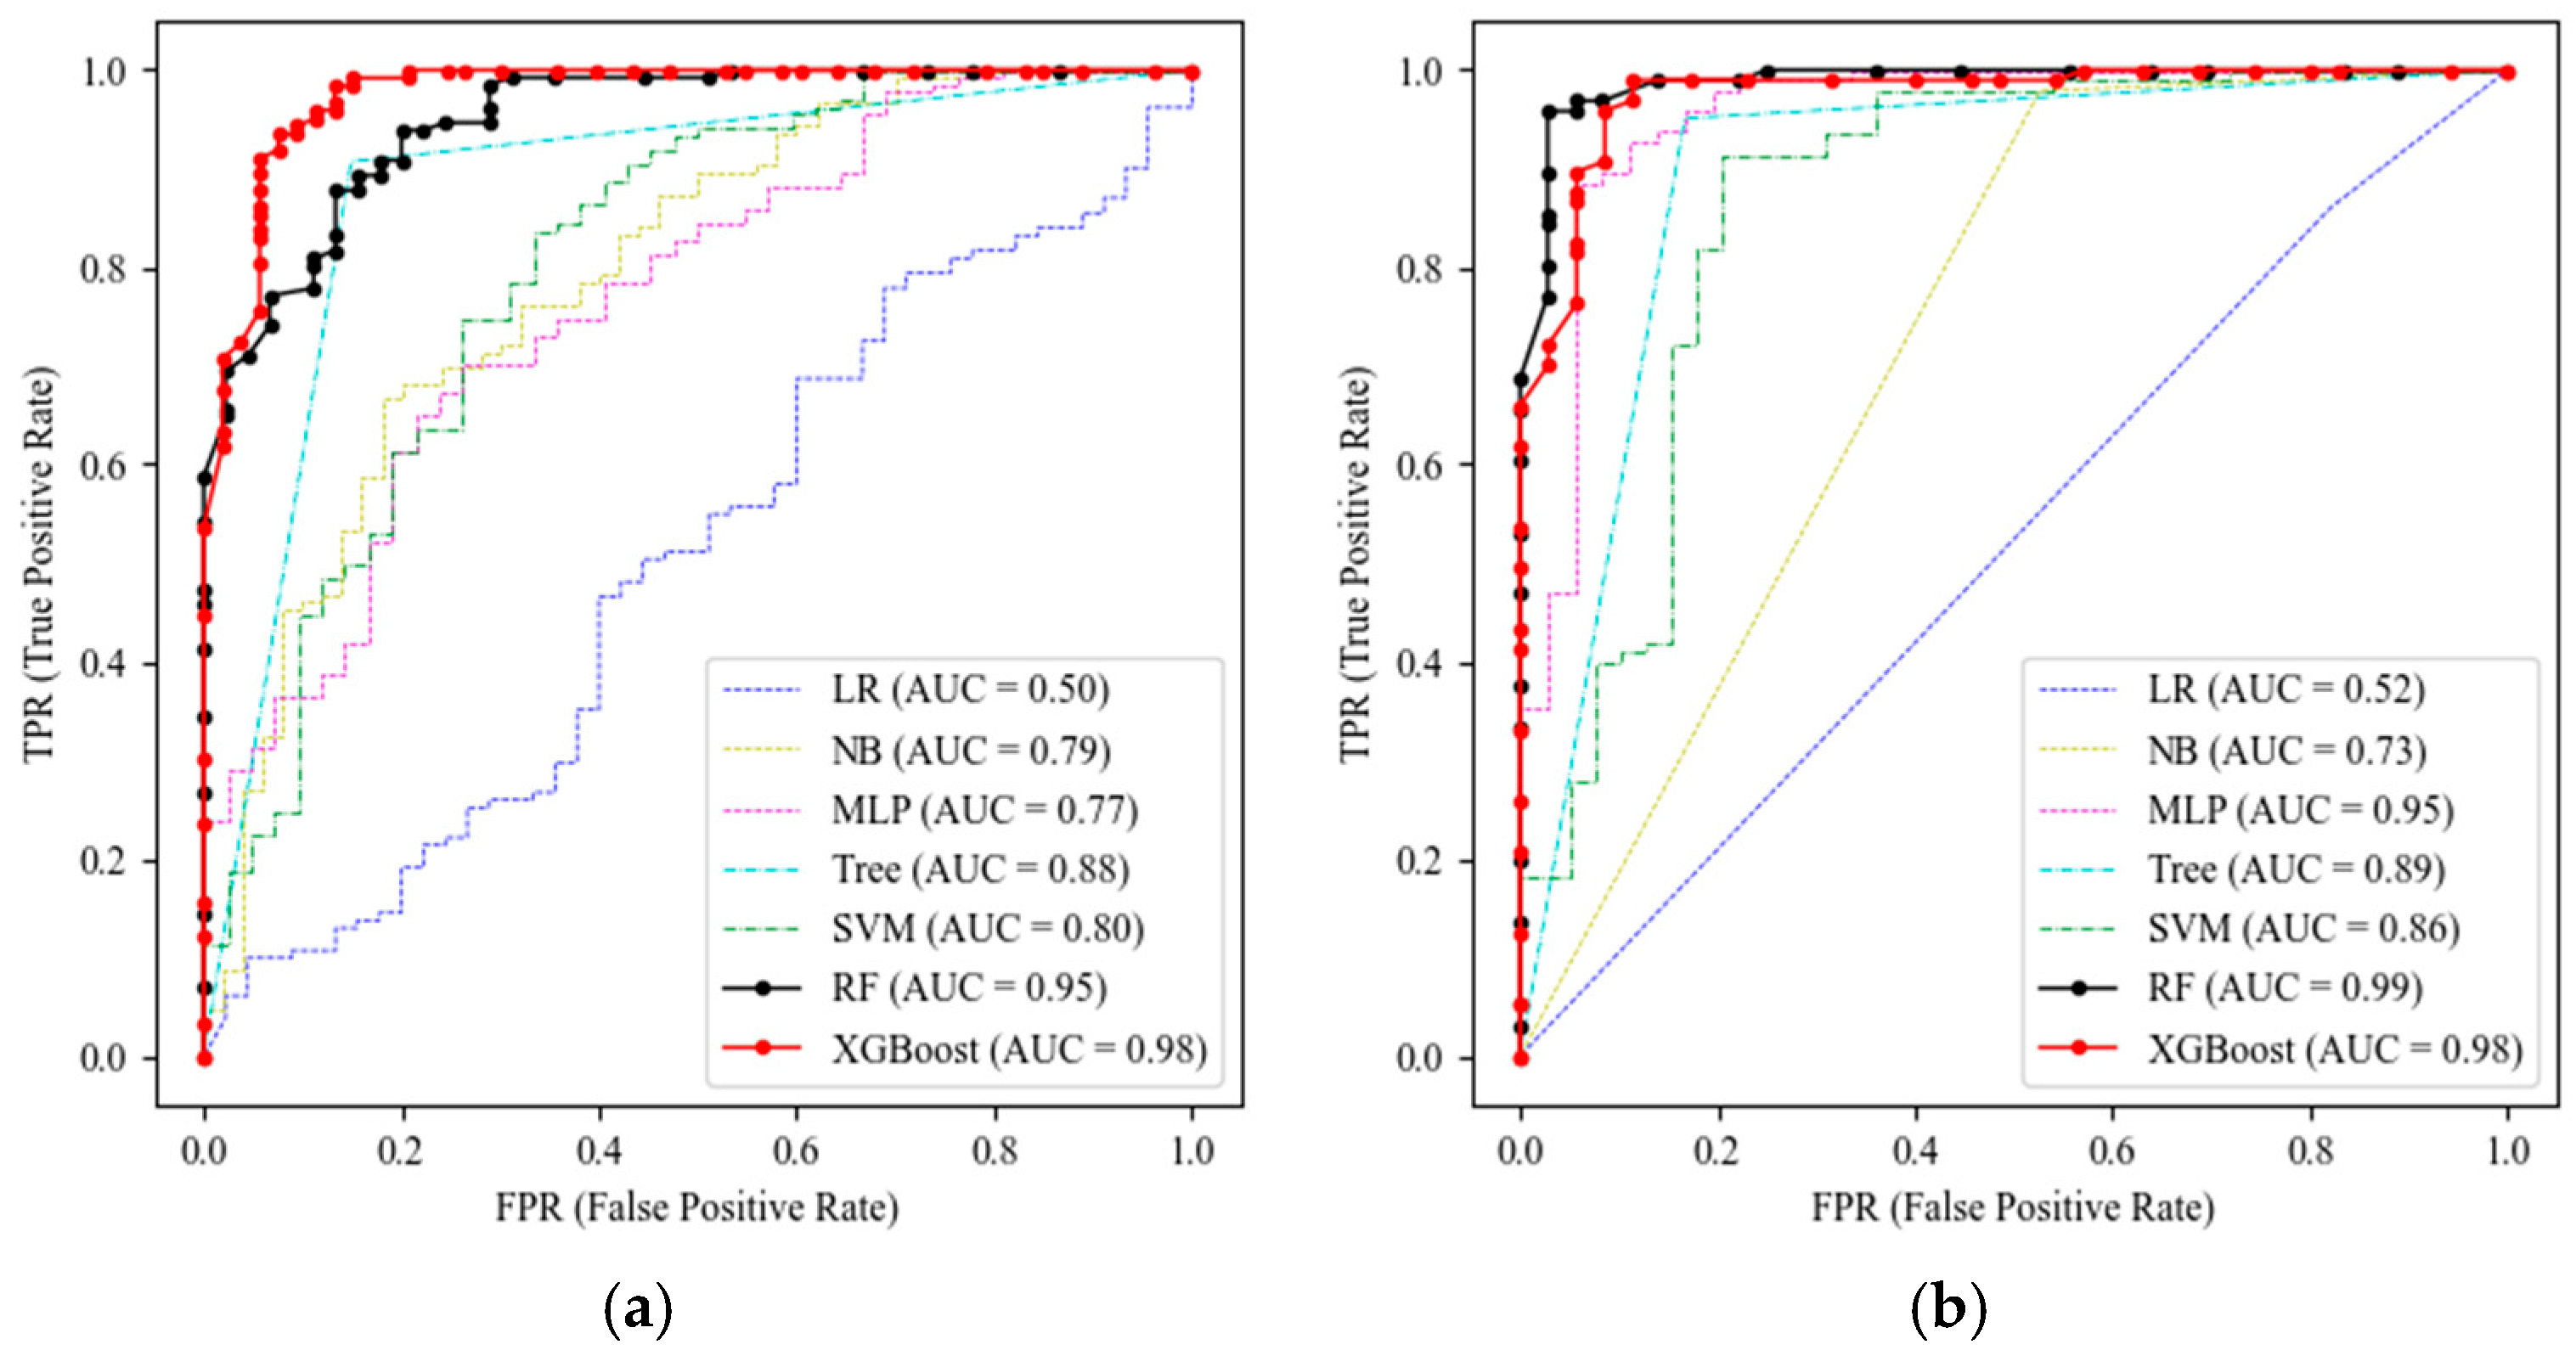
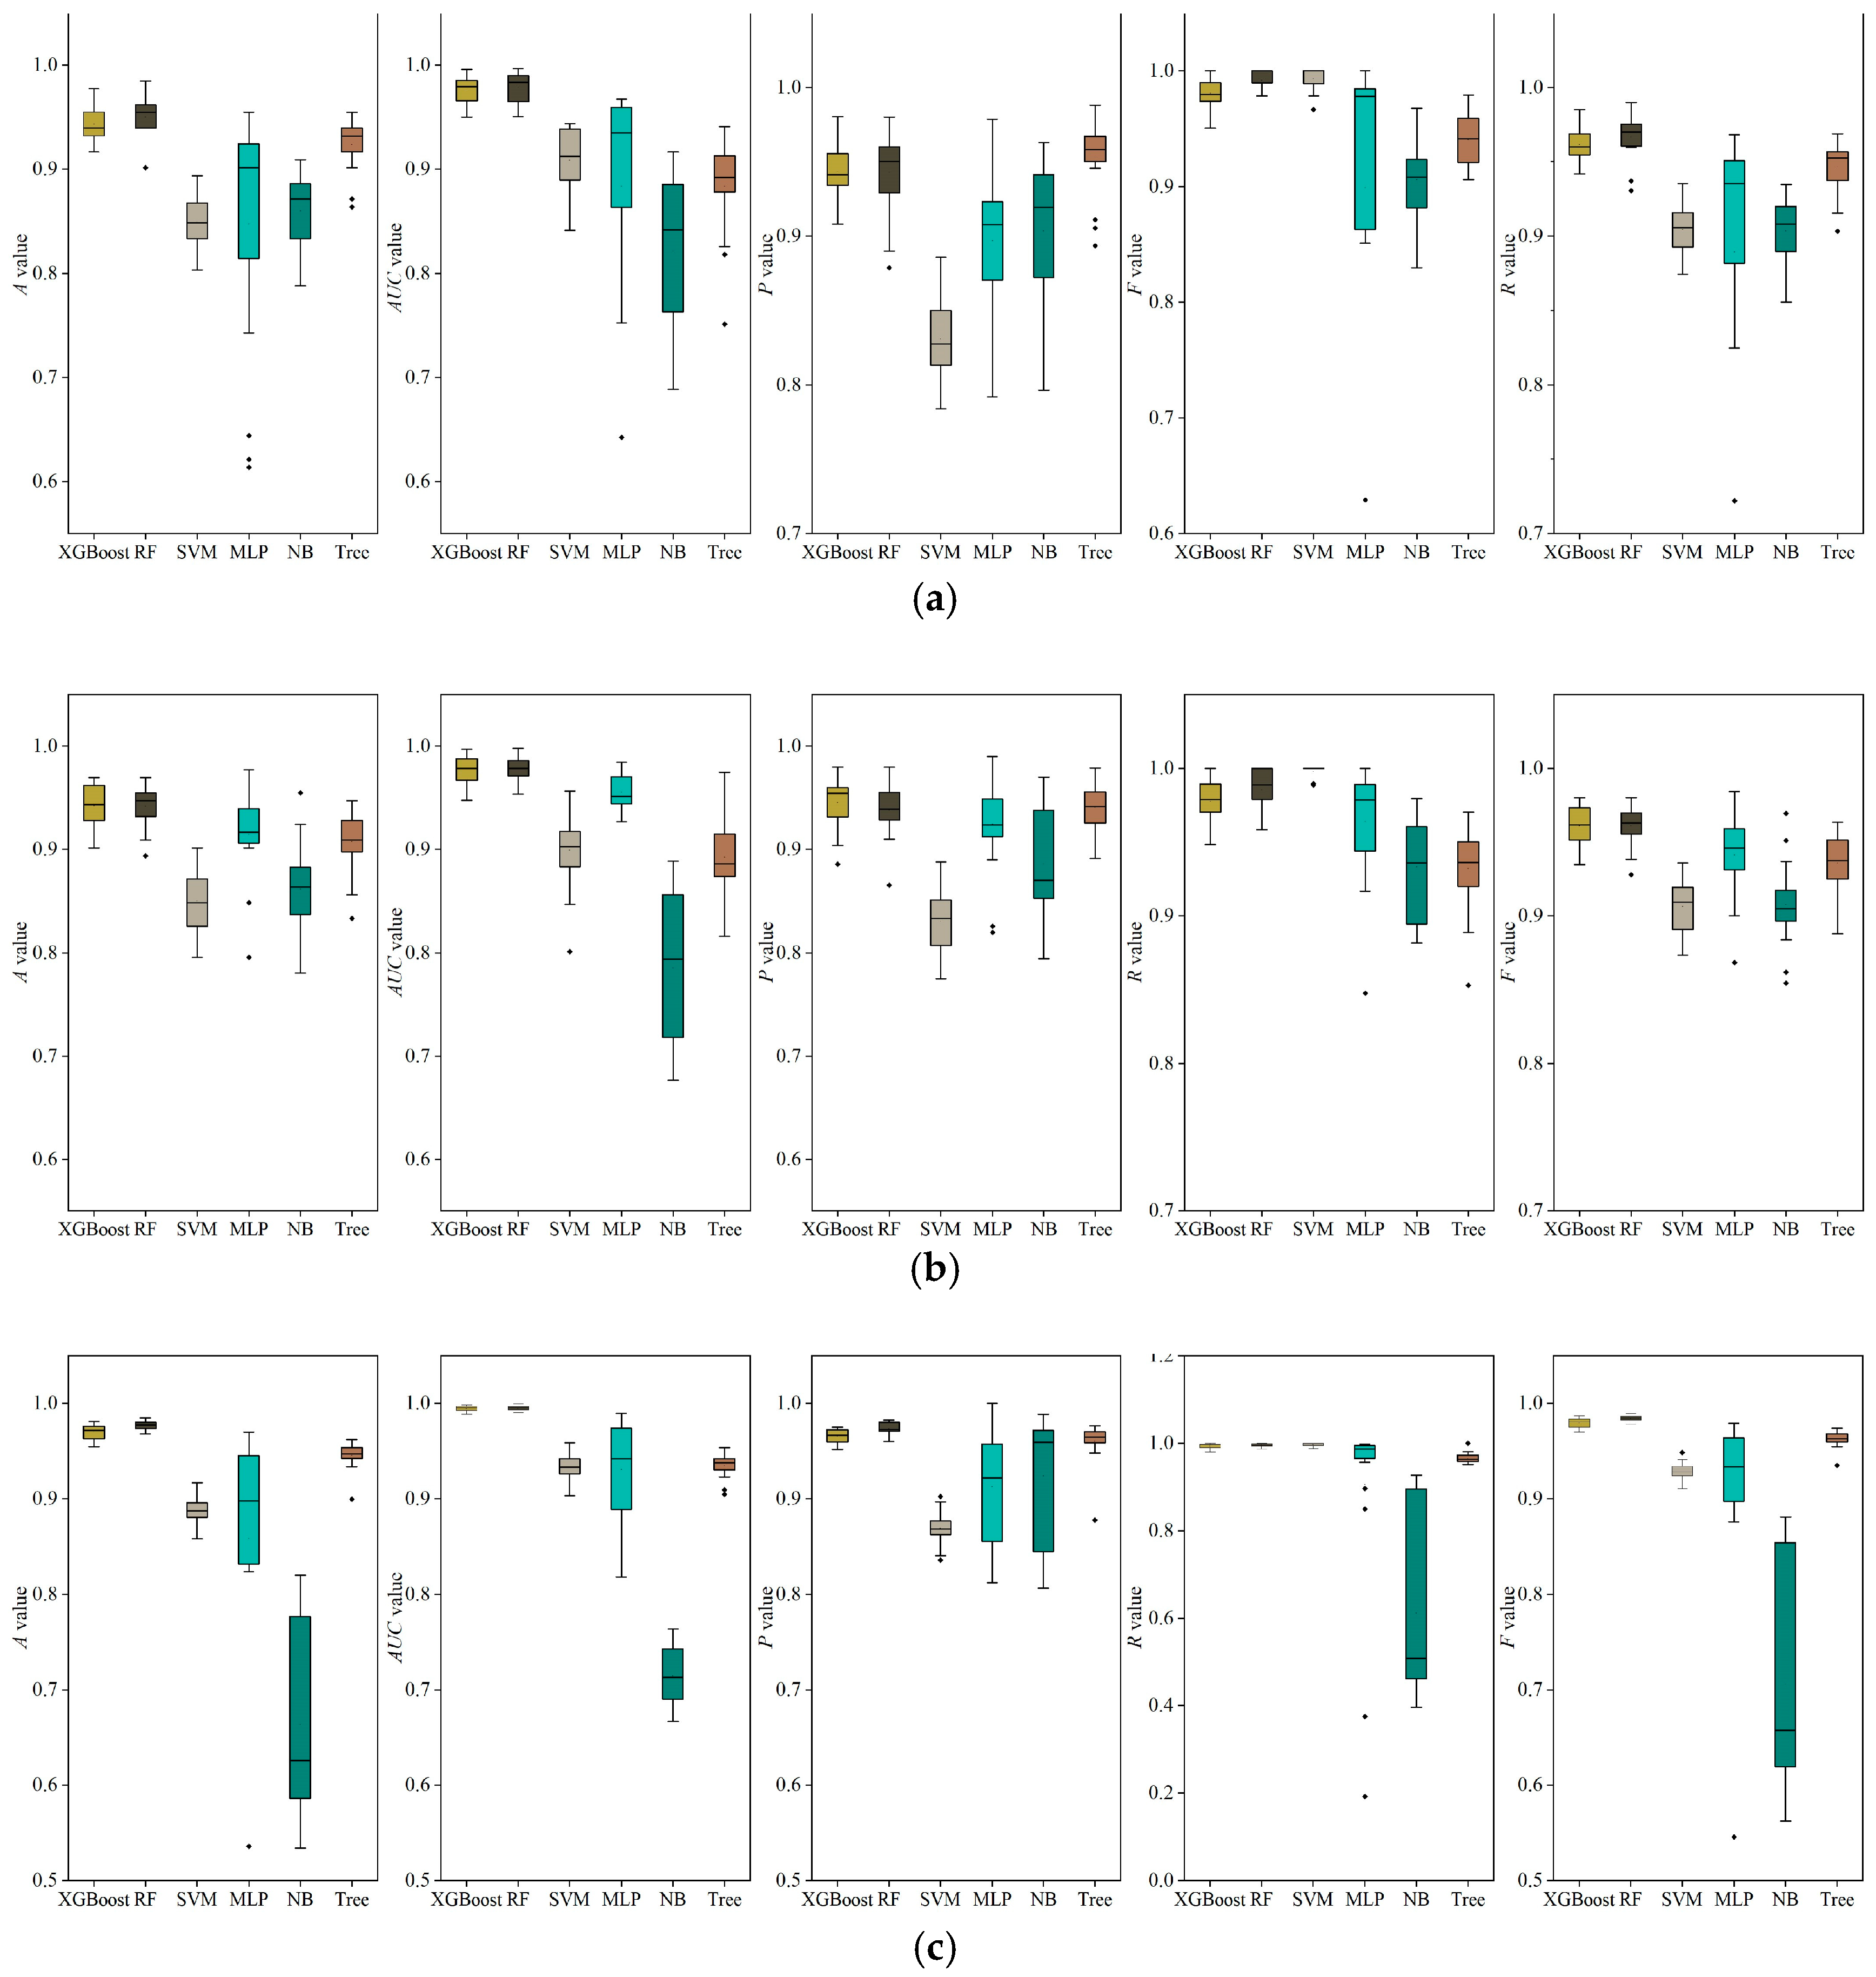
3.1.2. Performance Comparison by Two Strategies
3.2. Model Performance Based on Improved Feature Extracting Strategies
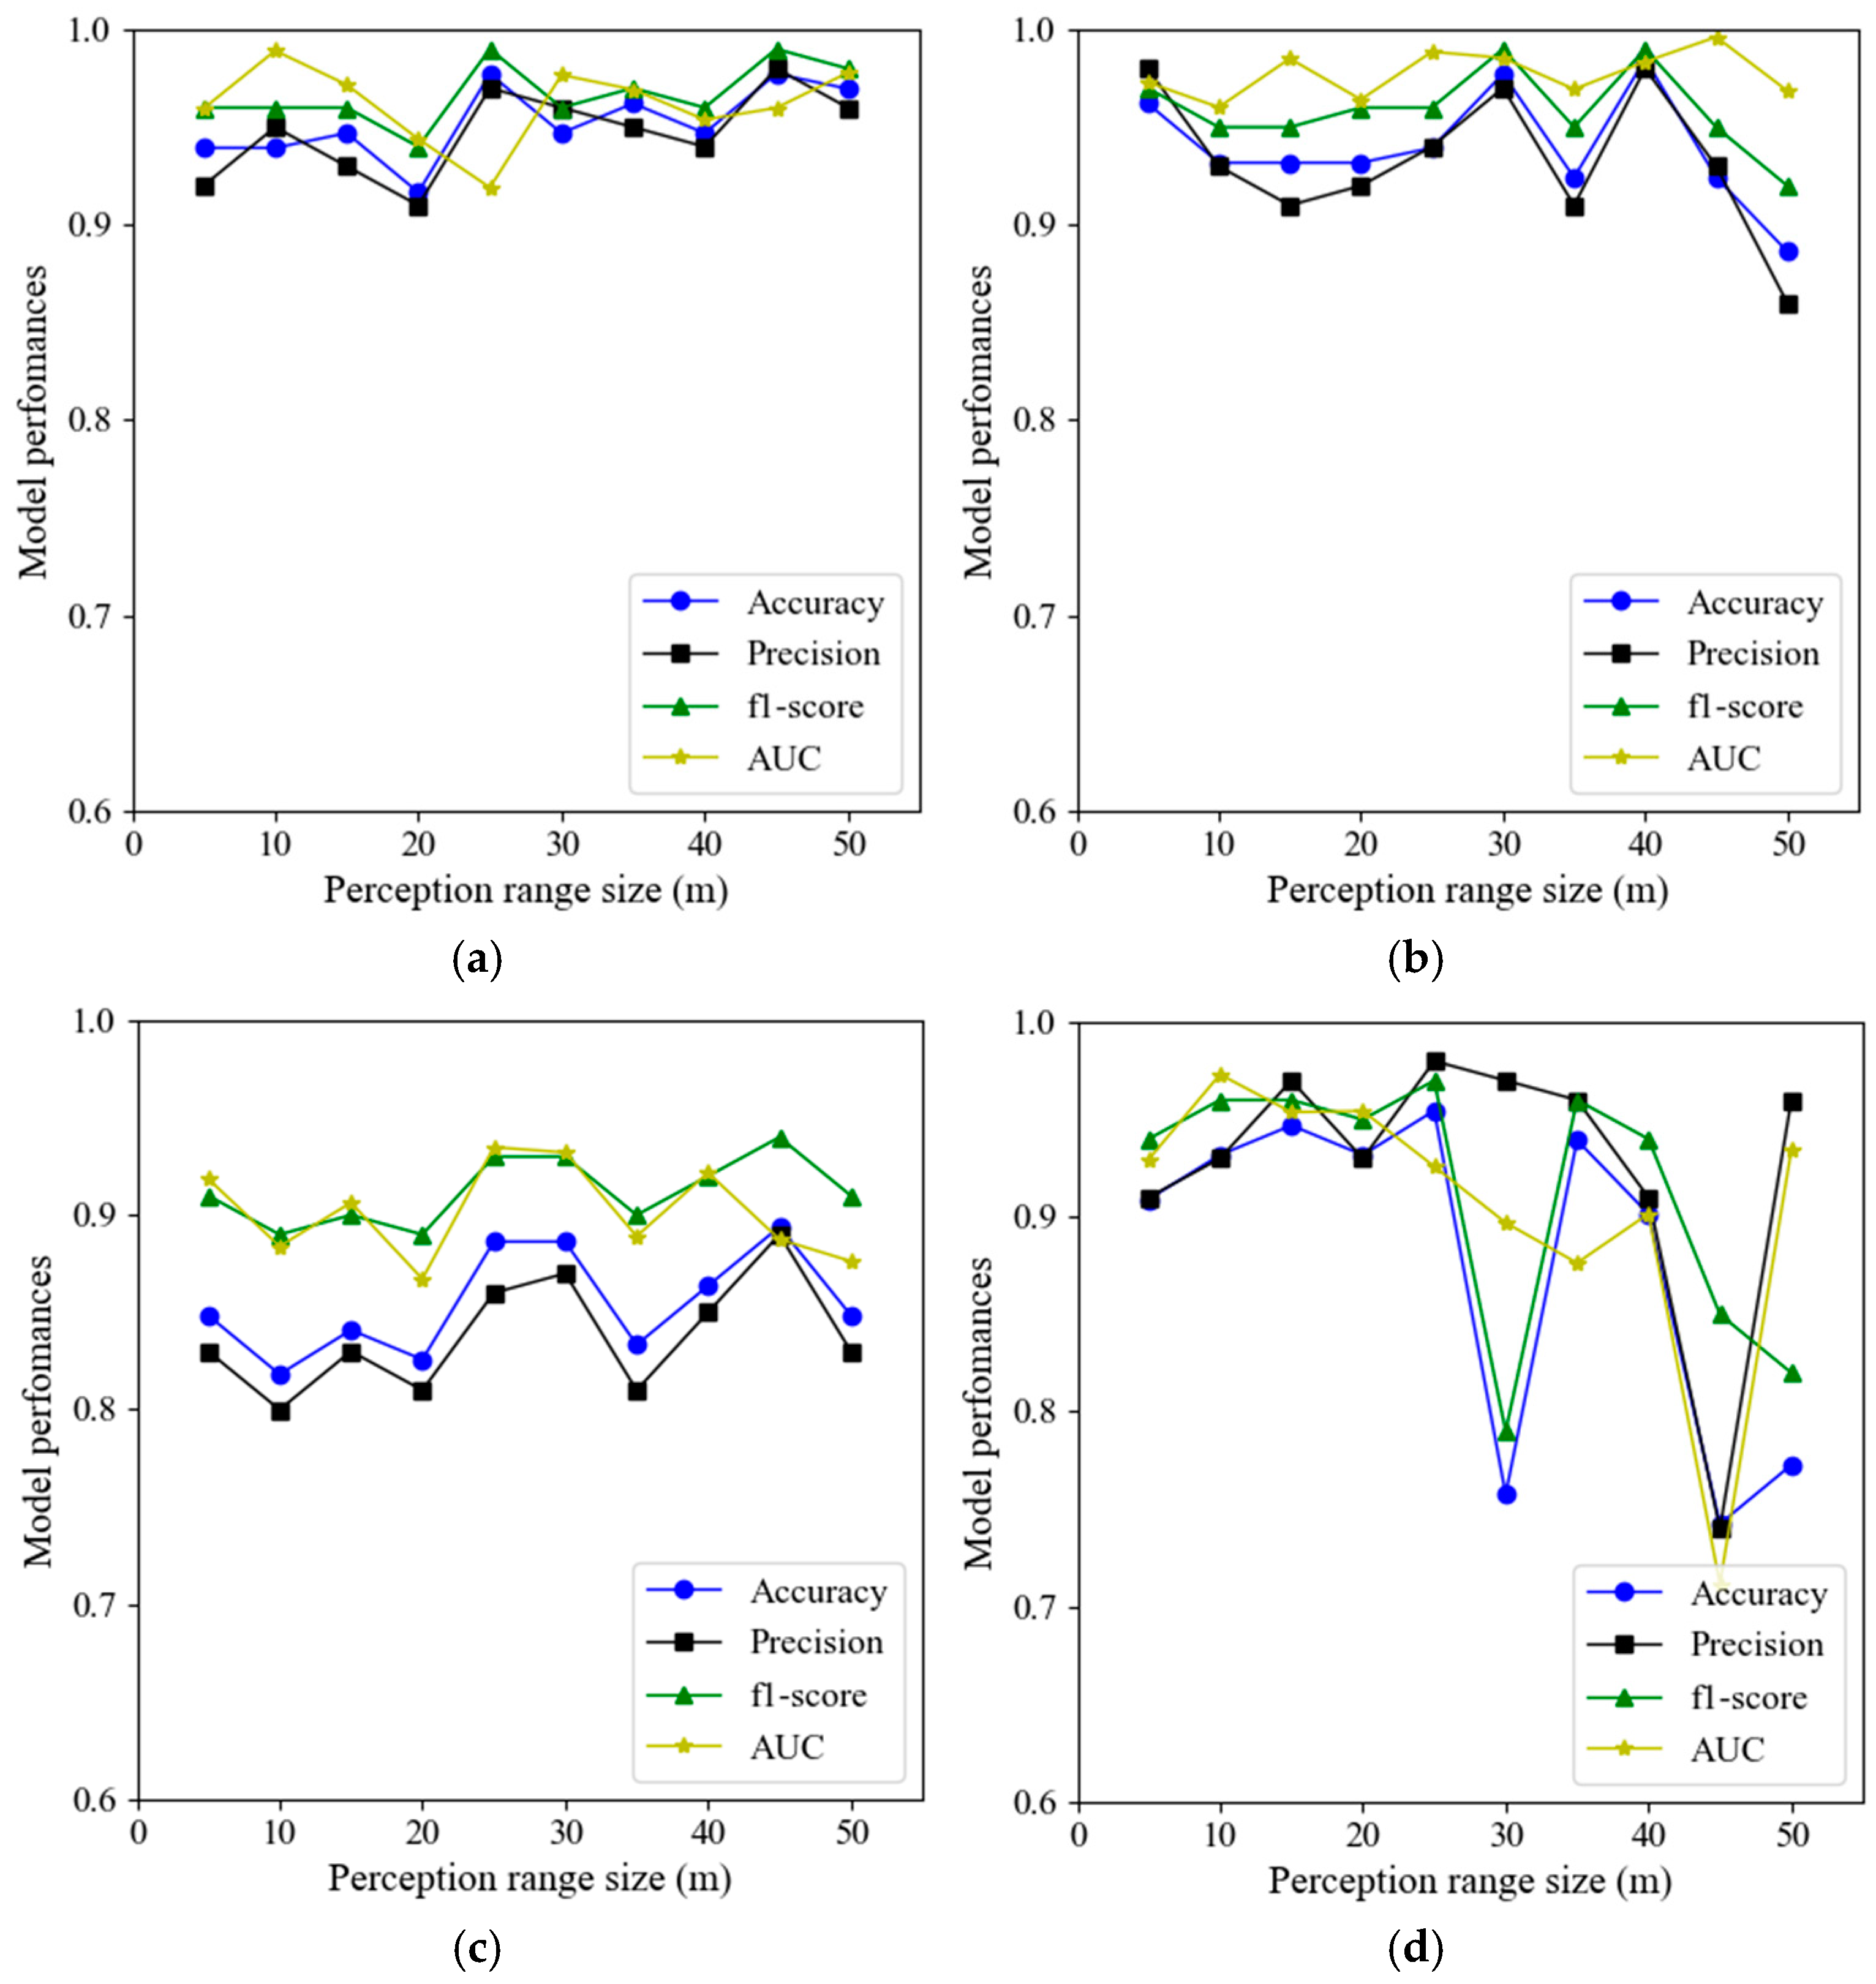
3.2.1. Perception Range Optimizing
3.2.2. Performance Improvements Through Data Augmentation
3.2.3. Performance Analysis Based on RWD and RD
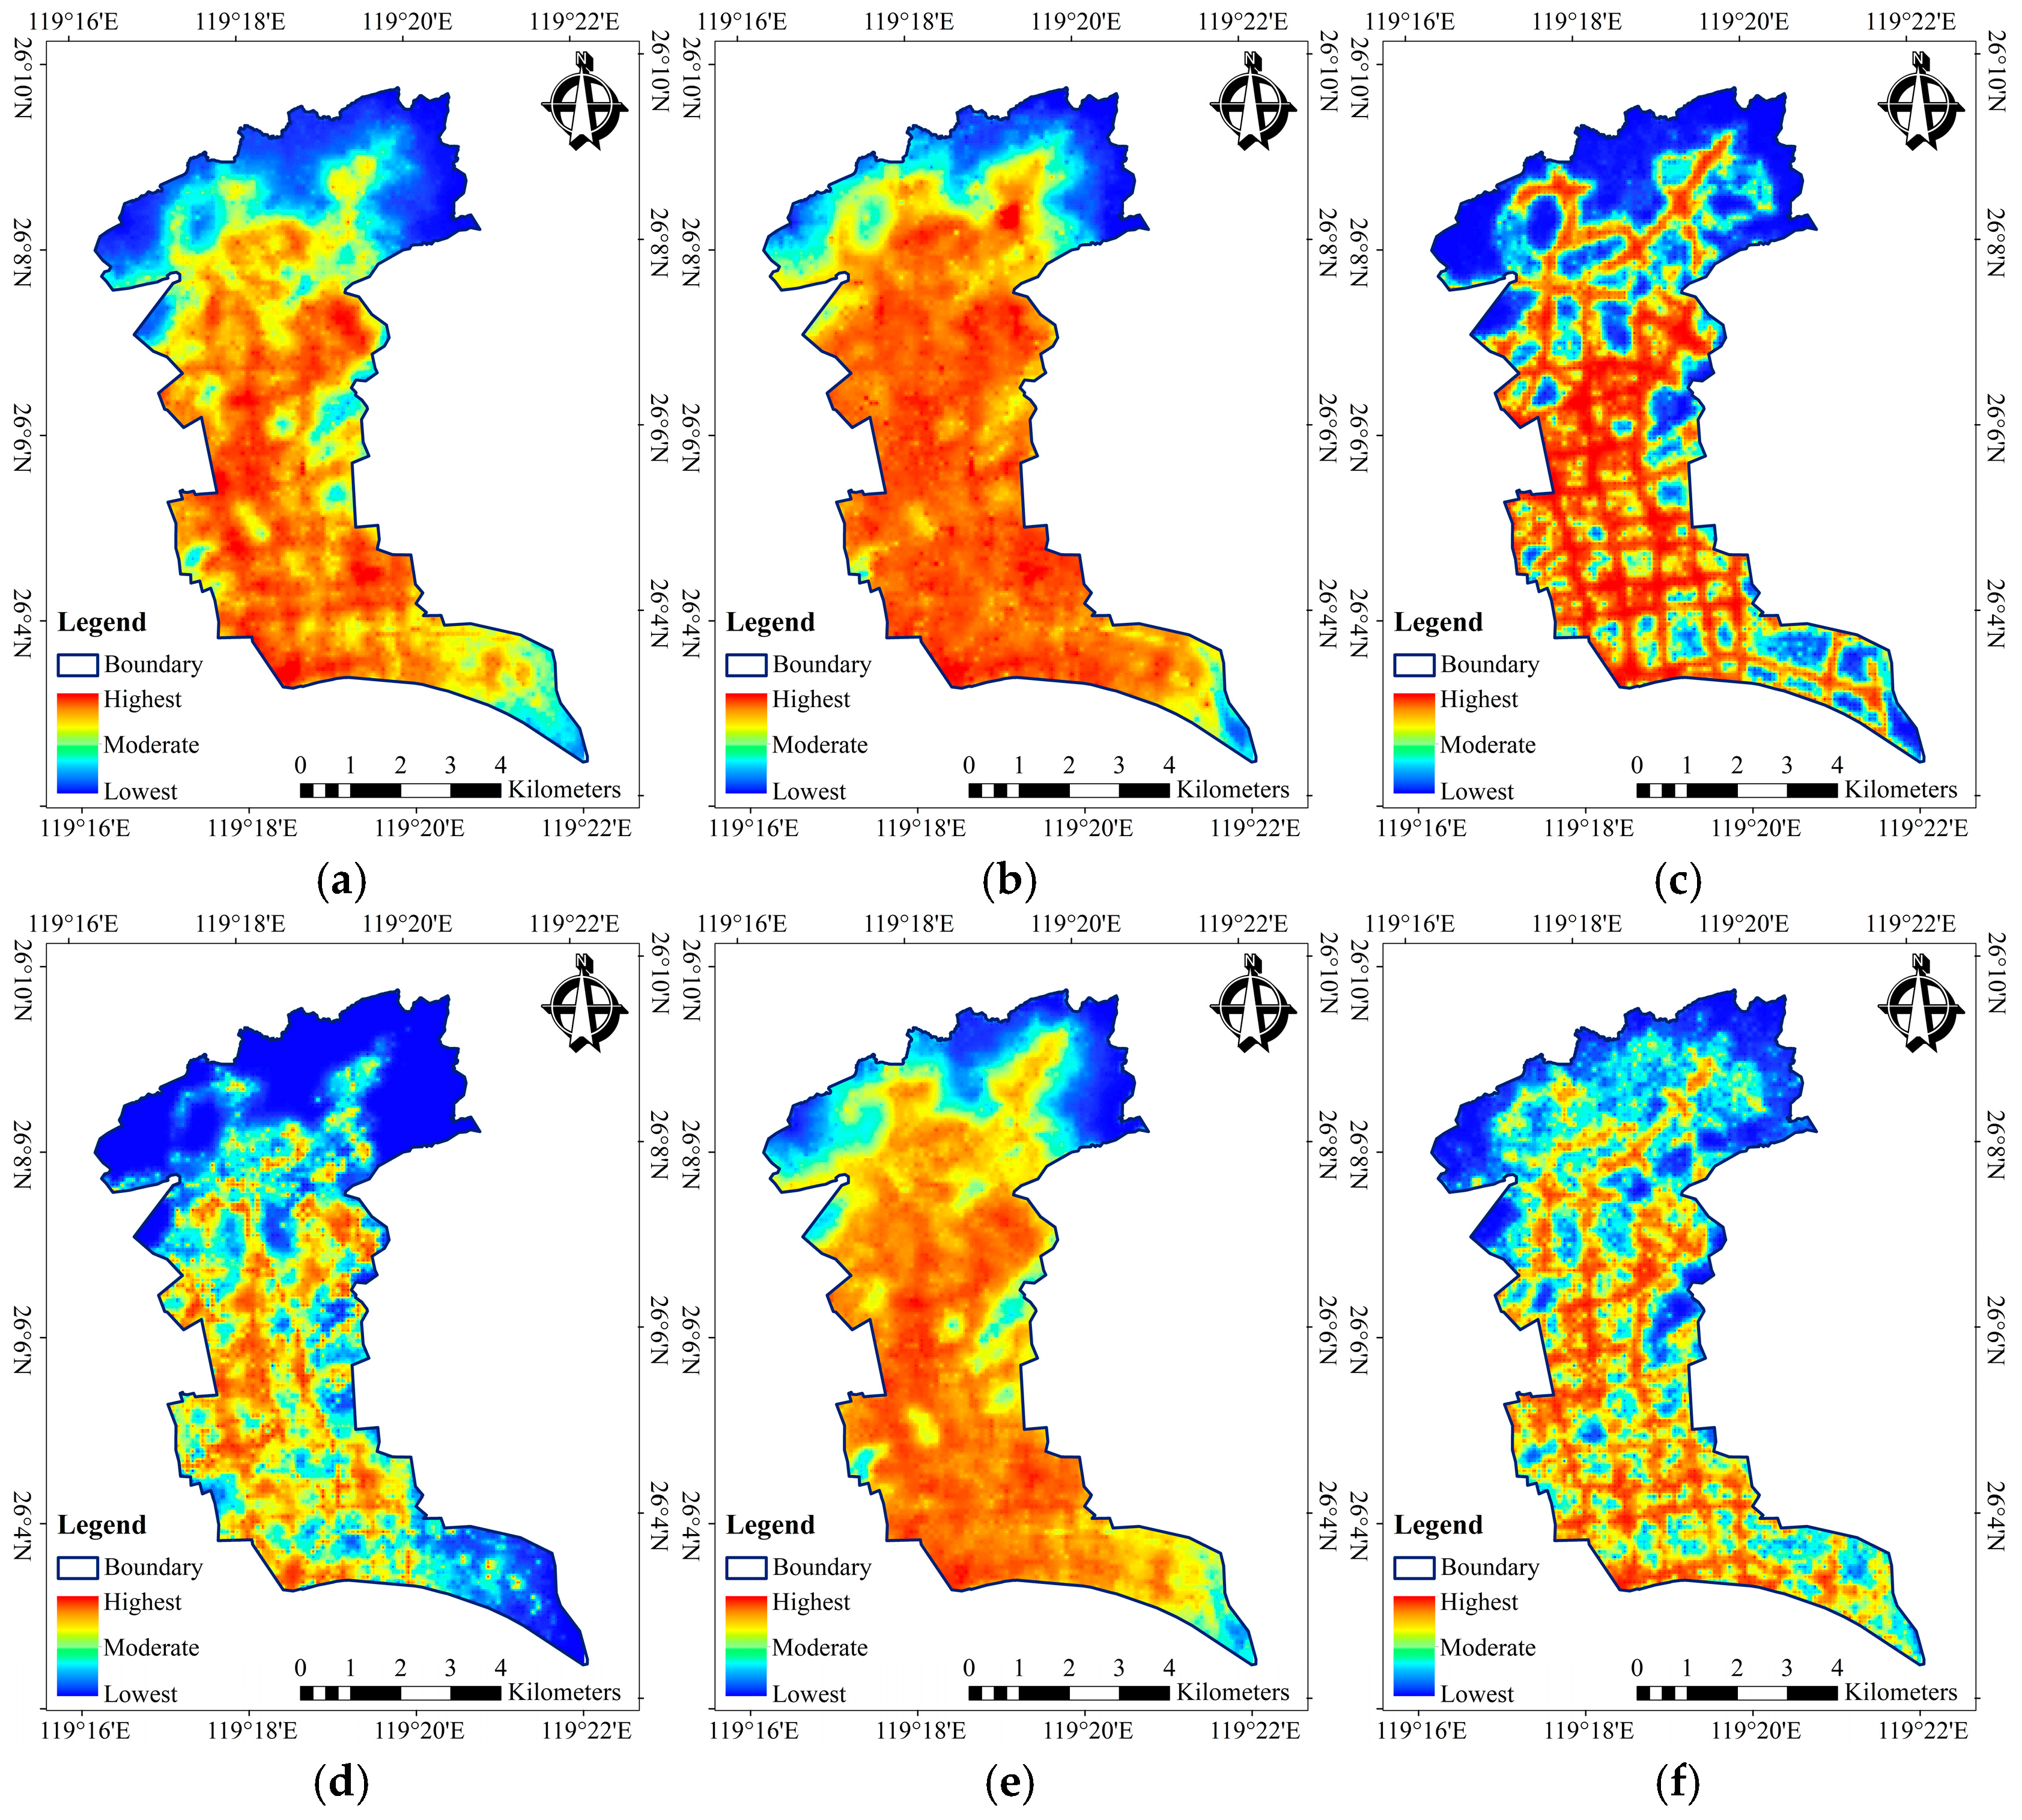
3.3. Flood Susceptibility Distribution
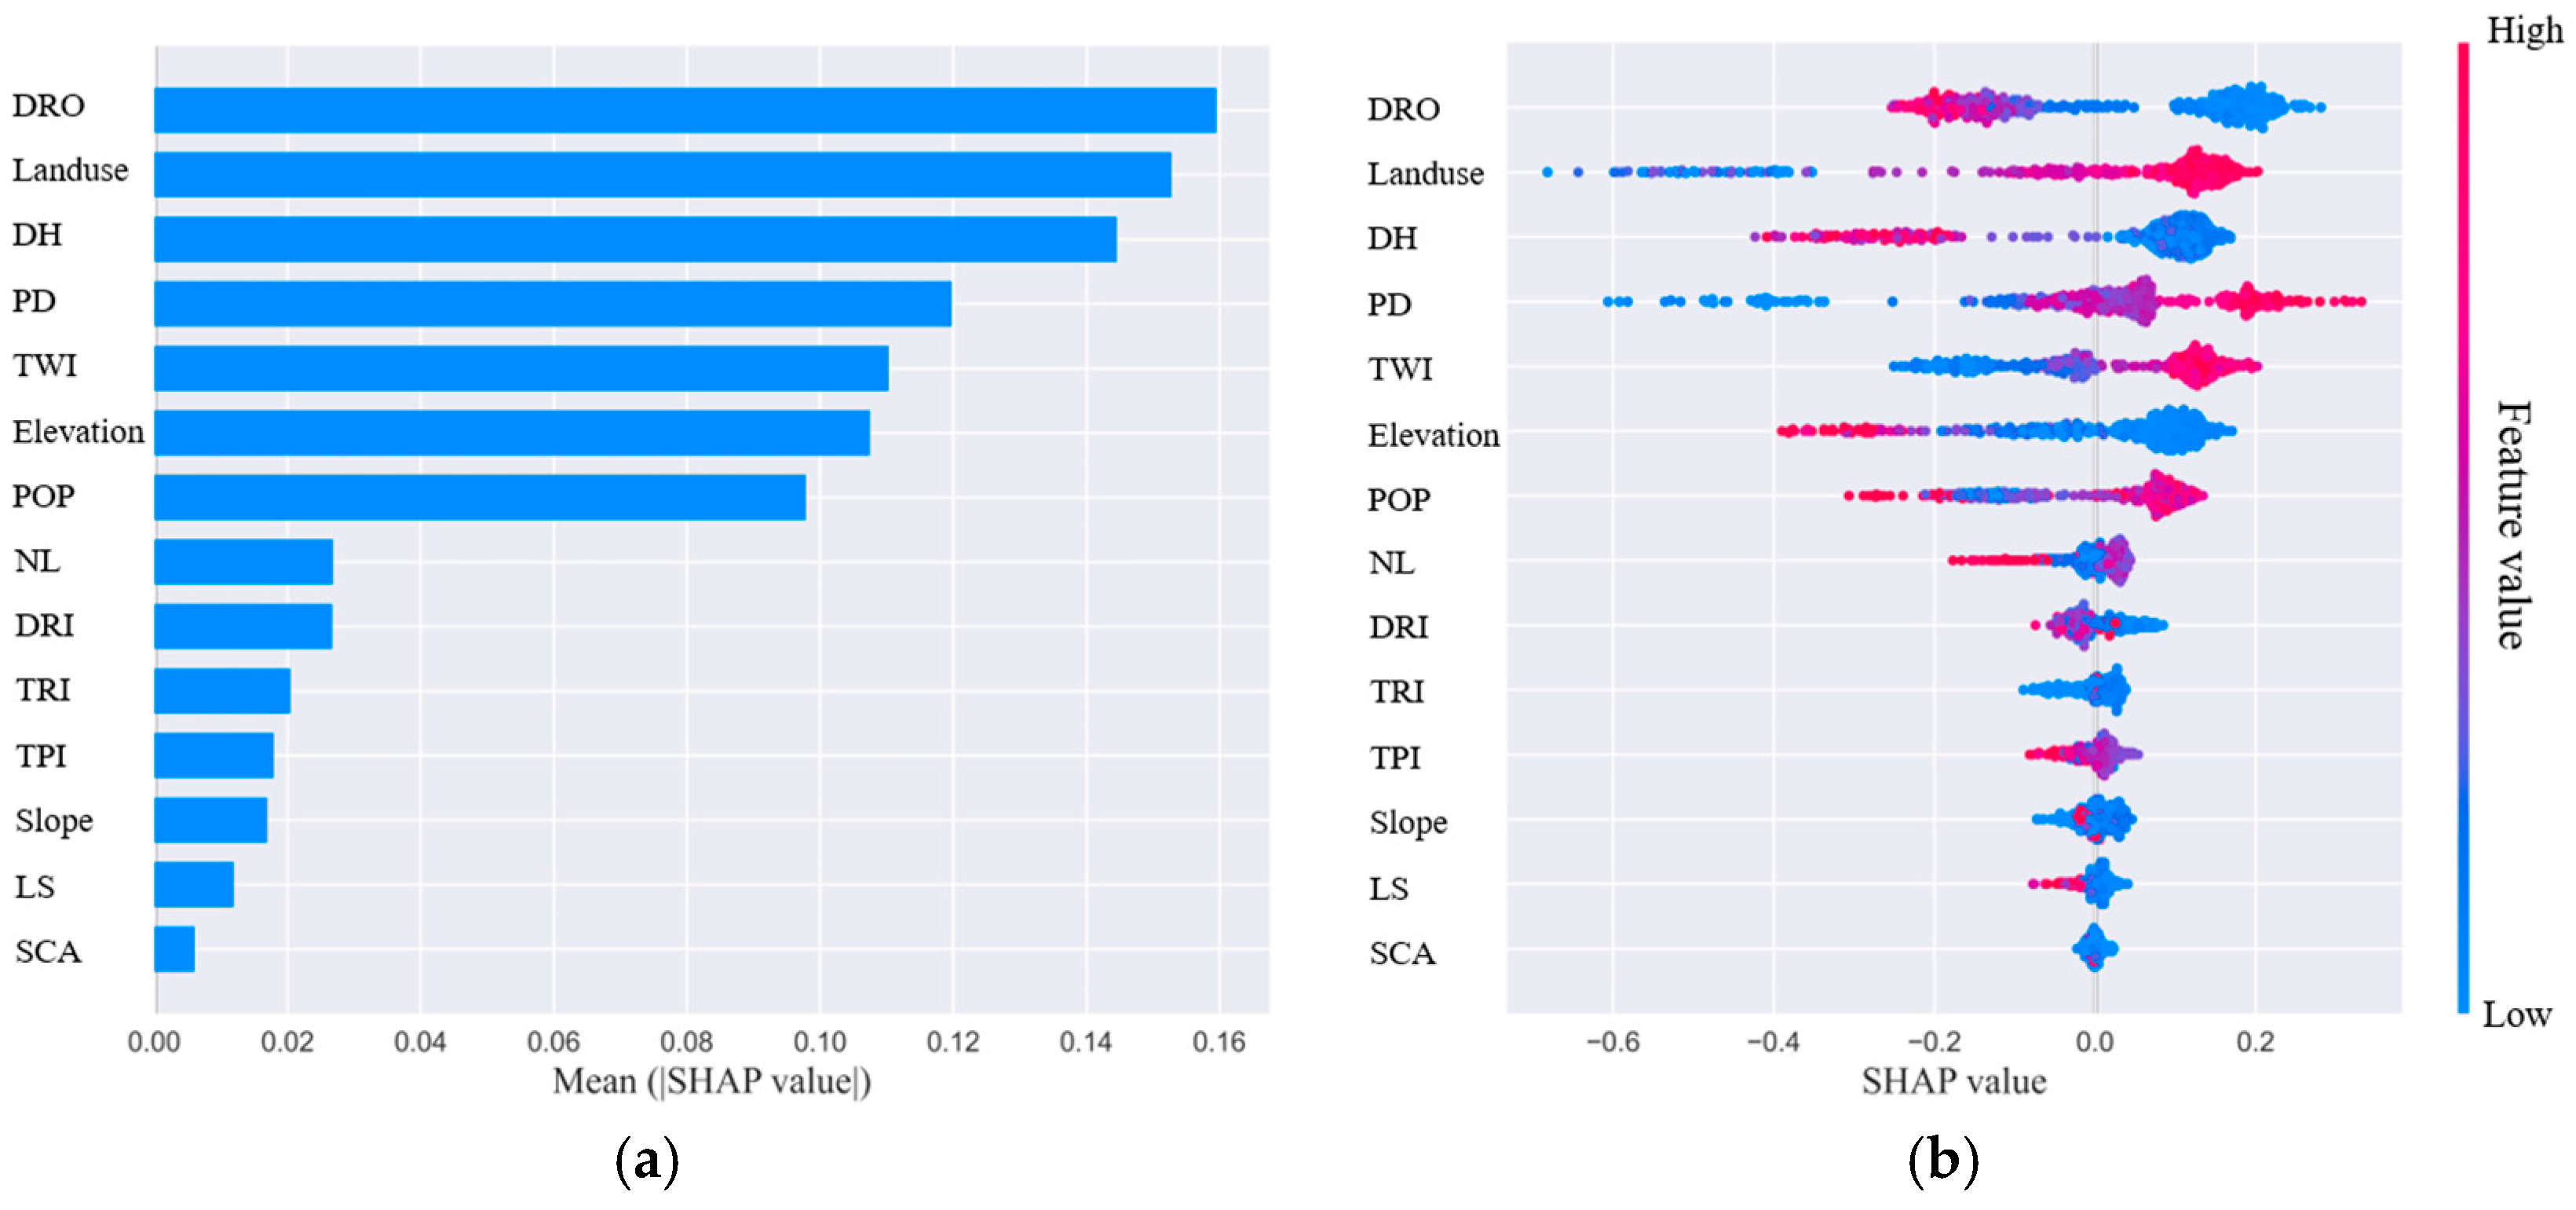
3.4. Driving Forces of Flood-Prone Areas
3.5. Discussion
3.5.1. Discussion on Multi-Resolution Modeling
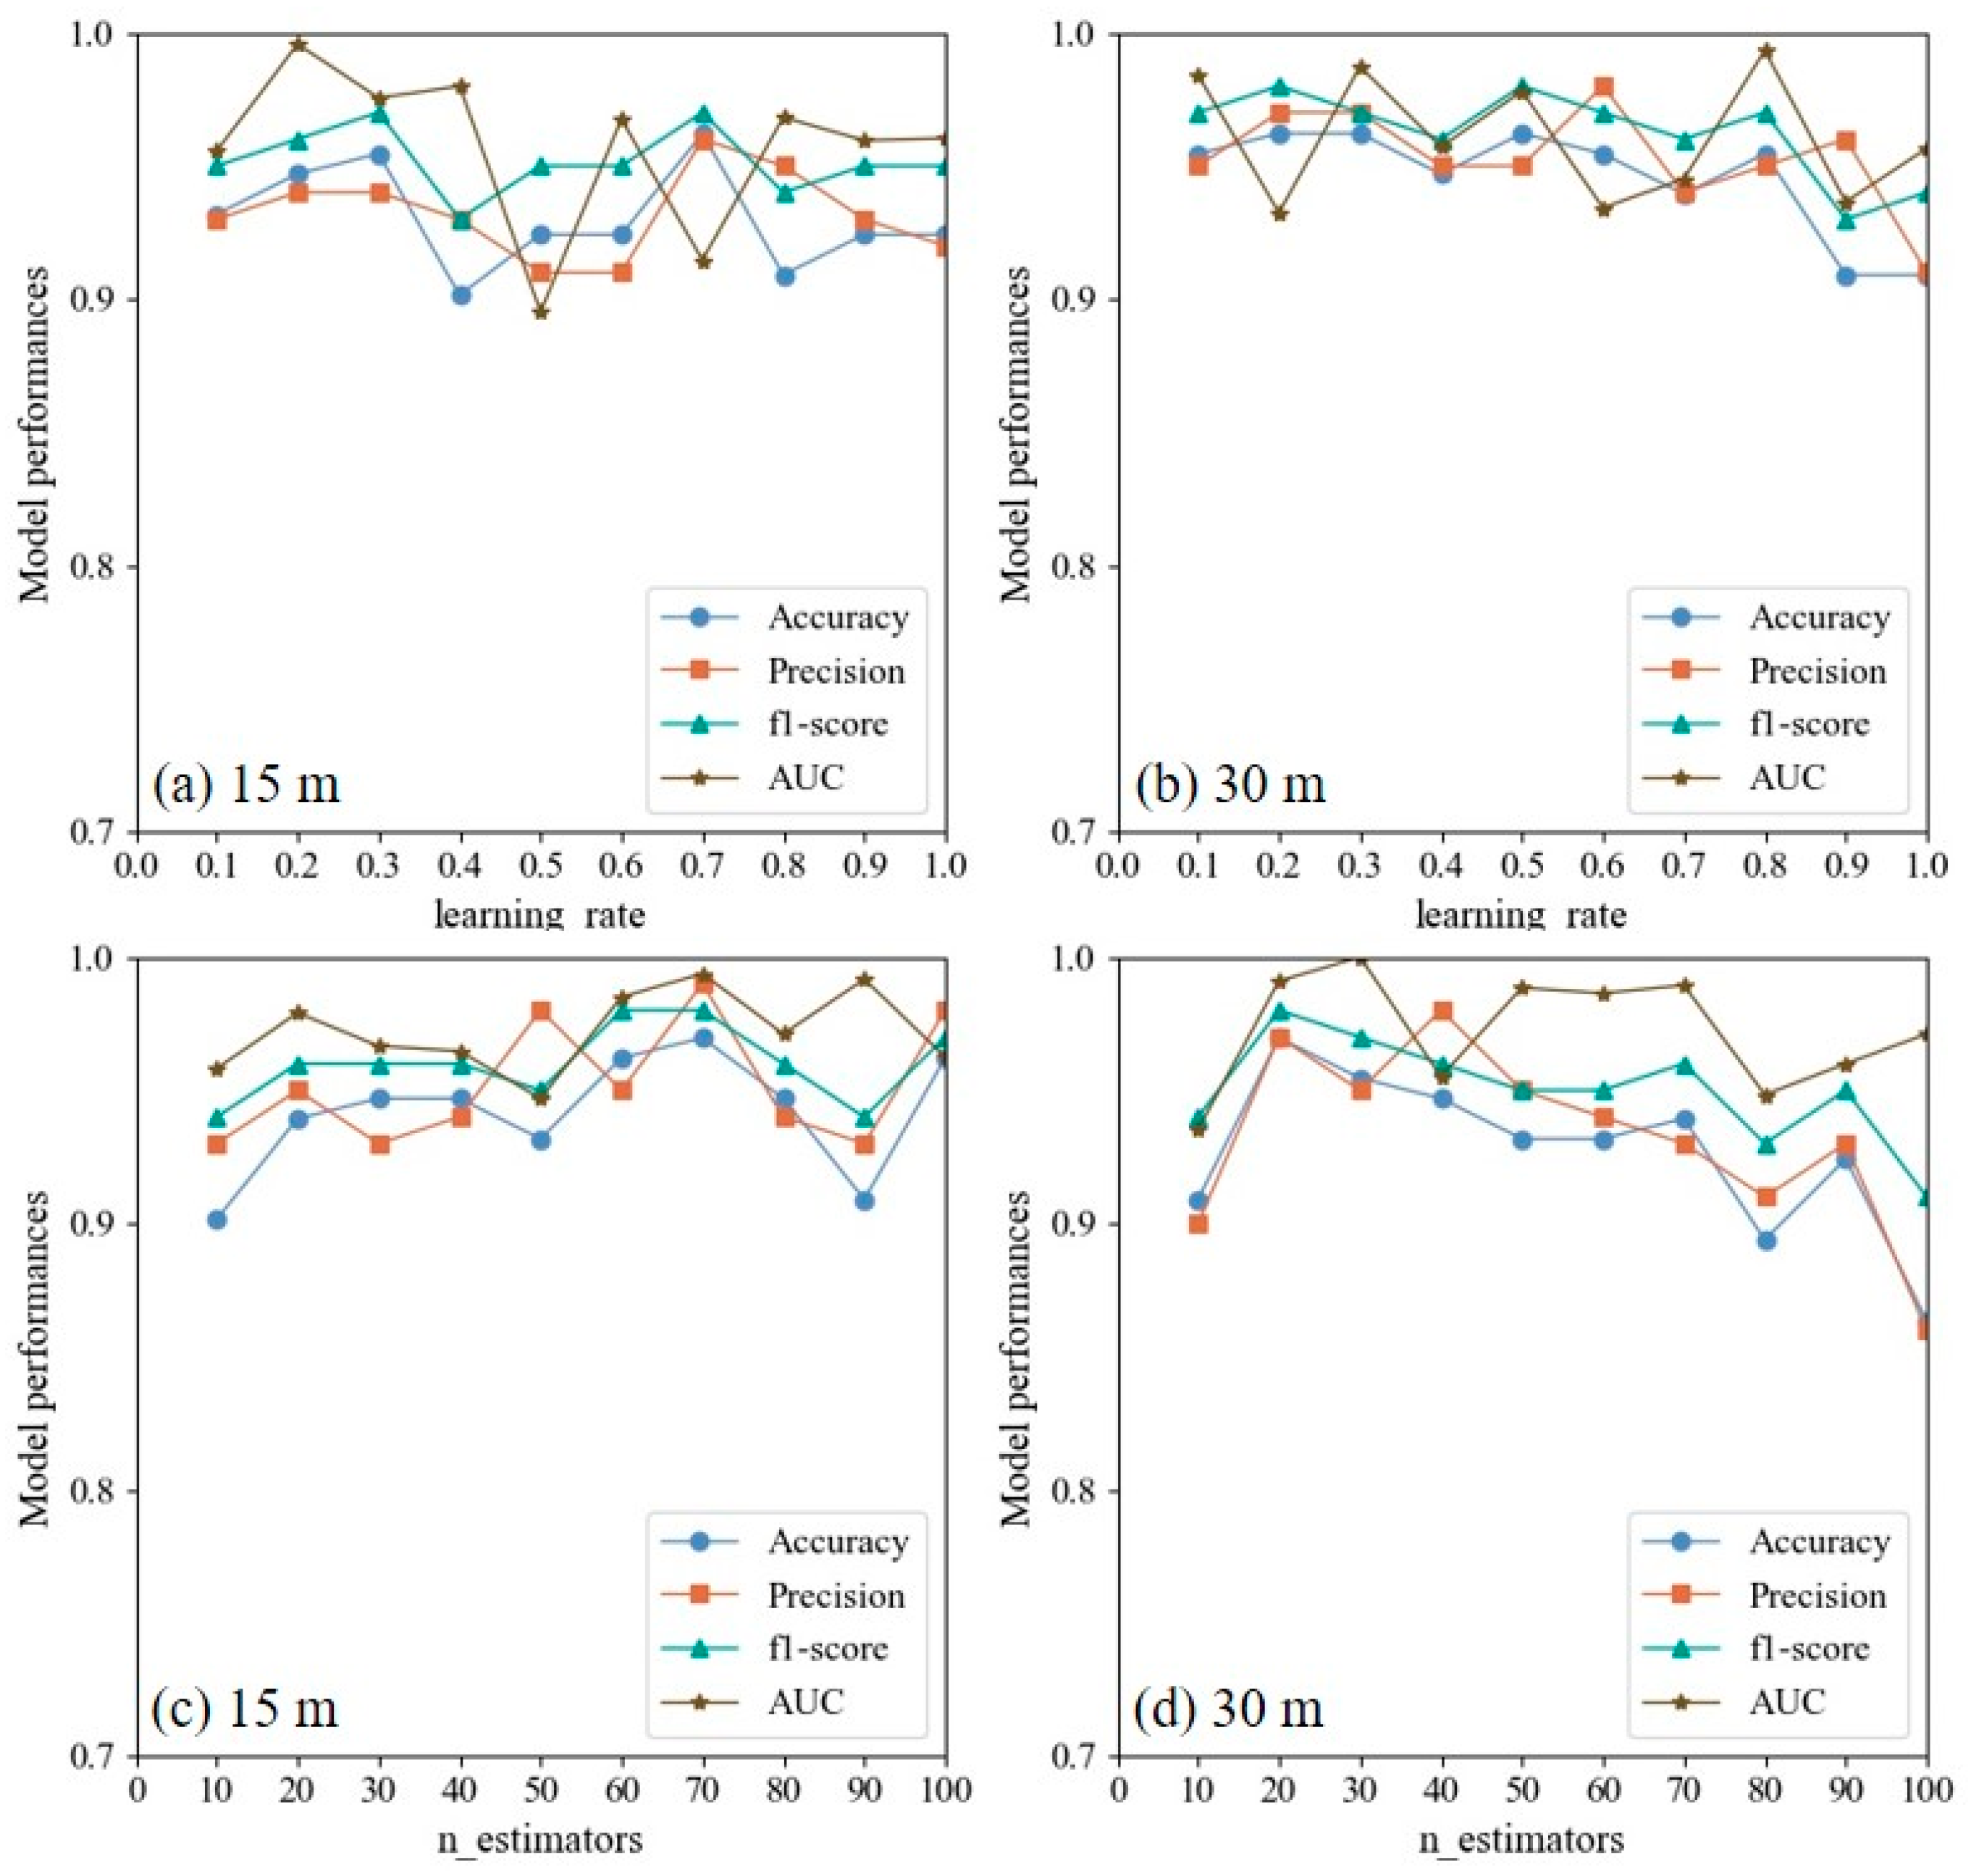
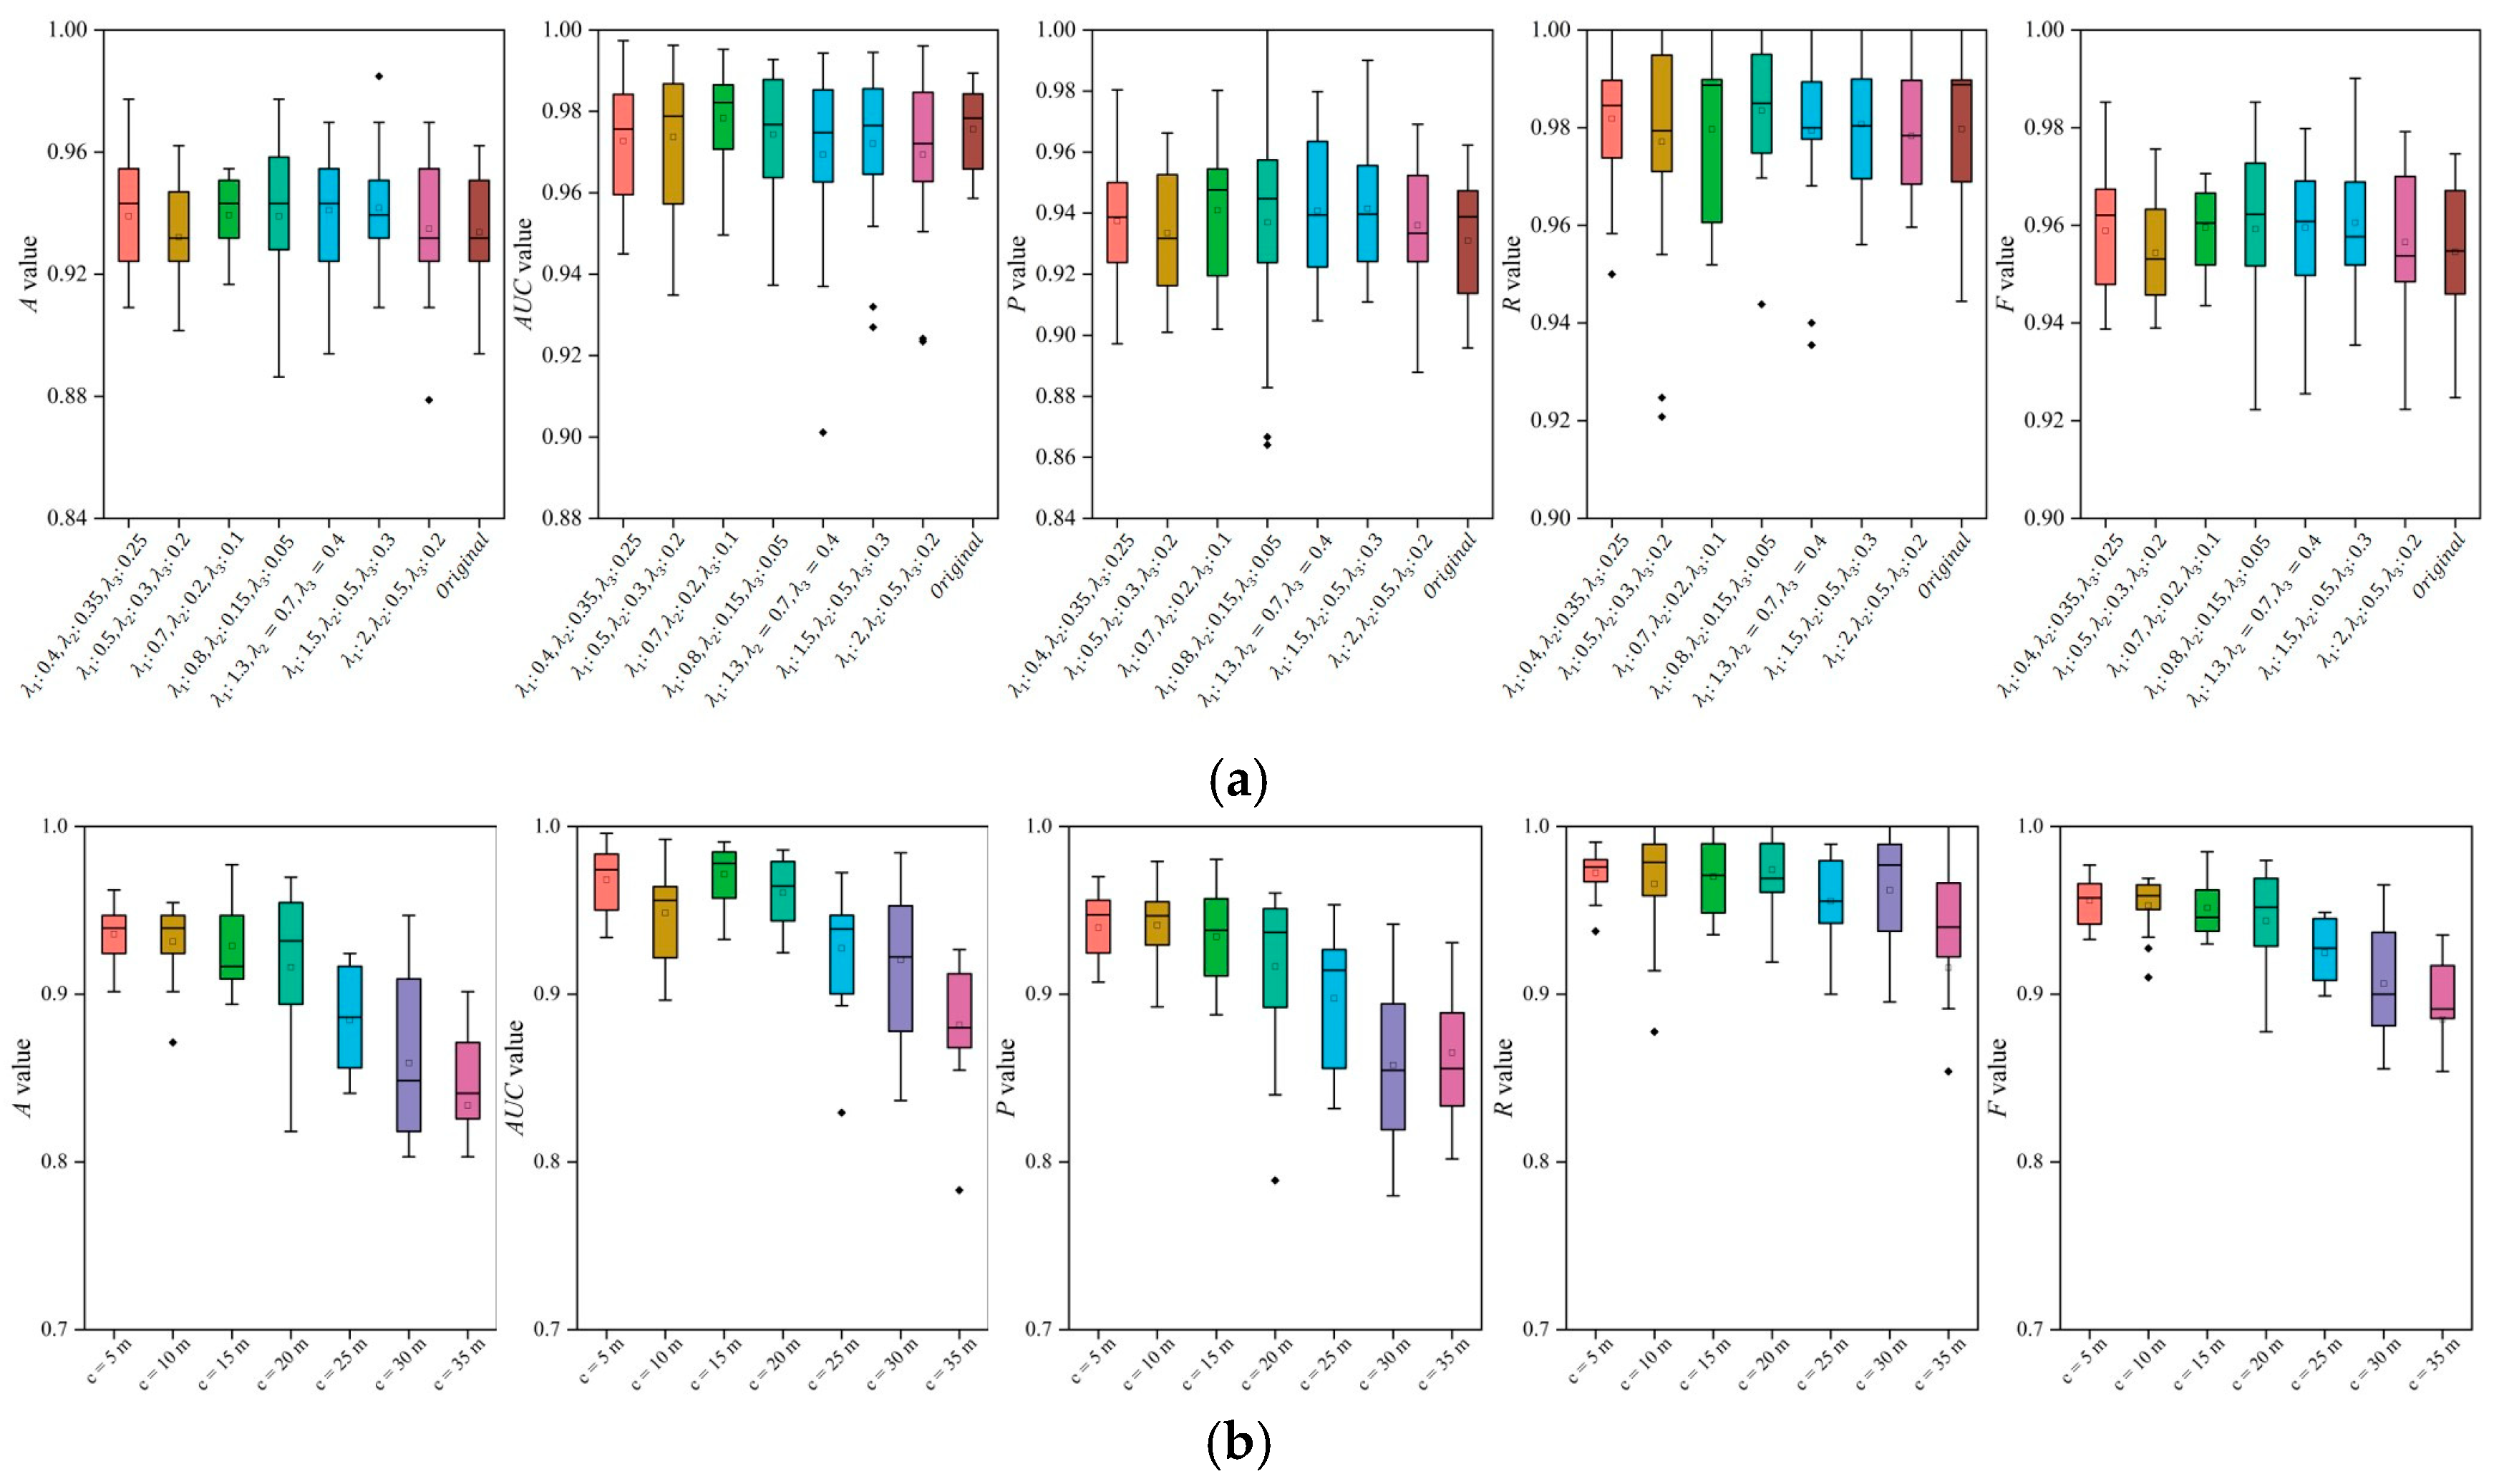
3.5.2. Discussion of Hyperparameters of En-XGBoost
3.5.3. Future Work
4. Conclusions
- (1)
- Incorporating the characteristics of local information around a specified point has a positive impact, improving the generalization ability of the model. However, there is a limit regarding the introduction of neighborhood information; information that is far away from inundation sites is not sufficiently relevant to the inundation characteristics of the specified point.
- (2)
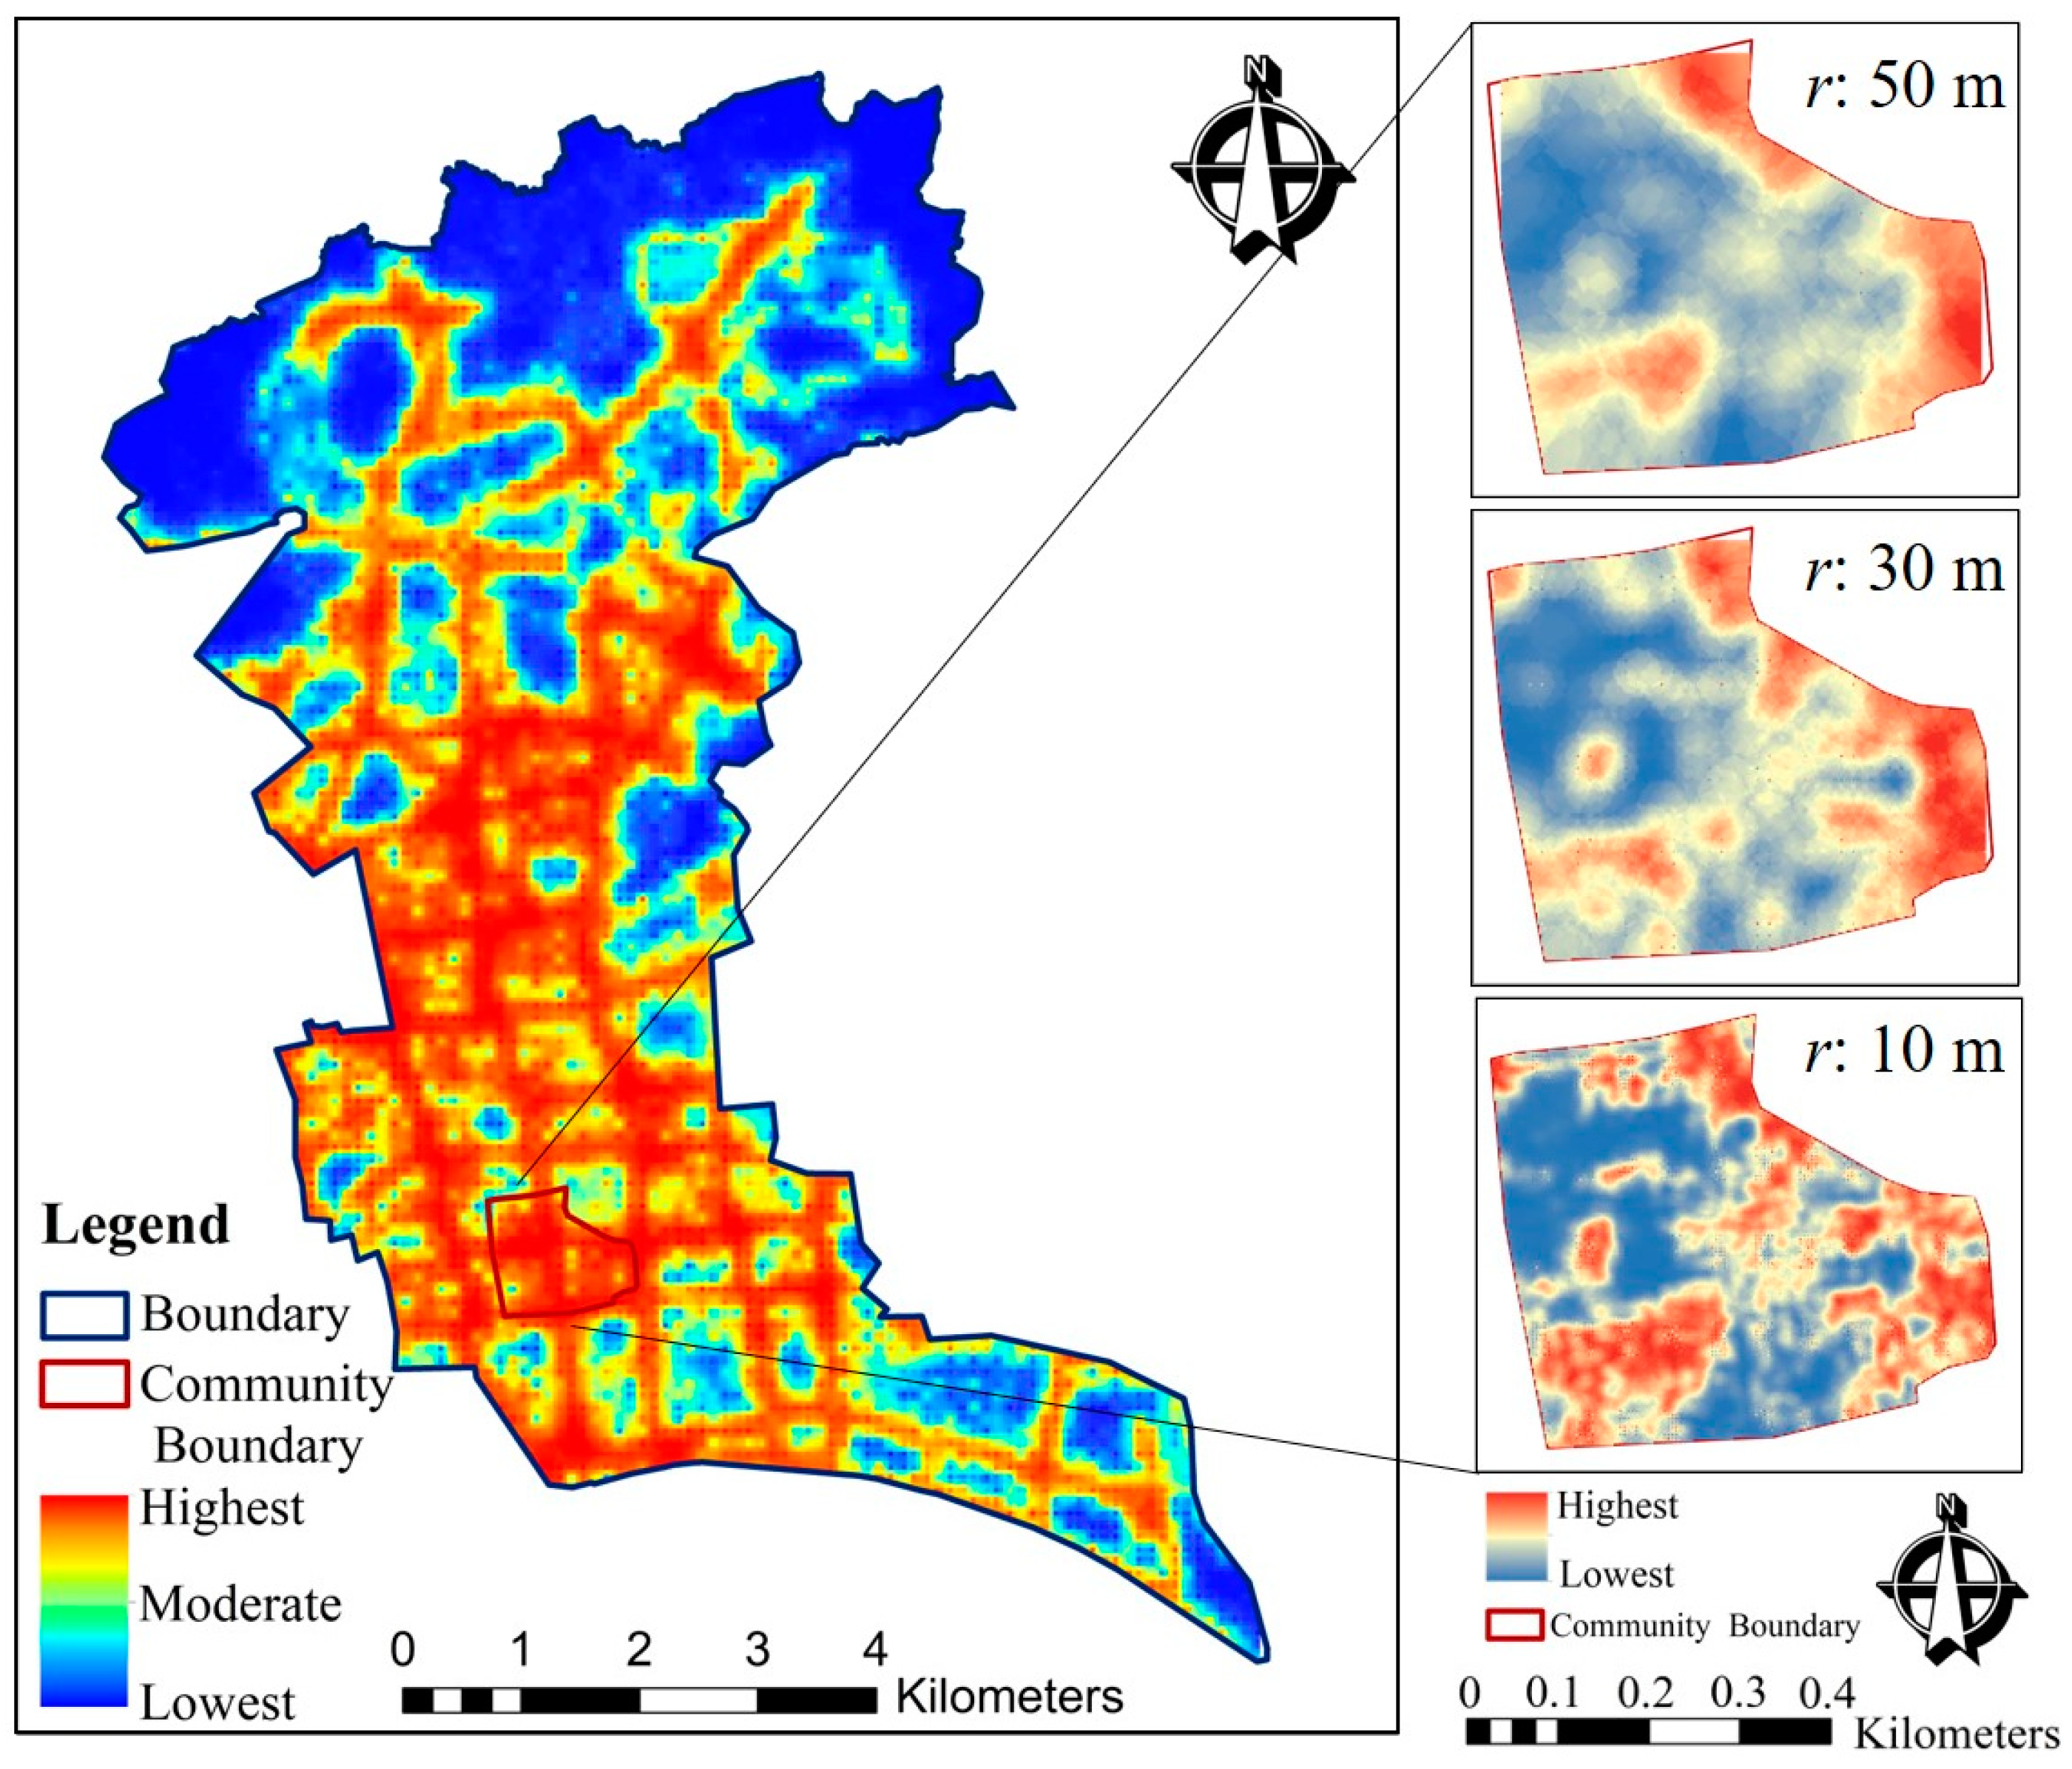
- Two strategies considered both successfully provided the flooding distribution; however, strategy (b) extracts texture features of the flood distribution in greater detail, producing clearer boundaries between areas of different levels of flood susceptibility. In changing the forcing from strategy (a) to (b), the areas recognized as highest risk decreased from 21.82 to 15.01 km2, while the areas labeled as lowest risk decreased from 17.72 to 14.62 km2.
- (3)
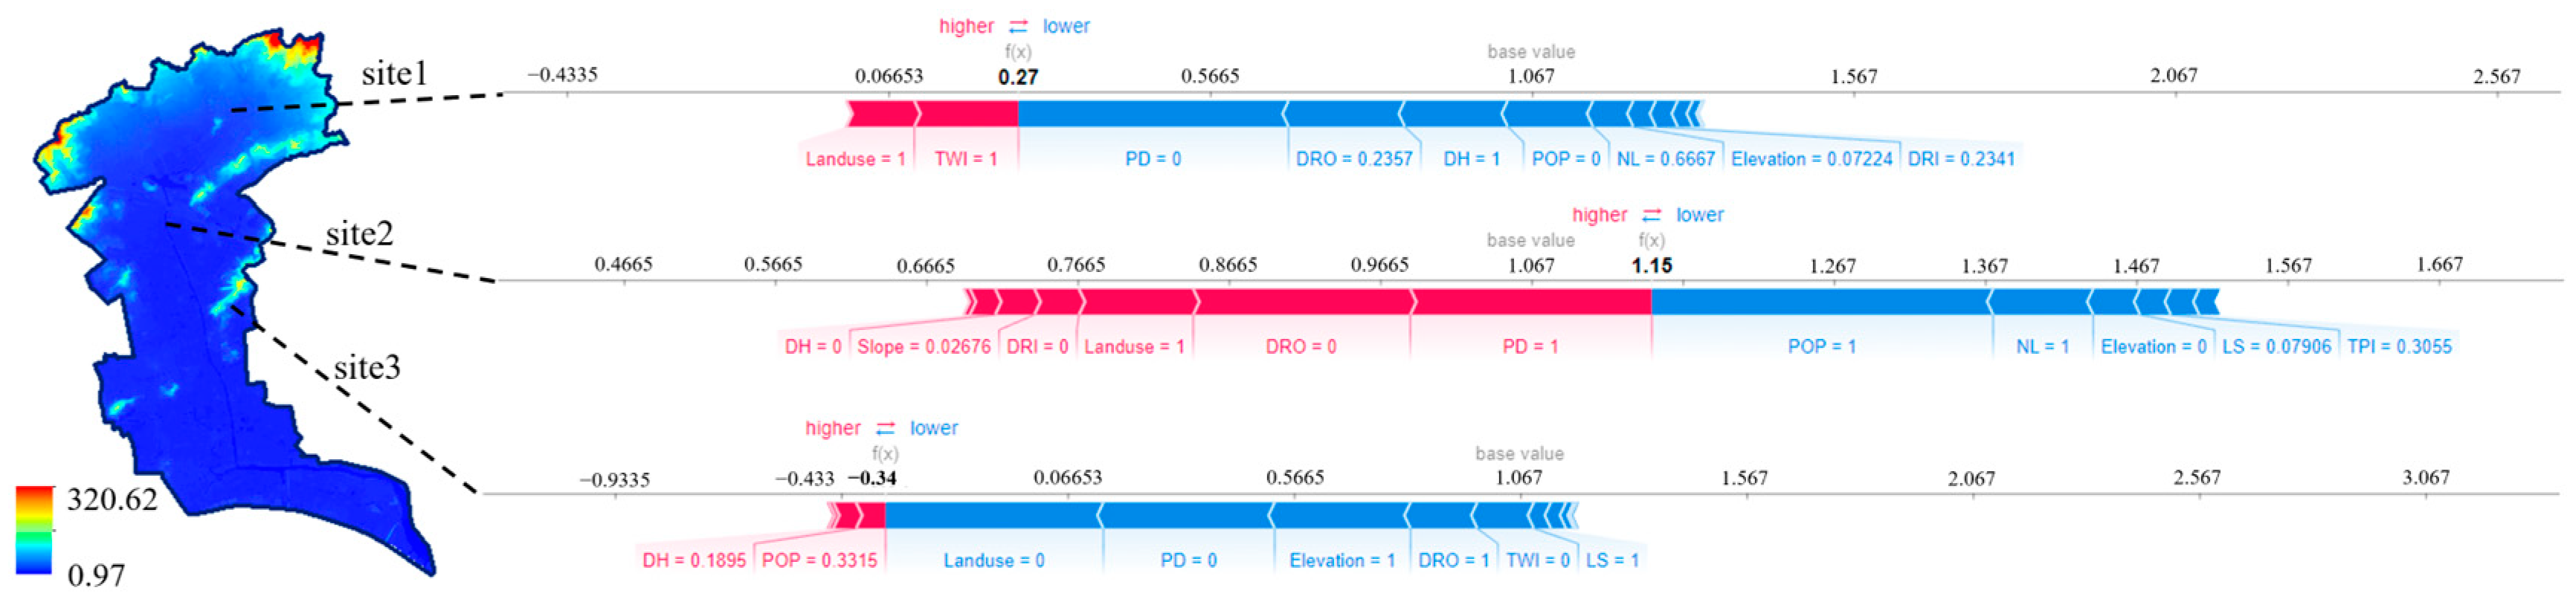
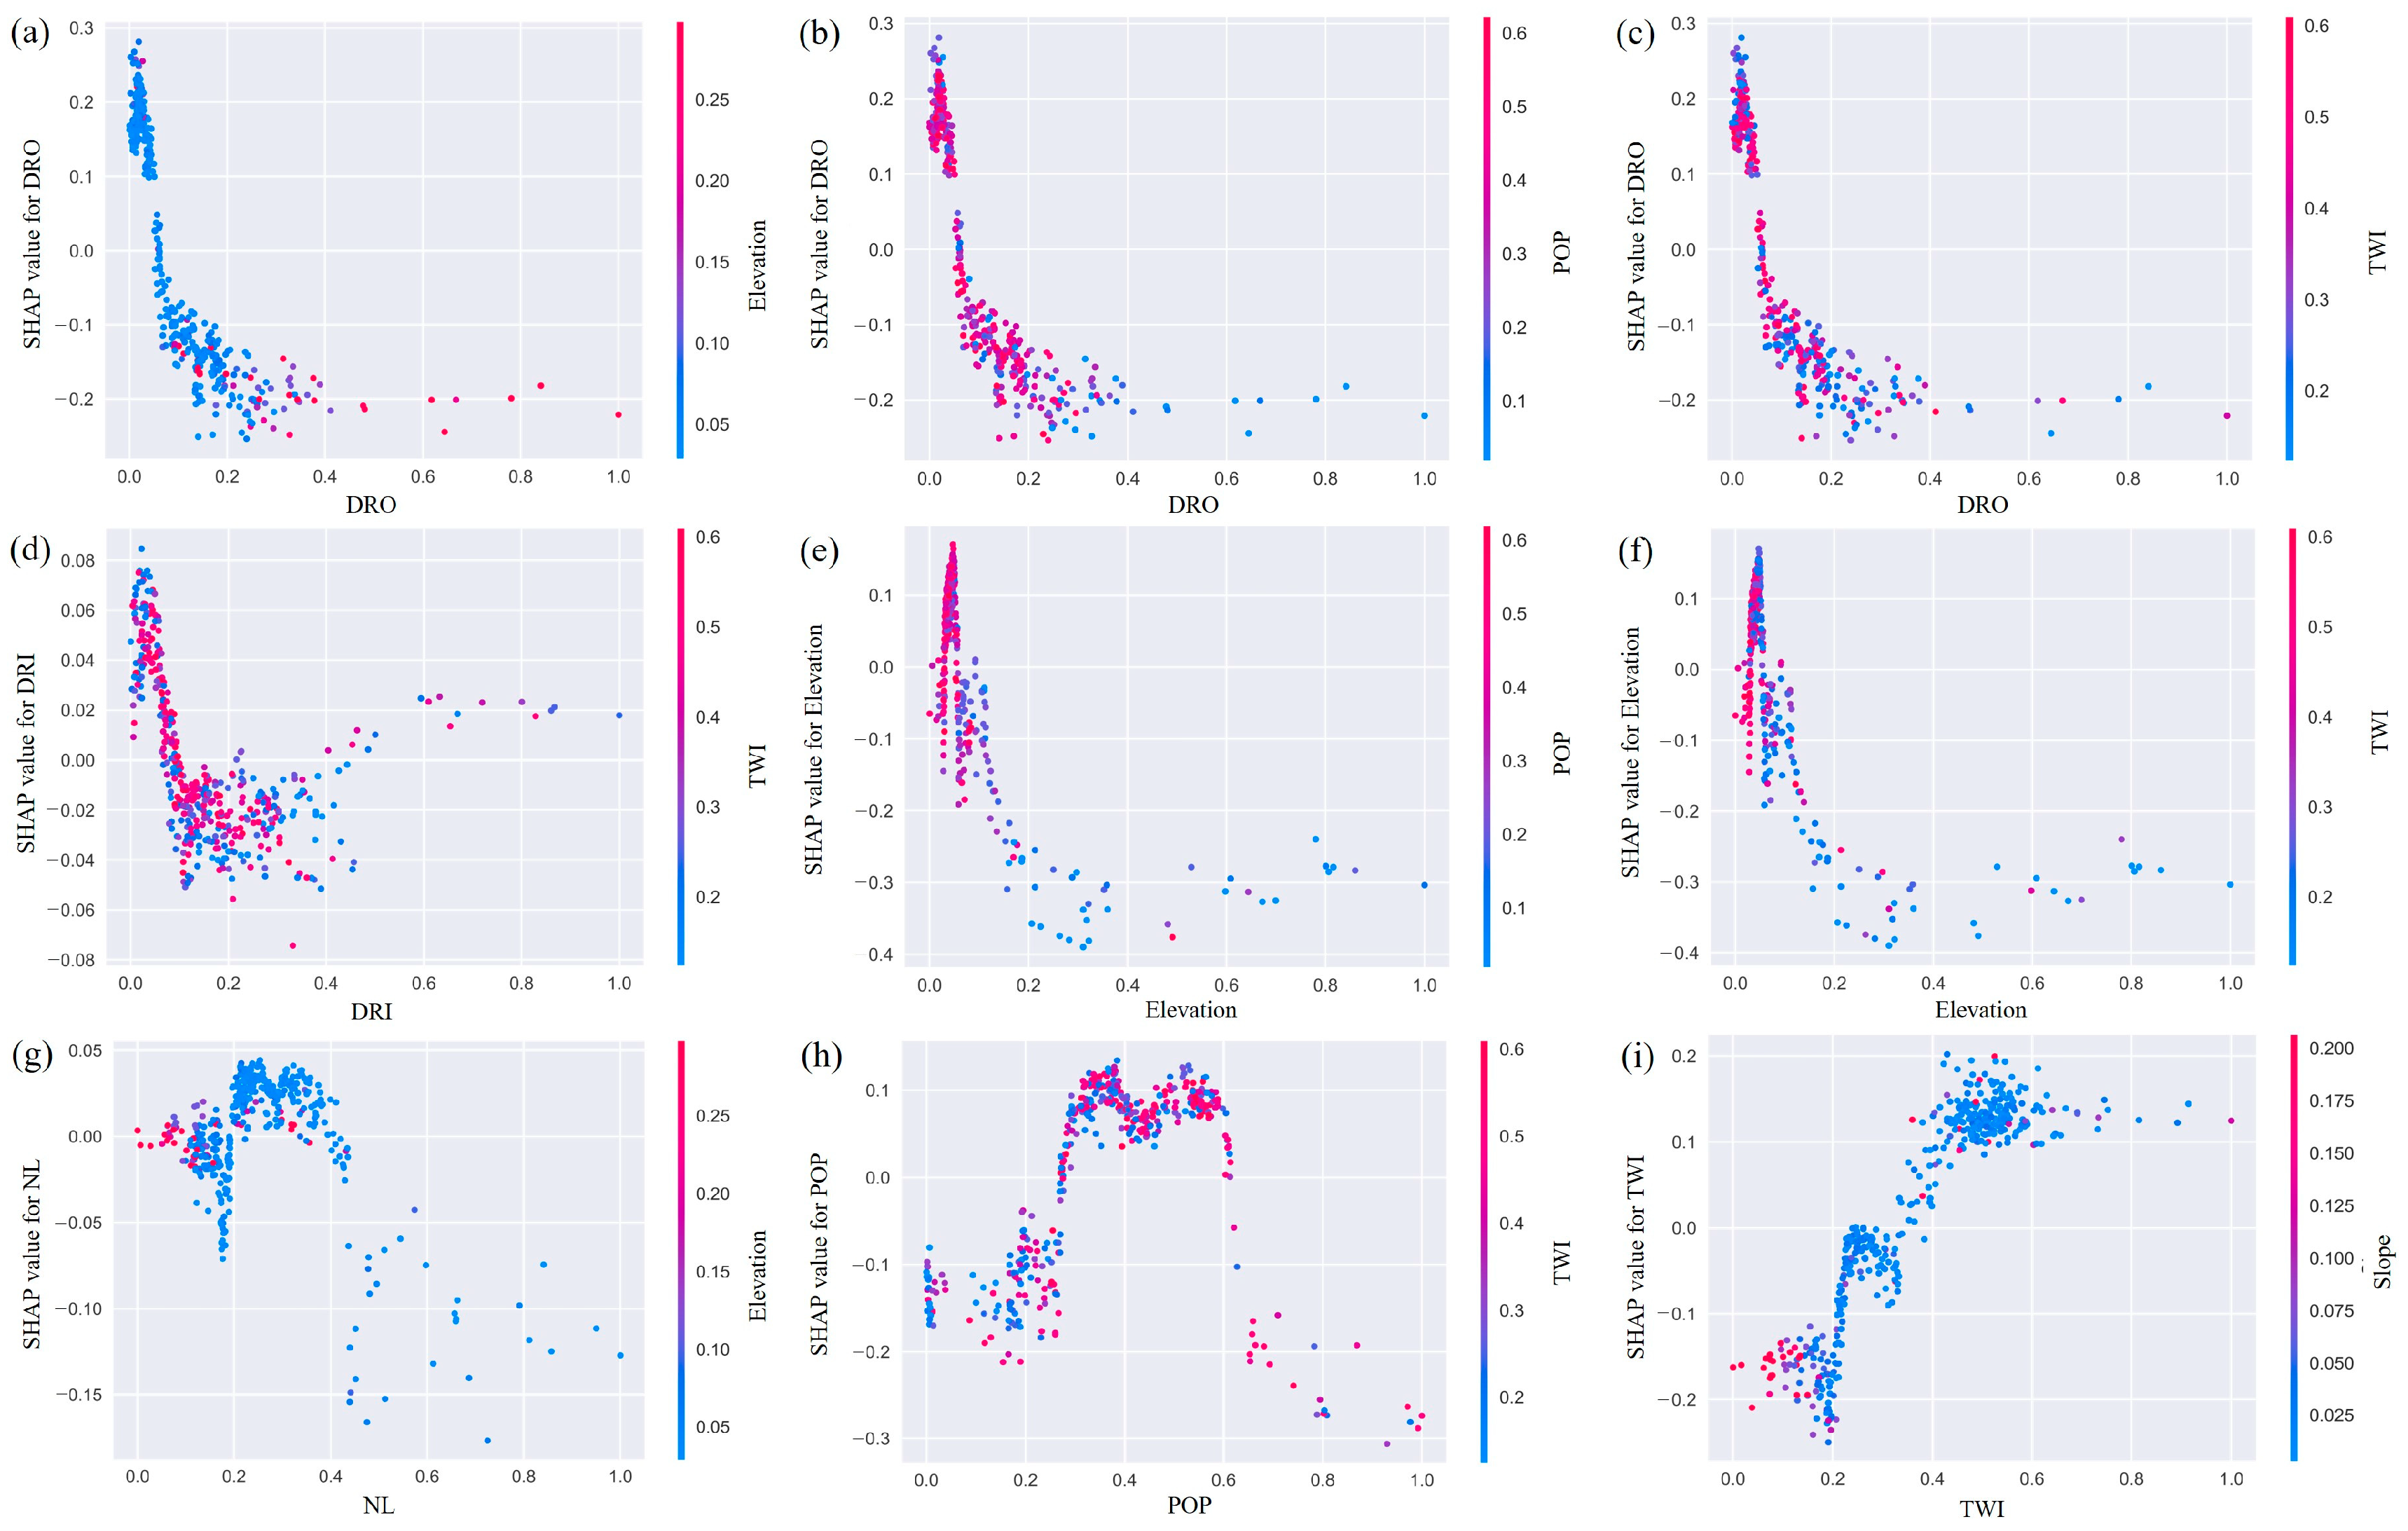
- The indices of DRO, Land use, DH, PD, TWI, Elevation, and POP were recognized as the main factors that affect the prediction. For specific sites in different locations, there are differences in their main driving factors. The analysis of their flooding causes in combination with their locations can effectively help improve understanding of flood risk.
- (4)
- Data augmentation proves to be beneficial for stronger models, while its impact is less pronounced for weaker models. The random strategies enhance the framework’s generalization by increasing the randomness in local feature extraction. In practical applications, the decision to incorporate sufficient random strategies and data augmentation should depend on the complexity of the training data and the model structure.
Author Contributions
Funding
Institutional Review Board Statement
Informed Consent Statement
Data Availability Statement
Conflicts of Interest
References
- Yin, J.; Ye, M.; Yin, Z.; Xu, S. A review of advances in urban flood risk analysis over China. Stoch. Environ. Res. Risk Assess. 2014, 29, 1063–1070. [Google Scholar] [CrossRef]
- Koks, E. Moving flood risk modelling forwards. Nat. Clim. Change 2018, 8, 561–562. [Google Scholar] [CrossRef]
- Fang, J.; Wahl, T.; Fang, J.; Sun, X.; Kong, F.; Liu, M. Compound flood potential from storm surge and heavy precipitation in coastal China: Dependence, drivers, and impacts. Hydrol. Earth Syst. Sci. 2021, 25, 4403–4416. [Google Scholar] [CrossRef]
- Tehrany, M.S.; Lee, M.-J.; Pradhan, B.; Jebur, M.N.; Lee, S. Flood susceptibility mapping using integrated bivariate and multivariate statistical models. Environ. Earth Sci. 2014, 72, 4001–4015. [Google Scholar] [CrossRef]
- Yin, J.; Yu, D.; Wilby, R. Modelling the impact of land subsidence on urban pluvial flooding: A case study of downtown Shanghai, China. Sci. Total Environ. 2016, 544, 744–753. [Google Scholar] [CrossRef]
- Yin, J.; Yu, D.; Yin, Z.; Liu, M.; He, Q. Evaluating the impact and risk of pluvial flash flood on intra-urban road network: A case study in the city center of Shanghai, China. J. Hydrol. 2016, 537, 138–145. [Google Scholar] [CrossRef]
- Anni, A.H.; Cohen, S.; Praskievicz, S. Sensitivity of urban flood simulations to stormwater infrastructure and soil infiltration. J. Hydrol. 2020, 588, 125028. [Google Scholar] [CrossRef]
- Ferreira, C.S.; Walsh, R.P.; Steenhuis, T.S.; Ferreira, A.J. Effect of peri-urban development and lithology on streamflow in a mediterranean catchment. Land Degrad. Dev. 2017, 29, 1141–1153. [Google Scholar] [CrossRef]
- Hou, J.; Zhou, N.; Chen, G.; Huang, M.; Bai, G. Rapid forecasting of urban flood inundation using multiple machine learning models. Nat. Hazards 2021, 108, 2335–2356. [Google Scholar] [CrossRef]
- Xie, K.; Ozbay, K.; Zhu, Y.; Yang, H. Evacuation zone modeling under climate change: A data-driven method. J. Infrastruct. Syst. 2017, 23, 04017013. [Google Scholar] [CrossRef]
- Xu, Z.; Ye, C. Simulation of urban flooding/waterlogging processes: Principle, models and prospects. J. Hydraul. Eng. 2021, 52, 381–392. [Google Scholar]
- Rubinato, M.; Shucksmith, J.; Saul, A.J.; Shepherd, W. Comparison between InfoWorks hydraulic results and a physical model of an urban drainage system. Water Sci. Technol. 2013, 68, 372–379. [Google Scholar]
- Fan, Y.; Ao, T.; Yu, H.; Huang, G.; Li, X. A Coupled 1D-2D Hydrodynamic Model for Urban Flood Inundation. Adv. Meteorol. 2017, 2017, 2819308. [Google Scholar] [CrossRef]
- Mei, C.; Liu, J.; Wang, H.; Li, Z.; Xia, L.; Wang, Y. Introduction of basic principle and application prospect for SWMM. Water Resour. Hydropower Eng. 2017, 48, 33–42. [Google Scholar]
- Tu, M.-C.; Smith, P. Modeling Pollutant Buildup and Washoff Parameters for SWMM Based on Land Use in a Semiarid Urban Watershed. Water Air Soil Pollut. 2018, 229, 121. [Google Scholar] [CrossRef]
- Lei, X.; Chen, W.; Panahi, M.; Falah, F.; Rahmati, O.; Uuemaa, E.; Kalantari, Z.; Ferreira, C.S.S.; Rezaie, F.; Tiefenbacher, J.P.; et al. Urban flood modeling using deep-learning approaches in Seoul, South Korea. J. Hydrol. 2021, 601, 126684. [Google Scholar] [CrossRef]
- Ye, C.; Xu, Z. Simulation of fluvial/pluvial flooding processes in a typical urban area considering role of low impact development (LID) measures and joint operation for hydraulic structures: Case study in Fuzhou City. J. Hydraul. Eng. 2022, 53, 833–844. [Google Scholar]
- Liang, Q.; Xia, X.; Hou, J. Catchment-scale high-resolution flash flood simulation using the GPU-based technology. Procedia Eng. 2016, 154, 975–981. [Google Scholar]
- Xing, Y.; Liang, Q.; Wang, G.; Ming, X.; Xia, X. City-scale hydrodynamic modelling of urban flash floods: The issues of scale and resolution. Nat. Hazards 2018, 96, 473–496. [Google Scholar]
- Ye, C.; Xu, Z.; Lei, X.; Liao, W.; Ding, X.; Liang, Y. Assessment of urban flood risk based on data-driven models: A case study in Fuzhou City, China. Int. J. Disaster Risk Reduct. 2022, 82, 103318. [Google Scholar]
- Lee, S.; Lee, S.; Lee, M.J.; Jung, H.S. Spatial assessment of urban flood susceptibility using data mining and geographic information System (GIS) tools. Sustainability 2018, 10, 648. [Google Scholar] [CrossRef]
- Wang, Y.; Hong, H.; Chen, W.; Li, S.; Panahi, M.; Khosravi, K.; Shirzadi, A.; Shahabi, H.; Panahi, S.; Costache, R. Flood susceptibility mapping in Dingnan County (China) using adaptive neuro-fuzzy inference system with biogeography based optimization and imperialistic competitive algorithm. J. Environ. Manag. 2019, 247, 712–729. [Google Scholar] [CrossRef] [PubMed]
- Zhang, S.; Pan, B. An urban storm-inundation simulation method based on GIS. J. Hydrol. 2014, 517, 260–268. [Google Scholar] [CrossRef]
- Chen, W.; Wang, W.; Huang, G.; Wang, Z.; Lai, C.; Yang, Z. The capacity of grey infrastructure in urban flood management: A comprehensive analysis of grey infrastructure and the green-grey approach. Int. J. Disaster Risk Reduct. 2021, 54, 102045. [Google Scholar] [CrossRef]
- Zhao, G.; Pang, B.; Xu, Z.; Peng, D.; Xu, L. Assessment of urban flood susceptibility using semi-supervised machine learning model. Sci. Total. Environ. 2019, 659, 940–949. [Google Scholar] [CrossRef]
- Tehrany, M.S.; Pradhan, B.; Mansor, S.; Ahmad, N. Flood susceptibility assessment using GIS-based support vector machine model with different kernel types. Catena 2015, 125, 91–101. [Google Scholar] [CrossRef]
- Wang, Z.; Lai, C.; Chen, X.; Yang, B.; Zhao, S.; Bai, X. Flood hazard risk assessment model based on random forest. J. Hydrol. 2015, 527, 1130–1141. [Google Scholar] [CrossRef]
- Jin, H.; Zhao, Y.; Lu, P.; Zhang, S.; Chen, Y.; Zheng, S.; Zhu, Z. Using Machine Learning to Identify and Optimize Sensitive Parameters in Urban Flood Model Considering Subsurface Characteristics. Int. J. Disaster Risk Sci. 2024, 15, 116–133. [Google Scholar] [CrossRef]
- Zhao, G.; Pang, B.; Xu, Z.; Peng, D.; Zuo, D. Urban flood susceptibility assessment based on convolutional neural networks. J. Hydrol. 2020, 590, 125235. [Google Scholar] [CrossRef]
- Zhao, G.; Pang, B.; Xu, Z.; Yue, J.; Tu, T. Mapping flood susceptibility in mountainous areas on a national scale in China. Sci. Total. Environ. 2018, 615, 1133–1142. [Google Scholar] [CrossRef]
- Xu, H.; Ma, C.; Lian, J.; Xu, K.; Chaima, E. Urban flooding risk assessment based on an integrated k-means cluster algorithm and improved entropy weight method in the region of Haikou, China. J. Hydrol. 2018, 563, 975–986. [Google Scholar]
- Huang, H.; Chen, X.; Wang, X.; Wang, X.; Liu, L. A Depression-based index to represent topographic control in urban pluvial flooding. Water 2019, 11, 2115. [Google Scholar] [CrossRef]
- Mojaddadi, H.; Pradhan, B.; Nampak, H.; Ahmad, N.; Ghazali, A.H.B. Ensemble machine-learning-based geospatial approach for flood risk assessment using multi-sensor remote-sensing data and GIS. Geomat. Nat. Hazards Risk 2017, 8, 1080–1102. [Google Scholar]
- Nachappa, T.G.; Piralilou, S.T.; Gholamnia, K.; Ghorbanzadeh, O.; Rahmati, O.; Blaschke, T. Flood susceptibility mapping with machine learning, multi-criteria decision analysis and ensemble using Dempster Shafer Theory. J. Hydrol. 2020, 590, 125275. [Google Scholar]
- Hosseiny, H.; Nazari, F.; Smith, V.; Nataraj, C. A Framework for modeling flood depth using a hybrid of hydraulics and machine learning. Sci. Rep. 2020, 10, 8222. [Google Scholar]
- Chen, T.; Guestrin, C. Xgboost: A scalable tree boosting system. In Proceedings of the 22nd ACM SIGKDD International Conference on Knowledge Discovery and Data Mining, San Francisco, CA, USA, 13–17 August 2016; pp. 785–794. [Google Scholar]
- Ma, M.; Zhao, G.; He, B.; Li, Q.; Dong, H.; Wang, S.; Wang, Z. XGBoost-based method for flash flood risk assessment. J. Hydrol. 2021, 598, 126382. [Google Scholar]
- Meng, Y.; Yang, N.; Qian, Z.; Zhang, G. What makes an online review more helpful: An interpretation framework using XGBoost and SHAP values. J. Theor. Appl. Electron. Commer. Res. 2020, 16, 466–490. [Google Scholar] [CrossRef]
- Feng, D.-C.; Wang, W.-J.; Mangalathu, S.; Taciroglu, E. Interpretable XGBoost-SHAP machine-learning model for shear strength prediction of Squat RC walls. J. Struct. Eng. 2021, 147, 04021173. [Google Scholar]
- Guo, M.; Yuan, Z.; Janson, B.; Peng, Y.; Yang, Y.; Wang, W. Older Pedestrian Traffic Crashes Severity Analysis Based on an Emerging Machine Learning XGBoost. Sustainability 2021, 13, 926. [Google Scholar] [CrossRef]
- Wang, S.; Peng, H.; Hu, Q.; Jiang, M. Analysis of runoff generation driving factors based on hydrological model and interpretable machine learning method. J. Hydrol. Reg. Stud. 2022, 42, 101139. [Google Scholar]
- Xu, Z.; Ye, C. From “looking at sea in city” to “looking at river in city”: Simulation and risk analysis of flood and waterlogging process in Fuzhou City under extreme rainstorm scenarios. China Flood Drought Manag. 2021, 9, 12–20. [Google Scholar]
- Wu, C.L.; Chau, K.W.; Li, Y.S. Predicting monthly streamflow using data-driven models coupled with data-preprocessing tech-niques. Water Resour. Res. 2009, 45. [Google Scholar] [CrossRef]
- Tang, X.; Hong, H.; Shu, Y.; Tang, H.; Li, J.; Liu, W. Urban waterlogging susceptibility assessment based on a PSO-SVM method using a novel repeatedly random sampling idea to select negative samples. J. Hydrol. 2019, 576, 583–595. [Google Scholar]
- Rizeei, H.M.; Pradhan, B.; Saharkhiz, M.A.; Lee, S. Groundwater aquifer potential modeling using an ensemble multi-adoptive boosting logistic regression technique. J. Hydrol. 2019, 579, 124172. [Google Scholar]
- Desai, S.; Ouarda, T.B. Regional hydrological frequency analysis at ungauged sites with random forest regression. J. Hydrol. 2021, 594, 125861. [Google Scholar]
- Pham, B.T.; Jaafari, A.; Van Phong, T.; Mafi-Gholami, D.; Amiri, M.; Van Tao, N.; Duong, V.-H.; Prakash, I. Naïve Bayes ensemble models for groundwater potential mapping. Ecol. Inform. 2021, 64, 101389. [Google Scholar] [CrossRef]
- Schoppa, L.; Disse, M.; Bachmair, S. Evaluating the performance of random forest for large-scale flood discharge simulation. J. Hydrol. 2020, 590, 125531. [Google Scholar] [CrossRef]
- Ye, C.; Xu, Z.; Lei, X.; Zhang, R.; Chu, Q.; Li, P.; Ban, C. Assessment of the impact of urban water system scheduling on urban flooding by using coupled hydrological and hydrodynamic model in Fuzhou City, China. J. Environ. Manag. 2022, 321, 115935. [Google Scholar]
- Liang, Y.; Liao, W.; Zhang, Z.; Li, H.; Wang, H. Using a multiphysics coupling-oriented flood modelling approach to assess urban flooding under various regulation scenarios combined with rainstorms and tidal effects. J. Hydrol. 2024, 645, 132189. [Google Scholar]
- Ye, C.; Xu, Z.; Lei, X.; Liao, W.; Li, P. Coupling simulation of hydrological and hydrodynamics processes for urban river networks based on InfoWorks: Case of the urban area and the northeast mountainous area in Fuzhou City. J. Beijing Norm. Univ. 2019, 5, 609–616. [Google Scholar]
- Khanifar, J.; Khademalrasoul, A. Multiscale comparison of LS factor calculation methods based on different flow direction algorithms in Susa Ancient landscape. Acta Geophys. 2020, 68, 783–793. [Google Scholar] [CrossRef]


| Number | Data | Spatial Resolution | Source | Description |
|---|---|---|---|---|
| 1 | Elevation | 2 m | Fuzhou Survey Bureau | Digital elevation model (DEM) |
| 2 | Slope | 2 m | Processed from ArcGIS 10.5 | Slope of each grid |
| 3 | LS | 2 m | Processed from SAGA GIS 9.3.1 | Landscape factor |
| 4 | SCA | 2 m | Processed from ArcGIS 10.5 | Specific catchment area |
| 5 | TPI | 2 m | Processed from ArcGIS 10.5 | Topographic position index |
| 6 | TRI | 2 m | Processed from SAGA GIS 9.3.1 | Terrain ruggedness index |
| 7 | TWI | 2 m | Processed from ArcGIS 10.5 | Topographic wetness index |
| 8 | NL | 130 m | LJ1-01 dataset | Nighttime light |
| 9 | Landuse | 10 m | Fuzhou Survey Bureau | Land use |
| 10 | PD | 5 m | Processed from ArcGIS 10.5 | Pipeline density |
| 11 | POP | 100 m | Obtained from worldpop.org | Population count |
| 12 | DRO | 5 m | Processed from ArcGIS 10.5 | Distance to the road |
| 13 | DH | 5 m | Processed from ArcGIS 10.5 | Distance to the hospital |
| 14 | DRI | 5 m | Processed from ArcGIS 10.5 | Distance to the river |
| Model | Strategy (a) | Strategy (b) | ||||||
|---|---|---|---|---|---|---|---|---|
| A | P | R | F | A | P | R | F | |
| LR | 0.75 | 0.75 | 0.95 | 0.84 | 0.91 | 0.93 | 0.96 | 0.95 |
| NB | 0.72 | 0.83 | 0.81 | 0.82 | 0.82 | 0.84 | 0.94 | 0.88 |
| MLP | 0.81 | 0.86 | 0.89 | 0.87 | 0.90 | 0.9 | 0.97 | 0.93 |
| Tree | 0.88 | 0.93 | 0.92 | 0.92 | 0.90 | 0.93 | 0.95 | 0.94 |
| SVM | 0.79 | 0.78 | 1.0 | 0.88 | 0.86 | 0.84 | 1.0 | 0.91 |
| RF | 0.88 | 0.88 | 0.97 | 0.92 | 0.93 | 0.94 | 0.97 | 0.96 |
| XGBoost | 0.91 | 0.93 | 0.94 | 0.93 | 0.94 | 0.93 | 1.0 | 0.97 |
Disclaimer/Publisher’s Note: The statements, opinions and data contained in all publications are solely those of the individual author(s) and contributor(s) and not of MDPI and/or the editor(s). MDPI and/or the editor(s) disclaim responsibility for any injury to people or property resulting from any ideas, methods, instructions or products referred to in the content. |
© 2025 by the authors. Licensee MDPI, Basel, Switzerland. This article is an open access article distributed under the terms and conditions of the Creative Commons Attribution (CC BY) license (https://creativecommons.org/licenses/by/4.0/).
Share and Cite
Ye, C.; Xu, Z.; Liao, W.; Li, X.; Shu, X. Exploring the Performance and Interpretability of an Enhanced Data-Driven Model to Assess Surface Flooding Susceptibility. Sustainability 2025, 17, 3065. https://doi.org/10.3390/su17073065
Ye C, Xu Z, Liao W, Li X, Shu X. Exploring the Performance and Interpretability of an Enhanced Data-Driven Model to Assess Surface Flooding Susceptibility. Sustainability. 2025; 17(7):3065. https://doi.org/10.3390/su17073065
Chicago/Turabian StyleYe, Chenlei, Zongxue Xu, Weihong Liao, Xiaoyan Li, and Xinyi Shu. 2025. "Exploring the Performance and Interpretability of an Enhanced Data-Driven Model to Assess Surface Flooding Susceptibility" Sustainability 17, no. 7: 3065. https://doi.org/10.3390/su17073065
APA StyleYe, C., Xu, Z., Liao, W., Li, X., & Shu, X. (2025). Exploring the Performance and Interpretability of an Enhanced Data-Driven Model to Assess Surface Flooding Susceptibility. Sustainability, 17(7), 3065. https://doi.org/10.3390/su17073065