Article

Study on the Decoupling Effect and Driving Factors of Tourism Transportation Carbon Emissions in the Yangtze River Delta Region

College of Air Transportation, Shanghai University of Engineering Science, Shanghai 201600, China
*
Author to whom correspondence should be addressed.
Sustainability 2025, 17(7), 3056; https://doi.org/10.3390/su17073056
Submission received: 25 February 2025 / Revised: 23 March 2025 / Accepted: 26 March 2025 / Published: 30 March 2025

Abstract

:
As a key region in China’s “dual carbon” strategy, the Yangtze River Delta region faces the dual challenge of sustaining tourism-driven economic growth and achieving significant emission reductions. Based on panel data of the Yangtze River Delta region from 2000 to 2022, this paper adopts the “bottom-up” method to measure the carbon emissions of tourism transportation. It systematically analyzes its spatiotemporal evolution, decoupling effect, and driving mechanism. The results showed that (1) regional carbon emissions showed a trend of “first rising and then decreasing”. The spatial distribution changed from “high in the east and low in the west” to central agglomeration, and the hot spots of high emissions continued to concentrate in Shanghai and its surrounding cities, reaching a peak in 2019. (2) The decoupling state is mainly weak decoupling. The environmental Kuznets curve verified that carbon emissions and the tourism economy showed an inverted U-shaped relationship, and the decoupling levels of cities were significantly different. (3) Gross Domestic Product and the scale of tourist flow of cultural facilities (grey correlation degree 0.925) are the core positive drivers. In contrast, the travel ratio (contribution value −215.9) and the scale of passenger flow in A-class scenic spots (correlation degree 0.876) are the key inhibiting factors. This paper proposes a three-pronged policy framework of “energy structure optimization—cross-city carbon compensation—cultural and tourism integration” to provide theoretical and empirical support for the low-carbon transformation of urban agglomerations.

1. Introduction

Global climate change has become one of the most serious challenges to the sustainable development of human society. Under the 2015 Paris Agreement framework, China set the goal of reducing its carbon intensity by 60 to 65 percent from 2005 levels by 2030 [1]. In 2020, the “dual carbon” strategy was further established, promising to achieve carbon peak by 2030 and carbon neutrality by 2060 [2]. This commitment not only reflects China’s responsibility for global climate governance but also marks a major strategic shift in China’s economic and social development model to green and low-carbon transformation. Under this framework, the low-carbon transformation of tourism and transportation is not only an environmental issue but also the core task of national energy security and high-quality economic development.
Tourism is an essential part of the global economy; its carbon emissions account for 5–8% of global anthropogenic emissions, and tourism transportation, as the core of tourism carbon emissions (accounting for 75–90% of total tourism carbon emissions), has become a key area to achieve the “dual carbon” goal. In 2016, tourism transportation generated 1.597 billion tons of carbon emissions, accounting for 22% of the total carbon emissions of the transportation industry and 5% of man-made carbon emissions [3]. By 2030, CO2 emissions are projected to increase by 23 percent to 1.998 billion tons.
As one of the regions with the most active economy, the highest degree of openness and the strongest innovation capacity in China, the development of tourism in the Yangtze River Delta region has shown remarkable characteristics: from 2000 to 2019, the number of tourists increased from 266 million to 3.434 billion (accounting for 55.83% of the country), and the total tourism revenue exceeded CNY 2.26 trillion. However, the rapid growth of tourism in the region has come at a significant environmental cost: carbon emissions from tourism transportation reached 159.7 million tons in 2016, accounting for 22 percent of the country’s transport carbon emissions. In the context of the national strategy of the integration of the Yangtze River Delta, how to promote regional green development by optimizing the carbon emission path of tourism transportation has become an important proposition to implement the “dual carbon” goal.
The adverse effects of global climate change and increasing carbon emissions have aroused widespread concern in the international community. Existing research mainly includes the estimation of tourism transportation carbon emissions, the decoupling effect, and influencing factors.
(1)
Emission accounting method: Current approaches to quantifying tourism transportation emissions bifurcate into top-down and bottom-up methods. Top-down models, such as energy-statistics-based coefficient systems (Becken [4], 2003; Wei, Y [5], 2012) and input-output frameworks (Perch [6], 2010), offer macro-level efficiency but lack spatiotemporal granularity. Conversely, bottom-up techniques leveraging activity data and GIS trajectory tracking (Diaz Perez [7], 2019; Hu, C [8], 2022; Liu, J [9], 2024) enhance resolution but face challenges in system boundary consistency. Hybrid lifecycle assessments (Liao, H [10], 2022) have emerged to reconcile these trade-offs, yet their application remains limited to single-region studies. A notable gap lies in the absence of standardized methodologies for cross-provincial urban agglomerations, where spatial spillovers and policy coordination complexities are pronounced.
(2)
Decoupling effect analysis: In the study of the relationship between economic growth and environmental stress, the decoupling model represented by OECD (Lundquist [11], 2021) and Tapio frameworks plays a dominant role [12]. The Tapio model, with its dimensionless flexibility (Liu, F [13], 2022; Wang, Z [14], 2022), has been widely adopted to categorize decoupling states. However, existing studies predominantly focus on national or provincial scales, overlooking intra-regional heterogeneity within integrated urban clusters like the Yangtze River Delta. Furthermore, while IPAT-derived analyses (Lu, Z [15], 2007) evaluate environmental load–economic growth linkages, few integrate decoupling metrics with spatiotemporal evolution patterns, limiting their utility in policy formulation for dynamic regions.
(3)
Driving mechanism exploration: Drivers of tourism transportation emissions are increasingly analyzed through decomposition techniques (e.g., LMDI, Kaya identity) (Cansino [16], 2015; Moutinho [17], 2018; Wang, L [18], 2023) and extended STIRPAT models. Spatial heterogeneity studies (Tiwari [19], 2013; Sun, Y [20], 2020) highlight regional disparities in emission intensity reduction paths, yet fail to address cross-city synergistic mechanisms. Innovations such as panel VAR models (Li, Y [21], 2022) reveal lag effects between emissions and growth but neglect emerging factors like cultural tourism integration. (Ghazali [22], 2019; Pham [23], 2020; Su, H [24], 2024) underscore the catastrophic potential of tourism consumption–energy structure interactions, yet regulatory variables (e.g., institutional quality, cross-regional collaboration) remain underexplored.
The existing results provide an important benchmark for the low-carbon transition of tourism and transportation, but there are two major limitations: (1) Research on cross-regional collaborative emission reduction mechanisms at the scale of urban agglomeration is weak. As China’s first cross-provincial integration demonstration zone, the spatial spillover effect and policy coordination path of tourism transportation carbon emissions in the Yangtze River Delta have not yet been revealed. (2) Existing analyses mostly discuss the decoupling status or spatiotemporal evolution in isolation, lacking the systematic integration of the three-dimensional framework of “spatiotemporal evolution—decoupling effect—driving mechanism”, especially ignoring the quantitative role of emerging driving factors such as cultural facilities passenger flow in the context of cultural and tourism integration.
This study takes 41 cities in the Yangtze River Delta as the object to build a cross-dimensional analysis framework integrating cultural indicators, aiming to fill the gaps mentioned above: Through “bottom-up” accounting, the regional emission pattern was clarified, the non-linear relationship between economy and emissions was verified by combining the Tapio decoupling model and EKC regression, and the key driving factors were identified by LMDI decomposition and grey correlation analysis, providing theoretical basis and method reference for the design of low-carbon policies at the scale of urban agglomerations. The main research objectives are as follows: (1) Spatial and temporal evolution of carbon emissions from tourism transportation in the Yangtze River Delta from 2000 to 2022; (2) Decoupling status and regional differences between carbon emissions and tourism economic growth; (3) Systematically explore the key influencing factors of tourism transportation carbon emissions in the Yangtze River Delta region, provide a theoretical basis for regional policy formulation, and provide a reference for the sustainable development of other urban agglomerations.
The remaining contents of this paper are as follows: Section 2 describes the research methods and data sources used. Section 3 presents and discusses the research results in depth. Section 4 concludes the research, offering targeted policy suggestions, acknowledging the article’s limitations, and discussing prospects.

2. Materials and Methods

This study focuses on the spatiotemporal evolution of carbon emissions from tourism transportation in the Yangtze River Delta and systematically analyzes the dynamic correlation between carbon emissions and the tourism economy. The technical route is illustrated in Figure 1. The research framework is organized into the following four levels:
(1)
Data integration and carbon emission accounting
Based on the provincial and municipal panel data of the Yangtze River Delta region from 2000 to 2022, the total carbon emissions of tourism transportation were measured using the “bottom-up” accounting method and regional types (such as high-emission–high economic zones and low-emission–growth areas) were divided to clarify the spatial and temporal differentiation pattern.
(2)
Construction of dynamic association model
Decoupling effect analysis: The decoupling state (strong decoupling, weak decoupling, etc.) between carbon emission and the tourism economy was quantified using the Tapio decoupling model. Difference assessment: The Gini coefficient was used to measure the spatiotemporal convergence of regional carbon emission differences. Long-term equilibrium test: Based on environmental Kuznets curve (EKC) regression, the nonlinear relationship between the two is verified.
(3)
Drive mechanism analysis
Factor decomposition: The LMDI additive decomposition model was adopted to deconstruct the driving effect of carbon emissions from the dimensions of visitor size, level of economic development, energy intensity, new quality productivity, and infrastructure. Key factor screening: 10 leading factors were identified using grey correlation analysis, and their contribution ranking was quantified.

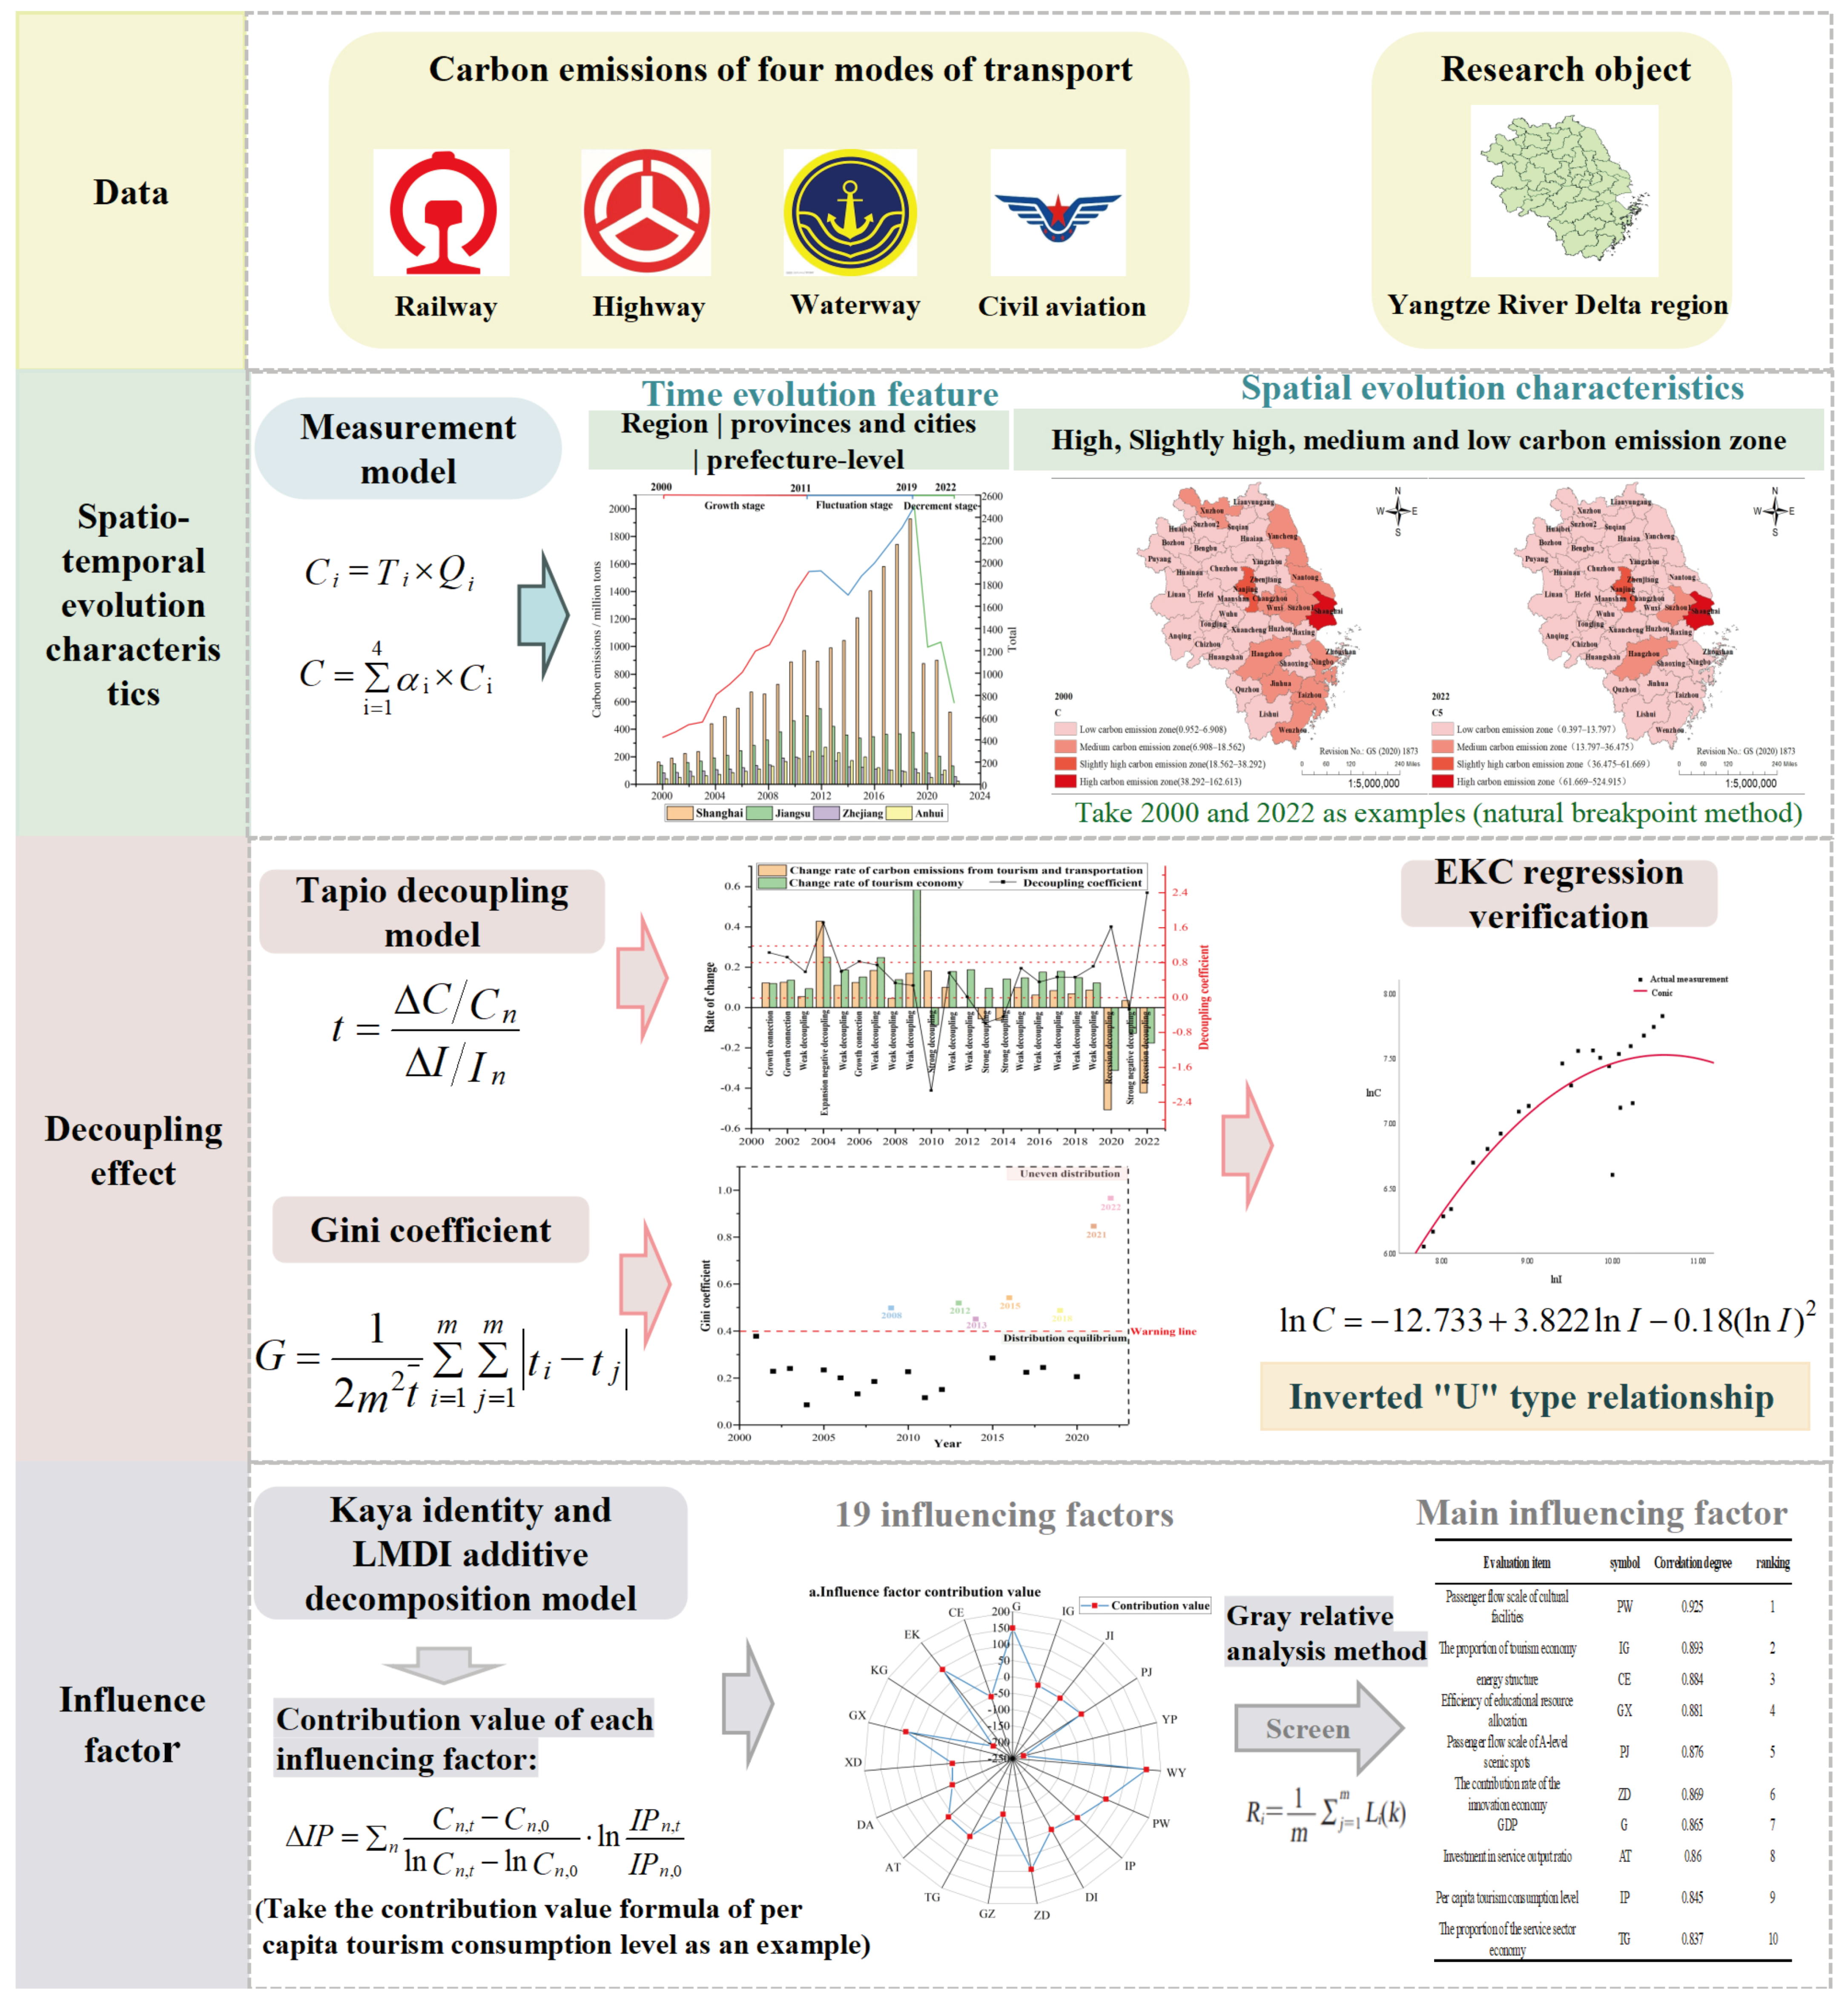
2.1. Carbon Emission Measurement Model of Tourism Transportation

According to the suggestions put forward by the United Nations World Tourism Organization (UNWTO), the carbon emissions of the four modes of travel were calculated based on the product of passenger turnover and the emission coefficient [25]. The calculation model is as follows:
C i = T i × Q i
where C i represents the total transport carbon emissions of type i passenger travel mode (gCO2), T i represents the emission coefficient of type i passenger travel mode (gCO2/ (km∙person)), and Q i represents the passenger turnover of type i passenger travel mode (km∙person).
By summarizing the research results of domestic and foreign scholars on the carbon emission coefficients of the four modes of travel, see Table 1, combined with the traffic development in the Yangtze River Delta region, the carbon emission coefficients of the four modes of travel—namely railway, highway, civil aviation and waterways—are more authoritative and universal. The values are 27 gCO2/(km∙person), 133 gCO2/(km∙person), 137 gCO2/(km∙ person), and 106 gCO2/(km∙person).
Concerning the relevant studies [6,33], the carbon emission measurement model of tourism transportation is as follows:
C = i = 1 4 α i × C i
where C represents the total carbon emission of tourism transportation (gCO2), and α i is the proportion of tourists in the four modes of transportation. Since China’s tourism satellite account system is unclear, it cannot be accurately used [36]. Regarding previous studies [8,9], the time segment setting (%) is shown in Table 2.

2.2. Decoupling Model

Decoupling theory was proposed by the Organization for Economic Cooperation and Development (OECD) to describe the basic concept of how to break the link established between economic growth and resource consumption or environmental pollution [37]. Two of the various decoupling models are commonly used: the Tapio decoupling model and the OECD decoupling model, which have been widely used over the years. Among them, the Tapio decoupling model can judge various decoupling states according to the variation amplitude of the decoupling coefficient, without being constrained by statistical dimensions [33]. Therefore, based on the Tapio decoupling analysis model, this paper further reveals the relationship between carbon emissions and the tourism economy. The specific formula is as follows:
t = Δ C / C n / Δ I / I n
where t is the decoupling coefficient, C n represents carbon emissions from tourism and transportation in year n (10,000 tons), I n represents the tourism income in year n (CNY 100 million), which is used as the expression value of the tourism economy, Δ C represents the change in carbon emissions from tourism and transportation, and Δ I represents the change in the tourism economy. There are a total of eight types of decoupling statuses, which can be divided into three categories, as shown in Figure 2 [38].

2.3. Spatial Analysis Method

The Gini coefficient is a statistical index used to measure the inequality of resource distribution within a group [39]. In environmental science, it is also used to describe the unequal distribution of carbon emissions across regions. The specific formula is as follows:
G = i = 1 m j = 1 m t i t j / 2 m 2 t
where G stands for the Gini coefficient, m stands for the number of research objects, t ¯ represents the mean value of the decoupling coefficient, and t i and t j represents the decoupling coefficient between the tourism transportation carbon emissions and the tourism economy cities i and j , respectively. The Gini coefficient usually takes 0.4 as the “warning line” to measure the wealth gap in a country or region [40].

2.4. Selection and Analysis of Influencing Factors

2.4.1. Index Selection

Through the review of China National Knowledge Infrastructure (CNKI) and Science Direct tourism and transportation-related literature, taking into account theoretical rigor, data accessibility and policy orientation, the integration of culture and tourism, and new high-quality productivity factors have been innovatively integrated, and 13 basic indicators were obtained. Furthermore, “tourism transportation”, “influencing factors”, and “indicators in Table 3” were used as the main keywords for further advanced literature search and statistics, and different indicators, along with the corresponding number of references, were obtained, as shown in Table 3.

2.4.2. Kaya Identity and LMDI Decomposition Model

The Kaya identity was proposed by Japanese scholar Yoichi Kaya in 1989 [53], and it is mainly used to analyze the influencing factors of carbon emissions. The Index Decomposition Analysis (IDA), using the Logarithmic Mean Divisia Index (LMDI) without residuals, can effectively avoid spurious regression and is a relatively complete decomposition algorithm. The LMDI addition model is an important tool for analyzing the driving factors of tourism and transportation carbon emissions due to its features, such as no residuals, strong explanatory power, and flexible decomposition. By quantifying the contributions of scale, structure, technology, and other factors, it provides a scientific decision-making basis for the low-carbon transformation of the tourism industry.
Based on the basic indicators in Table 3, the system of influencing factors for tourism transportation carbon emissions is further constructed through the Kaya identity and the LMDI additive decomposition model, as shown in Table 4.
The corresponding model is as follows:
C t C 0 = Δ C E + Δ E K + Δ K G + Δ G X + Δ X D + Δ D A + Δ A T + Δ T G + Δ G Z + Δ Z D + Δ D I + Δ I P + Δ P W + Δ W Y + Δ Y P + Δ P J + Δ J I + Δ I G + Δ G
where C t represents the carbon emissions of tourism and transportation in the reporting period t , C 0 represents the carbon emissions of tourism and transportation in the base period 0, and the symbols after the equal sign are the changes in the indicators in Table 4.

2.4.3. Grey Correlation Analysis Method

By quantifying the correlation degree of each factor and carbon emission, the grey correlation model can quickly identify key intervention targets, especially for the rapid diagnosis of complex systems. The grey correlation coefficient reflects the correlation degree of two sequences at a certain point, and the correlation degree is the average of all correlation coefficients, which is used to comprehensively evaluate the correlation degree between the comparison sequence and the reference sequence [54]. The calculation formula is as follows:
R i = 1 m j = 1 m L i k
where R i represents the correlation degree, L i k represents the correlation coefficient, and m represents the years.

2.5. Source of Data

Considering the inconsistency of data before 2000 and the serious lack of statistical caliber, the full coverage of policy stages, the need to match the coordinated development process of the Yangtze River Delta region and long-term data, this study chooses 2000–2022 as the research period. It provides a robust time series analysis basis for revealing the long-term evolution law of carbon emissions from tourism transportation in the Yangtze River Delta and the emission reduction path under the “dual carbon” target.
The data required for calculating tourism transportation carbon emissions in the Yangtze River Delta region and the impact index data were taken from the Statistical Yearbook and the Statistical Bulletin of National Economic and Social Development of 41 cities in the Yangtze River Delta region. The interpolation method is used to process individual missing data points to ensure the integrity and accuracy of the evaluation data.

3. Results

3.1. Temporal and Spatial Evolution Characteristics

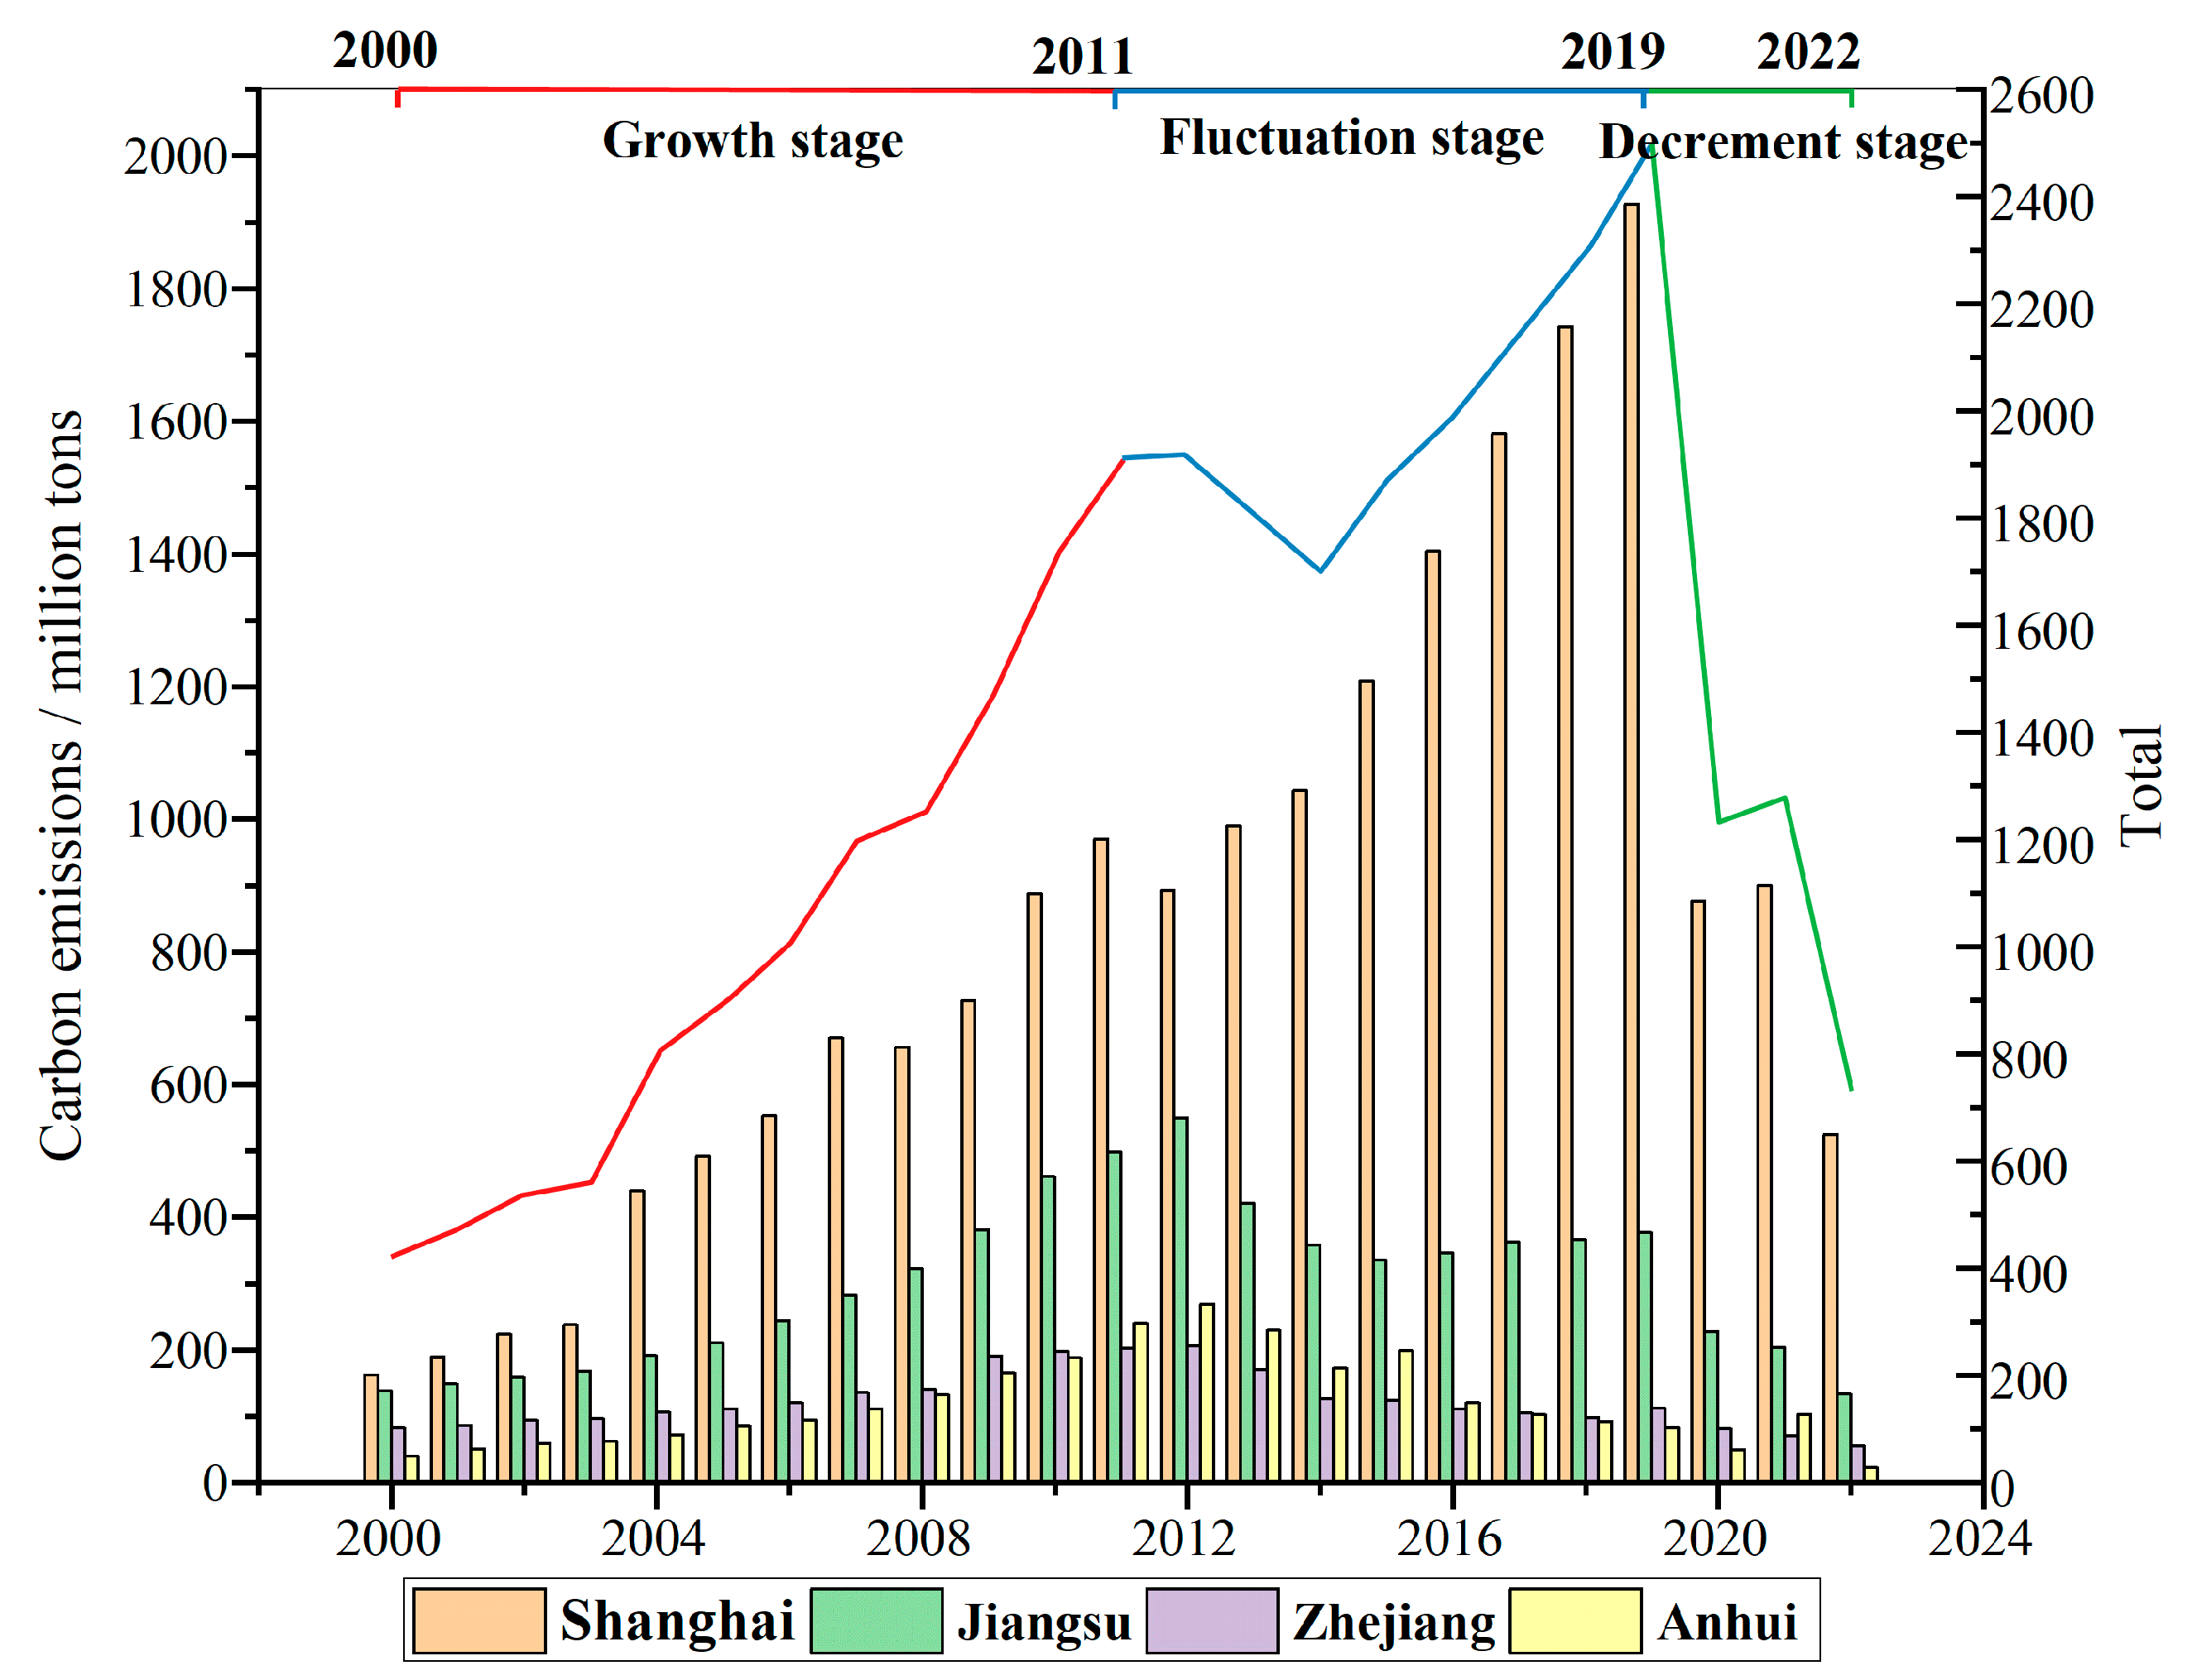
3.1.1. Temporal Evolution Characteristics of Tourism Transportation Carbon Emissions in the Yangtze River Delta Region, 2000–2022

This paper analyzes the temporal evolution characteristics of tourism transportation carbon emissions in the Yangtze River Delta region from multiple perspectives and using various methods. A “total-fraction” research framework was adopted to comprehensively utilize IBM SPSS Statistics 27 software for generating the Kernel density estimation curve, and Origin 2022 software for producing a box plot, a normal distribution curve, a time-series evolution line chart, and other methods to explore the time-series evolution patterns of tourism transportation carbon emissions.
(1)
Regional level
Considering the long research period and the extreme imbalance caused by excessive carbon emissions from tourism transportation in Shanghai in the Yangtze River Delta region, Figure 3 takes carbon emissions from tourism transportation per capita as the research object, and Figure 3a draws box plots and corresponding normal curves every two years. From 2000 to 2022, the average carbon emissions per capita from tourism transportation in the Yangtze River Delta region showed a downward trend overall, and with time, the gap between the 41 cities gradually narrowed, and there was an obvious “carbon emission convergence effect”. To further characterize the distribution characteristics of per capita tourism transportation carbon emissions in the Yangtze River Delta region and describe the time evolution law in a more detailed way, six node years (2000, 2005, 2010, 2015, 2020, and 2022) were selected. Their Kernel density estimation curves were drawn (Figure 3b). It can be found that: (1) From the perspective of distribution, the per capita carbon emission density curve of tourism transportation has a tendency to change from a slight “bimodal” state to a “unimodal” state, and it is inferred that the per capita carbon emission of tourism transportation in the Yangtze River Delta region has gradually changed from a bipolar to a unipolar state during the study period. (2) From the peak position, the peak value of the nuclear density curve showed a trend of “first increasing, then decreasing and then increasing”, but the peak value was above 40, indicating that the spatial distribution of carbon emissions per capita from tourism transportation in the Yangtze River Delta showed a trend of “central-discrete—concentrated”. (3) From the perspective of time series changes, the nuclear density curve continues to shift to the left, and the curve bandwidth continues to shorten, indicating that with time, the integration of the Yangtze River Delta has been steadily promoted, and the per capita carbon emissions of tourism transportation have gradually decreased.
(2)
Provincial and municipality level
The carbon emissions of tourism transportation in three provinces and one city in the Yangtze River Delta region (2000–2022) were calculated through the tourism transportation carbon emission calculation model, and its specific time evolution characteristics were analyzed, as shown in Figure 4.
Overall, carbon emissions from tourism transportation in the Yangtze River Delta followed a pattern of “increasing and then decreasing”, with 2019 marking the peak year. From 2000 to 2011, emissions grew steadily at an average annual rate of 5.2%. The period from 2011 to 2019 was characterized by fluctuations, influenced by policy changes and transportation reforms. Between 2019 and 2022, the State Council issued the “Outline of the Plan for the Integrated Development of the Yangtze River Delta Region”, which made strengthening ecological protection and management a key priority. The plan also emphasized the continued promotion of low-carbon and high-quality development in the region. As a result, carbon emissions began to decline significantly from 2019, with an average annual decline of 3.8%.
In terms of provincial and municipal carbon emissions from tourism and transportation, Shanghai ranks first, with emissions experiencing rapid growth and subsequent decline, reaching a peak in 2019. Jiangsu Province ranked second and Zhejiang Province third, with little fluctuation in their emissions. Anhui Province has the lowest carbon emissions from tourism transport, but its emissions were higher than those of Zhejiang Province between 2011 and 2016. Carbon emissions from tourism transportation in Jiangsu, Zhejiang, and Anhui all peaked in 2012. The difference in peak carbon emissions in the Yangtze River Delta region is largely due to the difference in economic development stage, transport infrastructure, and tourism growth rate between Shanghai and the three provinces.

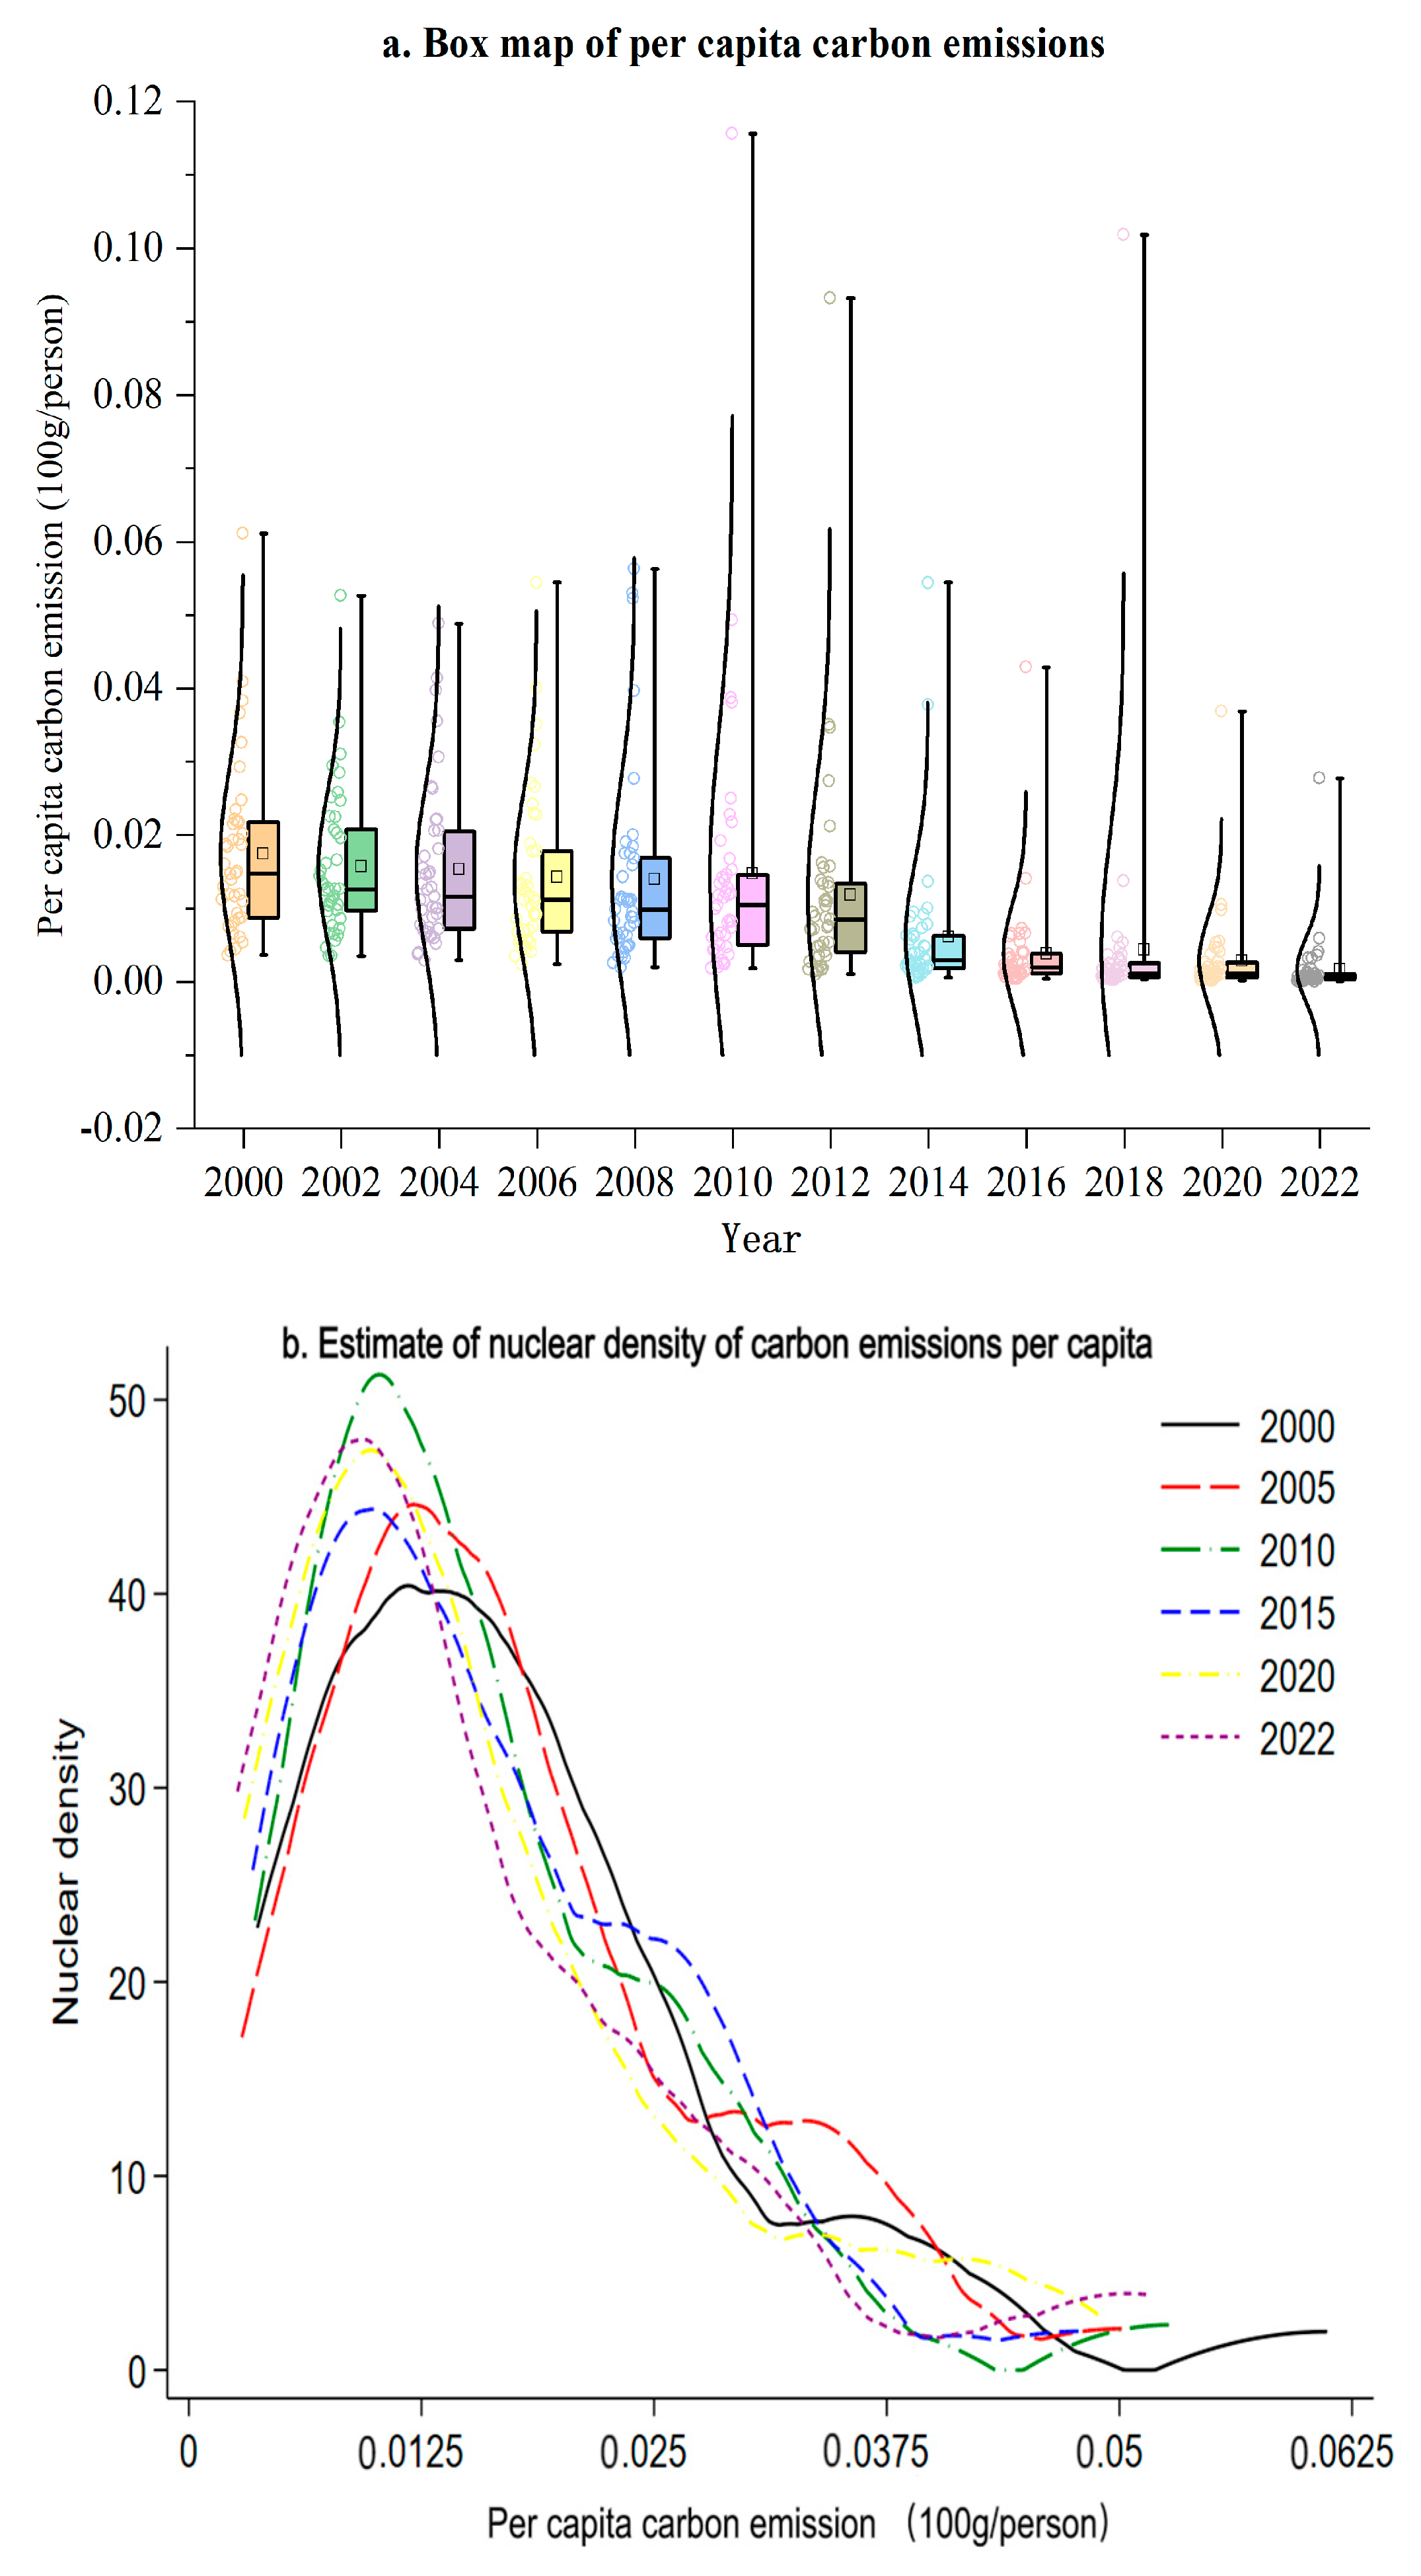
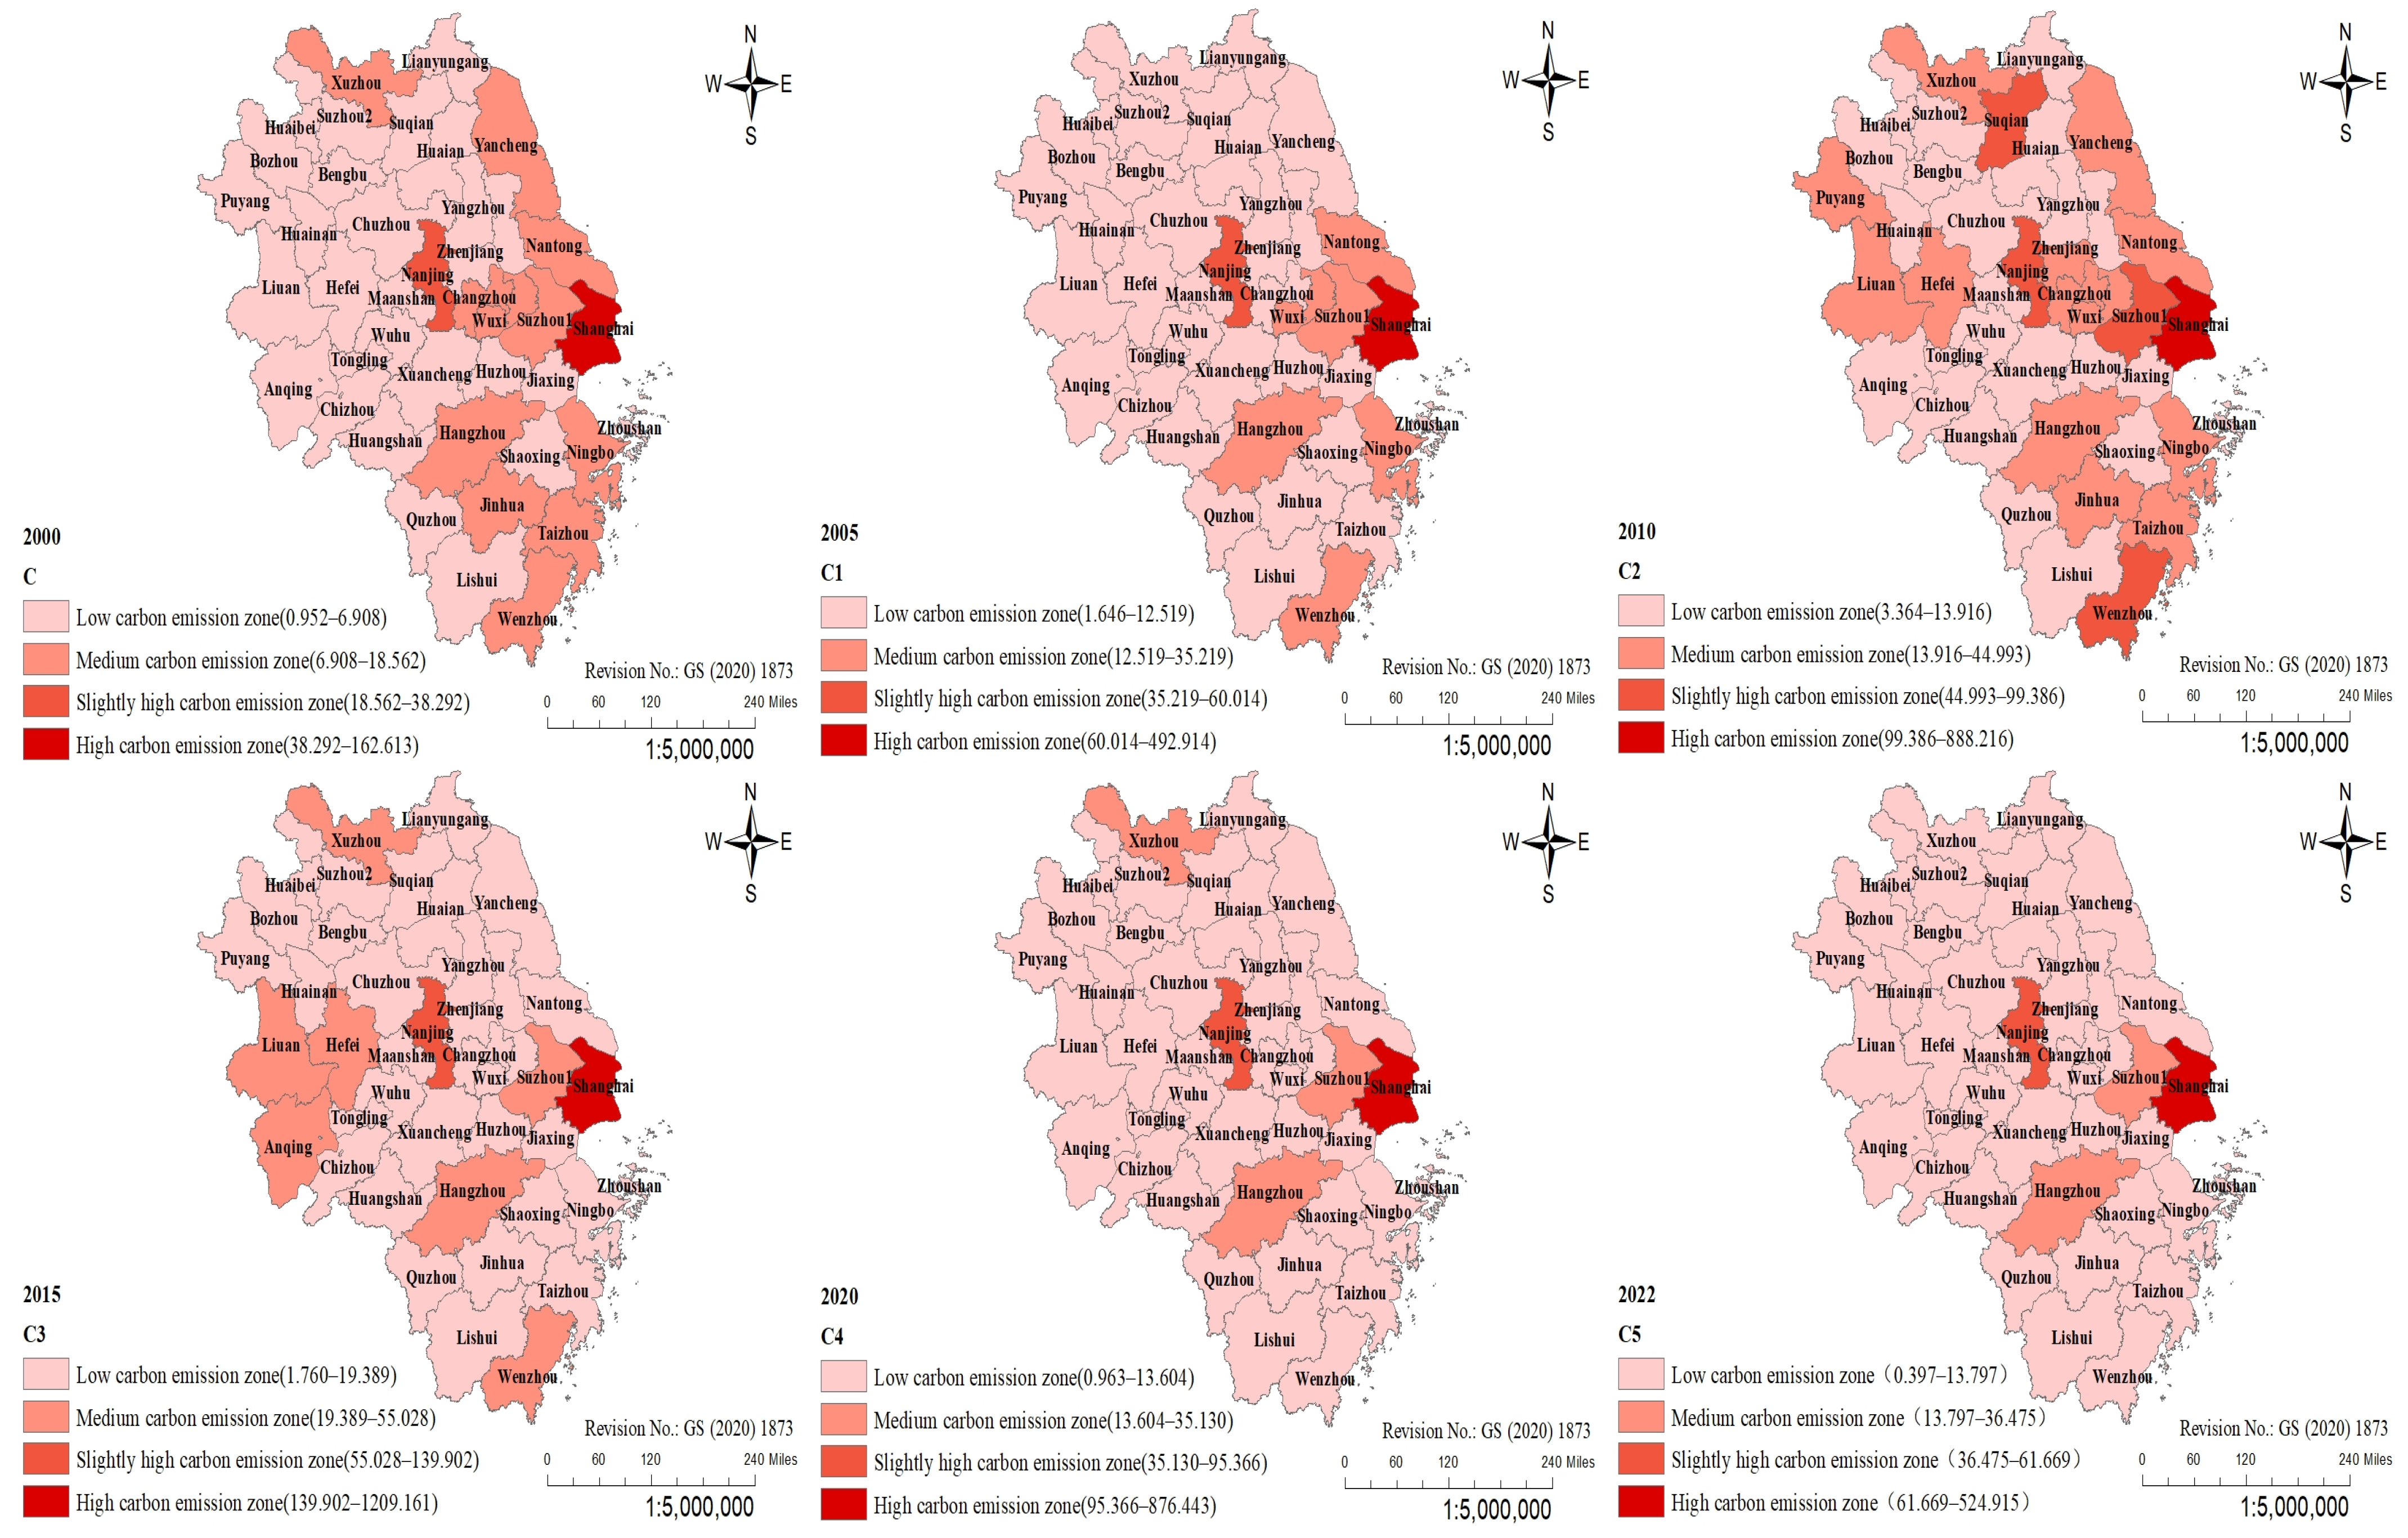
3.1.2. Spatial Evolution Characteristics of Tourism Transportation Carbon Emissions in the Yangtze River Delta Region, 2000–2022

To analyze the spatial distribution characteristics of carbon emissions from tourism transportation, considering the long research period and research cycle, this paper selects six important nodes (2000, 2005, 2010, 2015, 2020, and 2022) during the research period for analysis. The natural breakpoint method in ArcGIS 10.8 software was applied to divide each city into four levels: high carbon emission zone, slightly high carbon emission zone, medium carbon emission zone, and low carbon emission zone (See Figure 5) [8].
Overall, carbon emissions from tourism transportation in the Yangtze River Delta initially showed a pattern of “higher in the east and lower in the west”, but over time, emissions gradually became more concentrated in the central regions. Shanghai and its surrounding cities have consistently been the hotspot for high emissions. As time progressed, regional differences in carbon emissions narrowed, reflecting a convergence effect.
(1)
In 2000, the carbon emissions of tourism transportation in the Yangtze River Delta showed a spatial distribution characteristic of “high in the east and low in the west”. The Shanghai metropolitan area, capital cities (except Hefei) and coastal cities have relatively high carbon emissions, while the western region of the Yangtze River Delta, including cities such as Hefei and Lu’an, had low carbon emissions.
(2)
In 2005, the spatial distribution shifted to “higher in the middle and lower in the west.” While high-carbon emission areas remained largely the same, some cities in Jiangsu and Zhejiang provinces, such as Xuzhou, Yancheng, and Taizhou, transitioned from high-carbon to low-carbon emission areas.
(3)
In 2010, the spatial distribution pattern resembled that of 2000 but at a higher emission level for most cities. By 2015, the carbon emissions from tourism transportation in the Yangtze River Delta followed a “low in the north and south, high in the middle” pattern.
(4)
In 2020, 36 cities in the Yangtze River Delta, excluding Shanghai and its neighboring city Suzhou, as well as the two provincial capitals and Xuzhou, were classified as low-carbon emission zones. The spatial distribution in 2022 was similar to that of 2020, except for Xuzhou, which further transitioned from a medium-carbon emission zone to a low-carbon emission zone after implementing a series of emission reduction measures.

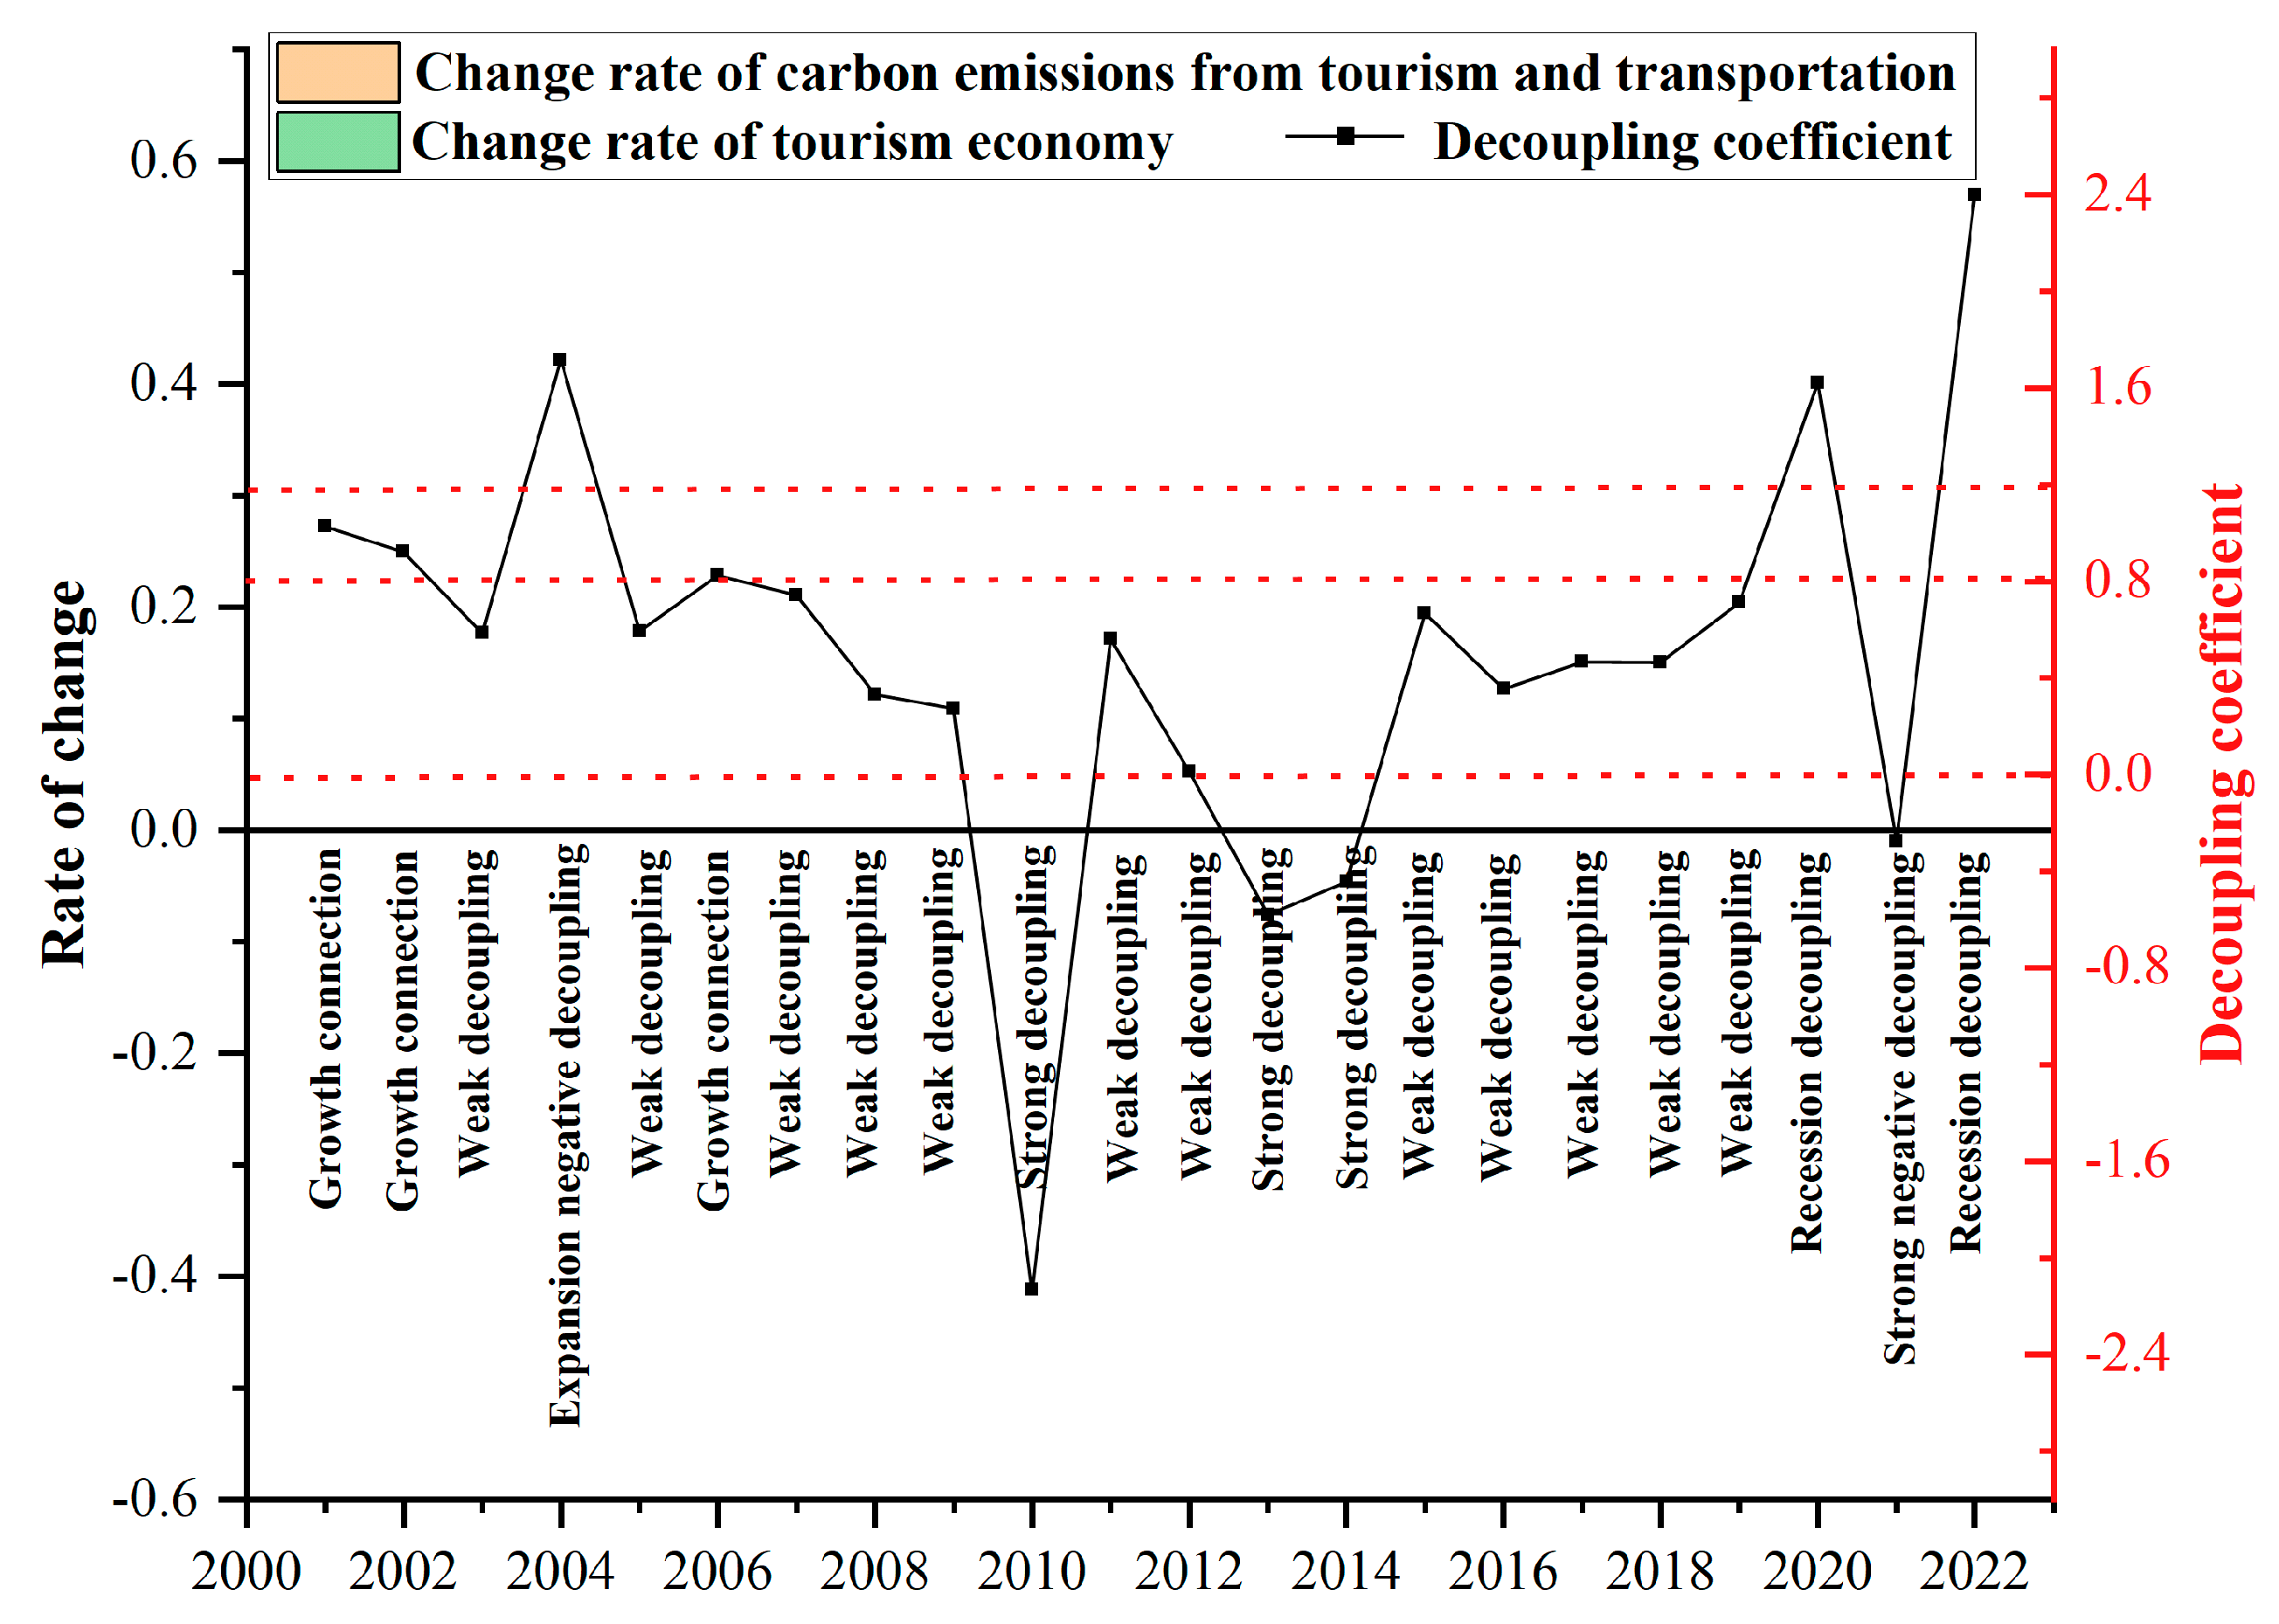
3.2. Decoupling Effect Analysis

3.2.1. Analysis of the Relative Relationship and Decoupling Effect Between Tourism Transportation Carbon Emissions and Tourism Economy in the Yangtze River Delta Region

By analyzing the spatial and temporal evolution characteristics of tourism transportation carbon emissions in the Yangtze River Delta region, it can be found that there are significant differences among provinces and cities. To further study the decoupling effect, this paper draws a scatter map of the Yangtze River Delta from the perspectives of provinces and cities and prefecture-level cities, respectively, with tourism transportation carbon emissions as the horizontal coordinate and tourism income as the vertical coordinate (see Figure 6).
From the perspective of three provinces and one city in the Yangtze River Delta region (Figure 6a): Shanghai exclusively owns the low-income and high-emission areas, Zhejiang and Jiangsu are both high-income and low-carbon emission areas, and Anhui Province is a low-income and low-carbon emission area.
From the perspective of prefecture-level cities in Jiangsu, Zhejiang, and Anhui Provinces (Figure 6b): All prefecture-level cities in Jiangsu Province except Nanjing are low-carbon emission areas, and Nanjing is a high-income and high-emission area, while Wuxi is the only high-income and low-emission area among the 41 cities, which is an excellent example of the rapid and benign development of a low-carbon economy in the Yangtze River Delta region. Most of the prefecture-level cities in Zhejiang Province are low-income and low-emission areas, while Hangzhou and Ningbo belong to high-income and high-emission areas. Wenzhou exclusively belongs to low-income and high-emission areas. In Anhui Province, except Hefei, the capital city, all are low tourism income areas, and Anqing, Lu’an, and Fuyang are low-income and high-carbon emission areas.
The Tapio model was used to obtain the decoupling state between the two, to deeply analyze the decoupling effect between tourism transportation carbon emissions and tourism economic growth (see Figure 7). From 2000 to 2022, there were 13 decoupling years in the Yangtze River Delta. Among them, 2013 and 2014 were strong decoupling states, and carbon emissions were inhibited and reduced at the same time as tourism economic growth, showing an optimal state, while the remaining 11 years were weak decoupling states. Recessionary decoupling occurred in 2020 and 2022, while the negative decoupling category occurred only in 2004, 2010, and 2021. Expansionary negative decoupling appeared in 2004. 2010 and 2021 show a strong negative decoupling state, which is the least ideal state. The link categories in the Yangtze River Delta region appeared only in 2001, 2002, and 2003, and all showed growth links.

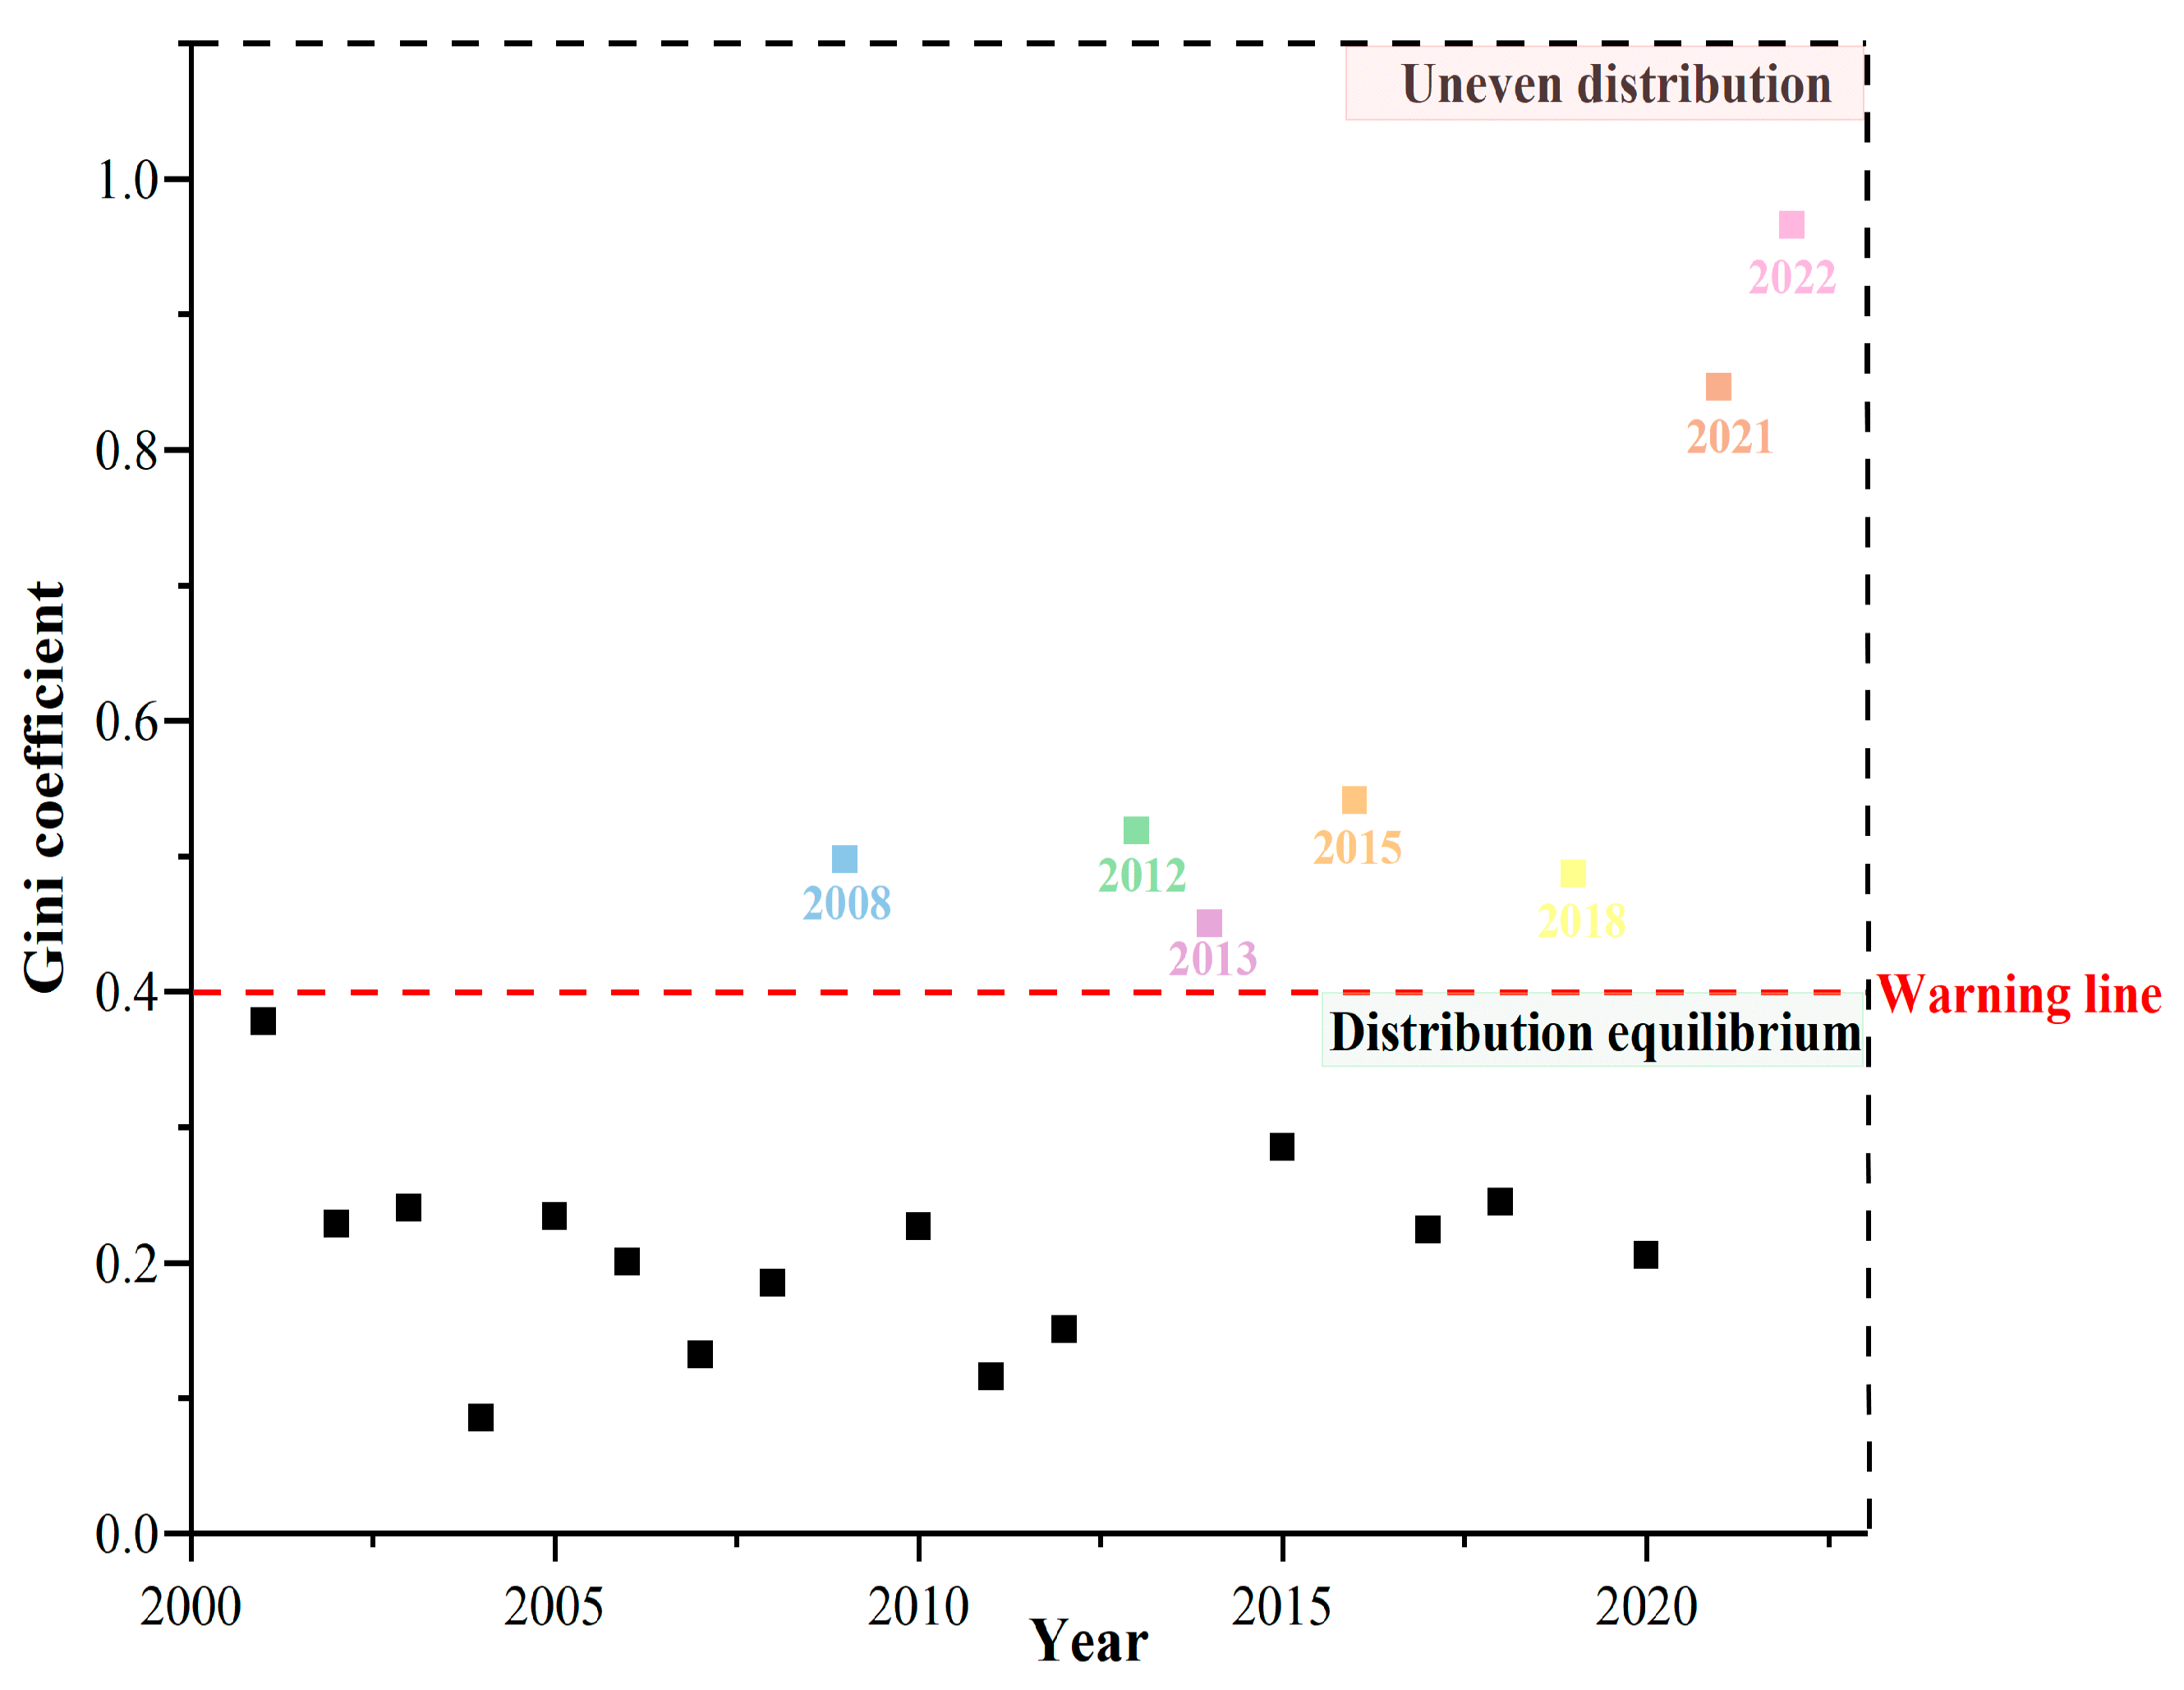
3.2.2. Analysis of Regional Differences in Decoupling Effect

The Gini coefficient of the decoupling coefficient between tourism transportation carbon emissions and tourism economy in the Yangtze River Delta region was calculated (see Figure 8) to reveal the spatial heterogeneity. During the study period, the variation trend of the Gini coefficient of the decoupling coefficient fluctuated, and the Gini coefficient of the decoupling coefficient was greater than 0.4 in 7 years, indicating that the decoupling level gap among 41 cities in the Yangtze River Delta region is relatively significant in these 8 years. The Gini coefficient in 2022 is the highest at 0.965.

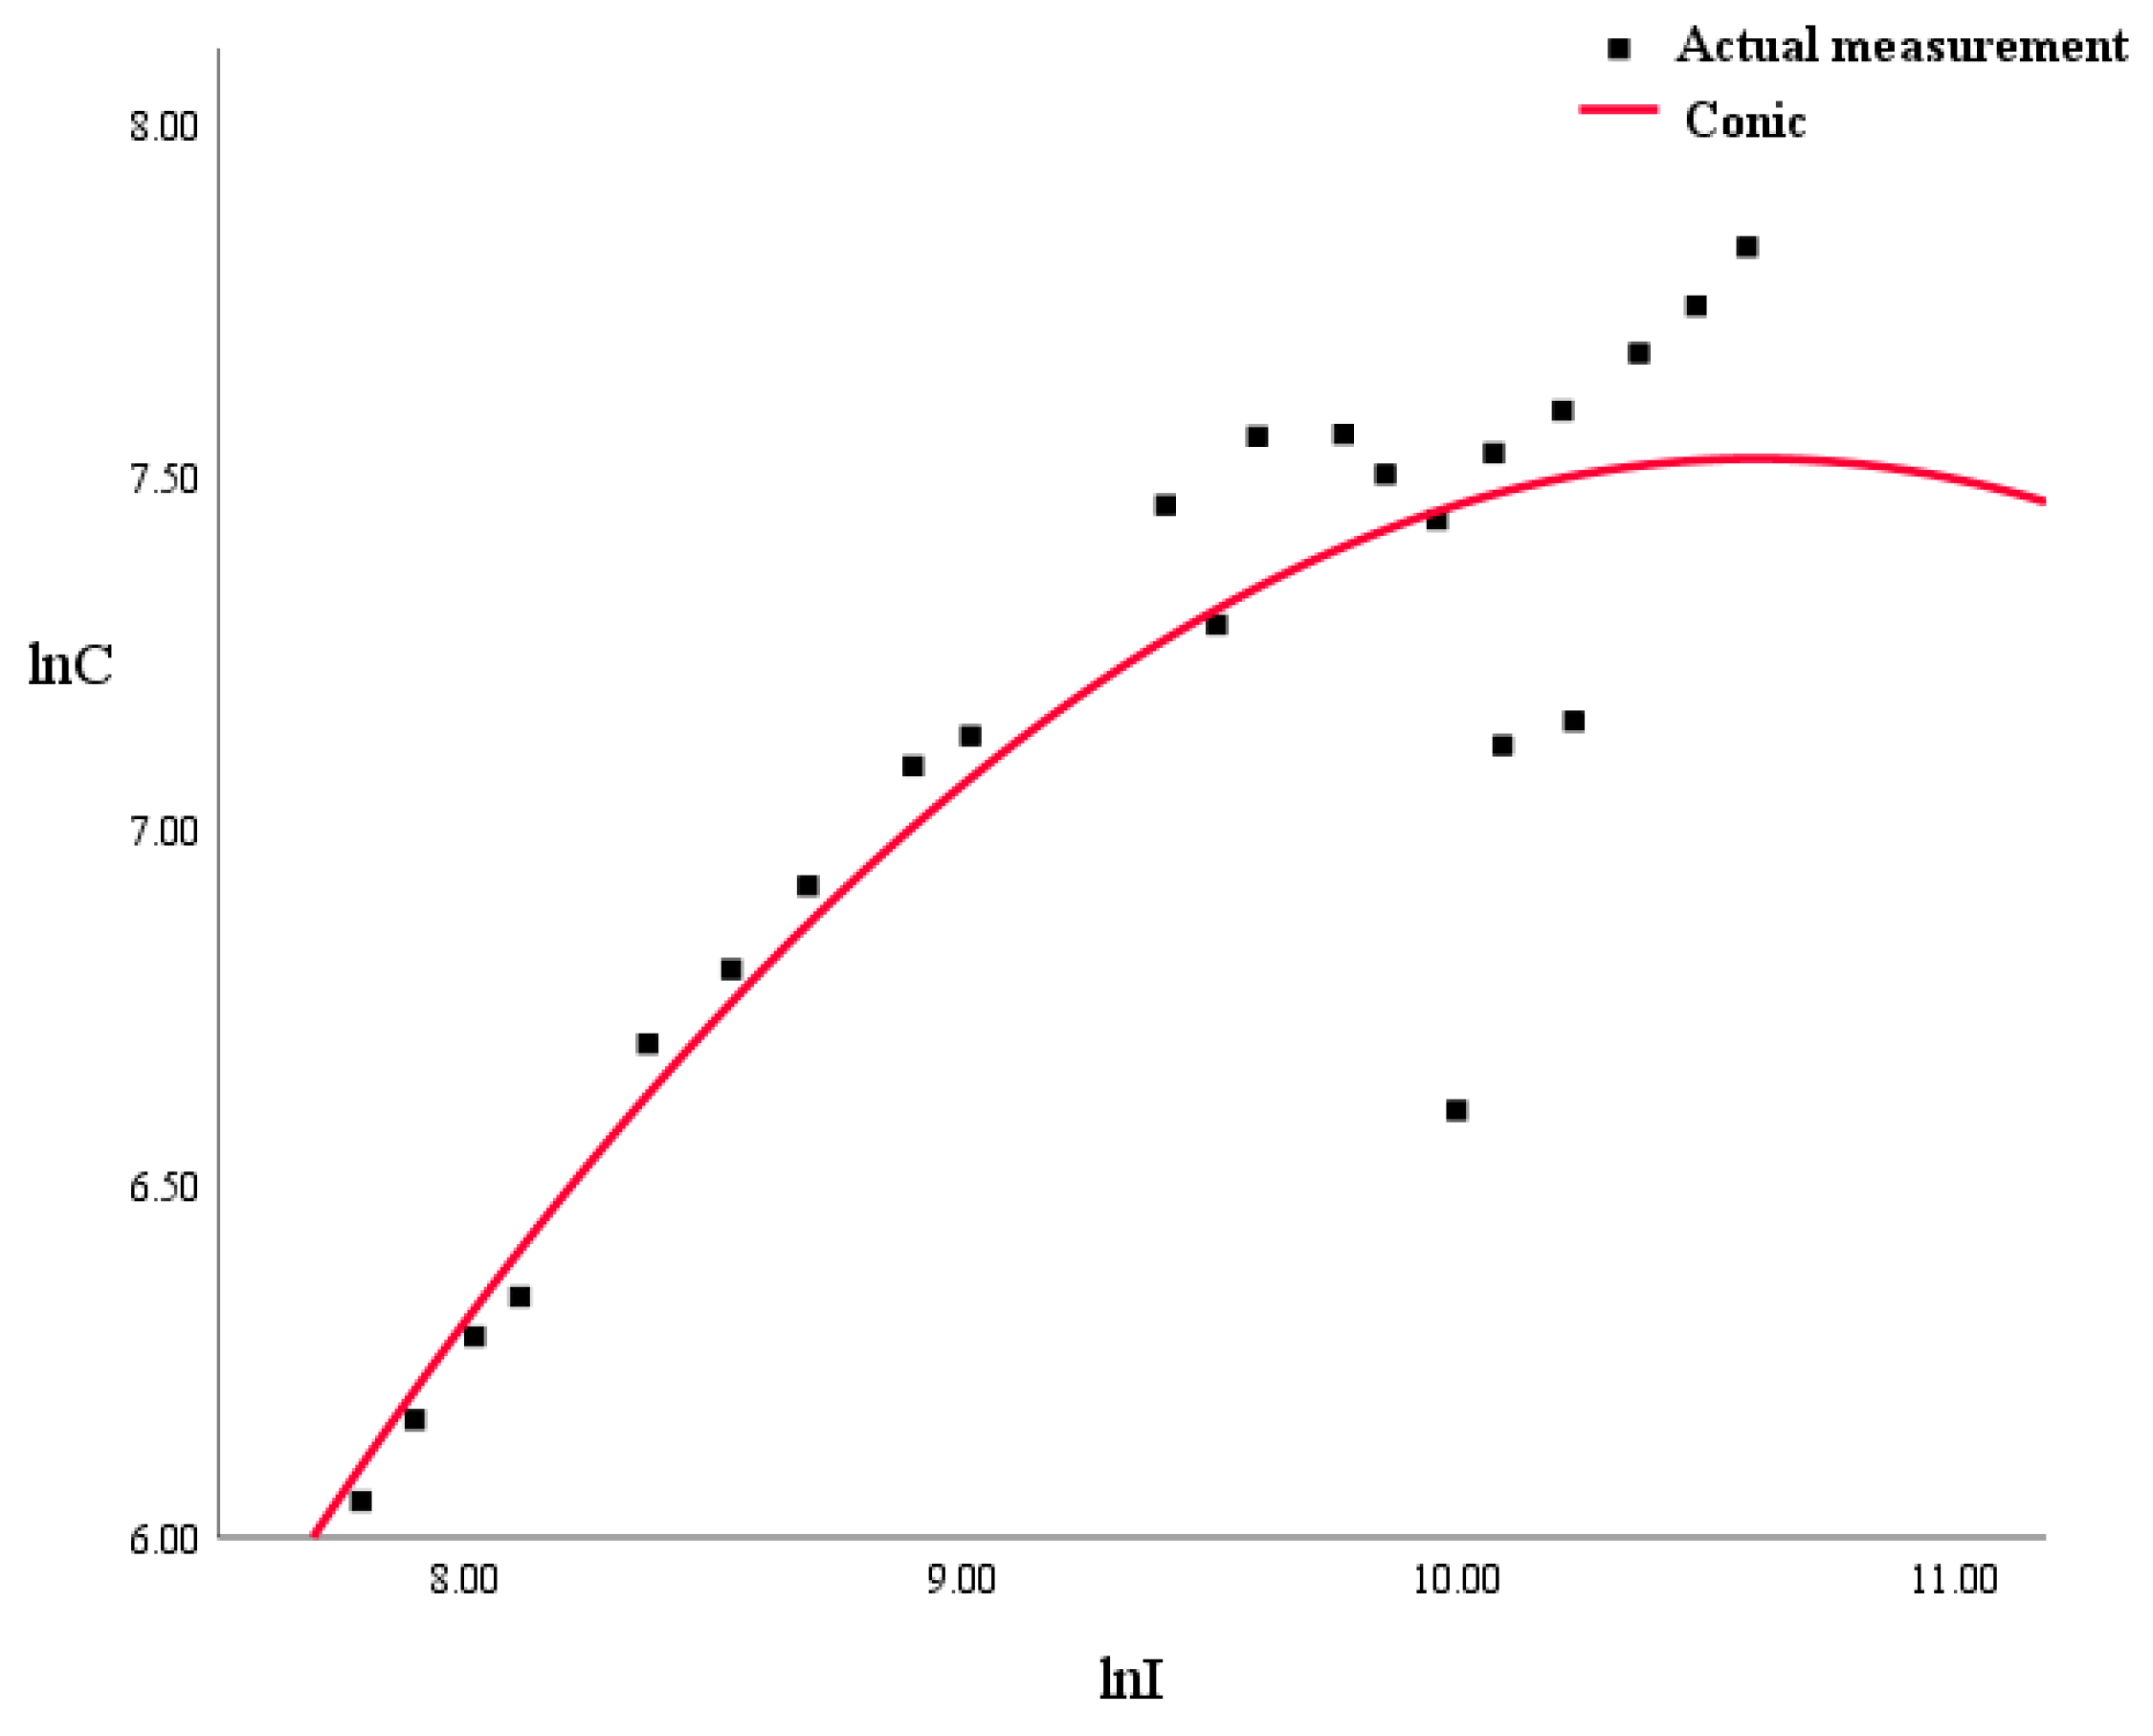
3.2.3. Environmental Kuznets Curve (EKC) Verification

(1)
Results of unit root test and cointegration test
ADF single root test method was used to test the stationarity of ln C , ln I , ( ln I ) 2 , and ( ln I ) 3 in the Yangtze River Delta region from 2000 to 2022, and the results are shown in Table 5. The stationarity test was conducted on the original time series data, and the result was not stable. The first-order difference series data passed the test at the significance level of 5%, and the result was stable; that is, the variables were all first-order single integral time-series data.
Currently, there are two types of commonly used co-integration test methods: One is the Engle–Granger two-step method based on residuals, and the other is the Johansen test based on regression coefficients [55]. Considering that there are only two research variables, the Engle–Granger two-step method is selected to conduct the co-integration test on the variables, and the residual series obtained show a stable state at a 5% confidence level; that is, there is a long-term stable equilibrium relationship between tourism transportation carbon emissions and the tourism economy in the Yangtze River Delta region during the study period.
(2)
Granger causality test based on the VAR model
In order to ensure the accuracy and reliability of further regression analysis and the EKC test, the VAR model is first established, and the optimal lag order of the variable is 1. Secondly, the AR root is used to test the stability of the VAR model. The results show that the feature roots of the VAR model in the Yangtze River Delta region are all located within the unit circle, which indicates that the VAR model has a good fitting effect.
The Granger causality test results of logarithmic variables between tourism transportation carbon emissions and the tourism economy in the Yangtze River Delta region are shown in Table 6. The results show that the null hypothesis is rejected at the 5% confidence level, which means that the change in tourism income will have an impact on the carbon emissions of tourism transportation. The null hypothesis is rejected at the 1% confidence level, which means that the change in tourism transportation carbon emissions will also have an impact on tourism income. The above results prove that there is a significant two-way Granger causality between tourism transportation carbon emissions and the tourism economy in the Yangtze River Delta region.
(3)
EKC regression verification
By fitting the data of tourism transportation carbon emissions and tourism income in logarithmic form in the Yangtze River Delta (see Figure 9), the quadratic fitting curve shows an inverted “U” shape, indicating that there is an inverted “U” shape relationship between tourism transportation carbon emission and the tourism economy in the Yangtze River Delta region.
The specific regression results verified by the EKC are as follows: The R 2 of the linear logarithm model is 0.794, and the adjusted R2 is 0.773, indicating that the model has a high fit. The F value is 38.437, which proves that the model has significance, and the significance is <0.001, indicating that the linear logarithmic model has passed the significance test and has a good effect. The specific model is as follows:
ln C = 12.733 + 3.822 ln I 0.18 ( ln I ) 2
The extreme value point is obtained by derivation of the quadratic curve, that is, the inflection point of the Kuznets curve of the environmental carbon emissions from tourism transportation in the Yangtze River Delta is I = CNY 40,809,357 million.

3.3. Analysis of Influencing Factors of Carbon Emissions from Tourism and Transportation in the Yangtze River Delta Region, 2000–2022

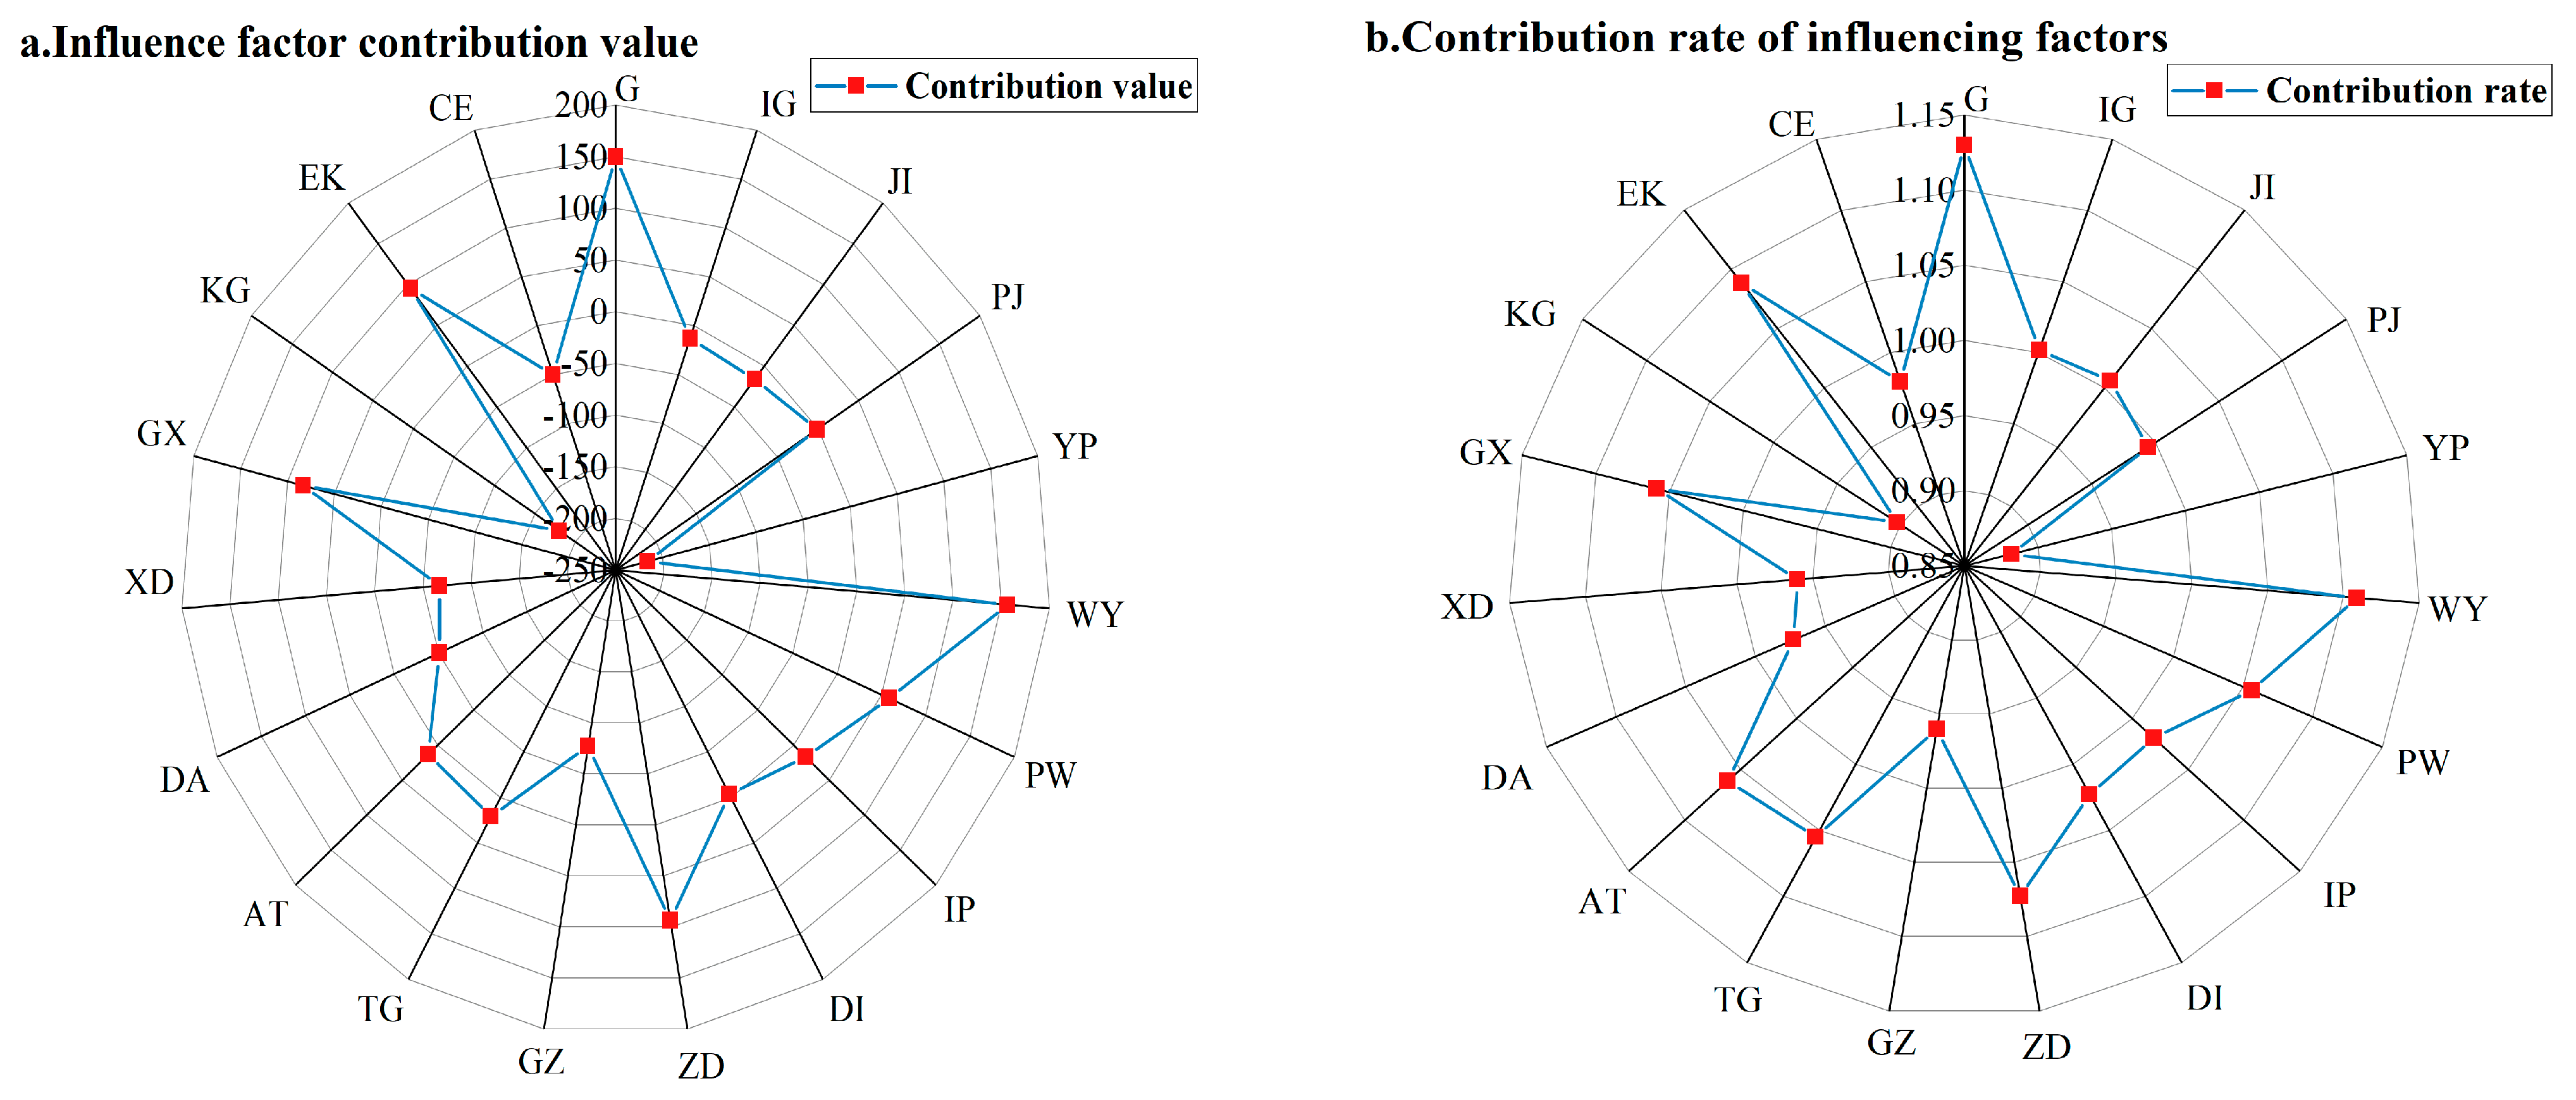
3.3.1. LMDI Decomposition and Analysis of Influencing Factors of Tourism and Transportation Carbon Emissions in the Yangtze River Delta Region

The Kaya identity and LMDI addition decomposition model were used to decompose tourism and transportation carbon emissions from 2000 to 2022, and the effects of 19 influencing factors were obtained, as shown in Figure 10.
In general, per capita tourism, the scale of tourist flow of cultural facilities, GDP, economic share of services, passenger-turnover energy ratio, efficiency of educational resource allocation, investment service-output ratio, the contribution rate of the innovation economy, and utilization rate of cultural facilities are all positive driving factors, which promote the increase of carbon emissions. The reverse driving factors include travel ratio, the scale of passenger flow in A-class scenic spots, the proportion of the tourism economy, passenger turnover economic intensity ratio, value-added tourism contribution ratio of secondary industry, energy mix, investment-output ratio, production education ratio index, and yield ratio. The first promoting factor is GDP, followed by the utilization rate of cultural facilities, and the travel ratio is the strongest inhibiting factor on the growth of carbon emissions, with the contribution value as low as −215.876.

3.3.2. Grey Correlation Analysis of Influencing Factors

Due to the large number of influencing factors, to further select the main influencing factors combined with the LMDI decomposition model, and to further explore a path suitable for the carbon emission reduction of tourism transportation in the Yangtze River Delta region, the grey correlation degree was selected as an effective means of multivariate statistical analysis to quantitatively describe the above 19 influencing factors and reveal the degree of correlation among the factors (see Table 7).
According to the results obtained by grey correlation analysis, when the correlation degree is less than 0.8, it indicates that the correlation degree is relatively low with the carbon emission of tourism transportation in the Yangtze River Delta, and the influencing factors with a correlation degree greater than 0.8 are the top 10. After careful consideration of the actual development of the Yangtze River Delta, the top 10 influencing factors are taken as the main influencing factors of the carbon emission of tourism transportation in the Yangtze River Delta. The specific analysis is as follows:
(1)
Tourist Scale: The tourist flow to cultural facilities is the strongest positive driving factor for carbon emissions, with a correlation degree of 0.925. The number of tourists in the Yangtze River Delta increased by 651.27% from 2000 to 2022. The scale of passenger flow in A-class scenic spots has a correlation degree of 0.876 and only slightly promoted carbon emissions due to the adoption of green transportation methods.
(2)
Economic Structure: The proportion of the tourism economy is the main inhibiting factor, with a correlation degree of 0.893 and a contribution value of −215.876. Tourism revenue increased by 900% from 2000 to 2022. GDP (correlation degree 0.865) and economic share of services (correlation degree 0.837) were the main contributing factors to carbon emissions.
(3)
Energy Transformation: The energy structure’s contribution value, with a correlation degree of 0.884, was −50.36. This contribution turned positive in the later period, indicating significant potential for optimizing the energy structure.
(4)
Innovation-Driven: Efficiency of educational resource allocation (correlation degree 0.881) and the contribution rate of the innovation economy (correlation degree 0.869) are positive factors, while the ratio of investment in services to output (correlation degree 0.86) serves as an inhibitory factor.
(5)
Consumption Demand: The per capita tourism consumption level has a contribution value of 17.11 and a correlation degree of 0.845. This factor weakly promoted carbon emissions, reflecting a balanced demand between consumption upgrading and low-carbon transformation.

4. Conclusions and Policy Recommendations

4.1. Conclusions

The “bottom-up” method is adopted to calculate the carbon emissions of tourism transportation in the Yangtze River Delta region from 2000 to 2022, based on the analysis of the temporal evolution characteristics of tourism transportation carbon emissions in the Yangtze River Delta region from multiple perspectives. The Tapio model, Gini coefficient, and EKC regression curve were comprehensively applied to verify the decoupling relationship between tourism transportation carbon emissions and tourism economic growth in the Yangtze River Delta region. Finally, the Kaya extended model, LMDI decomposition model, and grey correlation analysis were combined to reveal the influencing factors and effects of tourism transportation carbon emissions in the Yangtze River Delta region. The main conclusions are as follows:
(1)
Dynamic spatiotemporal evolution law: The carbon emissions of tourism transportation in the Yangtze River Delta experience three stages of “growth, fluctuation, and decline”, and spatial differentiation is significantly affected by the economic gradient and transportation infrastructure. The radiation effect of Shanghai, as the core emission pole, must be paid attention to.
(2)
Nonlinear characteristics of decoupling: Weak decoupling dominance reflects the insufficient effectiveness of current emission reduction policies, and the inflection point of the inverted U-shaped curve lags behind the pace of regional economic transformation, suggesting the need to strengthen structural regulation.
(3)
Synergy of driving factors: The expansion of economic scale is still the main reason for the growth of carbon emissions, but the integration of culture and tourism shows significant emission reduction potential through the regulation of passenger flow (such as low-carbon diversion of cultural facilities), which confirms the feasibility of the collaborative path of “consumption upgrading—technology substitution”.

4.2. Policy Suggestions

Based on the research findings emphasizing the dominant role of economic scale effects, regional differences in decoupling levels, and the potential of cultural-tourism integration, this study proposes targeted policy recommendations aimed at reducing carbon emissions from tourism transportation in the Yangtze River Delta and accelerating its green transition. The key priorities include:
(1)
Accelerating the optimization of the energy mix: Aiming to reduce emissions through the electrification of public transport and the adoption of renewable energy sources, this measure has significant immediate mitigation potential. Considering that challenges such as the high cost of investment in new energy transportation infrastructure and financial constraints in small and medium-sized cities may arise, the government can set up a special fund for green transportation in the region in the future and implement stepped subsidies for small and medium-sized cities (such as increasing subsidies by 50% for cities with carbon intensity below 20% of the average level).
(2)
Establish a cross-city carbon offsetting mechanism: establish a “carbon budget-carbon quota” mechanism to incorporate emission reduction performance into official government assessments. Build a “carbon budget-cap-and-trade” platform, incorporate the inter-provincial emission gap (for example, the carbon emission intensity ratio between Shanghai and Anhui is 3.2:1) into the government performance assessment, promote the planning of high-speed rail network and direct connection lines between scenic spots, and alleviate the pressure on core hubs.
(3)
Cultural and tourism integration low-carbon practice: Learn from Japan’s “cultural heritage + shared transportation” model, design Jiangnan Ancient Town cycling corridor and other low-carbon cultural and tourism products, create a cycling route connecting ancient towns and cultural sites, and establish a “low-carbon cultural and tourism certification” system through digital platforms to achieve cross-district points exchange (such as “one code pass” app), guide tourists’ behavior transformation.
Through prioritization and predictive analysis, this study offers a three-in-one policy framework (“Energy structure optimization—cross-city carbon compensation—cultural and tourism integration”) for reducing tourism transportation emissions in the Yangtze River Delta. Future strategies should include dynamic monitoring of the Gini coefficient and decoupling status, with regular adjustments to ensure progress towards the “dual carbon” goals.

4.3. Research Deficiencies and Prospects

Although this paper addresses some deficiencies in cross-administrative region and prefecture-level city tourism transportation research, analyzes factors affecting carbon emissions at multiple levels, and proposes corresponding emission reduction strategies, the journey of carbon emission reduction research is far from complete. When calculating the carbon emissions of tourism transportation in the Yangtze River Delta region, previous scholars’ methodologies were followed, and the passenger turnover volume was not further divided within the region, excluding the part from the region. Future studies should further subdivide the passenger turnover volume to obtain more accurate carbon emission data for tourism transportation. Additionally, this paper focuses solely on the carbon emissions of tourism transportation within the Yangtze River Delta region and does not address the carbon emissions of the entire tourism industry. Thus, future research should aim to segment the tourism industry into different regions and conduct in-depth studies on its carbon emissions.

Author Contributions

Conceptualization, D.F. and C.L.; methodology, D.F.; software, D.F.; validation, D.F., C.L. and S.D.; formal analysis, D.F.; investigation, D.F.; resources, C.L.; data curation, D.F.; writing—original draft preparation, D.F.; writing—review and editing, S.D.; visualization, D.F.; supervision, C.L.; project administration, C.L.; funding acquisition, C.L. All authors have read and agreed to the published version of the manuscript.

Funding

This research was funded by the Shanghai Municipal Foundation for Philosophy and Social Science, grant number 2024BJC002.

Institutional Review Board Statement

Not applicable.

Informed Consent Statement

Not applicable.

Data Availability Statement

Dataset available on request from the authors.

Conflicts of Interest

The authors declare no conflicts of interest.

References

  1. Yang, Y.; Wang, H.; Loeschel, A.; Zhou, P. Patterns and determinants of carbon emission flows along the Belt and Road from 2005 to 2030. Ecol. Econ. 2022, 192, 107260. [Google Scholar] [CrossRef]
  2. Zhong, Z.; Chen, Y.; Fu, M.; Li, M.; Yang, K.; Zeng, L.; Liang, J.; Ma, R.; Xie, Q. Role of CO2 geological storage in China’s pledge to carbon peak by 2030 and carbon neutrality by 2060. Energy 2023, 272, 127165. [Google Scholar]
  3. Zeng, Q.; He, L. Study on the synergistic effect of air pollution prevention and carbon emission reduction in the context of “dual carbon”: Evidence from China’s transport sector. Energy Policy 2023, 173, 113370. [Google Scholar] [CrossRef]
  4. Becken, S.; Simmons, D.G.; Frampton, C. Energy use associated with different travel choices. Tour. Manag. 2003, 24, 267–277. [Google Scholar]
  5. Wei, Y.X.; Sun, G.N.; Ma, L.J.; Li, J. Preliminary estimation of carbon emissions from tourism transportation and regional differences in China. J. Shaanxi Norm. Univ. Nat. Sci. Ed. 2012, 40, 76–84. [Google Scholar]
  6. Perch-Nielsen, S.; Sesartic, A.; Stucki, M. The greenhouse gas intensity of the tourism sector: The case of Switzerland. Environ. Sci. Policy 2010, 13, 131–140. [Google Scholar]
  7. Dķaz Pérez, F.J.; Chinarro, D.; Guardiola Mouhaffel, A.; Dķaz Martķn, R.; Pino Otķn, M.R. Comparative study of carbon footprint of energy and water in hotels of Canary Islands regarding mainland Spain. Environ. Dev. Sustain. 2018, 21, 1763–1780. [Google Scholar] [CrossRef]
  8. Hu, C.; Ding, Z.S.; Mu, X.Q.; Guo, X.Y.; Du, Z.J. Spatial and temporal evolution of carbon emissions from tourism traffic in the Yangtze River Economic Belt and the driving factors. J. Nanjing Norm. Univ. (Nat. Sci. Ed.) 2022, 45, 40–48. [Google Scholar]
  9. Liu, J.H.; Liu, Y.X.; Huang, L. Measurement of carbon emissions from tourism transport and analysis of driving factors in East China. Res. Environ. Sci. 2024, 37, 626–636. [Google Scholar] [CrossRef]
  10. Liao, H.Y.; Zhao, M.; Li, Y.X. A high spatial resolution CO2 emission inventory in Beijing. Clim. Change Res. 2022, 18, 188–195. [Google Scholar]
  11. Lundquist, S. Explaining events of strong decoupling from CO2 and NOx emissions in the OECD 1994–2016. Sci. Total Environ. 2021, 793, 148390. [Google Scholar] [CrossRef] [PubMed]
  12. Liu, J.Y.; Xie, J. Environmental regulation and export quality upgrading of manufacturing industry—A perspective based on heterogeneity of factor input structure. China’s Popul. Resour. Environ. 2018, 28, 158–167. [Google Scholar]
  13. Liu, F.; Kang, Y.; Guo, K. Is electricity consumption of Chinese counties decoupled from carbon emissions? A study based on Tapio decoupling index. Energy 2022, 251, 123879. [Google Scholar] [CrossRef]
  14. Wang, Z.; Lv, D. Analysis of Agricultural CO2 Emissions in Henan Province, China, Based on EKC and Decoupling. Sustainability 2022, 14, 1931. [Google Scholar] [CrossRef]
  15. Lu, Z.W. Quantitative relationship between environmental load of economic growth. Environ. Prot. 2007, 7, 13–18. [Google Scholar] [CrossRef]
  16. Cansino, J.M.; Sįnchez-Braza, A.; Rodrķguez-Arévalo, M.L. Driving forces of Spain’s CO2 emissions: A LMDI decomposition approach. Renew. Sustain. Energy Rev. 2015, 48, 749–759. [Google Scholar] [CrossRef]
  17. Moutinho, V.; Madaleno, M.; Inglesi-Lotz, R.; Dogan, E. Factors affecting CO2 emissions in top countries on renewable energies: A LMDI decomposition application. Renew. Sustain. Energy Rev. 2018, 90, 605–622. [Google Scholar] [CrossRef]
  18. Wang, L.G.; Zhu, H. Multi-scenario Evolution of Tourism Carbon Emissions in Jiangxi Province under the “Carbon Peak and Neutrality” Target. J. Resour. Ecol. 2023, 14, 265–275. [Google Scholar]
  19. Tiwari, P.; Gulati, M. An analysis of trends in passenger and freight transport energy consumption in India. Res. Transp. Econ. 2013, 38, 84–90. [Google Scholar] [CrossRef]
  20. Sun, Y.Y. Estimation of CO2 Emission and Its Effect Decomposition in Tourism Sector of Shanghai City. Areal Res. Dev. 2020, 39, 122–126. [Google Scholar]
  21. Li, Y.H. Relationship Among Energy Consumption, Economic Growth and Carbon Emission in China Based on PVAR Model. Coal Econ. Res. 2022, 42, 22–29. [Google Scholar]
  22. Ghazali, A.; Ali, G. Investigation of key contributors of CO2 emissions in extended STIRPAT model for newly industrialized countries: A dynamic common correlated estimator (DCCE) approach. Energy Rep. 2019, 5, 242–252. [Google Scholar]
  23. Pham, N.M.; Huynh, T.L.D.; Nasir, M.A. Environmental consequences of population, affluence and technological progress for European countries: A Malthusian view. J. Environ. Manag. 2020, 260, 110143. [Google Scholar] [CrossRef] [PubMed]
  24. Su, H.M.; Zhang, C.B.; Wang, C.X.; Han, L.P. Analysis of the impact path of green technology spillovers on the carbon emission intensity of the coal industry in Shanxi, Shaanxi and Inner Mongolia. China Coal 2024, 50, 27–38. [Google Scholar]
  25. Zhong, Z.Q.; Wu, J.; Xu, A.W.; Wei, M.; Wang, Z. Preliminary estimation of CO2 emission of tourism industry and its regional difference in China. World Reg. Stud. 2016, 25, 83–94. [Google Scholar]
  26. Wang, K.; Shao, H.Q.; Zhou, T.T.; Liu, H.L. Analysis of influencing factors of carbon emissions from tourism industry in China based on STIRPAT model. Acta Sci. Circumstantiae 2017, 37, 1185–1192. [Google Scholar]
  27. Peeters, P.; Dubois, G. Tourism travel under climate change mitigation constraints. J. Transp. Geogr. 2010, 18, 447–457. [Google Scholar]
  28. Fan, J.Q.; Zhu, Y. On Decoupling Analysis of Tourism Economy and Measurement of Carbon Emissions from Tourism Transportation: A Case Study of Five Provinces (regions) in Northwestern China. Sci. Technol. Manag. Land Resour. 2024, 41, 1–14. [Google Scholar]
  29. Liao, H.L. Study on the Influence Mechanism of Tourism Transportation Carbon Emission on Residents’ Health in Six Provinces of Central China; Hunan Normal University: Changsha, China, 2019. [Google Scholar]
  30. Cai, G.Q.; Wang, L.N.; Li, M.N.; Zhang, Q.Y.; Wang, Y.T. Study on driving mechanism of carbon emission of tourism transportation in Hainan Province. Energy Environ. 2022, 5, 10–13. [Google Scholar]
  31. Li, Y. Analysis on Carbon Emissions of Tourism Traffic and Its Influencing Factors in Anhui. J. Environ. Manag. Coll. China 2018, 28, 50–53. [Google Scholar]
  32. Ding, L.J.; Zhu, Y.L. Regional differences and decoupling effects of carbon emissions from China’s transport industry. Southeast Acad. Res. 2023, 4, 162–174. [Google Scholar] [CrossRef]
  33. Hu, H.; Zhang, J.H.; Yang, M.; Kang, J.Y.; Sun, J.K. Estimation and dynamic change of regional tourism carbon emissions: A case study of Jiangsu Province. Ecol. Econ. 2016, 32, 57–62. [Google Scholar]
  34. Jiao, G.Y.; Zheng, Y.T.; Ye, Q. Temporal and spatial distribution characteristic of energy consumption and CO2 emission by tourism industry of Jiangxi province. J. Cent. South Univ. For. Technol. 2012, 32, 105–112. [Google Scholar]
  35. Wang, J.; Xue, J.J. Estimation of carbon emissions from tourism and transportation and analysis of influencing factors. Stat. Decis. 2016, 13, 61–64. [Google Scholar] [CrossRef]
  36. Kuo, N.; Chen, P. Quantifying energy use, carbon dioxide emission, and other environmental loads from island tourism based on a life cycle assessment approach. J. Clean Prod. 2009, 17, 1324–1330. [Google Scholar] [CrossRef]
  37. Li, X.J.; Ceng, B.W.; Zhang, H.; Song, Z.Q.; Yang, Y.; Ma, B.; Sun, J.X.; Ye, C.; Zhu, H.; Zhang, S.M.; et al. New Quality Productive Forces and High-quality Development in Tourism: Problems, Cognition and Optimization Direction. Tour. Trib. 2024, 39, 15–29. [Google Scholar]
  38. Guo, W.Q.; Yu, Z.P.; Lei, M.; Zhang, W.P.; Gao, Y.Q. Decomposition of Carbon Emission Drivers and Decoupling Effort Effects in China. Res. Environ. Sci. 2025, 38, 209–219. [Google Scholar]
  39. Yin, X.H.; Li, X. Re-study on Calculation and Decomposition Methods of Gini Coefficient. Stat. Decis. 2025, 41, 47–51. [Google Scholar]
  40. Li, Q.G.; Nie, P.; Xu, B.Y.; Peng, X. Inequality of Opportunity in Income and the Mental Health of Chinese Residents. Popul. Dev. 2025, 31, 70–79. [Google Scholar]
  41. Guo, X.Y.; Mu, X.Q.; Ming, Q.Z.; Ding, Z.S. Analysis of carbon emission pattern and influencing factors of tourism transportation in China. Geogr. Geo-Inf. Sci. 2022, 38, 129–136. [Google Scholar]
  42. Ma, H.Q.; Liu, J.L.; Gong, Z.G. Carbon Emission and Evolution Mechanism of Tourism Transportation in Shanxi Province. Econ. Geogr. 2019, 39, 223–231. [Google Scholar]
  43. Huang, H.P.; Qiao, X.Z.; Zhang, J.; Li, Y.L.; Ceng, Y.M. Spatio-Temporal Differentiation and Influencing Factors of Regional Tourism Carbon Emissions under the Background of Green Development: A Case Study of the Yangtze River Economic Belt. Econ. Geogr. 2019, 39, 214–224. [Google Scholar]
  44. Wang, Z.F.; Shi, W.J.; Su, C.G. Spatial Pattern of Health Tourism Destination in China and Its Influence Factors. Econ. Geogr. 2020, 40, 196–207. [Google Scholar]
  45. Hu, F.; Li, Y.B. Research on the Low-Carbon Transition Mode of Tourism Industry in Ethnic Areas Based on the System Dynamics Model. Ecol. Econ. 2024, 40, 135–142. [Google Scholar]
  46. Pan, Q.L.; Song, Y.Q.; Chen, L.; Pan, Z.K. Spatial pattern and influencing factors of county tourism efficiency in Shaanxi Province. J. Nat. Resour. 2021, 36, 866–878. [Google Scholar] [CrossRef]
  47. Fu, X.Y.; Huang, T.Z. Grey correlation analysis of influencing factors of tourism economy in Inner Mongolia. Stat. Decis. 2015, 3, 142–145. [Google Scholar] [CrossRef]
  48. Wang, Q.L.; Jin, X.L. Analysis of the Spatial Structure Evolution and its Influence Factors of A-grade Tourist Scenic Area in Anhui Province. J. Zhongzhou Univ. 2017, 34, 39–44. [Google Scholar]
  49. Li, Y.J.; Song, J.L.; Wang, J.N.; Xiong, N. County carbon peak type classification and influencing factors in Beijing-Tianjin-Hebei based on decoupling model and spatial Dubin model. Environ. Pollut. Control 2024, 46, 1346–1351. [Google Scholar]
  50. Shi, P.F.; Cao, Y.H.; Long, H.B.; Tian, Z.Y.; Li, X.M.; Geng, B. Level Measurement, Spatial Variation and Obstacle Factor Diagnosis of Tourism High-quality Development in China. Econ. Geogr. 2023, 43, 201–210. [Google Scholar]
  51. Huang, W.X.; Gao, C.Z.; Wu, B.; Chen, T.; Yang, T.; Zhang, B. Development Path of Guangxi to Reach the Carbon Emission Peak Based on STIRPAT Model. Environ. Sci. 2025, 46, 682–695. [Google Scholar]
  52. Wang, X.Y.; Meng, F.Q.; Zhu, W.L. Spatial Differentiation and Influencing Factors of Tourism Economy in China’s Popular Tourist Cities: Based on Geographic Detector. Areal Res. Dev. 2020, 39, 76–81. [Google Scholar]
  53. Wang, J.; Yang, J. Regional CO2 emissions and economic development: An empirical analysis based on decoupling theory and CKC. J. Shanxi Financ. Econ. Univ. 2013, 35, 8–18. [Google Scholar] [CrossRef]
  54. Ye, Q.H.; Chu, H.J.; Zhang, H.Y.; Zhang, M. Research on the Pressure Index Measurement of China’s Coal Reduction Under the “Double Carbon” Target. J. Ind. Technol. Econ. 2023, 42, 43–53. [Google Scholar]
  55. Ding, G.L.; Liu, Y.X.; Wang, X.G. Synergetic development mechanism among major ports in the Yangtze River Delta. Urban Dev. Stud. 2016, 23, 64–71. [Google Scholar]
Figure 1. Multi-scale technical framework for tourism transportation carbon emission analysis.
Sustainability 17 03056 g001
Figure 2. Decoupling state criteria.
Sustainability 17 03056 g002
Figure 3. Variation trend of per capita carbon emissions from tourism and transportation and estimation of nuclear density in the Yangtze River Delta region ((a) A box map illustrating per capita carbon emissions from tourism and transportation in the Yangtze River Delta; (b) Estimation curve of per capita carbon emission nuclear density in the Yangtze River Delta region).
Sustainability 17 03056 g003
Figure 4. Temporal evolution characteristics of tourism transportation carbon emissions by provinces and cities in the Yangtze River Delta region.
Sustainability 17 03056 g004
Figure 5. Spatial evolution characteristics of carbon emissions from tourism and transportation (2000, 2005, 2010, 2015, 2020, 2022).
Sustainability 17 03056 g005
Figure 6. Scatter diagram of the Yangtze River Delta ((a) Scatter chart at provincial and municipal level; (b) Scatter map of prefecture-level city level).
Sustainability 17 03056 g006
Figure 7. Decoupling effects, 20002022.
Sustainability 17 03056 g007
Figure 8. Inter-city differences in decoupling types.
Sustainability 17 03056 g008
Figure 9. Logarithmic fitting curve of tourism transportation carbon emissions and the tourism economy.
Sustainability 17 03056 g009
Figure 10. Contribution value and contribution rate of tourism transportation carbon emissions influencing factors.
Sustainability 17 03056 g010
Table 1. Research results of domestic and foreign scholars on carbon emission coefficients.
Research ResultsRailwayHighwayCivil AviationWaterway
Global dimensionUNWTO-UNEP-WMO [6]2713313766
Country levelChina [26]27133137106
Europe [27]2713313766
Regional levelYangtze River economic belt [8]27133137106
Five northwestern provinces [28]27133137-
Six central provinces [29]27133137106
Provincial and municipal levelShanghai [20]27133137106
Hainan [30]27133137106
Anhui [31]2713313766
Shandong [32]6513239666
Jiangsu [33]27133137106
Jiangxi [34]6513239666
Henan [35]2713313766
Table 2. The proportion of tourists among passengers of the four modes of transport.
Period α i
RailwayHighwayCivil AviationWaterway
2000–200831.613.864.710.6
2009–201436.916.760.47.1
2015–201938.717.559.15.8
2020–202243.921.350.65.2
Table 3. Related results of indicators obtained by advanced search.
IndexNumber of ArticlesExamplesSymbols
GDP240[41,42]G
Tourism revenue157[43]I
Ridership104[44]Y
Number of visitors75[26,45]P
Number of A-level tourist attractions57[46]Q
The volume of passenger turnover55[41]K
Value added of tertiary industry52[47]T
Value added of the secondary industry39[48]D
Investment in fixed assets completed20[49]A
Number of cultural facilities34[50]W
Number of patents granted11[51]Z
Transportation energy consumption36[42]E
Number of college students per 10,000 people9[52]X
(Note: The sum of the number of libraries, cultural centers, and museums represents the number of cultural facilities).
Table 4. Influencing factor system of tourism transportation carbon emissions.
Bedding PlaneIndicatorSymbolVariation
Visitor sizePer capita tourism
consumption level
IP Δ I P = n ( C n , t C n , 0 ) / ( ln C n , t ln C n , 0 ) ln ( I P n , t / I P n , 0 )
Travel ratioYP Δ Y P = n ( C n , t C n , 0 ) / ( ln C n , t ln C n , 0 ) ln ( Y P n , t / Y P n , 0 )
The scale of passenger flow in A-class scenic spotsPJ Δ P J = n ( C n , t C n , 0 ) / ( ln C n , t ln C n , 0 ) ln ( P J n , t / P J n , 0 )
The scale of tourist flow of
cultural facilities
PW Δ P W = n ( C n , t C n , 0 ) / ( ln C n , t ln C n , 0 ) ln ( P W n , t / P W n , 0 )
Level of economic developmentGross Domestic ProductG Δ G = n ( C n , t C n , 0 ) / ( ln C n , t ln C n , 0 ) ln ( G n , t / G n , 0 )
Proportion of tourism
economy
IG Δ I G = n ( C n , t C n , 0 ) / ( ln C n , t ln C n , 0 ) ln ( I G n , t / I G n , 0 )
Economic share of servicesTG Δ T G = n ( C n , t C n , 0 ) / ( ln C n , t ln C n , 0 ) ln ( T G n , t / T G n , 0 )
Passenger turnover
economic intensity ratio
KG Δ K G = n ( C n , t C n , 0 ) / ( ln C n , t ln C n , 0 ) ln ( K G n , t / K G n , 0 )
Value-added tourism
contribution ratio of
secondary industry
DI Δ D I = n ( C n , t C n , 0 ) / ( ln C n , t ln C n , 0 ) ln ( D I n , t / D I n , 0 )
Energy intensityPassenger-turnover
energy ratio
EK Δ E K = n ( C n , t C n , 0 ) / ( ln C n , t ln C n , 0 ) ln ( E K n , t / E K n , 0 )
Energy mixCE Δ C E = n ( C n , t C n , 0 ) / ( ln C n , t ln C n , 0 ) ln ( C E n , t / C E n , 0 )
New quality productivityEfficiency of educational
resource allocation
GX Δ G X = n ( C n , t C n , 0 ) / ( ln C n , t ln C n , 0 ) ln ( G X n , t / G X n , 0 )
Production education
ratio index
XD Δ X D = n ( C n , t C n , 0 ) / ( ln C n , t ln C n , 0 ) ln ( X D n , t / X D n , 0 )
Investment-output ratioGZ Δ G Z = n ( C n , t C n , 0 ) / ( ln C n , t ln C n , 0 ) ln ( G Z n , t / G Z n , 0 )
The contribution rate of the
Innovation economy
ZD Δ Z D = n ( C n , t C n , 0 ) / ( ln C n , t ln C n , 0 ) ln ( Z D n , t / Z D n , 0 )
Value-added ratio of
production and investment
DA Δ D A = n ( C n , t C n , 0 ) / ( ln C n , t ln C n , 0 ) ln ( D A n , t / D A n , 0 )
Investment service-output ratioAT Δ A T = n ( C n , t C n , 0 ) / ( ln C n , t ln C n , 0 ) ln ( A T n , t / A T n , 0 )
InfrastructureUtilization rate of
cultural facilities
WY Δ W Y = n ( C n , t C n , 0 ) / ( ln C n , t ln C n , 0 ) ln ( W Y n , t / W Y n , 0 )
Yield ratioJI Δ J I = n ( C n , t C n , 0 ) / ( ln C n , t ln C n , 0 ) ln ( J I n , t / J I n , 0 )
(Note: Variation is listed in the table as the contribution calculation formula for each factor).
Table 5. Unit root test of the test series and the difference series.
Test SequenceUnit Root TestCointegration Test
tp-ValueConclusionp-ValueStatisticsResult
Original time
-series data
ln C −1.8880.3377Uneven_
ln I −2.1150.2385Uneven
( ln I ) 2 −1.8770.343Uneven
( ln I ) 3 −1.6840.4395Uneven
First difference sequence
number
Δ ln C −3.3310.0136Smooth0.0104−3.416Smooth (5%)
Δ ln I −3.0720.0287Smooth
Δ ( ln I ) 2 −3.0630.0294Smooth
Δ ( ln I ) 3 −3.0450.0309Smooth
Table 6. Granger causality test results based on the VAR model.
Optimal Lag Order ln I   Is   Not   the   Granger   Cause   of   ln C ln C   Is   Not   the   Granger   Cause   of   ln I
Chi-Square Statisticsp-ValueResultsChi-Square Statisticsp-ValueResults
14.42270.035Reject null
hypothesis
7.29520.007Reject null
hypothesis
Table 7. Grey correlation analysis results of tourism and transportation carbon emissions in the Yangtze River Delta region.
Evaluation ItemsSymbolsRelevancyRanking
The scale of tourist flow of cultural facilitiesPW0.9251
Proportion of tourism economyIG0.8932
Energy mixCE0.8843
Efficiency of educational resource allocationGX0.8814
The scale of passenger flow in A-class scenic spotsPJ0.8765
The contribution rate of the innovation economyZD0.8696
Gross Domestic ProductG0.8657
Investment service-output ratioAT0.868
Per capita tourism consumption levelIP0.8459
Economic share of servicesTG0.83710
Passenger-turnover energy ratioEK0.79711
Value-added ratio of production and investmentDA0.78612
Yield ratioJI0.78313
Value-added tourism contribution ratio of secondary industryDI0.77814
Utilization rate of cultural facilitiesWY0.77115
Production education ratio indexXD0.75116
Passenger turnover economic intensity ratioKG0.73417
Investment-output ratioGZ0.7318
Travel ratioYP0.68919
Disclaimer/Publisher’s Note: The statements, opinions and data contained in all publications are solely those of the individual author(s) and contributor(s) and not of MDPI and/or the editor(s). MDPI and/or the editor(s) disclaim responsibility for any injury to people or property resulting from any ideas, methods, instructions or products referred to in the content.

