Article

Carbon Assessment of Greek Organic Red Wine with Life Cycle Assessment and Planetary Boundaries

by
Georgios Archimidis Tsalidis
1,2,3,*,
Zoi-Panagiota Kryona
1,
Kiriaki Hatzisavva
4,
Gijsbert Korevaar
5 and
Spyridon Rapsomanikis
1
1
Environmental and Networking Technologies and Applications Unit, Athena—Research and Innovation Center in Information, Communication and Knowledge Technologies, 67100 Xanthi, Greece
2
Department of Civil and Environmental Engineering, Imperial College London, London SW7 2BU, UK
3
Department of Environmental Engineering, Democritus University of Thrace, 67100 Xanthi, Greece
4
Hatzisavva Vineyards and Winery, 68100 Alexandroupolis, Greece
5
Engineering Systems and Services Department, Delft University of Technology, 2628 BL Delft, The Netherlands
*
Author to whom correspondence should be addressed.
Sustainability 2025, 17(7), 3006; https://doi.org/10.3390/su17073006
Submission received: 22 January 2025 / Revised: 26 February 2025 / Accepted: 4 March 2025 / Published: 28 March 2025
(This article belongs to the Special Issue Sustainable Food Engineering and Safety Innovations)

Abstract

:
Life cycle assessment (LCA) is a reference methodology to evaluate environmental impacts along supply chains of products. Planetary boundaries (PBs) were developed to define the safe operating space (SOS) for humanity. So far, no study has investigated whether wine production and consumption result in crossing the planetary boundary of climate change and no SOS has been calculated for wine production in Greece. Our study applies an LCA according to the European Product footprint environmental category rules to calculate the climate change score of a bottle of 0.75 L of Greek red organic wine in 2021 and 2026, and also applies planetary boundaries to investigate whether the climate change boundary is exceeded. The latter employed the calculation of a SOS based on four partitioning methods: grandfathering principle, economic value, agricultural land area use, and calorific content. The LCA results showed that wine is a carbon emitter. The 2021, 2026-Low yield, and 2026-High yield systems resulted in positive climate change scores between 0.69–1.14 kg CO2 eq.bottle wine−1. The PBs revealed that carbon emissions of wine production in 2021 exceeded all four SOSs, while carbon emissions of expected wine production in 2026 remained within the SOS of grandfathering, economic value and agricultural land area use partitionings, but exceeded the SOS of the caloric content partitioning. The PB method can be complementary to LCA results in terms of providing context to decision-makers in business and public policy on whether red organic wine production and consumption remain within ecological constraints on human development.

1. Introduction

Life cycle assessment (LCA) [1,2] and the planetary boundary (PB) concept [3,4] assess comparative and absolute environmental sustainability, respectively. The Paris Agreement [5] aims to maintain the global temperature increase to below 2 °C above preindustrial levels. Therefore, it is important to investigate whether organic red wine production and consumption in Greece provides climate change benefits or results in exceeding this temperature increase limit.
The Paris Agreement aims to strengthen the global effort concerning the transition to a low carbon economy [5]. Therefore, countries must decrease their national greenhouse gas (GHG) emissions. Greece’s GHG emissions decreased significantly over the past decade [6], mainly due to the economic recession and a shift towards cleaner energy.
The global agriculture sector emitted 17 Gt CO2 eq. in 2019 [7]. In 2019, Greece’s agricultural emissions accounted for approx. 7875 kt CO2 eq. [8]. Furthermore, agriculture is one of the sectors that is expected to be most severely affected by climate change [9]. For this purpose, in 2020, the European Commission published the Farm-to-Fork strategy [10] for a fair, healthy, and environmentally friendly food system. Moreover, the European Commission published the product environmental footprint category rules (PEFCR) for still and sparkling wine [11] to harmonize measuring and communicating environmental performance to consumers.
LCA is a reference methodology to assess the environmental performance of products because it assesses environmental impacts and is standardized by ISO [1,2]. LCA is a comparative tool, i.e., the analyzed product is compared with a reference product. The most assessed environmental impacts are global warming [12] and climate change. However, the climate change assessment with LCA does not provide information regarding the contribution of the analyzed product to the Paris Agreement’s central aim. LCA results show which of the analyzed products performs better with respect to climate change.
In 2009, Rockström et al. [3,4] developed the PB concept to investigate how human society currently operates concerning nine critical earth system boundaries. These are boundaries in which human activity should occur without inducing a negative environmental change. As a result, the PB concept aims to identify a safe operating space (SOS) within each of the nine boundaries at which human society should operate and develop [13]. Climate change regards a PB in which a global SOS can be based on the central aim of the Paris Agreement.
Two recent studies [14,15] developed characterization factors based on the carrying capacity of PBs, and one study developed a downscaling approach for the climate change boundary [16]. Bjørn et al. (2016) [14] developed a generic framework to employ carrying capacity as an environmental sustainability reference in spatially resolved life cycle impact assessment models. Ryberg et al. (2018) [15] developed a PB-LCIA method with characterization factors for impact categories in LCIA that are compatible with the control variables used by the PB framework. Chandrakumar et al. [16] downscaled the climate change boundary to a SOS based on economic levels for the entire agri-food sector in New Zealand. However, there are limited studies [17,18] on tomato and sugarcane production that investigate the absolute sustainability of agricultural products.

LCA Studies for Wine in the Mediterranean Region

Local climatic conditions greatly affect agriculture yield and taste [19] and, consequently, the climate change score of produced wine. Climatic conditions and farming practices are crucial for the materials and energy used in the viticulture stage, as well as agricultural yield. There are five studies that calculated the climate change score of organic red wine production in the Mediterranean region. Among them, only the study by Harb et al. (2021) [20] applied the “Product footprint environmental category rules”, PEFCR, for wine. Three LCA studies regarded Italian wines, one study regarded Spanish wine, and one study regarded Lebanese wine. The average climate change score is 1.05 kg CO2 eq. bottle wine−1. The bottle making and packaging stage is the largest contributor to climate change. However, even though these LCA studies regarded organic farming practices, the consumption of diesel (for machinery), organic fertilizers, and insecticides resulted in a varying contribution from the viticulture stage to the climate change score. Furthermore, these studies show that the distribution stage may contribute depending on the distance between the winery and the retail market. Table 1 presents the key aspects of the reviewed LCA studies of organic red wine.
The aim of this study is to apply a LCA to calculate the climate change score of a 0.75 L bottle of Greek organic red wine and the PB method to investigate if the climate change boundary is exceeded due to wine production and the consumption of a 0.75 L bottle of Greek organic red wine. To our knowledge, this is the first study to downscale the SOS of the climate change boundary for Greek wine [16] to investigate whether the SOS is exceeded. The results of our study show how Greek red organic wine performs compared to organic red wines produced in a Mediterranean climate and provide context to decision-makers in business and public policy regarding whether red organic wine production and consumption remain within the ecological constraints on human development.

2. Material and Methods

2.1. Case Study

The case study regarded an organic red natural wine produced in Alexandroupolis, Greece. Hatzisavva Vineyards and Winery, Alexandroupolis, Greece, operate the viticulture and the winemaking stages. The vineyard surface was approx. 7 ha, located in a hilly landscape and characterized by moderate weather, which is beneficial for wine production with dry farming and without intense treatments. The vineyard produced grapes for organic red, white, and rose wines. The viticulture is young, i.e., it does not produce, yet its expected to have an annual yield. It is still within the vine-planting phase, which lasts for approx. three years, after which the vineyard’s productivity peaks and lasts for 30–40 years [26]. In 2021, viticulture produced 12,000 kg of grapes in total. The grapes had 12.5 degrees Baume, and their pH was 2.9–3.2. This means that, by 2026, viticulture will continue consuming the same amount of consumables per surface, but its annual yield is expected to increase between 250% (i.e., 30,000 kg of grapes) and 333% (i.e., 40,000 kg of grapes) [27].

2.2. Life Cycle Assessment

This section presents the “Goal and scope definition” and “Life cycle inventory” phases. The SimaPro software Version 7.2 [28] was used for LCA modeling, and the Ecoinvent database version 3.4 [29] was used for secondary data collection because it is the suggested source of secondary data by PEFCR [11]. Data quality of life cycle inventory data were assessed according to the PEFCR [11].

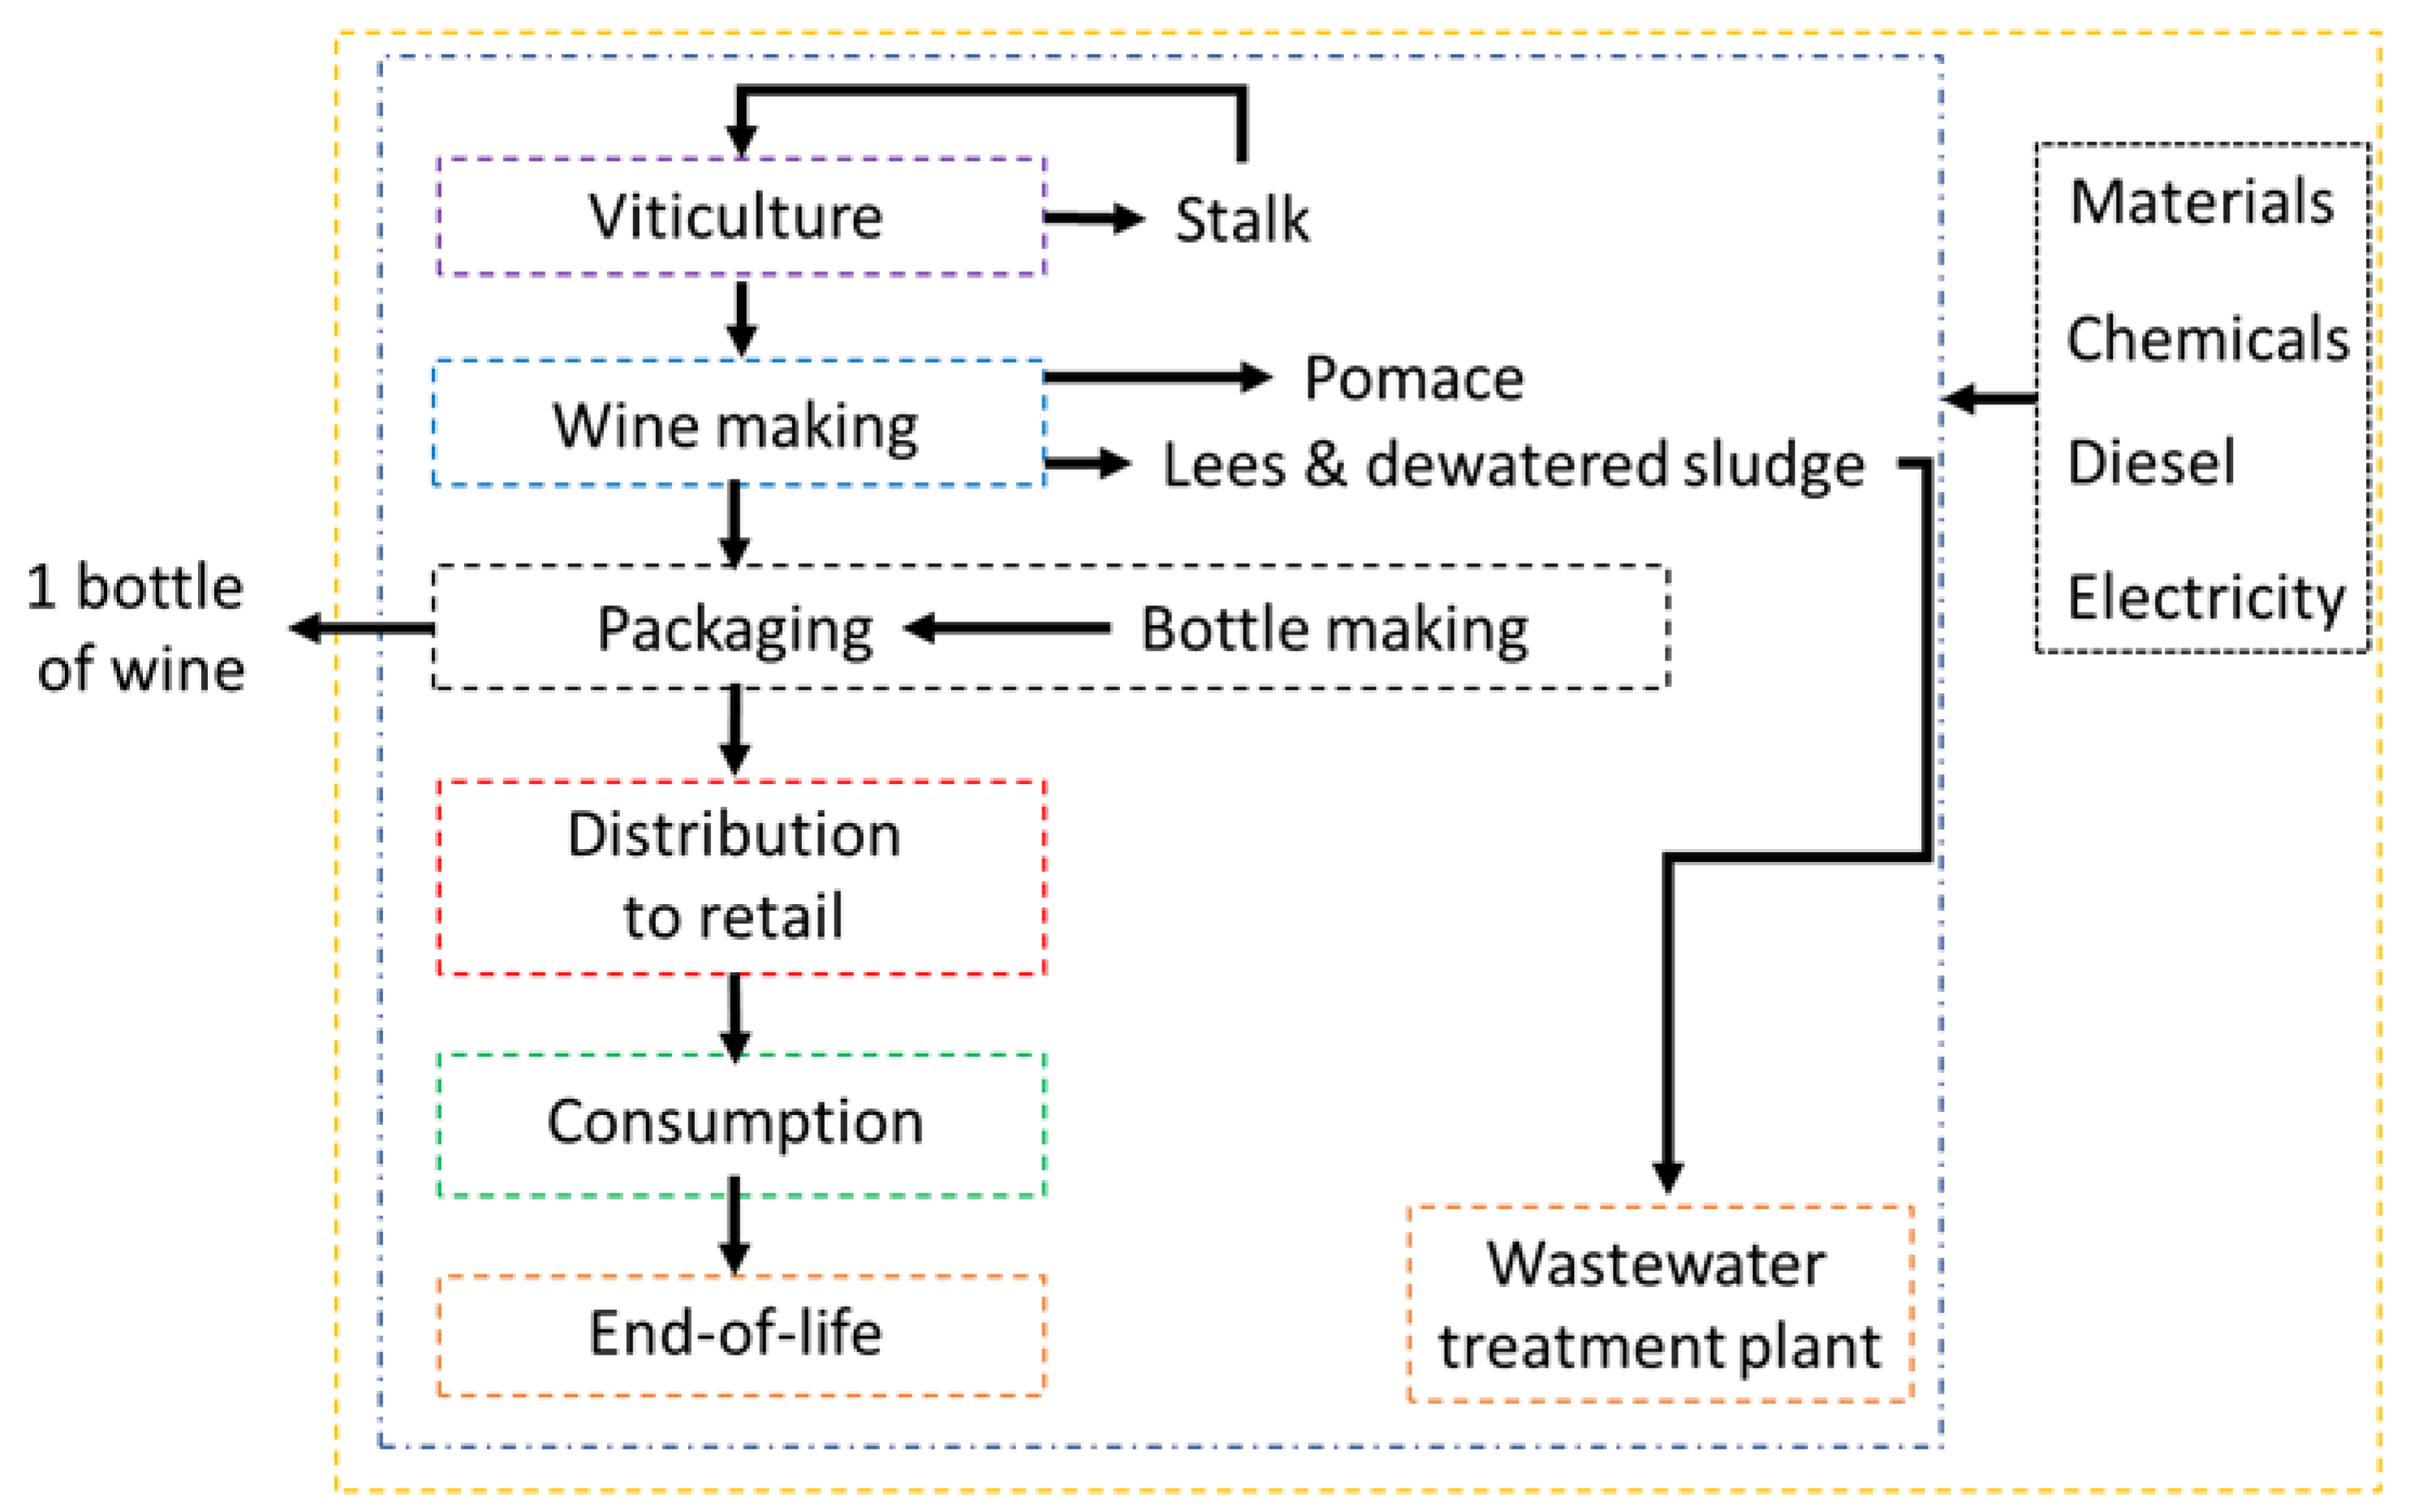
2.2.1. Goal and Scope Definition

The goal of this study was to produce organic red wine. For this purpose, the European PEFCR [11] for still wine was followed because it harmonizes the environmental assessment of wine in terms of methodological choices. The system boundaries were cradle-to-grave, mass allocation was applied to two multifunctional stages, and the functional unit was one bottle of 0.75 L wine.
The system boundaries (illustrated in Figure 1) were designed according to the PEFCR [11]. They covered the viticulture, wine making, wine packaging (including bottle making), distribution to retail, consumption, and end-of-life (EOL) stages. Activities that were not mentioned by the PEFCR, such as the impact of employees who commute due to viticulture and consumer commute to retail market to purchase wine, were not considered because their impact was assumed to be negligible. Furthermore, vine nursing was excluded due to lack of data. Inputs and outputs of the life cycle stages are presented in the inventory subsection. Hatzisavva Vineyards and Winery produces grapes for organic red, white, and rosé wines, and it was not possible to separate material and energy flows per wine type. Thus, mass allocation was applied to calculate the materials and energy used for red wine production. Furthermore, the winemaking stage produces organic red wine and pomace. Thus, mass allocation was applied to calculate the materials and energy used for red wine. In both cases, mass allocation was selected according to the PEFCR [11] and ISO [1,2]. The mass allocation factors can be found in Table A1 of Appendix A.

2.2.2. Life Cycle Inventory

Viticulture

This stage used consumables, which are the primary data collected from Hatzisavva Vineyards and Winery. Zeolite was applied for its porous structure and high adsorption capacity, which makes it effective in maintaining water and minimizing irrigation needs. Diesel was consumed by agricultural machinery. The stalk (60 kg/ha) was considered a waste at this stage and was composted to be internally reused as organic fertilizer. Data for composting biowaste was collected from the Ecoinvent database, as suggested by the PEFCR [11].

Winemaking

Harvested grapes were transported to the winery, which was adjacent to the vineyard. The winemaking stage comprised mainly primary data collected from Hatzisavva Vineyards and Winery. The use of chemicals during winemaking is avoided as much as possible. Metabisulphite and bentonite were consumed in small quantities at the end of fermentation and before bottling. The winery consumed electricity generated from photovoltaics on its roof and a diesel generator. Electricity consumption was not monitored; therefore, a recommended proxy based on the European PEFCR [11] was assumed. Winemaking produced red wine, pomace, and waste. The pomace was distilled to produce alcoholic drinks, such as grapa, or treated to produce soaps, and it was not considered. Lees and dewatered sludge were considered to be waste.

Packaging

Input materials for the packaging stage were composed of secondary data. Not all materials are measured at the winery. Therefore, the literature was used in combination with personal communication with Hatzisavva Vineyards and Winery [27] to approximate the quantities of materials used. Glass bottles were manufactured elsewhere and transported to the winery for packaging. For this purpose, the Ecoinvent database [29] was used for glass bottle production. Additional materials consumed here were corks, cardboard, and pallets.

Distribution to Retail

The distribution stage referred to the transportation of the produced wine to local retail outlets and was based on personal communication with Hatzisavva Vineyards and Winery [27]. The transportation distance was 50 km because the vineyard is located close to the city of Alexandroupolis, where the produced wine is sold.

Consumption

The consumption stage was based on the European PEFCR [11]. Thus, the purchased wine was refrigerated for two days, and 5% of the wine was not consumed, but disposed of in the drain.

End-of-Life

The EoL stage referred to the disposal of all materials employed (including wine) to landfill or recycling facilities. This stage consisted of national-level data on recycling rates in Greece and secondary data on waste treatment processes. Based on average national data [30], 37% of glass is recycled in Greece, while wood barrels are re-used by the producer. Table 2 shows all inputs and outputs per life cycle stage, normalized per bottle of organic red wine.

Assumptions

This study assumed the following:
  • Viticulture production reaches a steady state with respect to agricultural yield after five years. The vineyard yield was estimated according to the personal experience of the wine producer.
  • Wine transportation occurs on a regional level upon consultation with the wine producer; therefore, an average transportation distance of 50 km was selected.
  • Disposal of packaging materials was calculated according to what occurs in Greece [30].

Data Quality Requirements (DQR)

The PEFCR document suggests calculating and reporting the data quality of each dataset using a semiquantitative assessment based on four factors: Technological representativeness, Geographical representativeness, Time-related representativeness, and Precision. DQR was calculated using Equation (1) below:
D Q R = T e R + G R + T i R + P 4
where TeR is the Technological-Representativeness, GR is the Geographical-Representativeness, TiR is the Time-Representativeness, and P depicts Precision. These types of representativeness (technological, geographical, and time-related) characterize the degree to which processes and considered products depict the system studied. The precision indicates how data are derived and the level of uncertainty [11]. Last, the data needs matrix per life cycle stage is described in Table 3.

2.2.3. Life Cycle Impact Assessment

The considered environmental impact was climate change. The climate change score was calculated using the ReCiPe 2016 midpoint (E) method [31].

2.2.4. Perturbation Analysis

A perturbation analysis was conducted on the LCA results to investigate the effect of parameter uncertainties on climate change results. The perturbation analysis method [32] was followed, which recommends calculating sensitivity ratios (SR) to model parameter variations of +10%. If a parameter has an SR of 3, it implies that an increase of 10% of its value will result in an increase in the final result by 30%. SRs were calculated for the selected parameters using the equation below:
S R = r e s u l t i n i t i a l   r e s u l t p a r a m e t e r i n i t i a l   p a r a m e t e r
where the initial parameter and initial result are the parameter values from the base case, Δparameter is the change in parameter value, and Δresult is the change in the LCIA result when the parameter variation is applied.

2.3. Planetary Boundaries

Benchmarking the climate impact of a wine bottle requires the definition of a share of the carbon budget associated with a PB for climate change [33]. This study estimated a constant global annual carbon budget of 6.8 Gt CO2 eq. according to the target of 2 °C [34], of which 12% are derived from global agriculture [35]. Furthermore, the carbon balance during the entire life cycle of a bottle of organic red wine was based on the LCA stages described in the inventory subsection.

2.3.1. Downscaling Methods

Once the global annual carbon budget was selected, it was downscaled to the level of a wine bottle with grandfathering [36], economic [37], agri-land [33], and calorific content [16] partitioning methods. The agri-land and caloric content methods are relevant only to agri-food systems. In addition, biogenic CO2 is only considered in climate change boundary calculations. The carbon uptake (0.28 kg CO2.bottle of wine−1) by the vines was considered in the viticulture stage, and the same amount of CO2 (0.28 kg CO2.bottle of wine−1) was emitted in the wine consumption stage because wine is exhaled in the form of CO2 from the human body when it moves through the digestive system and other organs [38]. The atmospheric sequestration of CO2 by vines was calculated based on the carbon content of the fruit according to [39]. Last, biogenic CO2 emissions (0.12 kg CO2.bottle of wine−1) due to fermentation were considered in the winemaking stage, and they were calculated based on the stoichiometry for a wine with a 9% alcohol content (see Appendix A).
The grandfathering method was based on the grandfathering concept. This required that the studied system occupied a constant relative share of total GHG emissions according to the reference year [14]. This was approx. 0.12% of the annual carbon budget of global agriculture in 2019 [35], and the Greek wine industry contributed approx. 0.04% to the carbon balance of Greek agriculture [40]. It should be noted that it was impossible to assess the CO2 eq. emissions of the Greek wine sector in 2019; thus, the Australian wine sector was used to calculate the emission factor per liter of wine and multiply it by the total Greek wine production in liters. Second, the economic method stemmed from the notion that economic value can be considered a proxy for the creation of social value [37]. Therefore, only the economic value of the agricultural sector was considered to assign the share of the budget to the studied system based on the emitters’ contribution to gross domestic product [14]. The Greek GDP was 205.1 billion USD or 0.23% [41] of the global GDP in 2019, and agriculture contributed approx. 3.8% to the GDP of Greece [42], and the Greek wine industry contributed approx. 24.4% to the revenues of Greek agriculture [43]. Third, the agri-land method estimated the share of the budget according to the territorial share of agricultural land of the emitter [33]. The global agriculture land is approx. 96 million km2 [44], while Greek agriculture land is approx. 0.129 million km2 [45], and viticulture uses approx. 1060 km2 [46]. Last, the calorific content of agricultural products was used as a method to partition the PB for climate change [16]. This approach uses calories as a proxy to show that the main purpose of agricultural food production is to feed people [47]. Even though wine is not food, it still contains calories which are measured by people who are thorough with their diets. Globally 22,484 billion kcal [48] were produced, of which 36 billion kcal were produced in Greece [48], and the wine industry produced approx. 0.2 million kcal [49]. Table 4 shows the SOS per downscaling method.

2.3.2. Sensitivity Analysis

A local sensitivity analysis is performed on the number of wine bottles that were produced. The number of bottles is crucial to calculate the SOS per wine bottle. In 2019, 320,000 wine bottles were produced in Greece. The uncertainty analysis shows how much the SOS will be affected by increasing and decreasing the production of wine bottles by 10%.

3. Results and Discussion

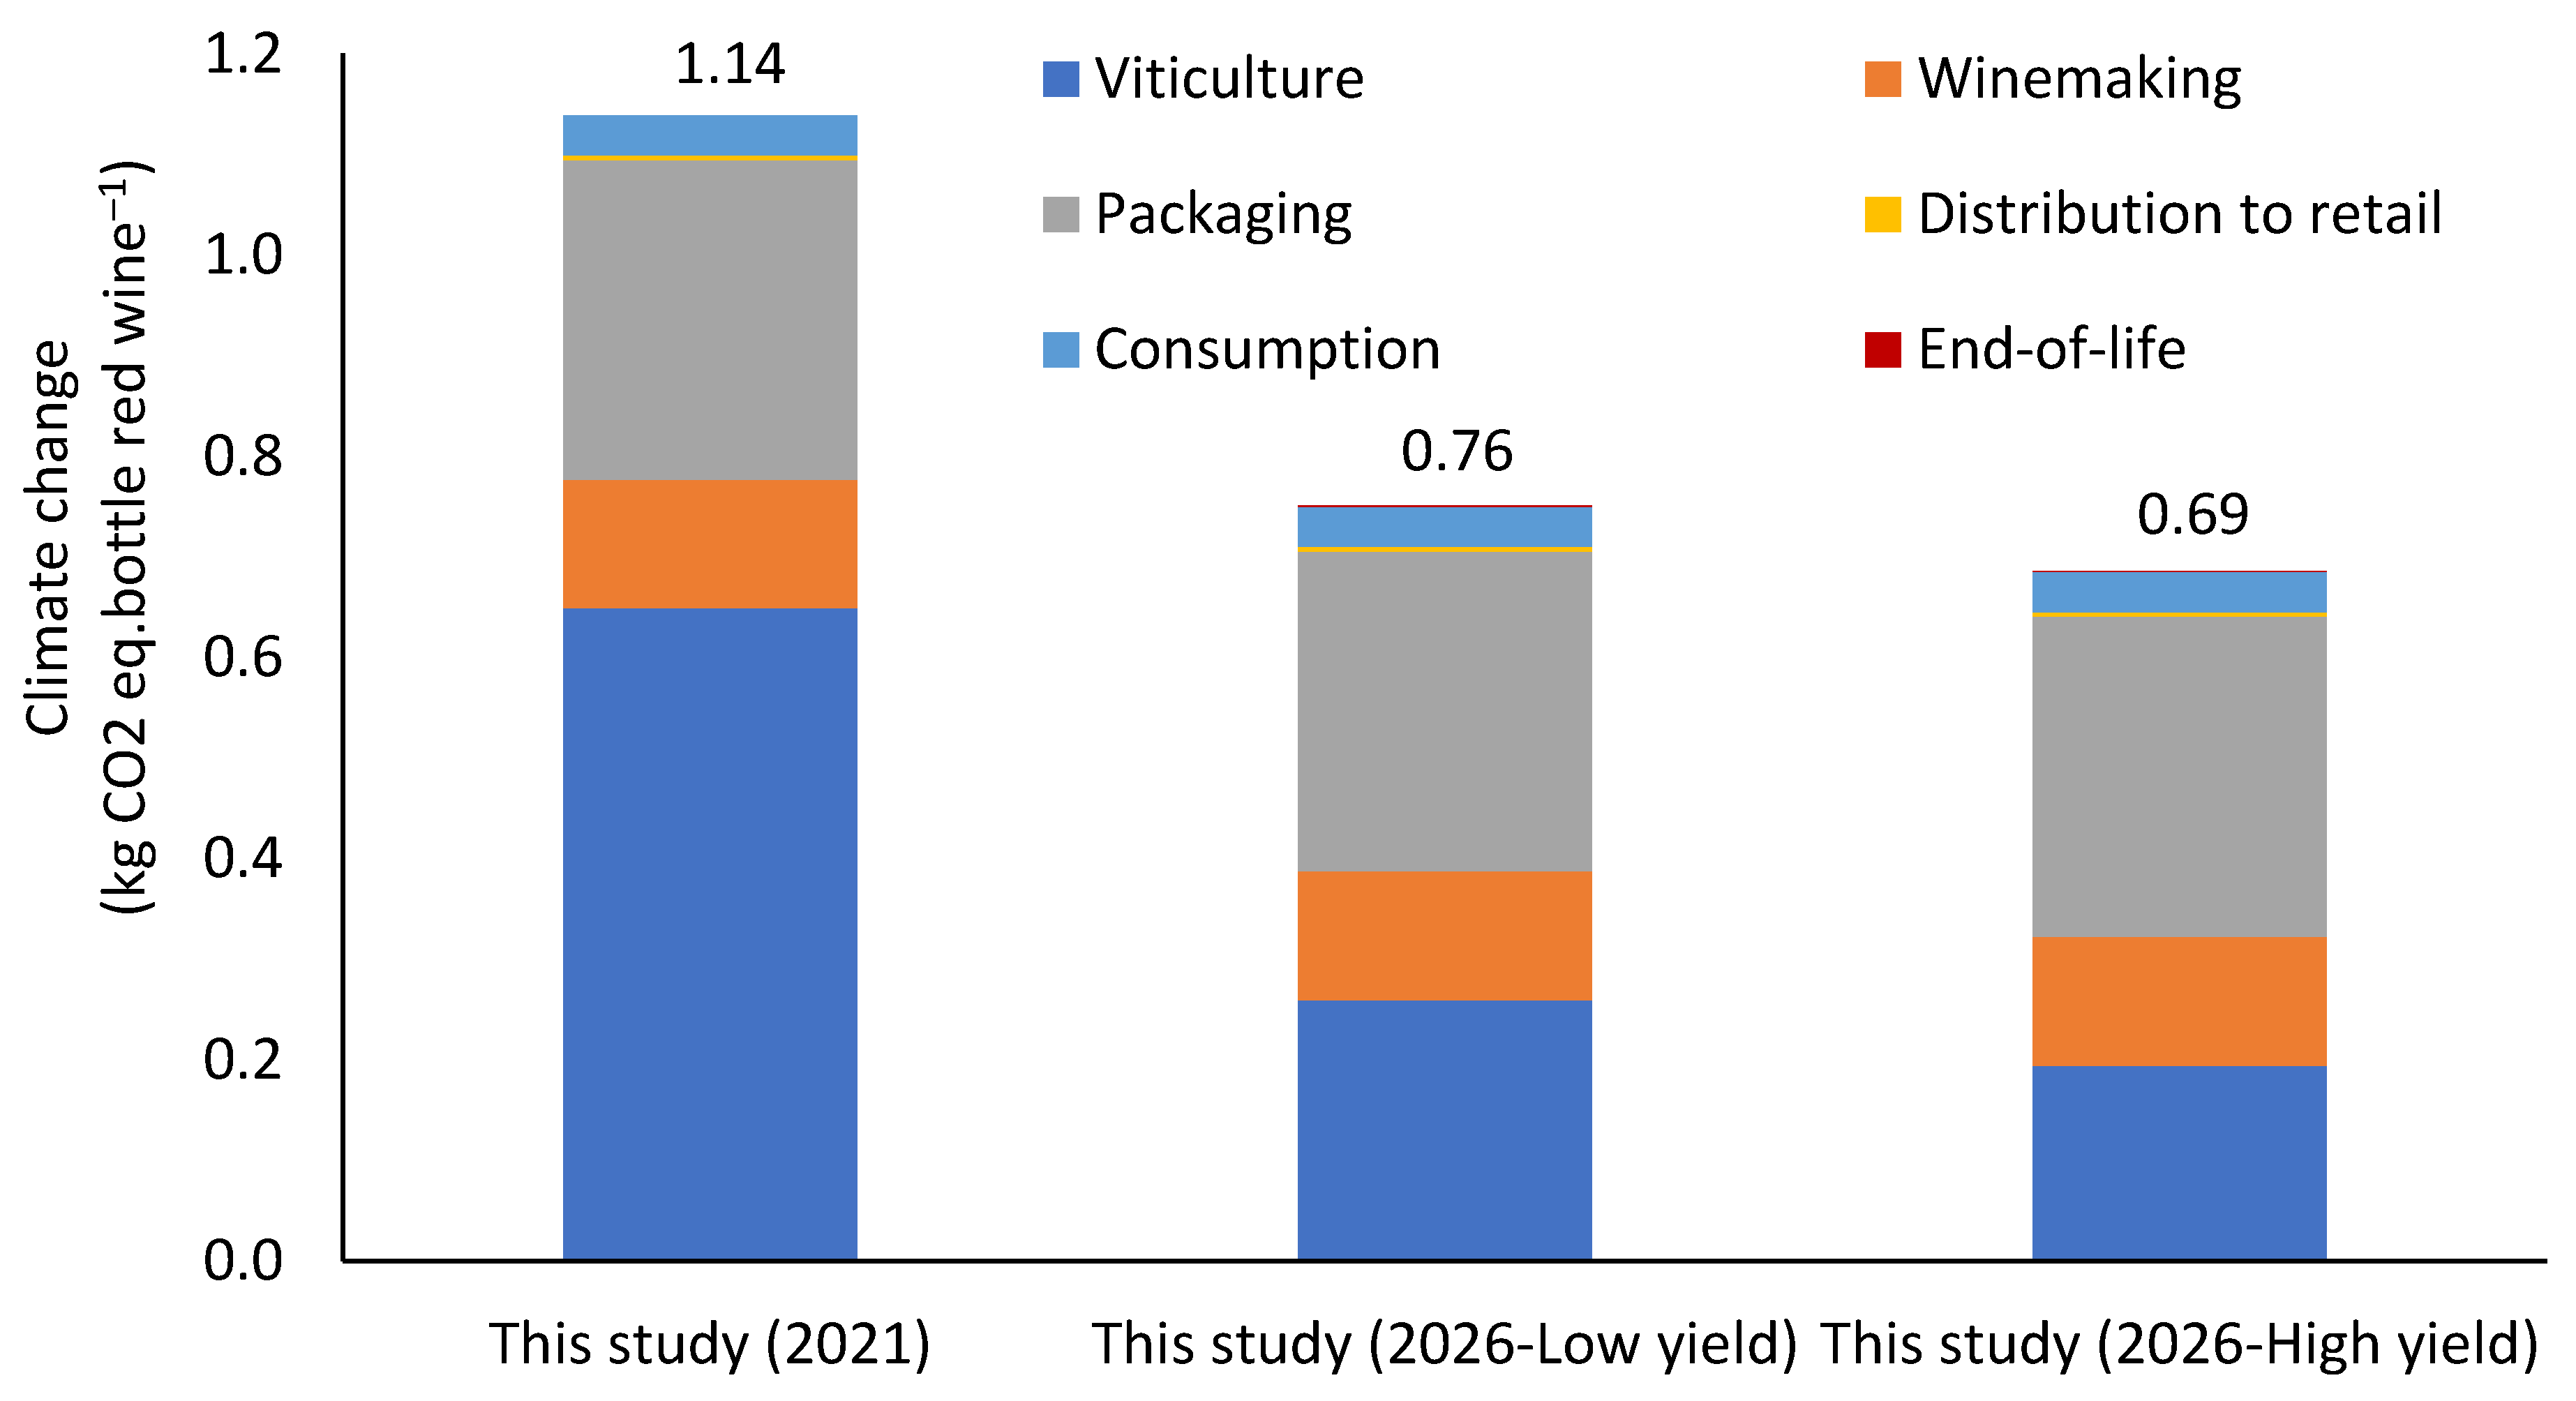
3.1. Life Cycle Assessment

The results show the climate change effects for organic red wine based on current and future yields (see Figure 2). Two stages are the environmental hotspots for modeled organic red wine systems: the contribution of the viticulture and packaging stages ranges between approx. 28% and 57% and between approx. 28% and 46%, respectively. Regarding the viticulture stage, zeolite is the largest contributor. Zeolite contributes up to approx. 48% to the climate change score. Furthermore, in our study, the production of compost from the stalk and its consequent application resulted in a much smaller effect than reported in the literature [20,22,24]. These authors reported an increase of up to 22% in the climate change score due to the production of organic compost. Although these authors used data from the literature [50] for composting stalks and wastewater sludge, our study used a dataset from the Ecoinvent database for composting biowaste (such as stalk). For the packaging stage, the production of glass bottles is the largest contributor due to its high energy needs. The diesel generator is the main contributor to the winemaking stage. The winemaking stage is a smaller contributor than in other studies because the winery produced electricity with photovoltaics. In contrast, wine distribution to retail, consumption, and EoL treatment contribute minimally to the climate change score.
The PEFCR [11] suggests that wine is refrigerated for a couple of days, and 5% of the wine in the bottle is not consumed, but becomes waste. This effect is small and ranges between approx. 4% and 6% for the 2021 yield and 2026 high yield, respectively. Additionally, bottled wine distribution to retail occurs at a local level. If distribution changes and wine is distributed nationally or exported to North European countries by truck for approx. 2500 km, the climate change score may increase by 7% on average or 24%, respectively.
Almost all studies designed cradle-to-grave boundaries, but only Harb et al. (2021) [20] followed the PEFCR for wine, i.e., accounting for wine refrigeration and disposing of 5% of the wine in the consumption stage. The other LCA studies did not explicitly mention that they follow the PEFCR for wine, but, due to the functional unit, system boundaries design, and study scope, their results are comparable with the results of our study. Our study has different consumables in the viticulture stage and similar consumables in the winemaking stage to the reviewed LCA studies. The viticulture stage did not employ purchased organic fertilizers, as in the cases of Meneses et al. (2016), Harb et al. (2021), and Chiriacò et al. (2019) [20,22,24], but it produced organic compost from viticulture waste, and this is the only study that uses zeolite. Similarities also existed in the winemaking stage because all studies employed electricity and sulfur dioxide. However, the fact that Hatzisavva Vineyards and Winery’s objective is the production of natural wine, no yeast [20,22,24] and sugar [20] were used.
The results obtained in this study are consistent with those of the reviewed LCA studies for organic red wine, which indicate a climate change score range of 0.6–1.7 kg CO2eq/bottle, depending on the location of the vineyard. Figure 3 shows that the current yield of organic red wine results in a smaller climate change score than Arzoumanidis et al. (2017) and Pattara et al. (2012) [21,23], and larger than Meneses et al. (2016), Harb et al. (2021), Rugani et al. (2009), and Chiriacò et al. (2019) [20,22,24,25]. In contrast, future yields result in the lowest climate change score among the LCA studies, except for Rugani et al. (2009) [25], who excluded the consumption and EoL stages from their assessment. In all LCA studies, except for Rugani et al. [25], the contribution of the packaging stage is the largest, and in almost all studies, the contribution of the viticulture stage is the second largest. These results are consistent with our results. On the contrary, Rugani et al. (2009) [25] reported that the viticulture stage is the largest contributor to climate change score due to the production of organic fertilizer. Our study employs self-produced compost, which resulted in minor emissions of carbon dioxide, methane, and nitrous oxide [51]. Furthermore, in our study, the contribution of the winemaking stage is very small because the wine producer prioritizes natural wine, and the electricity consumed is generated from photovoltaics. This is consistent with all relevant studies, except for Chiriacò et al. (2019) [22], where this stage is the second largest contributor due to high electricity consumption.
Only the present study and Harb et al. [20] applied allocation. Other LCA studies did not mention applying allocation in the viticulture or winemaking stages. This decision can result in calculating a larger climate change score due to the consideration of co-products in the system boundaries, without at the same time applying the system expansion or substitution methods to resolve the multifunctionality issue.

Results of the Perturbation Analysis

The input parameters that were analyzed with the perturbation analysis were zeolite production and packaging glass material because both are hotspots according to Figure 2. In Figure 4, the effect that parameters have on each designed systems is displayed. This analysis shows that increasing the zeolite and glass input values by 10% results in positive SR values; thus, an increase of 10% results in an increase in the climate change value. A 10% increase in zeolite and glass results in increasing the climate change value from 4.8% to 8% and from 3.8% to 6.3%, respectively. The relative effect that the two input parameters have on the climate change score is greater for the organic red wine 2026 systems because their climate change values are smaller than the climate change score of the 2021 system.

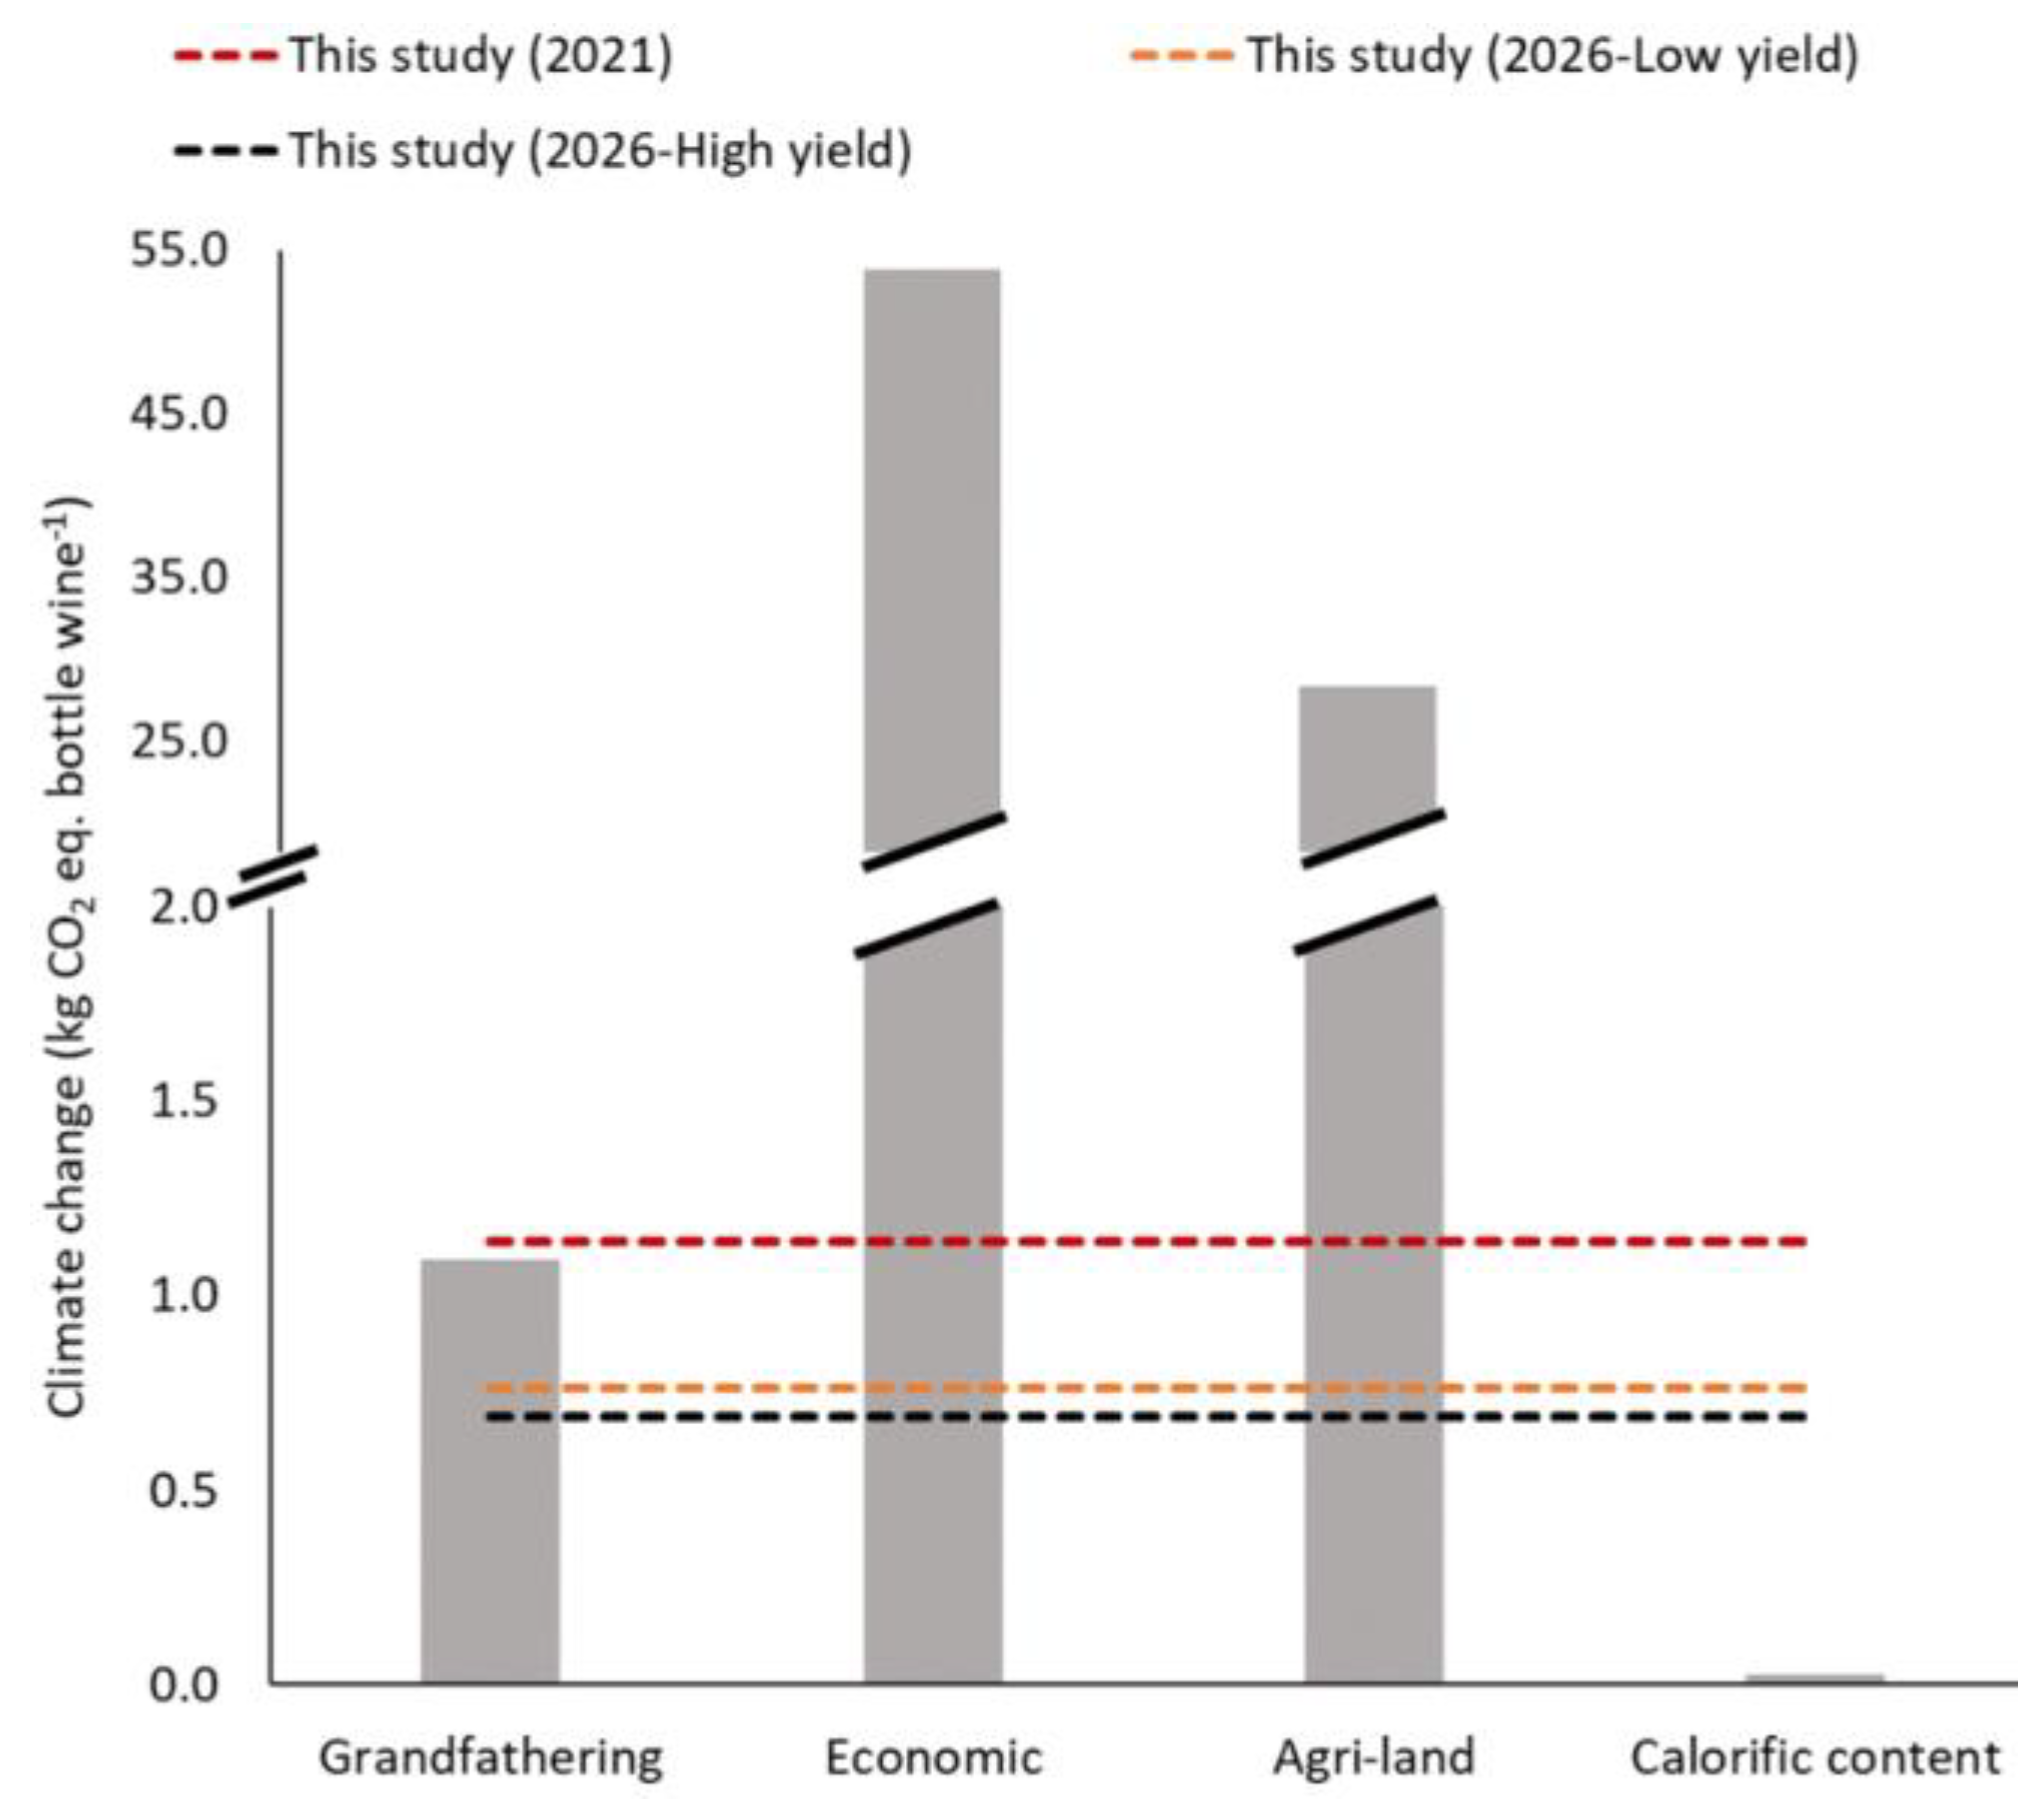
3.2. Planetary Boundaries

Figure 5 shows that the 2026 systems in this study perform within the SOSs, except for the SOS based on caloric content. Accounting for atmospheric CO2 sequestration in the grape was countered by exhaling CO2 after wine consumption. The climate change boundary of grandfathering, economic, and agri-land partitioning methods will not be exceeded due to wine production and consumption. This result stands in contrast to agriculture being a net emitter due to contributing to approx. 18% of global CO2 emissions [52]. However, it is explained by the fact that the entire sector of agriculture includes livestock production, which results in high carbon emissions mainly due to food production and direct emissions from enteric fermentation and manure.
The economic partitioning results in the largest maximum SOS value due to the importance of the wine industry to the Greek economy. The wine industry contributes approx. 3.8% to the Greek GDP. In contrast, the caloric content partitioning results in the lowest maximum SOS value due to the low calories of a wine bottle when compared with other food products. The SOS of the other two partitioning methods fall between economic and caloric content partitionings SOS results. The grandfathering partitioning results in a maximum SOS value closer to the caloric content’s SOS because the GHG emissions of the wine industry are low in relation to the GHG emissions of the Greek agriculture industry. On the other hand, the agri-land partitioning results in a maximum SOS value closer to the economic partitioning’s SOS because of the total land used for viticulture when compared to the total agricultural land in Greece.
The system based on the 2021 yield results in higher carbon emissions than the maximum SOS value of the grandfathering and caloric content partitioning methods by 0.25 and 1.32 kg CO2, respectively. The difference from grandfathering partitioning is relatively small, and it approximates two times the climate change score of the winemaking stage. However, the difference with the caloric content partitioning is much larger and approximates the upper climate change values of red organic wines in Figure 3. On the other hand, the 2021 system yield results in lower carbon emissions than the maximum SOS value of the economic and agri-land partitionings by 52.48 and 26.91 kg CO2, respectively. This difference from the maximum SOS value is so large that, if Hatzisavva Vineyards and Winery decides to distribute the wine, even outside Greece, the SOS will not be exceeded.
Regarding both low and high yields in 2026, the carbon emissions of a bottle of wine result in exceeding the maximum SOS value calculated with the caloric content partitioning and remaining within the SOS with the grandfathering, economic, and agri-land partitionings. A bottle of wine in 2026 with low yield results in higher carbon emissions than the maximum SOS value of the caloric content partitioning by 0.89 kg CO2. However, the total carbon emissions remain within the SOS by 0.18, 52.91, and 27.34 kg CO2 based on grandfathering, economic, and agri-land partitionings, respectively. Similarly, a bottle of wine in 2026 with high yield results in higher carbon emissions than the maximum SOS value of the caloric content partitioning by 0.82 kg CO2. In addition, the total carbon emissions remain within the SOS by 0.25, 52.98, and 27.41 kg CO2 based on the grandfathering, economic, and agri-land partitionings, respectively. For both future yields, the difference in the carbon emissions of a bottle of wine with the maximum SOS value of the grandfathering and caloric content partitionings approximates the climate change score of the winemaking stage or the climate change score of the “greener” wines of Figure 3. In contrast, the difference in the future yields’ carbon emissions with the maximum SOS value of the remaining partitioning methods is several times the climate change score of wine, i.e., exporting the wine, even to north European countries or Australia, may not result in crossing the climate change boundary.

Effect of Increased Wine Production on the Safe Operating Space (SOS)

Changing the total production of wine bottles by ±10% results in affecting the maximum SOS value of the grandfathering and agri-land partitioning methods (see Table 5). The SOSs of the economic and caloric content partitionings are proportional to wine bottle production. The SOS of the economic partitioning is proportional to wine sales, and the SOS of the caloric content partitioning is proportional to the total wine calories. Therefore, increasing or decreasing wine bottle production also results in decreasing wine sales and total calories. In contrast, the SOS based on the agri-land partitioning is affected because the amount of land will not change due to the modified production. Furthermore, the SOS based on the grandfathering partitioning is also affected because modified production will affect all the life cycle stages of wine, except for viticulture.

3.3. Data Quality

The data quality for the LCA and PBs is presented. Therefore, carbon sequestration during vine growing is presented explicitly. Table 6 shows the DQR of this study (2026-Low yield). The results of the DQR for current yield and 2026-High yield can be found in Appendix A. The DQRLCA (2026-Low yield) = 1.8 and the DQRPB (2026-Low yield) = 2.5. The PEFCR [11] suggests that the DQR shall be ≤1.6 for company-specific datasets and ≤ 3.0 for secondary datasets. Our results fall within this range. Furthermore, the inclusion of data for CO2 sequestration from Zhang et al. [39] resulted in lower data quality. However, measuring and including CO2 sequestration is crucial for environmental assessments of agri-products. Last, the use of secondary datasets from the Ecoinvent database can result in lowering data quality due to Time-Representativeness because datasets can be good representatives of technologies but old because commercial technologies do not typically change with time.

3.4. Technical Limitations

There are two main limitations of our study. One is the use of model data from Zhang et al. [39] regarding the sequestration of atmospheric CO2 by the vines, and the use of the Ecoinvent dataset for the emissions during composting of organic waste. Although the data accuracy of the latter may not result in significant changes, measuring the actual atmospheric CO2 sequestration at the vineyard will result in more site-specific results. Especially, considering that the inclusion of biogenic CO2 sequestration should not be limited to grape production but should also include other parts of the vine and especially the affected soil carbon sequestration in the vineyard. The latter is important because it is the second largest carbon reservoir on earth [53]. However, actual carbon measurements of CO2 sequestration to plants and soil should last more than one year to fully capture potential seasonal differences. Last. site-specific CO2 measurements at the viticulture stage would not affect the carbon balance due to grape production and wine making because that carbon is exhaled in the form of CO2 upon wine consumption, but stored carbon in other parts of the vine would drive the global warming potential result to smaller values, assuming that vineyard waste is not burned on site.
The reliability and acceptance of the PB results depend on the used primary data and the consideration of partitioning methods. The availability of resources, and thus the assumptions made, can potentially raise questions regarding calculating the SOSs of the climate change boundary. From a decision-making perspective, it appears to be more relevant to base the calculation of the SOS on monetary flows (economic partitioning) that express an outcome, such as increasing citizens’ welfare, or on the impact of an industrial sub-sector on the considered environmental impact, instead of the means to reach the outcome, such as the equal distribution of the SOS based on calories or land.

4. Conclusions

The aim of this study is to apply LCA to calculate the climate change score of a 0.75 L bottle of Greek organic red wine and apply the PB method to investigate if the climate change boundary is exceeded due to wine production and consumption of a 0.75 L bottle of Greek organic red wine. Three systems were modeled for the current viticulture yield and viticulture yields in 2026, the climate change score was calculated, and benchmarks were developed based on the grandfathering, economic, agri-land, and calorific content partitioning methods.
The LCA results show that organic red wine production and consumption in Alexandroupolis can provide climate change benefits when compared to other Mediterranean organic red wines. The PB results of expected future yields are below the maximum SOS, which shows that wine is a product which remains within the ecological constraints on human development, if the SOS is not based on the caloric content of wine. Additionally, the wine producer can further reduce the climate change value by focusing on zeolite replacements or less-carbon-intensive packaging materials. The PB results show that the current viticulture yield results in carbon emissions outside the SOS of all partitioning methods. However, the expected increase in future yield, due to the young current age of the vines, provides a safe zone for the wine producer to further increase profitability by exporting wine to other Greek cities or European countries while remaining within the SOSs of grandfathering, economic, and agri-land partitioning.
The PB method is complementary to the LCA results. LCA compares various red organic wines based on their climate change score, and PBs provide context whether red organic wine production and consumption remain within the ecological constraints on human development in Greece. Last, it is recommended to extend carbon measurements to soil carbon in order to assess the real climate change score of wine and incorporate agriculture in climate change mitigation policies.

Author Contributions

G.A.T.: Conceptualization, Formal analysis, Investigation, Methodology, Validation, Visualization; Writing—original draft, Writing—review and editing. Z.-P.K.: Writing—review and editing. K.H.: Resources. G.K.: Methodology, Software, Writing—review and editing. S.R.: Funding acquisition, Supervision, Writing—review and editing. All authors have read and agreed to the published version of the manuscript.

Funding

We acknowledge the support of this work by the project “AGRO4+—Holistic approach to Agriculture 4.0 for new farmers” (MIS 5046239) which is implemented under the Action “Reinforcement of the Research and Innovation Infrastructure”, funded by the Operational Programme “Competitiveness, Entrepreneurship and Innovation” (NSRF 2014-2020) and co-financed by Greece and the European Union (European Regional Development Fund).

Data Availability Statement

Data is contained within the article.

Acknowledgments

The opinions expressed in this document reflect only the views of the authors. The authors are grateful for the comments of the reviewers which resulted in improving the quality and clarity of the study.

Conflicts of Interest

G.A. Tsalidis, Z.P. Kryona, G. Korevaar, S. Rapsomanikis declare that they have no conflicts of interest. K. Hatzisavva is the data producer as the wine producer. Hatzisavva Vineyards and Winery is the private company of Author Kiriaki Hatzisavva. Therefore, there is a conflict of interest with respect to benefits related to the promotion of the wine product.

Appendix A

The file contains material that is complementary to the main text.
Table A1 presents the mass allocation factors for the winemaking stage according to the product environmental footprint category rules.
The chemical formula that was used to calculate biogenic CO2 emissions during fermentation is shown.
Table A2 and Table A3 present the data quality results of the current yield and 2026-High yield for LCA and PBs, respectively.
Table A1. Mass allocation factors for winemaking.
Co-products of Winemaking StageMass Allocation Factor (%)
Red wine84%
Pomace 16%
Emissions during fermentation were calculated according to stoichiometry:
C 6 H 12 O 6 a q 2 H 3 C C H 2 O H a q + 2 C O 2 g
The DQRLCA (2021) is 1.8 and the DQRPBs (2021) is 2.3. Additionally, the DQRLCA (2026-High yield) is 1.8 and the DQRPBs (2026-High yield) is 2.5.
Table A2. Data quality results of the current yield.
TeRGRTiRPDQR Per Stage
Viticulture (excluding CO2 sequestration)11221.5
CO2 sequestration23433.0
Wine making11121.3
Packaging (bottle making)225-2.3
Distribution115-1.8
Consumption115-1.8
End-of-life215-2.0
Table A3. Data quality results of the current yield and 2026-High yield.
TeRGRTiRPDQR Per Stage
Viticulture (excluding CO2 sequestration)21121.5
CO2 sequestration23433.0
Wine making11121.3
Packaging (bottle making)225-2.3
Distribution115-1.8
Consumption115-1.8
End-of-life215-2.0

References

  1. ISO 14040:2006; Environmental Management—Life Cycle Assessment—Principles and Framework. International Organization for Standardization: Geneva, Switzerland, 2006.
  2. ISO 14044:2006; Environmental Management-Life Cycle Assessment-Requirements and Guidelines. International Organization for Standardization: Geneva, Switzerland, 2006.
  3. Rockström, J.; Steffen, W.; Noone, K.; Persson, Å.; Chapin, F.S.I.; Lambin, E.; Lenton, T.; Scheffer, M.; Folke, C.; Schellnhuber, H.J.; et al. Planetary Boundaries: Exploring the Safe Operating Space for Humanity. Ecol. Soc. 2009, 14, 32. [Google Scholar] [CrossRef]
  4. Rockström, J.; Steffen, W.; Noone, K.; Persson, Å.; Chapin, F.S.; Lambin, E.F.; Lenton, T.M.; Scheffer, M.; Folke, C.; Schellnhuber, H.J.; et al. A Safe Operating Space for Humanity. Nature 2009, 461, 472–475. [Google Scholar] [CrossRef]
  5. United Nations. Framework Convention on Climate Change (UNFCCC). In The Paris Agreement; United Nations: New York, NY, USA, 2016. [Google Scholar]
  6. Statistical Review of World Energy Greece: Carbon Dioxide Emissions 1970–2022. Available online: https://www.statista.com/statistics/449732/co2-emissions-greece/ (accessed on 21 August 2023).
  7. Faostat. The Share of Agri-Food Systems in Total Greenhouse Gas Emissions. In Global, Regional and Country Trends 1990–2019; Faostat Analytical Brief 31; FAOSTAT: Rome, Italy, 2019. [Google Scholar]
  8. Ministry of Environment and Energy. National Inventory Report (NIR); Ministry of Environment and Energy: Athens, Greece, 2021.
  9. OECD. OECD Environmental Performance Reviews: Greece 2020; OECD Environmental Performance Reviews; OECD: Paris France, 2020; ISBN 978-92-64-38735-5. [Google Scholar]
  10. European Commission. Farm to Fork Strategy—For a Fair, Healthy and Environmentally-Friendly Food System; COM/2020/381 Final; European Commission: Brussel, Belgium, 2020. [Google Scholar]
  11. European Commission. Product Environmental Footprint Category Rules (PEFCR) for Still and Sparkling Wine; European Commission: Brussel, Belgium, 2018. [Google Scholar]
  12. Weidema, B.P.; Thrane, M.; Christensen, P.; Schmidt, J.; Løkke, S. Carbon Footprint. J. Ind. Ecol. 2008, 12, 3–6. [Google Scholar] [CrossRef]
  13. Steffen, W.; Richardson, K.; Rockström, J.; Cornell, S.E.; Fetzer, I.; Bennett, E.M.; Biggs, R.; Carpenter, S.R.; de Vries, W.; de Wit, C.A.; et al. Planetary Boundaries: Guiding Human Development on a Changing Planet. Science 2015, 347, 1259855. [Google Scholar] [CrossRef] [PubMed]
  14. Bjørn, A.; Margni, M.; Roy, P.-O.; Bulle, C.; Hauschild, M.Z. A Proposal to Measure Absolute Environmental Sustainability in Life Cycle Assessment. Ecol. Indic. 2016, 63, 1–13. [Google Scholar] [CrossRef]
  15. Ryberg, M.W.; Owsianiak, M.; Clavreul, J.; Mueller, C.; Sim, S.; King, H.; Hauschild, M.Z. How to Bring Absolute Sustainability into Decision-Making: An Industry Case Study Using a Planetary Boundary-Based Methodology. Sci. Total Environ. 2018, 634, 1406–1416. [Google Scholar] [CrossRef]
  16. Chandrakumar, C.; McLaren, S.J.; Jayamaha, N.P.; Ramilan, T. Absolute Sustainability-Based Life Cycle Assessment (ASLCA): A Benchmarking Approach to Operate Agri-Food Systems within the 2 °C Global Carbon Budget. J. Ind. Ecol. 2019, 23, 906–917. [Google Scholar] [CrossRef]
  17. Bjorn, A.; Chandrakumar, C.; Boulay, A.-M.; Doka, G.; Fang, K.; Gondran, N.; Hauschild, M.Z.; Kerkhof, A.; King, H.; Margni, M.; et al. Review of Life-Cycle Based Methods for Absolute Environmental Sustainability Assessment and Their Applications. Environ. Res. Lett. 2020, 15, 083001. [Google Scholar] [CrossRef]
  18. Ghani, H.U.; Ryberg, M.; Bjørn, A.; Hauschild, M.Z.; Gheewala, S.H. Resource Efficiency Analysis through Planetary Boundary-Based Life Cycle Assessment: A Case Study of Sugarcane in Pakistan. Int. J. Life Cycle Assess. 2023, 28, 1561–1576. [Google Scholar] [CrossRef]
  19. United States Environmental Protection Agency. Climate Impacts on Agriculture and Food Supply. Available online: https://19january2017snapshot.epa.gov/climate-impacts/climate-impacts-agriculture-and-food-supply (accessed on 9 March 2022).
  20. Harb, W.; Zaydan, R.; Vieira, M. Improving Environmental Performance in Wine Production by Life Cycle Assessment: Case of Lebanese Wine. Int. J. Life Cycle Assess. 2021, 26, 1146–1159. [Google Scholar] [CrossRef]
  21. Arzoumanidis, I.; Salomone, R.; Petti, L.; Mondello, G.; Raggi, A. Is There a Simplified LCA Tool Suitable for the Agri-Food Industry? An Assessment of Selected Tools. J. Clean. Prod. 2017, 149, 406–425. [Google Scholar] [CrossRef]
  22. Chiriacò, M.V.; Belli, C.; Chiti, T.; Trotta, C.; Sabbatini, S. The Potential Carbon Neutrality of Sustainable Viticulture Showed through a Comprehensive Assessment of the Greenhouse Gas (GHG) Budget of Wine Production. J. Clean. Prod. 2019, 225, 435–450. [Google Scholar] [CrossRef]
  23. Pattara, C.; Raggi, A.; Cichelli, A. Life Cycle Assessment and Carbon Footprint in the Wine Supply-Chain. Environ. Manag. 2012, 49, 1247–1258. [Google Scholar] [CrossRef] [PubMed]
  24. Meneses, M.; Torres, C.M.; Castells, F. Sensitivity Analysis in a Life Cycle Assessment of an Aged Red Wine Production from Catalonia, Spain. Sci. Total Environ. 2016, 562, 571–579. [Google Scholar] [CrossRef] [PubMed]
  25. Rugani, B.; Niccolucci, V.; Pulselli, R.M.; Tiezzi, E. A Cradle-to-Gate Life Cycle Assessment Integrated with Emergy Evaluation: Sustainability Analysis of an Organic Wine Production. In Proceedings of the SETAC Europe 19th Annual Meeting, “Protecting Ecosystem Health: Facing the Challenge of a Globally Changing Environment”, Göteborg, Sweden, 31 May–4 June 2009; p. 274. [Google Scholar]
  26. Carbone, A.; Quici, L.; Pica, G. The Age Dynamics of Vineyards: Past Trends Affecting the Future. Wine Econ. Policy 2019, 8, 38–48. [Google Scholar] [CrossRef]
  27. Hatzisavva, K. (Hatzisavva Vineyards and Winery, Alexandoupolis, Greece). Personal Communication, 2021.
  28. Pre Consultants SimaPro Life Cycle Analysis, Version 7.2; Simapro: Gothenburg Sweden, 2018.
  29. Wernet, G.; Bauer, C.; Steubing, B.; Reinhard, J.; Moreno-Ruiz, E.; Weidema, B. The Ecoinvent Database Version 3 (Part I): Overview and Methodology. Int. J. Life Cycle Assess. 2016, 21, 1218–1230. [Google Scholar] [CrossRef]
  30. Eurostat Data Browser. Packaging Waste by Waste Management Operations; European Commission: Brussel, Belgium, 2019. [Google Scholar]
  31. Huijbregts, M.A.J.; Steinmann, Z.J.N.; Elshout, P.M.F.; Stam, G.; Verones, F.; Vieira, M.; Zijp, M.; Hollander, A.; van Zelm, R. ReCiPe2016: A Harmonised Life Cycle Impact Assessment Method at Midpoint and Endpoint Level. Int. J. Life Cycle Assess. 2017, 22, 138–147. [Google Scholar] [CrossRef]
  32. Clavreul, J.; Guyonnet, D.; Christensen, T.H. Quantifying Uncertainty in LCA-Modelling of Waste Management Systems. Waste Manag. 2012, 32, 2482–2495. [Google Scholar] [CrossRef]
  33. Fanning, A.L.; O’Neill, D.W. Tracking Resource Use Relative to Planetary Boundaries in a Steady-State Framework: A Case Study of Canada and Spain. Ecol. Indic. 2016, 69, 836–849. [Google Scholar] [CrossRef]
  34. Bjørn, A.; Hauschild, M.Z. Introducing Carrying Capacity-Based Normalisation in LCA: Framework and Development of References at Midpoint Level. Int. J. Life Cycle Assess. 2015, 20, 1005–1018. [Google Scholar] [CrossRef]
  35. CAIT. Agriculture Climate Change Data. Climate Watch. 2018. Available online: https://www.climatewatchdata.org/sectors/agriculture#drivers-of-emissions (accessed on 21 January 2025).
  36. Alcorn, J.A. Global Sustainability and the New Zealand House. Ph.D. Thesis, School of Architecture, Victoria University of Wellington, Wellington, New Zealand, 2010. [Google Scholar]
  37. Clift, R.; Wright, L. Relationships Between Environmental Impacts and Added Value Along the Supply Chain. Technol. Forecast. Soc. Change 2000, 65, 281–295. [Google Scholar] [CrossRef]
  38. Fragopoulou, E.; Choleva, M.; Antonopoulou, S.; Demopoulos, C.A. Wine and Its Metabolic Effects. A Comprehensive Review of Clinical Trials. Metabolism 2018, 83, 102–119. [Google Scholar] [CrossRef] [PubMed]
  39. Zhang, L.; Xue, T.; Gao, F.; Wei, R.; Wang, Z.; Li, H.; Wang, H. Carbon Storage Distribution Characteristics of Vineyard Ecosystems in Hongsibu, Ningxia. Plants 2021, 10, 1199. [Google Scholar] [CrossRef]
  40. Smart, R. Are Wineries Environmental Vandals? IWC. 2019. Available online: https://www.internationalwinechallenge.com/Canopy-Articles/are-wineries-environmental-vandals.html (accessed on 21 January 2025).
  41. The World Bank Group GDP (Current US$)—Greece. Available online: https://data.worldbank.org/indicator/NY.GDP.MKTP.CD?locations=GR (accessed on 6 December 2022).
  42. Statista Greece—Distribution of Gross Domestic Product (GDP) Across Economic Sectors. 2021. Available online: https://www.statista.com/statistics/276399/distribution-of-gross-domestic-product-gdp-across-economic-sectors-in-greece/ (accessed on 6 December 2022).
  43. Statista Wine—Greece|Statista Market Forecast. Available online: https://www.statista.com/outlook/cmo/alcoholic-drinks/wine/greece (accessed on 6 December 2022).
  44. Ritchie, H.; Roser, M. “Land Use” Published Online at OurWorldinData.org. 2019. Available online: https://ourworldindata.org/land-use (accessed on 21 January 2025).
  45. The World Bank Group Land Area (Sq. Km)—Greece|Data. Available online: https://data.worldbank.org/indicator/AG.LND.TOTL.K2?locations=GR (accessed on 6 December 2022).
  46. International Organisation of Vine and Wine. State of the World Vitivinicultural Sector in 2019; OIV: Dijon, France, 2020. [Google Scholar]
  47. Smith, P.; Haberl, H.; Popp, A.; Erb, K.; Lauk, C.; Harper, R.; Tubiello, F.N.; de Siqueira Pinto, A.; Jafari, M.; Sohi, S.; et al. How Much Land-Based Greenhouse Gas Mitigation Can Be Achieved without Compromising Food Security and Environmental Goals? Glob. Change Biol. 2013, 19, 2285–2302. [Google Scholar] [CrossRef]
  48. Roser, M.; Ritchie, H.; Rosado, P. Food Supply. Our World in Data. 2013. Available online: https://ourworldindata.org/food-supply?ref=lennartorlando.com (accessed on 21 January 2025).
  49. Gifford, C. How Many Calories Are There in a Bottle of Wine? Pull The Cork: London, UK, 2021; Available online: https://www.theallotment.ie/blogs/wine-blog/how-many-calories-are-there-in-a-bottle-of-wine#:~:text=A%20standard%20750%20ml%20bottle,as%20many%20as%201%2C500%20calories (accessed on 21 January 2025).
  50. Ruggieri, L.; Cadena, E.; Martínez-Blanco, J.; Gasol, C.M.; Rieradevall, J.; Gabarrell, X.; Gea, T.; Sort, X.; Sánchez, A. Recovery of Organic Wastes in the Spanish Wine Industry. Technical, Economic and Environmental Analyses of the Composting Process. J. Clean. Prod. 2009, 17, 830–838. [Google Scholar] [CrossRef]
  51. Sánchez, A.; Artola, A.; Font, X.; Gea, T.; Barrena, R.; Gabriel, D.; Sánchez-Monedero, M.Á.; Roig, A.; Cayuela, M.L.; Mondini, C. Greenhouse Gas Emissions from Organic Waste Composting. Environ. Chem. Lett. 2015, 13, 223–238. [Google Scholar] [CrossRef]
  52. Ritchie, H. Sector by Sector: Where Do Global Greenhouse Gas Emissions Come From? Available online: https://ourworldindata.org/ghg-emissions-by-sector (accessed on 5 February 2021).
  53. Rehberger, E.; West, P.C.; Spillane, C.; McKeown, P.C. What Climate and Environmental Benefits of Regenerative Agriculture Practices? An Evidence Review. Environ. Res. Commun. 2023, 5, 052001. [Google Scholar] [CrossRef]
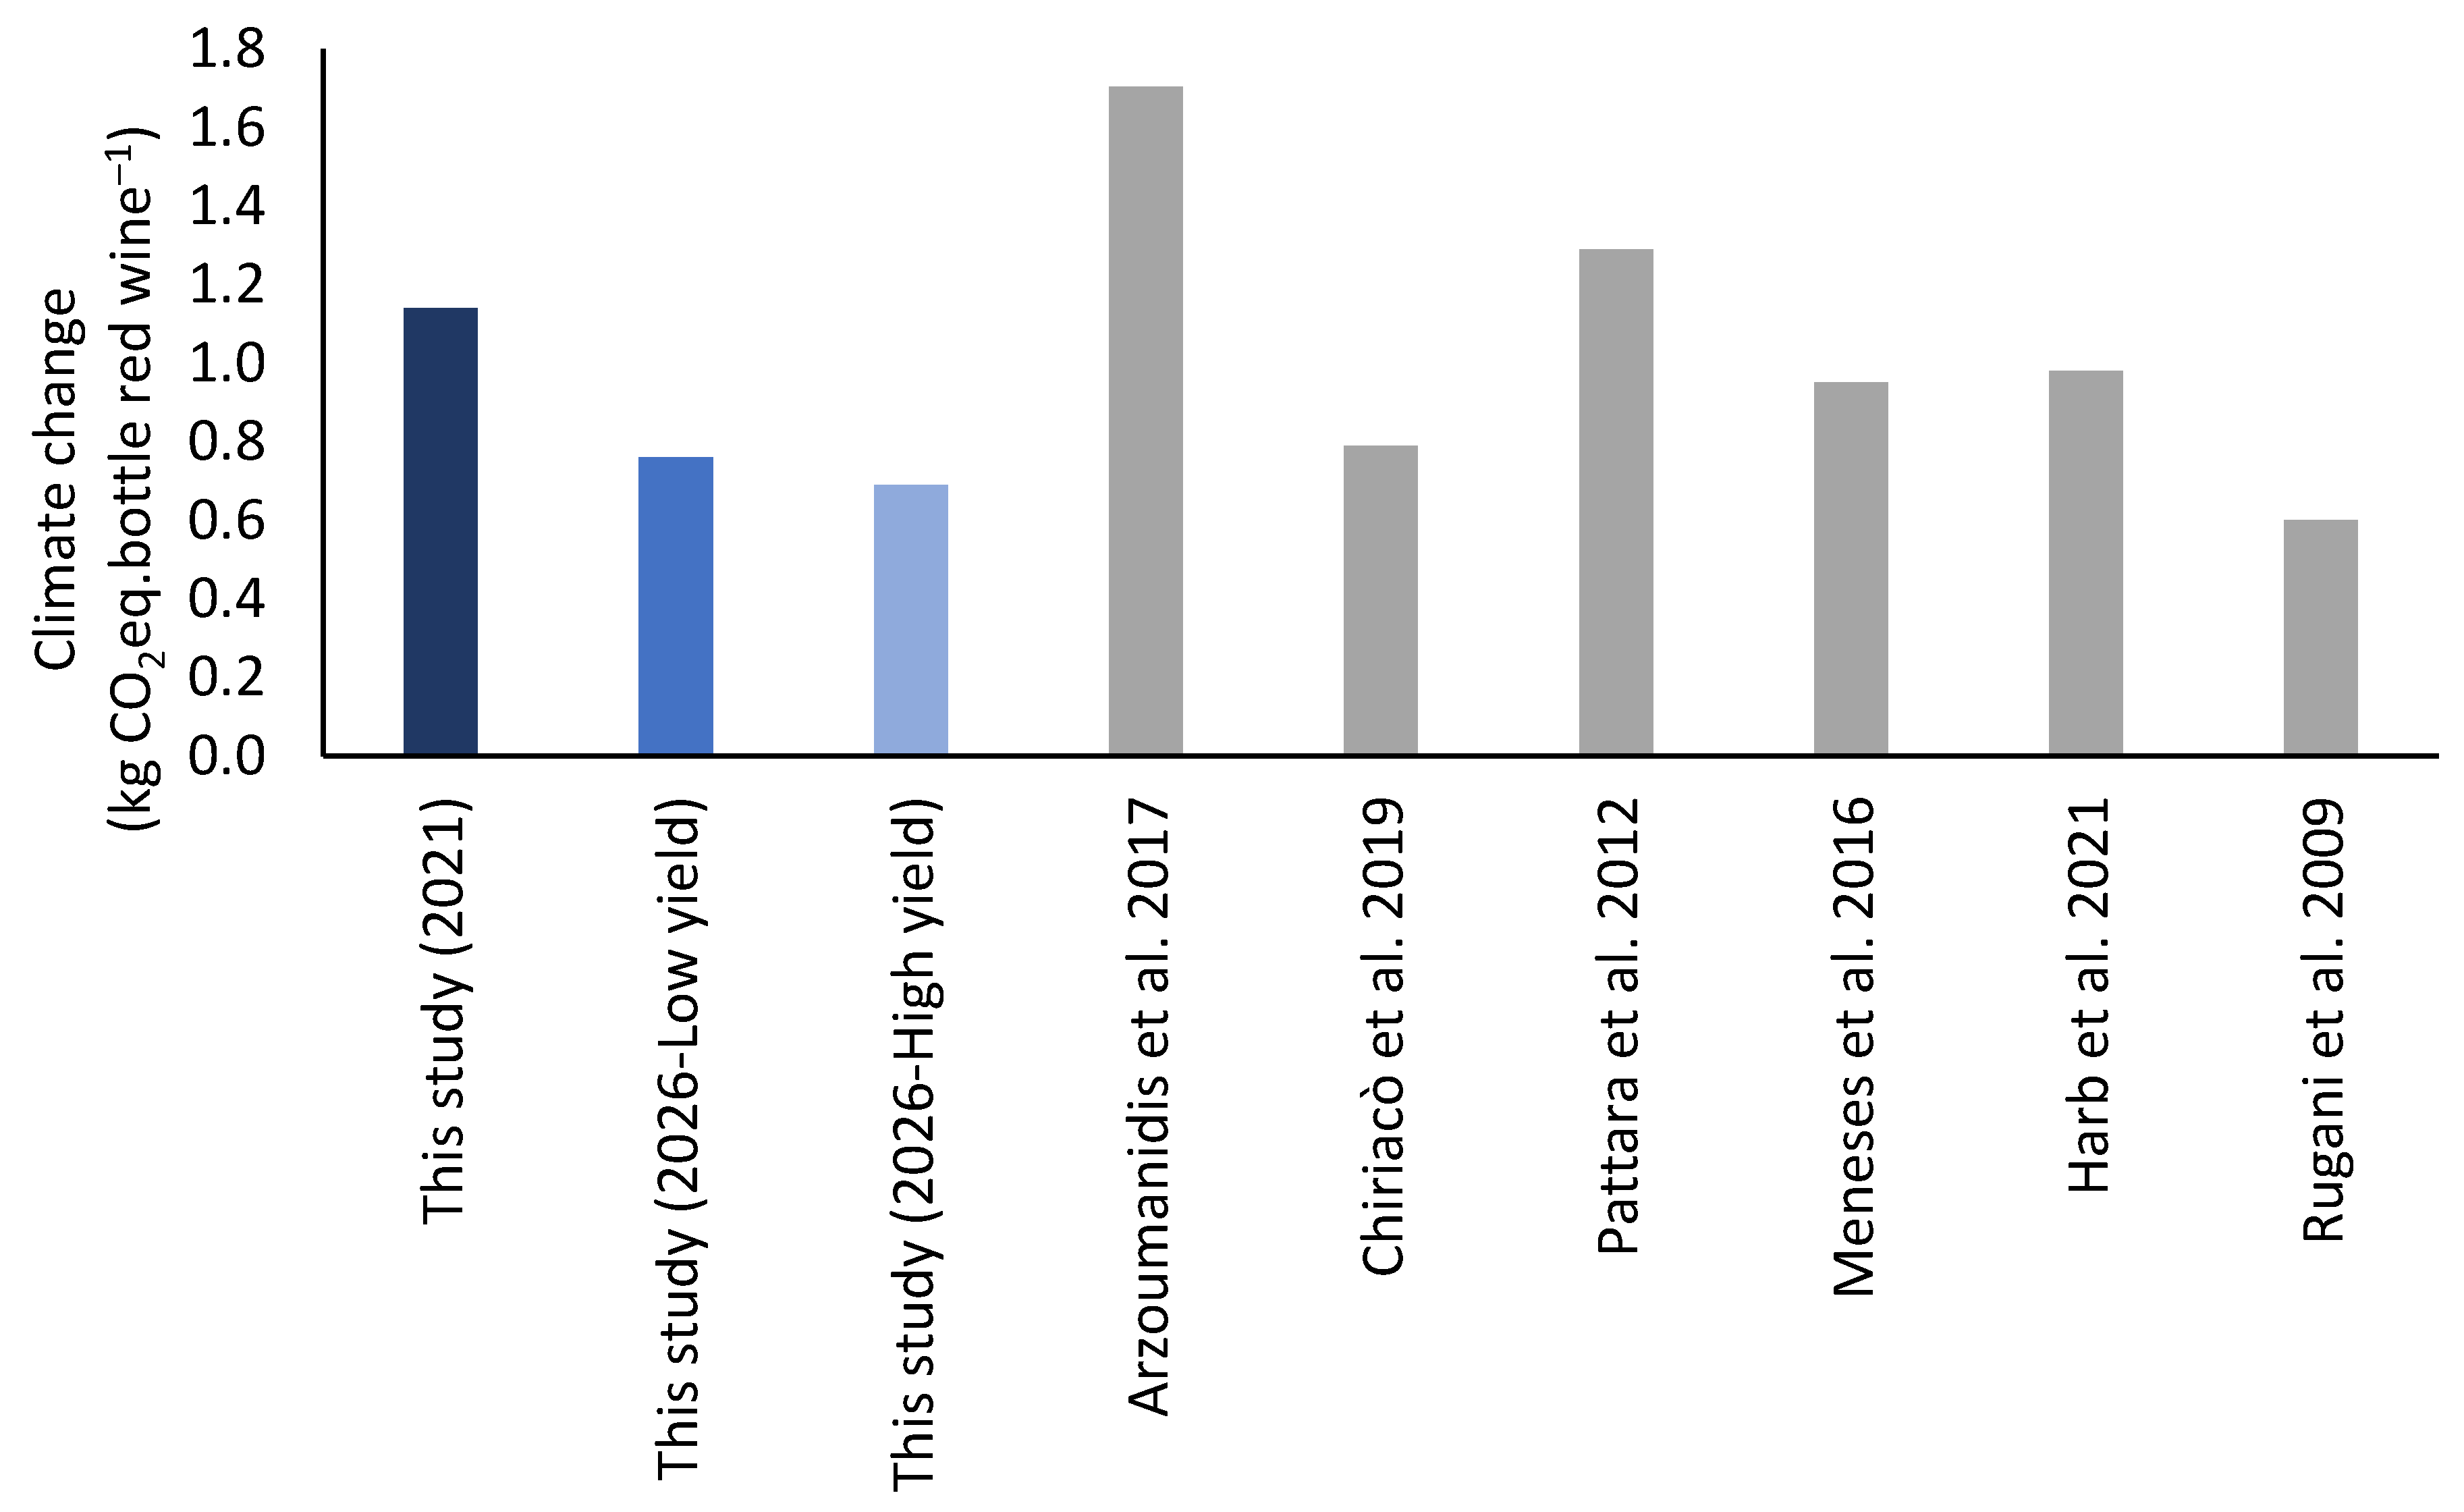
Figure 1. System boundaries of the organic red wine product system, FU: 1 bottle of wine.
Sustainability 17 03006 g001
Figure 2. Contribution analysis of life cycle stages to global warming potential value.
Sustainability 17 03006 g002
Figure 3. Global warming potential values of LCA studies for organic red wine production in the Mediterranean region [17,20,22,23,24,25].
Sustainability 17 03006 g003
Figure 4. High contributing parameter sensitivity ratios with respect to the global warming potential results (with biogenic CO2 sequestration) of the three studied systems.
Sustainability 17 03006 g004
Figure 5. Absolute climate change performance of organic red wine and its relation to the four calculated safe operating spaces.
Sustainability 17 03006 g005
Table 1. Life cycle assessment studies of an 0.75 L bottle of organic red wine produced in a Mediterranean climate.
Study Place System BoundariesClimate Change
(in kg CO2 eq.)
Application of PEFCR
[21]ItalyCradle-to-grave1.70No
[22]ItalyCradle-to-grave0.79No
[23]ItalyCradle-to-grave1.29No
[24]SpainCradle-to-grave0.95No
[25]ItalyCradle-to-gate0.60No
[20]LebanonCradle-to-grave0.98Yes
Table 2. Life cycle inventory to produce an organic red wine bottle in 2021.
InputAmountUnit OutputAmountUnit
Viticulture
Sulfur (powder) 0.04kgHarvested grapes1.06kg
Zeolite 0.14kgStalk (waste)0.004kg
Organic compost 0.002kg
Diesel1.01MJ
Winemaking
Harvested grapes1.06kgRed wine0.75L
Metabisulphite 0.19gPomace0.14kg
Bentonite0.13gLees 0.03kg
Electricity a0.004kWhDewatered sludge0.03kg
Diesel0.233MJ
Packaging
Glass bottle0.36kgBottled red wine0.75L
Red wine0.75L
Cork0.003kg
Cardboard0.001kg
Pallets0.001unit
Electricity 0.017kWh
Distribution to retail
Bottled red wine0.75LDistributed bottled red wine0.75L
Distance0.04t.km
Consumption
Distributed bottled red wine0.785LConsumed bottled red wine0.75L
Electricity 0.06kWhDisposed bottled red wine0.035L
Disposed glass bottle0.36kg
Disposed cork0.003kg
End-of-life
Disposed bottled red wine0.035L
Disposed glass bottle0.36kg
Disposed cork0.003kg
a Electricity generation from photovoltaics.
Table 3. Data needs matrix per life cycle stage.
Life Cycle StageLevel of Influence
ViticultureSituation 1: the process is run by the wine producer
WinemakingSituation 1: the process is run by the wine producer
Bottle makingSituation 3: the wine producer does not run the process or has access to (company-)specific information
PackagingSituation 1: the process is run by the wine producer
DistributionSituation 3: the wine producer does not run the process or has access to (company-)specific information
ConsumptionSituation 3: the wine producer does not run the process or has access to (company-)specific information
End-of-lifeSituation 3: the wine producer does not run the process or has access to (company-)specific information
Table 4. Downscaled safe operating spaces in kg CO2 eq. per downscaling method.
Budget aGrandfatheringEconomicAgri-LandCalorific Content
Global 6.8 × 10126.8 × 10126.8 × 10126.8 × 1012
Global agri-food 8.19 × 10118.19 × 10118.19 × 10118.19 × 1011
Greece 1.88 × 10⁹
Greek agri-food sector 9.82 × 1087.12 × 1071.10 × 1091.31 × 1+9
Greek wine sector 3.49 × 1051.72 × 1079.04 × 1067.17 × 103
Wine bottle 1.095.38 × 102.83 × 102.24 × 102
a in kg CO2eq.
Table 5. Sensitivity analysis of safe operating spaces.
GrandfatheringEconomicAgri-LandCalorific Content
10% increase in wine bottle production1.0753.8225.680.02
10% decrease in wine bottle production1.1253.8231.390.02
Table 6. Data quality of LCA and PBs according to Equation (1).
Life Cycle StageTeRGRTiRPDQR Per Stage
Viticulture (excl. CO2 sequestration)21121.5
CO2 sequestration (only for PBs)23433.0
Winemaking11121.3
Packaging (bottle-making)225-2.3
Distribution115-1.8
Consumption11532.5
End-of-life215-2.0
Disclaimer/Publisher’s Note: The statements, opinions and data contained in all publications are solely those of the individual author(s) and contributor(s) and not of MDPI and/or the editor(s). MDPI and/or the editor(s) disclaim responsibility for any injury to people or property resulting from any ideas, methods, instructions or products referred to in the content.

