Article

Day-to-Day and Within-Day Traffic Assignment Model of Heterogeneous Travelers Within the MaaS Framework

by
Lingjuan Chen
1,*,
Yanjing Yang
1,
Lin Wang
2,
Cong Xie
1,
Lin He
1 and
Minghui Ma
1
1
School of Automobile and Traffic Engineering, Wuhan University of Science and Technology, Wuhan 430081, China
2
State Key Laboratory of Advanced Technology for Materials Synthesis and Processing, Wuhan University of Technology, Wuhan 430070, China
*
Author to whom correspondence should be addressed.
Sustainability 2025, 17(7), 2983; https://doi.org/10.3390/su17072983
Submission received: 18 January 2025 / Revised: 17 March 2025 / Accepted: 25 March 2025 / Published: 27 March 2025
(This article belongs to the Special Issue Smart Mobility for Sustainable Development)

Abstract

:
With the continuous advancement of Mobility as a Service (MaaS), a hybrid traffic flow comprising MaaS-based and conventional trips has emerged within transportation networks, leading to diverse behaviors among heterogeneous travelers. Given the coexistence of heterogeneous travelers during the promotion of MaaS, this paper investigates two distinct groups: travelers using MaaS subscription services (defined as “subscribed users”) and traditional travelers who rely on personal experience (defined as “decentralized users”). Accordingly, we propose a day-to-day and within-day bi-level dynamic traffic assignment model for heterogeneous travelers under the MaaS framework. By optimizing subscribed users’ travel decisions, this model assists urban planners in predicting the evolution of mixed traffic flows, enabling improved road resource allocation and subscription service mechanisms. For the day-to-day component, the model explicitly incorporates mode-switching behaviors among heterogeneous travelers. In the within-day context, departure time and route choices are considered, along with travel time costs and additional costs arising from early or late arrivals. Consequently, we propose a within-day, time-dependent traffic assignment model specifically tailored for heterogeneous users. For modeling subscribed users’ traffic assignment, we develop a system-optimal (SO) bi-level programming model aiming at minimizing the total travel cost. Furthermore, by integrating an improved Genetic Algorithm with the Method of Successive Averages (MSA), we introduce an enhanced IGA-MSA hybrid algorithm to solve the proposed model. Finally, numerical experiments based on the Nguyen–Dupuis network are conducted to evaluate the performance of the proposed model and algorithm. The results indicate that the network with heterogeneous MaaS users can reach a steady state effectively, significantly reducing overall travel costs. Notably, decentralized users rapidly shift towards becoming subscribed users, highlighting the attractiveness of MaaS platforms in terms of cost reduction and enhanced travel experience. Additionally, the IGA-MSA hybrid algorithm effectively decreases overall travel costs in the early evolution stages and achieves a more balanced temporal distribution of trips across the system, effectively managing congestion during peak periods.

1. Introduction

With the rapid development of urban transportation systems, congestion and environmental issues have become increasingly complex. Simultaneously, user behavior is becoming more personalized and diverse, making the description and prediction of traffic networks increasingly challenging [1]. To provide a more detailed description and prediction of time-varying traffic flows in transportation networks, dynamic traffic assignment (DTA) models have garnered sustained attention. These models focus on the adjustment processes of transportation systems from transient to steady states, the evolution of user choices, and the fluctuations in network adjustments over time [2,3].
DTA is widely regarded as the dynamic extension of the system optimal (SO) and user equilibrium (UE) principles, and it has been extensively studied [4]. Watling (1999) categorized DTA models into continuous-time and discrete-time models. Continuous-time models use ordinary differential equations to describe transient changes over short periods, while discrete-time models employ difference equations to capture variations in traffic flow and user choices over specific intervals (e.g., daily). Although continuous-time models are more convenient for stability analysis, their stability is often weaker compared to that of discrete-time models. Moreover, continuous-time models have been found to face issues associated with unrealistic travel adjustments in real-world scenarios [5,6,7,8,9,10,11]. Therefore, in DTA, discrete-time models are more appropriate and realistic for capturing day-to-day or time-specific variations in travel behaviors. Typically, DTA research divides temporal scales into within-day models and day-to-day models. Day-to-day models describe the evolution of traffic flows across multiple days, simulating how travelers adjust their travel choices based on experiences from previous days. These models focus on travelers’ day-to-day learning and adjustment behaviors, as well as the gradual progression of traffic systems toward steady-state or stable patterns over time. Within-day models, on the other hand, simulate traffic flow variations within a single day. They primarily focus on how travelers make travel decisions across different time periods within the same day, such as during peak morning or evening hours [3].
Existing day-to-day assignment models can be categorized into link-based models [12] and path-based models [5], based on the cause of traffic flow evolution. In terms of application scenarios, link-based models calculate link states using a series of consecutive static flow assignments, avoiding the need for predefined initial path flow patterns and path overlap issues [13,14]. In contrast, path-based models are more suited for planning and management under disruption scenarios. They provide information on traffic flow origins and simulate how travelers make route choices based on destinations, effectively capturing the process of path switching [15]. Based on whether the variables in the models are deterministic, they can be further classified into deterministic processes [16] and stochastic processes [13,17]. In deterministic processes, the traffic flow distribution in the next stage is uniquely determined by the current network state. Stochastic processes, on the other hand, are constructed based on stochastic process theory, where the traffic flow distribution in the next state depends solely on the probability distribution of the previous state. Stochastic processes better capture the dynamic behaviors and probabilistic fluctuations in traffic flow evolution by simulating the randomness in traffic demand and supply, making them more reflective of real-world variations. Therefore, stochastic processes were more applicable to the research presented in this study [18].
The aforementioned studies on day-to-day assignment models have primarily focused on travelers’ path choice behaviors and the daily adjustment of traffic flows. However, compared to within-day dynamic models, they have paid relatively less attention to refining departure time choices within a single day [2]. To model departure time choices on the demand side within a day, Bellei et al. (2006) categorized approaches into two main methods [19]. The first method treats departure time choices as discrete selections between time intervals, with each interval represented using static assignment methods. This approach is more suitable for single OD pair networks [20]. The second method jointly defines departure time and path choices as a finite, discrete set of alternative options. This approach is generally applied to small-scale transportation networks [21]. Cascetta and Cantarella (1991) assumed that users’ choices are based on information from several time periods within the same day and travel costs from previous days. They proposed a path-based within-day and day-to-day doubly dynamic model to describe network flow. However, their study focused on traffic flow variations within a single day and paid limited attention to the day-to-day variation of flows across time periods [22]. Bhat and Steed (2002) proposed a continuous-time hazard duration model for departure time choices in urban shopping scenarios. However, this model lacked a consideration of path choices [23]. Srinivasan and Guo (2003) incorporated travelers’ departure time choices into traffic flow evolution but did not account for the influence of path choices [24]. Xiao and Lo (2016) developed a Bayesian update-based learning model to acquire travel information to guide travelers’ departure time choices. However, this model only considered departure time selection [25].
These existing studies highlight the following limitations: (1) Within-day and day-to-day models often emphasize different aspects. In doubly dynamic network flow evolution models, research typically focuses on within-day traffic flow variations or incorporates temporal effects into daily travel utility. However, there is limited refinement of departure time considerations and insufficient analysis of the day-to-day evolution of traffic flows across specific time periods. (2) Most studies have focused on traditional travel models or homogeneous user systems. However, in the context of customized or pre-scheduled travel modes, mixed traffic (involving travelers with different psychological preferences) often occurs. This leads to behavioral heterogeneity in transportation networks, which has been insufficiently explored in existing research.
MaaS is a user-centric platform that integrates multimodal travel information to provide convenient and customized travel solutions via a unified application interface [26]. Users simply input their origin, destination, desired arrival time, and transportation preferences into the platform. The system then dynamically generates an optimal travel plan by considering real-time traffic conditions and the operational status of various transportation modes. This study extended the traditional MaaS concept, which primarily focuses on public transportation, to include private car travel. This not only provided users with real-time traffic updates as a reference but also guided user behavior at a system level through optimized departure times and route allocations. Furthermore, studies on personalized subscription services have increasingly focused on the diverse travel behaviors of users with varying socioeconomic and travel characteristics, particularly differences in travel needs, preferences, and income levels [27,28,29]. Farahmand et al. [30] indicated that elderly and retired populations are relatively less receptive to MaaS services, tending to favor existing transportation modes, whereas younger users exhibit stronger acceptance and willingness to utilize such services. Similarly, Caiati et al. [31] observed that individuals with higher income and educational levels show a greater willingness to adopt MaaS travel services. Butler et al. [32] found that family structure significantly influences service adoption rates; households with multiple children or high driving license ownership display lower participation enthusiasm due to inertia associated with established travel habits. Additionally, regarding travel behavior inertia, scholars suggest from a real-time travel information perspective that timely traffic updates can enhance users’ confidence in avoiding peak-hour congestion, and users with better access to travel information are more likely to choose alternative routes and departure times to circumvent congestion [33]. These findings imply that exploring intrinsic motivational factors—such as environmental awareness, personal interest, and rewarding travelers’ social contributions toward congestion reduction—may foster a sense of accomplishment, psychologically transforming commuting into an engaging activity and potentially leading to sustained attitude and behavioral changes. The variance in travel decisions thus results in differing degrees of acceptance toward MaaS platforms among various traveler groups. At the conclusion of each period (e.g., daily), some travelers reconsider their continued use of MaaS based on their travel experiences. Consequently, transportation network conditions become increasingly complex, evolving into hybrid networks characterized by travelers with diverse preferences and intentions. However, existing studies have predominantly analyzed MaaS adoption through user acceptance surveys or pilot project statistics, with limited research on long-term traffic flow evolution in mixed heterogeneity networks. Against this backdrop, this study investigated the day-to-day route choice interactions between UE and SO travelers to better reflect real-world travel scenarios. Specifically, for private car travel, all travelers were allowed to freely decide whether to subscribe to the MaaS platform. Travelers were categorized into two groups: “Subscribed users”, who accepted platform-optimized departure times and routes based on the system optimal principle, and “decentralized users”, who relied on personal experience to choose their departure times and routes. The MaaS platform provides systematic solutions, including route planning and departure time arrangements, which can effectively reduce travel time and costs. It also enables flexible adjustments during peak times or under specific traffic conditions, improving overall convenience and comfort. This not only better meets individual needs but also optimizes transportation networks as a whole [34,35]. To explore the long-term impact of the MaaS platform on network performance, its sustained appeal to users, and the day-to-day and within-day behavioral changes of heterogeneous users in a mixed traffic network, we adopted a doubly dynamic framework for network flow evolution. The within-day dynamic model captured both route and departure time choices, while the day-to-day dynamic model simulated the inter-day evolution of traffic flows from non-equilibrium to equilibrium states. Together, they offered a comprehensive understanding of traffic flow evolution and optimization strategies.
In constructing the SO assignment model targeting subscribed users, this research addresses not only the multi-dimensional allocation of travel demands across different time periods, routes, and OD pairs but also further refines traffic flow assignments to each specific link at every time interval. Given its high-dimensional nature, the problem exhibits complex nonlinear constraints and objective functions, categorizing it as a typical NP-hard combinatorial optimization problem. Traditional methods often suffer from low computational efficiency in handling such issues; hence, heuristic algorithms are introduced in this study to facilitate effective problem-solving. Genetic Algorithm (GA), an optimization technique inspired by biological evolution, encodes the complex solution space into chromosome-like structures and simulates the evolutionary principle of natural selection—“survival of the fittest”. The core mechanisms of GA involve recombining high-quality chromosome segments through crossover operations and introducing genetic mutations, gradually converging toward the global optimal solution over successive generations [36]. Due to its robust global search capabilities and flexibility, GA is widely employed in addressing high-dimensional combinatorial optimization problems. Nonetheless, traditional genetic algorithm (TGA) algorithms exhibit certain limitations, including sensitivity to parameter settings and weak local search abilities, leading to premature convergence and potential entrapment in local optima due to repeated selection of a limited set of individuals during iteration processes [37]. To overcome these limitations, various improved techniques are frequently integrated into optimization problems within the transportation field. For instance, to mitigate slow convergence resulting from randomly initialized GA populations, researchers have adopted methods such as ordered distance vectors [38], linear regression analysis [39], and nearest neighbor greedy algorithms [40], enhancing population diversity and convergence speed. Fixed crossover and mutation parameters significantly contribute to the slow evolution of GA algorithms. To address this, Masmoudi et al. [41] proposed a hybrid genetic algorithm incorporating local search capabilities for rapid initial solution optimization; Zhang et al. [42] adaptively adjusted crossover and mutation probabilities based on K-means clustering analysis of the solution distribution. Additionally, researchers have further strengthened the local search performance of GA by introducing local optimization operators [43] or dynamic population adjustment strategies [44]. Meanwhile, hybrid intelligent optimization methods represented by reinforcement learning have emerged in recent years. For example, Zhao & Zeng proposed a hybrid algorithm combining GA and simulated annealing (SA), achieving significant success in practical large-scale transportation network optimization problems [45]. Although machine learning (ML) approaches facilitate complex network traffic prediction and real-time optimization through training historical or simulation data, purely data-driven models encounter certain practical limitations. Firstly, model uncertainty is relatively high, especially under conditions of limited or shifted training data distributions, necessitating consideration of uncertainties in model performance during applications [46]. Secondly, as black-box models lack underlying physical principles, ML methods exhibit deficiencies in interpretability and controllability, necessitating the integration of physical information or engineering prior knowledge [47]. Given this analysis, this research scenario necessitates strict compliance with physical constraints, such as flow conservation and link capacity, while mitigating the potential risks of overfitting inherent in data-driven models, especially with limited user data in the initial stages. Therefore, this study adopts comprehensive enhancements to the traditional GA algorithm combined with the MSA for problem-solving. Specific improvements include employing dynamic multi-point and arithmetic crossover operations to enhance population diversity, polynomial mutations with dynamic mutation probabilities to improve the algorithm’s search capability in boundary and sparse regions, and a combined elite selection and roulette wheel strategy to retain superior individuals. These strategies ensure an effective balance between global exploration and local exploitation, thereby effectively reducing overall system travel costs while preserving subscribed users’ travel experience.
The main contributions can be summarized as follows:
(1) This study develops a day-to-day and within-day bi-level dynamic traffic flow evolution model to investigate the travel behaviors of heterogeneous travelers under the MaaS framework. In the within-day assignment models, the selection of travel paths and departure times across multiple OD pairs is considered. Specifically, a SO bi-level programming model for subscribed users and a UE model for decentralized users’ departure time and route choices are constructed. The day-to-day assignment models incorporate travelers’ daily travel choices driven by different psychological factors and consider the transitions among heterogeneous travelers with varying proportions within the transportation network, resulting in a heterogeneous traveler flow-shift model.
(2) The traffic assignment model for subscribed users is decomposed into a bi-level structure, for which an improved IGA-MSA algorithm is proposed. The improved Genetic Algorithm is utilized to determine the travel flow assignments at each departure time, while the MSA allocates the subscribed users’ travel demands onto specific paths. This combined approach effectively addresses the complex traffic assignment issue involving multiple OD pairs, departure times, and travel paths.
The rest of this paper is organized as follows: Section 2 introduces the problem description; Section 3 discusses the formulation of the day-to-day and within-day dual dynamic flow model for heterogeneous travelers, as well as the solution approach for subscribed user flow assignment; Section 4 evaluates the performance of the model and solution method through numerical experiments; finally, Section 5 provides a summary of this study and discusses future work.

2. Problem Description and Preliminary Model

In complex urban transportation systems, private car travel often suffers from issues such as asymmetric information access and uneven traffic resource distribution. If unexpected incidents or congestion occur during a trip, it is difficult for drivers to promptly switch to alternative routes or off-peak options, making it challenging to ensure a high on-time arrival rate and make optimal travel decisions. One-stop travel platforms based on the MaaS concept offer significant advantages. As illustrated in Figure 1, the conceptual model of heterogeneous user travel behavior under the MaaS framework shows that private car travel can also receive travel plan recommendations, similar to multimodal public transportation. We assume all travelers have the freedom to decide whether to subscribe to the platform’s travel services. Consequently, we classify travelers in the transportation network into two categories: “subscribed users”, who opt to accept the MaaS platform’s systematic planning of departure times and travel routes according to system-optimal principles, and “decentralized users”, who prefer traveling by private car and independently determine their departure times and travel routes based on personal experience. Before traveling, subscribed users can input their origin, destination, planned departure time, and preferences (e.g., cost or comfort) into a mobile or in-vehicle application. The platform service provider combines user navigation software data and government-provided traffic monitoring data with real-time monitoring and historical traffic records. Using analytical and predictive techniques, the platform generates optimized routes and departure times for users. In contrast, decentralized users, who do not subscribe to MaaS services, are limited by their information processing capabilities and rely more on personal experience or general navigation software for travel decisions. Since travelers aim to maximize their individual travel benefits when selecting departure times and routes, this often results in vehicle congestion during peak times or on crowded roads, increasing travel times and the risk of delays. In such scenarios, decentralized users may compare their travel experiences to those of subscribed users at the end of each day. If they observe that subscribed users benefit from better congestion avoidance or higher travel reliability, they may reconsider their travel choices and opt to try MaaS services. This, in turn, drives the expansion of subscriber user bases.
Based on the above discussion, we identified several unresolved issues. The first proposed resolution is an overall framework for a day-to-day travel choice model for heterogeneous users under the MaaS framework. This model aims to describe traffic flow evolution and the stability of mixed traffic systems. In the day-to-day travel choice behaviors of heterogeneous users, travelers decide whether to use MaaS platform services based on personal preferences and prior travel experiences before departure. The second issue involves devising a daily travel plan for each user, considering both departure time and route selection. In this regard, this paper proposes a within-day dynamic traffic assignment model tailored for daily peak travel periods. This model provides subscribed users with personalized travel plans, ensuring the highest on-time arrival probability and minimizing total system travel times.
To study the evolution of network traffic flow under the influence of different user behaviors and psychological factors, we assumed that decentralized users, who choose not to join the platform, exhibit bounded rationality and habitual dependency. Decentralized users can access travel times for various routes during their departure period and use historical travel information as experience. If the estimated travel time for their chosen departure time and route exceeds a certain psychological threshold, they may abandon that route. To mitigate the travel risks caused by network randomness and ensure a certain on-time arrival probability, decentralized users adjust their departure times and routes daily, based on prior travel outcomes. For subscribed users, we assumed that they strictly followed the platform’s planned departure times and route allocations each day. The platform, in turn, generates travel plans based on the SO principle, aiming to meet users’ on-time arrival requirements as much as possible.
As shown in Figure 2, this study developed a doubly dynamic within-day and day-to-day traffic assignment model for heterogeneous users. The within-day component described the daily departure time and route choice dynamics of the two user groups. Before each day’s travel began, the initial traffic flows of decentralized users and subscribed users were fixed. Decentralized users generated their perceived travel times for the day based on historical travel times and selected the departure time and route they believed offered the highest on-time arrival probability. Once decentralized users finalized their travel plans for the day, the platform collected the number of subscribed users and their travel demands for the day. Using the decentralized users’ traffic distribution as a baseline, the platform assigned departure times and routes for subscribed users across OD pairs, with the dual objectives of maximizing on-time arrival reliability and minimizing total system travel costs. After completing daily travel, the platform compiled and published the day’s travel data. All users evaluated their travel experiences and historical travel data to decide whether to switch their travel mode for the next day. The relevant definitions were as follows: G = N , A , where N represents the set of nodes and A is the set of links, with each link a A ; the set W represents the collection of OD pairs corresponding to w , where w W ; and q w represents the traffic flow between OD pair w . Let T a denote the travel time variable for link and t a be the travel time for link. Similarly, let C a represent the capacity variable for link and c a be the capacity of link. The departure time domain for each day was defined as T 1 , T 2 , divided into m equal time intervals, each with a duration denoted by Δ T . The travel time was estimated as t b .

3. Dual Dynamic Departure Time and Route Choice Adjustment Model for Heterogeneous Users

3.1. Within-Day Traffic Adjustment for Heterogeneous Users

3.1.1. Subscribed User SO Model

When constructing the SO flow assignment model for subscribed users, the platform had to reasonably allocate the travel demands of each OD pair across different departure time periods while ensuring user requirements for on-time arrival probability were met. Within each departure time period, route assignments were determined based on the SO principle. These decisions affected the travel utility of subscribed users, making it a complex optimization problem. If a single model was used to directly solve the joint “time-path” decision in one step, the scale and complexity of the model would increase significantly, making it prone to becoming stuck in local optima or becoming difficult to solve. Therefore, an iterative mechanism was required to gradually approach a feasible or optimal solution. In this study, this problem was formulated as a bilevel programming model. The upper-level model calculated the travel utility of subscribed users for each OD pair, considering differences in acceptable arrival time ranges. It ensured that users were allocated to feasible time periods with high on-time arrival probabilities while minimizing total system travel costs. The lower-level model took the time-specific OD pair travel demands determined by the upper-level model and, considering the road network’s segment capacity, time-varying flow characteristics, and user volume at each moment, assigned the travel demand q m S d to paths based on the SO principle. The lower-level model then returned the travel times and total travel costs for each path and time period. The upper-level model used this feedback to update its demand allocation scheme. This process was iterated until a relatively stable solution was achieved at both the time allocation and path selection levels.
For the upper-level model, we used the travel time costs and arrival status utility of subscribed users as quantitative metrics. Drawing on the theory of mental accounting, we constructed perceived travel costs from two dimensions: travel times and travel outcomes. A generalized function was applied to calculate the travel utility of these two modes, unifying arrival status and travel time into a single quantitative measure for weighted utility computation. In travel decision-making, users value not only travel time but also the outcome of their arrival. Accordingly, we imposed constraints on users’ late and early arrival states.
On day d , the scheduled on-time arrival was set as T r S , while the actual arrival time was T k m S ( d ) . The bounds for early arrival and late arrival were t e S and t l S , respectively. Using T r S as the reference for on-time arrival, the allowable early arrival time was T r S t e S and the allowable late arrival time was T r S + t l S . The cost function v arrived was provided for the psychological account of arrival states.
The objective function was formulated as follows:
min w k i = 1 m c S d = v travel t w k m S d + μ S v arrived T w k m S ( d ) q w k m S d
Furtherly , v arrived T k m S ( d ) = λ 1 T r S t e S T k m S ( d ) α 1 T k m S ( d ) T r S t e S λ 2 T k m S ( d ) T r S t e S α 2 T r S t e S < T k m S ( d ) T r S λ 2 T r S + t l S T k m S ( d ) α 2 T r S < T k m S ( d ) T r S + t l S λ 3 T k m S ( d ) T r S + t l S α 3 T r S + t l S < T k m S ( d )
v t r a v e l t w k m S d = v a l × t w k m S d
w W ,   T s t S d < T r S d
q w k S d = i = 1 m q w k m S d
where q w k m S d is the target variable in the objective function of the lower-level model. It was generated from the heterogeneous user day-to-day adjustment model for the daily total subscribed user volume q w k S d , which was further processed by the upper-level model algorithm. This variable represented the subscribed user flow departing at time m on path k for OD pair w . Additionally, μ S represents the weight of the arrival status utility for subscribed users, while v a r r i v e d T k m S ( d ) denotes the arrival status utility for subscribed users based on their required arrival times. The function included penalties for exceeding the maximum tolerable times and benefits within the acceptable time window, where v t r a v e l t w k m S d represents the travel time cost for subscribed users traveling on path k on day d and v a l represents the value of travel time for car users.
In the lower-level model, based on the departure time allocation scheme determined by the upper-level model for each departure time and given the travel flow of decentralized users on each path at each departure time on day d , the subscribed users distributed traffic flow according to the SO principle.
To establish the objective function with the goal of minimizing the total system travel time, the expression was as follows:
min   Z S O = a A i = 1 m q a m S d × t a m d s . t .   k i = 1 m q w k m S d = q w S d k q w k m S d = q w m S d q a m S d = w k q w k m S d a k w q a m D d = w k q w k m D d a k w q w k m S d 0 , q w m S d 0 , q a m S d 0 T w k m S d = T s t S d + t w k m S d
t a m d = t a 0 1 + 0.15 q a m S d + q a m D d C a 4
where q a m S d and q a m D d represent the traffic flow on link a during time period m on day d for subscribed users and decentralized users, respectively, t a m d represents the travel time on link a during time period m , and a k w is the relationship coefficient between links and paths. If link a is part of path k connecting OD pair w , then a k w = 1 ; otherwise, a k w = 0 . Additionally, t a m d represents the travel time on link a , which was calculated using the BPR function.

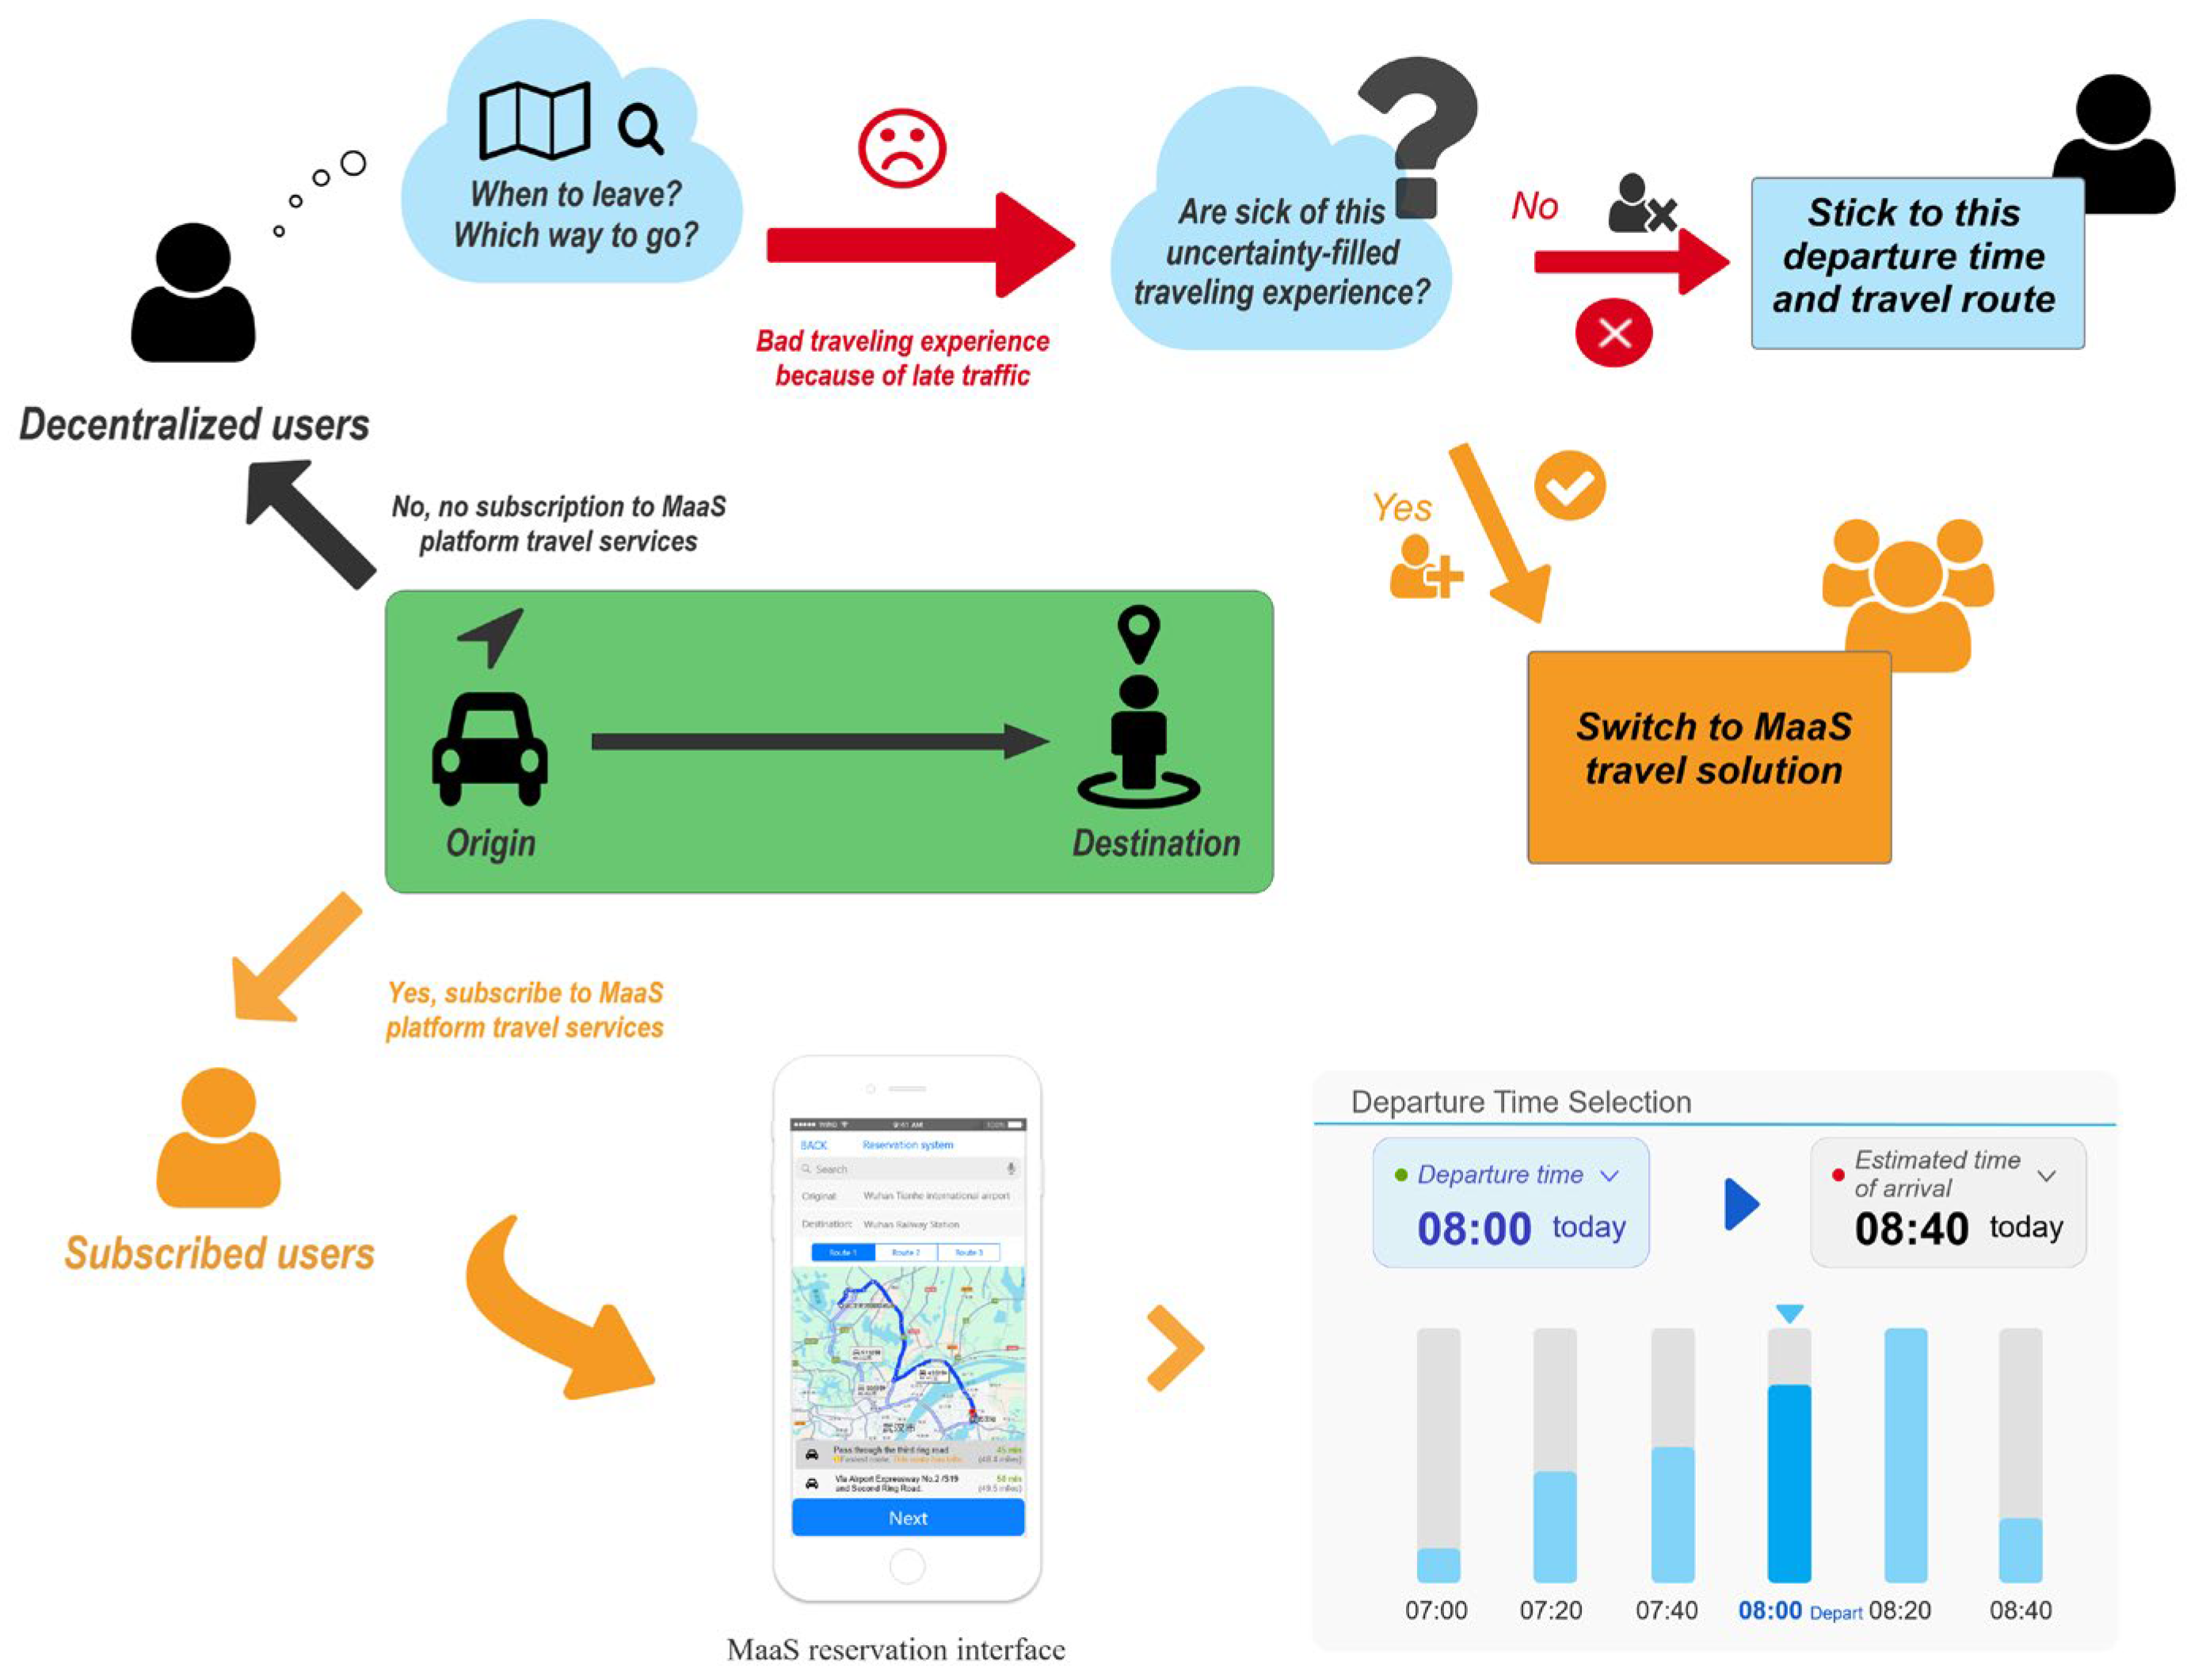
3.1.2. Decentralized Users’ Experience-Based Travel Model

After completing the day-to-day travel layer from the previous day, the two user groups underwent role transitions, resulting in the total number of decentralized users for the new day. This group included both users who were originally decentralized and those who transitioned from subscribed users. Based on this, for the combined group of subscribed users, the decentralized users’ experience-based travel model was used at the within-day level to update their departure time and route choices. It is important to note that, in this model, we did not track the travel behaviors of individual users in detail. Instead, the observed daily travel times were treated as perceived impedance at the path level, which was updated to reflect the users’ experience accumulation and bounded rationality in decision-making.
  • Departure time adjustment
Specifically, to simulate the dynamic traffic fluctuations caused by time-varying travel characteristics of links and paths during peak periods, the central limit theorem was applied. It was assumed that the travel times on links and paths approximately followed the normal distribution T k m ~ D τ k m , σ k m , where τ k and σ k represent the mean and variance of the travel time distribution function for path k , respectively. After traveling on day d 1 , decentralized users updated their travel experience based on the historical data collected for that path, including on-time arrival status and travel time distribution. They adjusted their departure times with the primary objective of maximizing the probability of on-time arrival. Therefore, decentralized users updated the parameters of the normal distribution for travel time on path k on day d based on data from day d 1 :
τ k m d = τ k m d 1 × d 1 + t k m d 1 d
σ k m d 2 = σ k m d 1 2 × d 1 + t k m d 1 τ k m d 1 2 d
When d = 2 , the free-flow travel time t k m f r e e for path k was used to represent the distribution parameters of the path on day d 1 : τ k m 1 = t k m f r e e ; σ k m 1 = 0 .
To adapt to road network fluctuations and ensure the reliability of individual travel plans, decentralized users selected a departure time T s t D d 1 on day d 1 based on the latest estimated time distribution and calculated a travel time budget t b D ( d 1 ) = T r D T s t D d 1 . The expressions for on-time arrival probability (Equation (10)) and the probability Z , calculated using the cumulative distribution function of travel time on the path (Equation (11)), were as follows:
Z = P R ( t b D ( d 1 ) t e D t k m D ( d 1 ) t b D ( d 1 ) + t l D )
Z = P R ( t b D ( d 1 ) t e D t k m D ( d 1 ) t b D ( d 1 ) + t l D ) = Φ ( t b D ( d 1 ) + t l D τ k m D ( d 1 ) σ k m D d 1 ) Φ ( t b D ( d 1 ) t e D τ k m D ( d 1 ) σ k m D d 1 )
Decentralized users adjusted their departure times based on the previous day’s flow distribution q w k m D d 1 and changes in on-time arrival probability. This adjustment followed the principle of maximizing on-time arrival probability, while also considering user preferences for minimizing late or early departures. We assumed the following conditions:
① The average on-time arrival probability for each route exceeded the acceptable threshold Z m 2 d Z m 1 d 1 η 1 .
② The adjusted departure times fell within the fixed permissible range m 1 m 2 × Δ T η 2 .
Under these assumptions, decentralized users could shift departure flows from time interval m 1 to m 2 to maximize on-time arrival rates for their selected departure time. The flow transfer model was then established as follows:
The flow exchange of departure times between two consecutive days was as follows:
q w k m 1 D d = q w k m 1 D d 1 + F q w k m 1 D ( d 1 )
The flow transfer equation for each time interval was as follows:
F q w k m 1 D ( d - 1 ) = 0 , m 1 m 2 × Δ T η 2 m 1 , m 2 δ 1 × max Z m 2 d Z m 1 d 1 η 1 , 0 m 1 m 2 × Δ T × q w k m 1 D d 1 , m 1 m 2 × Δ T η 2
where F q w k m 1 D ( d 1 ) represents the transferred flow, adjusted based on the flow distribution on day d 1 ; δ 1 denotes the departure time transfer coefficient; η 1 represents the acceptable threshold of the on-time arrival probability for decentralized users; η 2 represents the acceptable range of early departure adjustments for decentralized users. The term max Z m 2 d Z m 1 d 1 η 1 , 0 indicated that, when the on-time arrival probability exceeded the threshold η 1 , departure times were adjusted, with greater adjustments made as the threshold was exceeded by a larger margin. The term m 1 m 2 Δ T represented the time difference between departure times, with larger time differences leading to smaller transfer coefficients.
2.
Travel route adjustment
Decentralized users observed the actual travel time t w k m ( d 1 ) on route k on day d 1 . Based on travel experience, they sought to select routes with shorter travel times. The expression for route selection was given as follows:
t w k m ( d ) = υ × t w k m ( d 1 ) + ( 1 υ ) × t w k m ( d 1 ) , 0 υ 1
π P j = exp ln P j γ , j = 1 , 2 , 3 , 4
P F k m d 1 = j = 1 , 4 v t w k m ( d 1 ) π P j
P 1 = Φ t b D d 1 t e D τ k d 1 σ k d 1 , P 2 = Φ t b D d 1 τ k d 1 σ k d 1 Φ t b D d 1 t e D τ k d 1 σ k d 1 P 3 = Φ t b D d 1 + t l D τ k d 1 σ k d 1 Φ t b D d 1 τ k d 1 σ k d 1 , P 4 = 1 Φ t b D d 1 + t l D τ k d 1 σ k d 1
Equation (14) represents the updated perceived travel time function for decentralized users on day d , where υ is the learning parameter. Equations (15) and (16) show the cost function v arrived based on the perceived utility of the arrival status, providing a weight adjustment function π ( ) and the prospect value calculation formula for each route. Equation (17) represents the updated travel time function for route k based on decentralized users’ perceptions, with v arrived containing the probabilities of four possible events.
The decentralized user path flow shift model could then be formulated as follows.
The path flow exchange was described as follows:
q w k m D d = q w k m D d 1 + F q w k m D d 1
The calculation of flow shift was given by the following:
F q w k m D d 1 = k 1 , k 2 δ 2 max P F k 1 m q w k m D d 1 P F k 2 m q w k m D d 1 η 3 , 0 q w k m D d 1 Δ k 1 k 2
where q w k m D d represents the flow distribution on the path on day d ; F q w k m D d 1 indicates the flow shift from day d 1 to day d ; δ 2 is the proportional coefficient of the path flow shift; η 3 describes the tolerance level of users to changes in path conditions, reflecting users’ path selection behavior under limited rationality.

3.2. The Day-to-Day Flow Adjustment Model Among Heterogeneous Users

In the previous section, a corresponding model was developed to address the issues of departure time and route choice at the single-day scale, describing the traffic flow allocation and dynamic evolution of subscribed users and decentralized users at the within-day level. However, in real traffic environments, travelers’ decisions are not limited to adjustments within a single day; they are also influenced by the previous day’s travel experiences and the system’s state, leading to comprehensive adjustments in travel modes and strategies for the next day. Therefore, this section introduces the day-to-day flow adjustment model to describe the behavior transitions of the two user groups over multiple days and the mechanism for redistributing total traffic flow. Specifically, in the MaaS environment, each user evaluated their travel utility (e.g., actual commute time, congestion level and on-time arrival probability) based on the allocation results of day d and then decided whether to continue using the MaaS platform on day d + 1 . After completing the role transition, a new user composition ratio was formed. To reflect the bounded rationality of users, heterogeneous users transitioned according to a predefined conversion ratio and the final step involved calculating the number of users choosing each travel mode for each OD pair.
c w k m S d = w k i = 1 m v t r a v e l t w k m S d + μ S v a r r i v e d T w k m S d q w k m S d
c w k m D d = w k i = 1 m v t r a v e l t w k m D d + μ D v a r r i v e d T w k m D d q w k m D d
Δ q w k m S D ( d ) = max δ 3 c w k m S ( d ) c w k m D ( d ) η 4 / c w k m S ( d ) , 0 q w k m S ( d )
Δ q w k m D S ( d ) = max δ 4 c w k m D ( d ) c w k m S ( d ) η 5 / c w k m D ( d ) , 0 q w k m D ( d )
q w k m S ( d + 1 ) = q w k m S ( d ) + Δ q w k m D S ( d ) Δ q w k m S D ( d )
q w k m D ( d + 1 ) = q w k m D ( d ) + Δ q w k m S D ( d ) Δ q w k m D S ( d )
where Δ q w k m S D ( d ) and Δ q w k m D S ( d ) represent the path flow shifts from subscribed users to decentralized users and from decentralized users to subscribed users, respectively; the tolerance values η 4 and η 5 , along with the shift adjustment coefficients δ 3 and δ 4 , regulate the extent of these flow shifts; q w k m S ( d + 1 ) and q w k m D ( d + 1 ) denote the initial path flows for subscribed and decentralized users, respectively, on path k at time m for OD pair w on day d + 1 , before any flow adjustment.

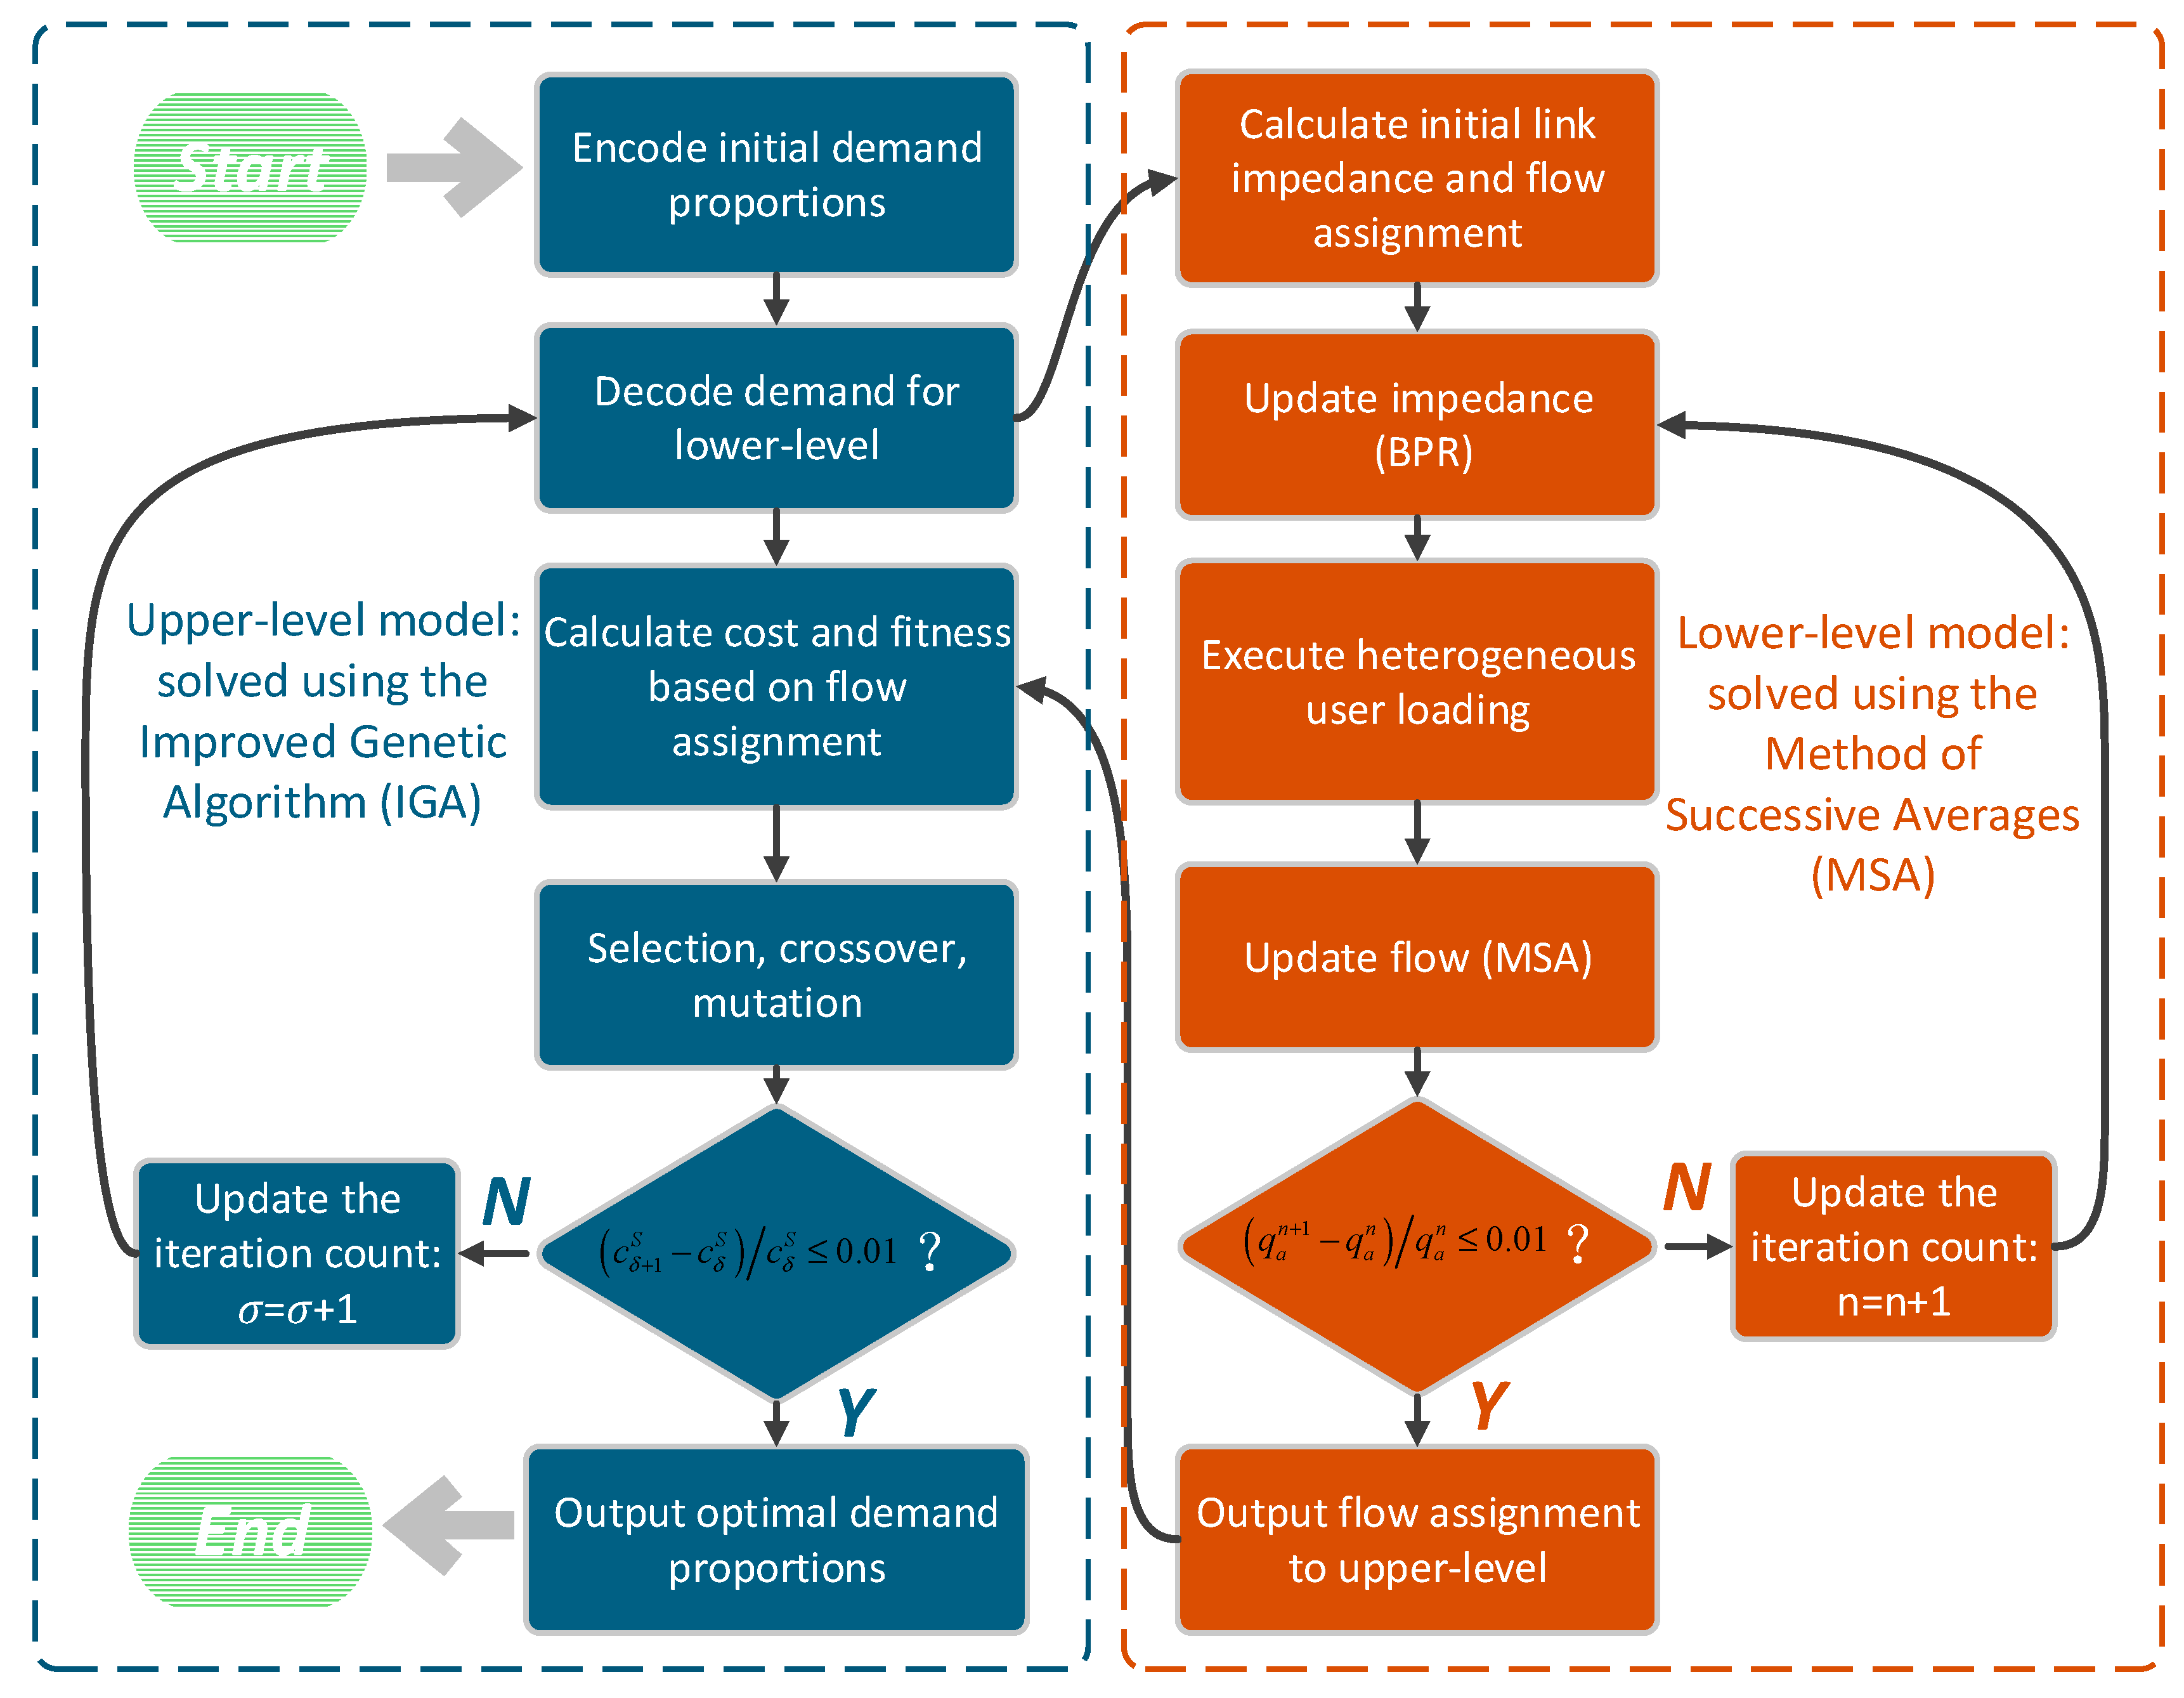
3.3. IGA-MSA Hybrid Algorithm

As shown in Figure 2, the algorithm framework developed in this study was an IGA-MSA nested algorithm, which aimed to solve the subscribed users’ SO bilevel model. First, the upper-level model used the IGA to generate and iteratively optimize candidate solutions, representing the allocation ratios of subscribed users’ demand across different departure periods. After decoding the candidate solutions, the corresponding travel demand q w m S for each time period was input into the lower-level model for path flow assignment. The lower-level model applied the MSA algorithm to assign flows based on q w m S , dynamically updating the link impedance, gradually converging, and then outputting the total system travel times. Subsequently, the upper-level model calculated the fitness f S based on the feedback c S , iteratively adjusting time allocation and network flow control to produce better time period allocation schemes until the convergence criteria were met, ultimately outputting a globally approximate optimal solution (Figure 3).

3.3.1. The Upper-Level Algorithm

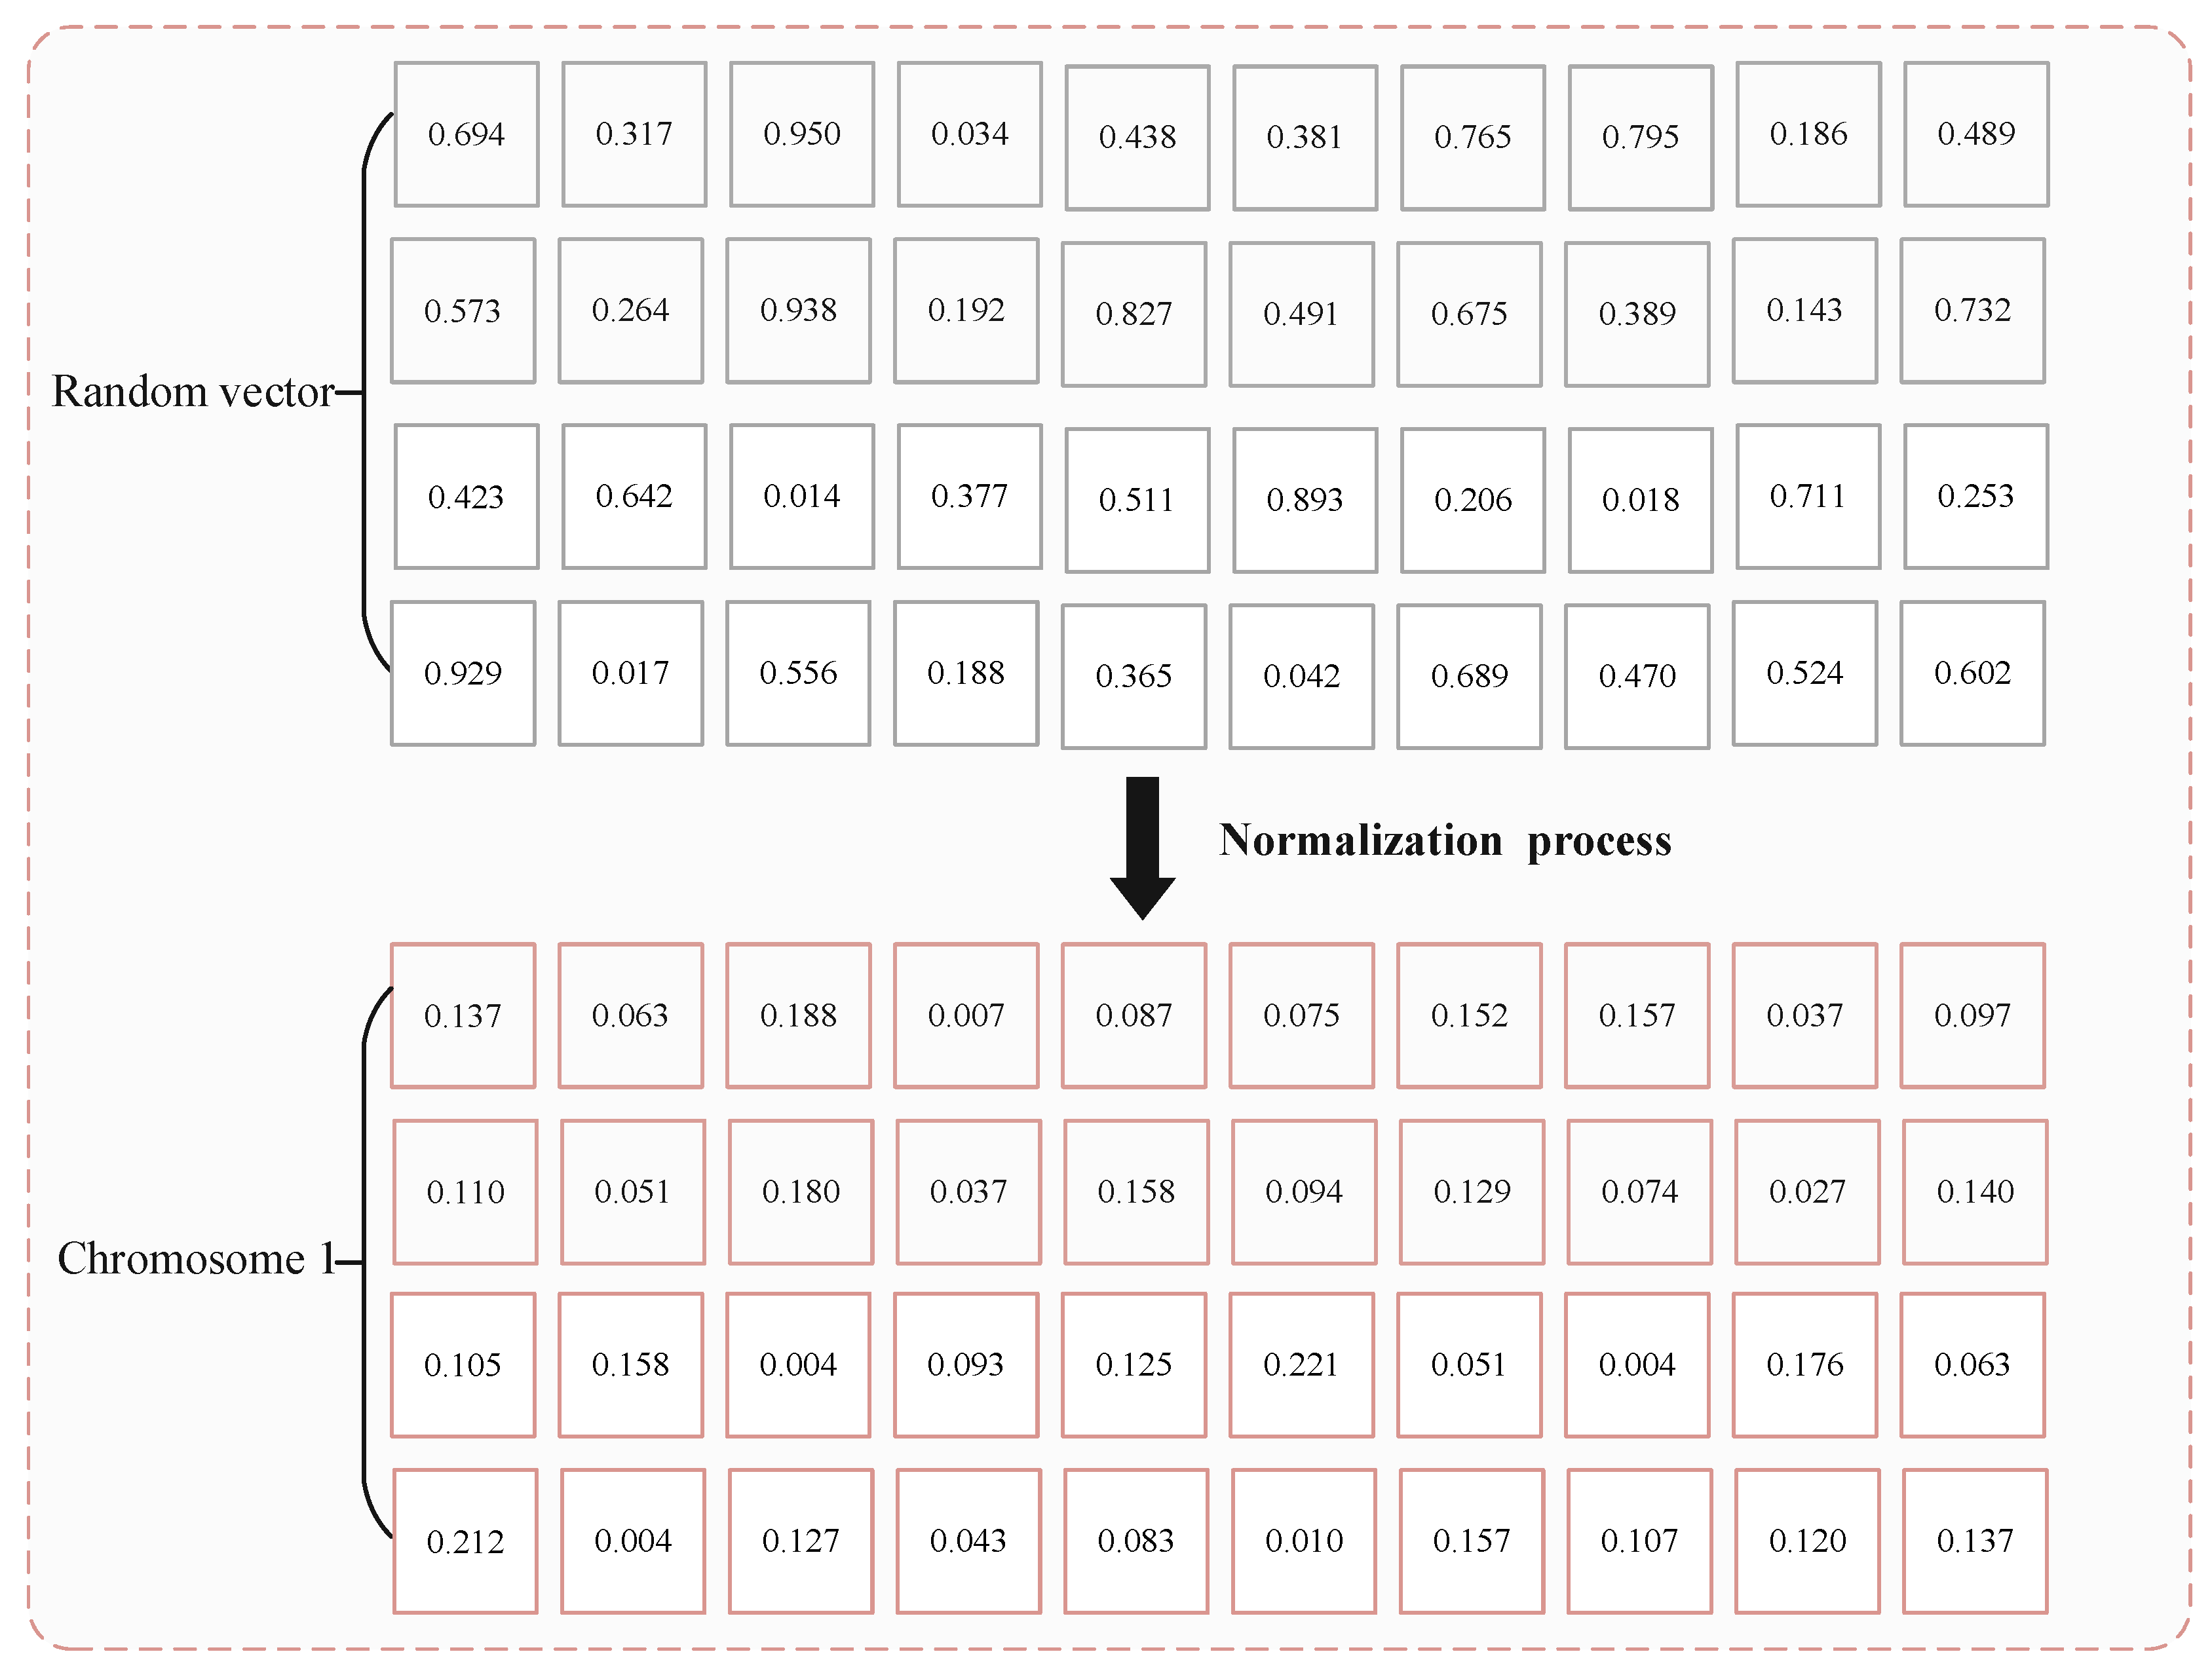
  • Chromosome representation and initial population generation
The encoding method for the solution in this study used real number encoding. The proposed model allocated travel demand proportionally across X departure times and PPP OD pairs. Each day, the demand across X departure times formed an Χ P -dimensional vector within a real number range, representing a feasible solution.
The allocation ratio q w m S for the travel demand of subscribed users across different time periods was set as a candidate solution. For example, with 10 departure times and 4 OD pairs, a random solution vector of length 40 was generated. The allocation ratio range for subscribed users travel demand was fixed to [0,1]. The values were floating-point numbers within [0,1], such as the following random vector:
[0.694, 0.317, 0.950, 0.034, 0.438, 0.381, 0.765, 0.795, 0.186, 0.489;
0.573, 0.264, 0.938, 0.192, 0.827, 0.491, 0.675, 0.389, 0.143, 0.732;
0.423, 0.642, 0.014, 0.377, 0.511, 0.893, 0.206, 0.018, 0.711, 0.253;
0.929, 0.017, 0.556, 0.188, 0.365, 0.042, 0.689, 0.470, 0.524, 0.602]
The generated vector was then normalized in groups of 10 numbers each, resulting in a solution for the subscribed users’ travel demand allocation scheme across 40 time periods, as follows:
[0.137, 0.063, 0.188, 0.007, 0.087, 0.075, 0.152, 0.157, 0.037, 0.097;
0.110, 0.051, 0.180, 0.037, 0.158, 0.094, 0.129, 0.074, 0.027, 0.140;
0.105, 0.158, 0.004, 0.093, 0.125, 0.221, 0.051, 0.004, 0.176, 0.063;
0.212, 0.004, 0.127, 0.043, 0.083, 0.010, 0.157, 0.107, 0.120, 0.137]
The randomly generated population was initialized with a size of N , with the chromosome length set to Χ P . The maximum count of iterations was set to 100 and the initial count of iterations was ω = 1 (Figure 4).
2.
Fitness function
The fitness value f S of a chromosome was the criterion for evaluating its quality; the higher the fitness value, the more likely the chromosome would be inherited by the next generation. This study comprehensively considered the departure time and route allocation problem for subscribed users across multiple OD pairs, aiming to minimize the total system travel costs of travel plans provided by the platform. Since the travel plans for subscribed users were allocated based on the determined travel behaviors of decentralized users, the solution sought to minimize the total travel cost c S for subscribed users. To fit the algorithm’s mechanism, the minimization problem was transformed into a maximization problem and this study used an inverse function to design the fitness value function:
f S = 1 c S
3.
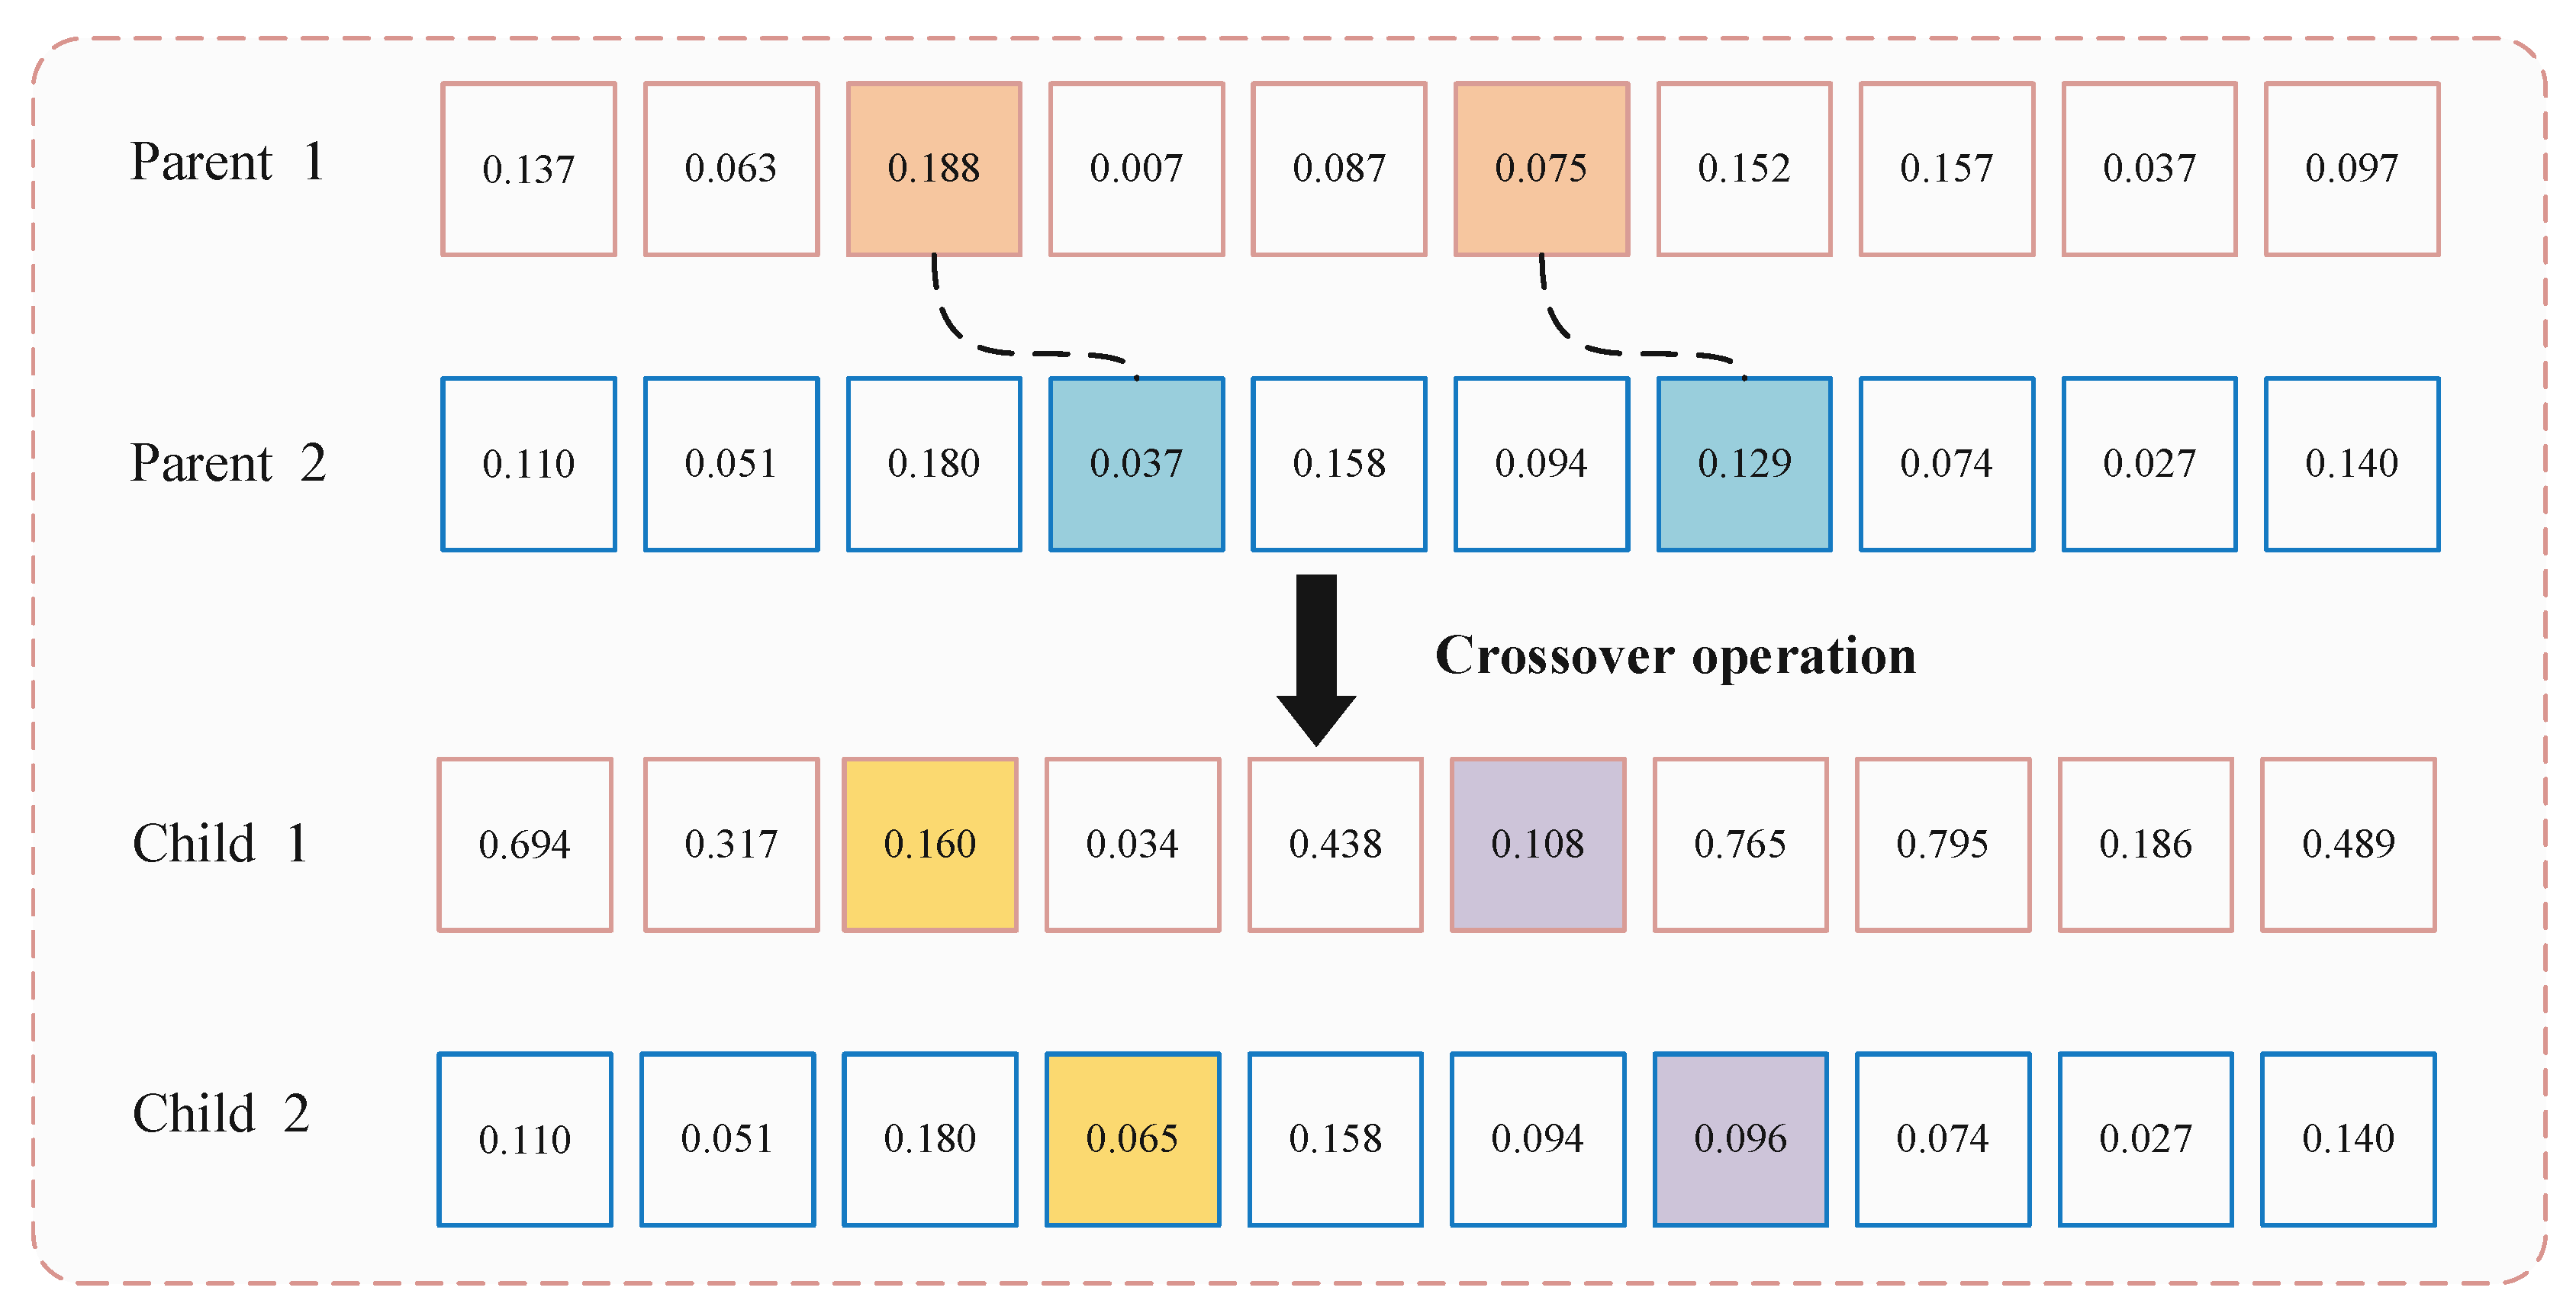
Crossover operations
The crossover method combines multipoint crossover with arithmetic crossover, with the crossover probability set to 0.9 (Figure 5). Figure 5 illustrates the crossover operation in the genetic algorithm. Two parent chromosomes, Parent 1 and Parent 2, are selected, and the crossover points are randomly determined. As highlighted in orange and blue, the selected crossover points represent the segments to be exchanged between the two parents. After the crossover operation, two child chromosomes are generated. In Child 1, the newly inherited gene values at the crossover points are marked in yellow, while in Child 2, the corresponding new values are highlighted in purple, indicating the updated gene segments derived from the crossover process. Arithmetic crossover involves determining the corresponding genes of two parent chromosomes for crossover and performing a weighted average based on a certain ratio. This method retains partial information from the parent chromosomes, ensuring higher search efficiency and faster convergence. Multiple random integers within the interval [ 1 , Χ ] are initially generated to determine the positions of the crossover genes. The genes at these positions are exchanged using arithmetic crossover followed by normalization. Let x i ω 1 and x i ω 2 represent the i-th genes of the two chromosomes to be crossed and let κ be a uniformly sampled random number within the interval 0 , 1 . The formula for the crossover is then as follows:
x ¯ i ω 1 = κ x i ω 1 + 1 κ x i ω 2 x ¯ i ω 2 = κ x i ω 2 + 1 κ x i ω 1     κ [ 0 , 1 ]
4.
Mutation operations
The mutation method adopts a polynomial mutation approach, with an initial mutation probability p 0 set at 0.1 (Figure 6). Figure 6 illustrates the mutation operation applied to a selected chromosome. The gene positions selected for mutation are marked in orange in the parent chromosome. After the mutation operation, the corresponding positions in the child chromosome are updated, with the newly mutated values highlighted in yellow and purple, indicating the changes introduced by the mutation process. Polynomial mutation generates new genes by adding a computed value to the determined gene mutation location. This approach introduces new genetic information, effectively enhancing the search capability of the algorithm. Two genes on a randomly selected parent chromosome were chosen for mutation. One gene was increased by a computed value, while the other was decremented by the corresponding value, followed by normalization within the group. This mutation approach performed moderate step-size reduction near the boundaries to ensure fine exploration of the extreme value regions while maintaining feasible solutions. The mutation formula was as follows:
x i ω + 1 1 = 0.5 × 1 + β x i ω 1 + 1 β x j ω 1 x j ω + 1 1 = 0.5 × 1 β x i ω 1 + 1 + β x j ω 1
β = 2 u 1 ξ + 1 1 ,   u 0 , 0.5 1 2 1 u 1 ξ + 1 ,   u 0.5 , 1
where u is a uniformly sampled random number within the interval 0 , 1 and ξ is the mutation distribution index, set to a value of 20.
To control mutation volatility and avoid premature convergence to a local optimum, the mutation probability p m should be set slightly higher in the early stages. However, if p m remains too high in the later stages, it may result in excessive multipoint mutations on chromosomes, making convergence difficult. Therefore, the mutation probability p m was set to dynamically change, gradually decreasing from the initial mutation probability p 0 as the number of iterations increased. The formula for mutation probability p m was as follows:
p m = p 0 ω + 1
5.
Selection operations
To better maintain population diversity while avoiding individuals becoming trapped in local optima, a selection strategy combining elitism and roulette wheel selection was adopted. The newly generated offspring population N was compared to the parent population and individuals were ranked by fitness value. The top N / 2 elite individuals with the highest fitness values were directly carried over to the next generation. The remaining N / 2 individuals were selected based on the roulette wheel method, according to their fitness and selection probability, to form the new population. The formula for selection probability was as follows:
p i S = f i S j = 1 N + N / 2 f i S i = 1 , 2 , , N + N / 2

3.3.2. The Lower-Level Algorithm

Sheffi and Powell [48] first proposed the MSA in 1982 to solve the equivalent model of SUE. The core idea of this algorithm is to gradually approximate the equilibrium solution by dynamically adjusting traffic flows on network links. Specifically, at each iteration, the algorithm adopts a predetermined step size and employs a stochastic loading approach to allocate traffic flows. The iterative process continues until the differences in traffic flow allocations between two successive iterations fall below a predetermined error threshold, thereby achieving convergence to the equilibrium solution.
Step 1: Initialization to calculate traffic flow distribution for each time period. We set the initial feasible solution for each road segment as an even distribution of route flows, considering the travel paths already chosen by decentralized users at each departure time in the network. Using the subscribed users’ travel demand q w m S for each time period obtained from the upper-level model and the initial travel time t a m for each road segment in each time period, we performed a 0–1 allocation of q w m S to generate the initial feasible solution r a n = q a m S + q a m D and set the iteration count to n = 1 .
Step 2: Update link impedance. Based on the current traffic allocation r a n , we used the BPR function to calculate the travel time t a m for each link and time period and, subsequently, determined the actual arrival time T w k m S n .
Step 3: Determine the search direction. We used the Frank–Wolfe method to allocate the subscribed users’ travel demand q w m S to the shortest path, resulting in the additional traffic flow y a n for each link.
Step 4: Update link flows. We used the MSA algorithm with the formula r a n + 1 = r a n + 1 n y a n r a n to obtain the updated link flows.
Step 5: Convergence check. We stopped the computation if the convergence condition r a n + 1 r a n / r a n ε ( ε being the predefined error threshold) was satisfied and passed the link flows back to the upper-level model. Otherwise, we set n = n + 1 and returned to Step 2.

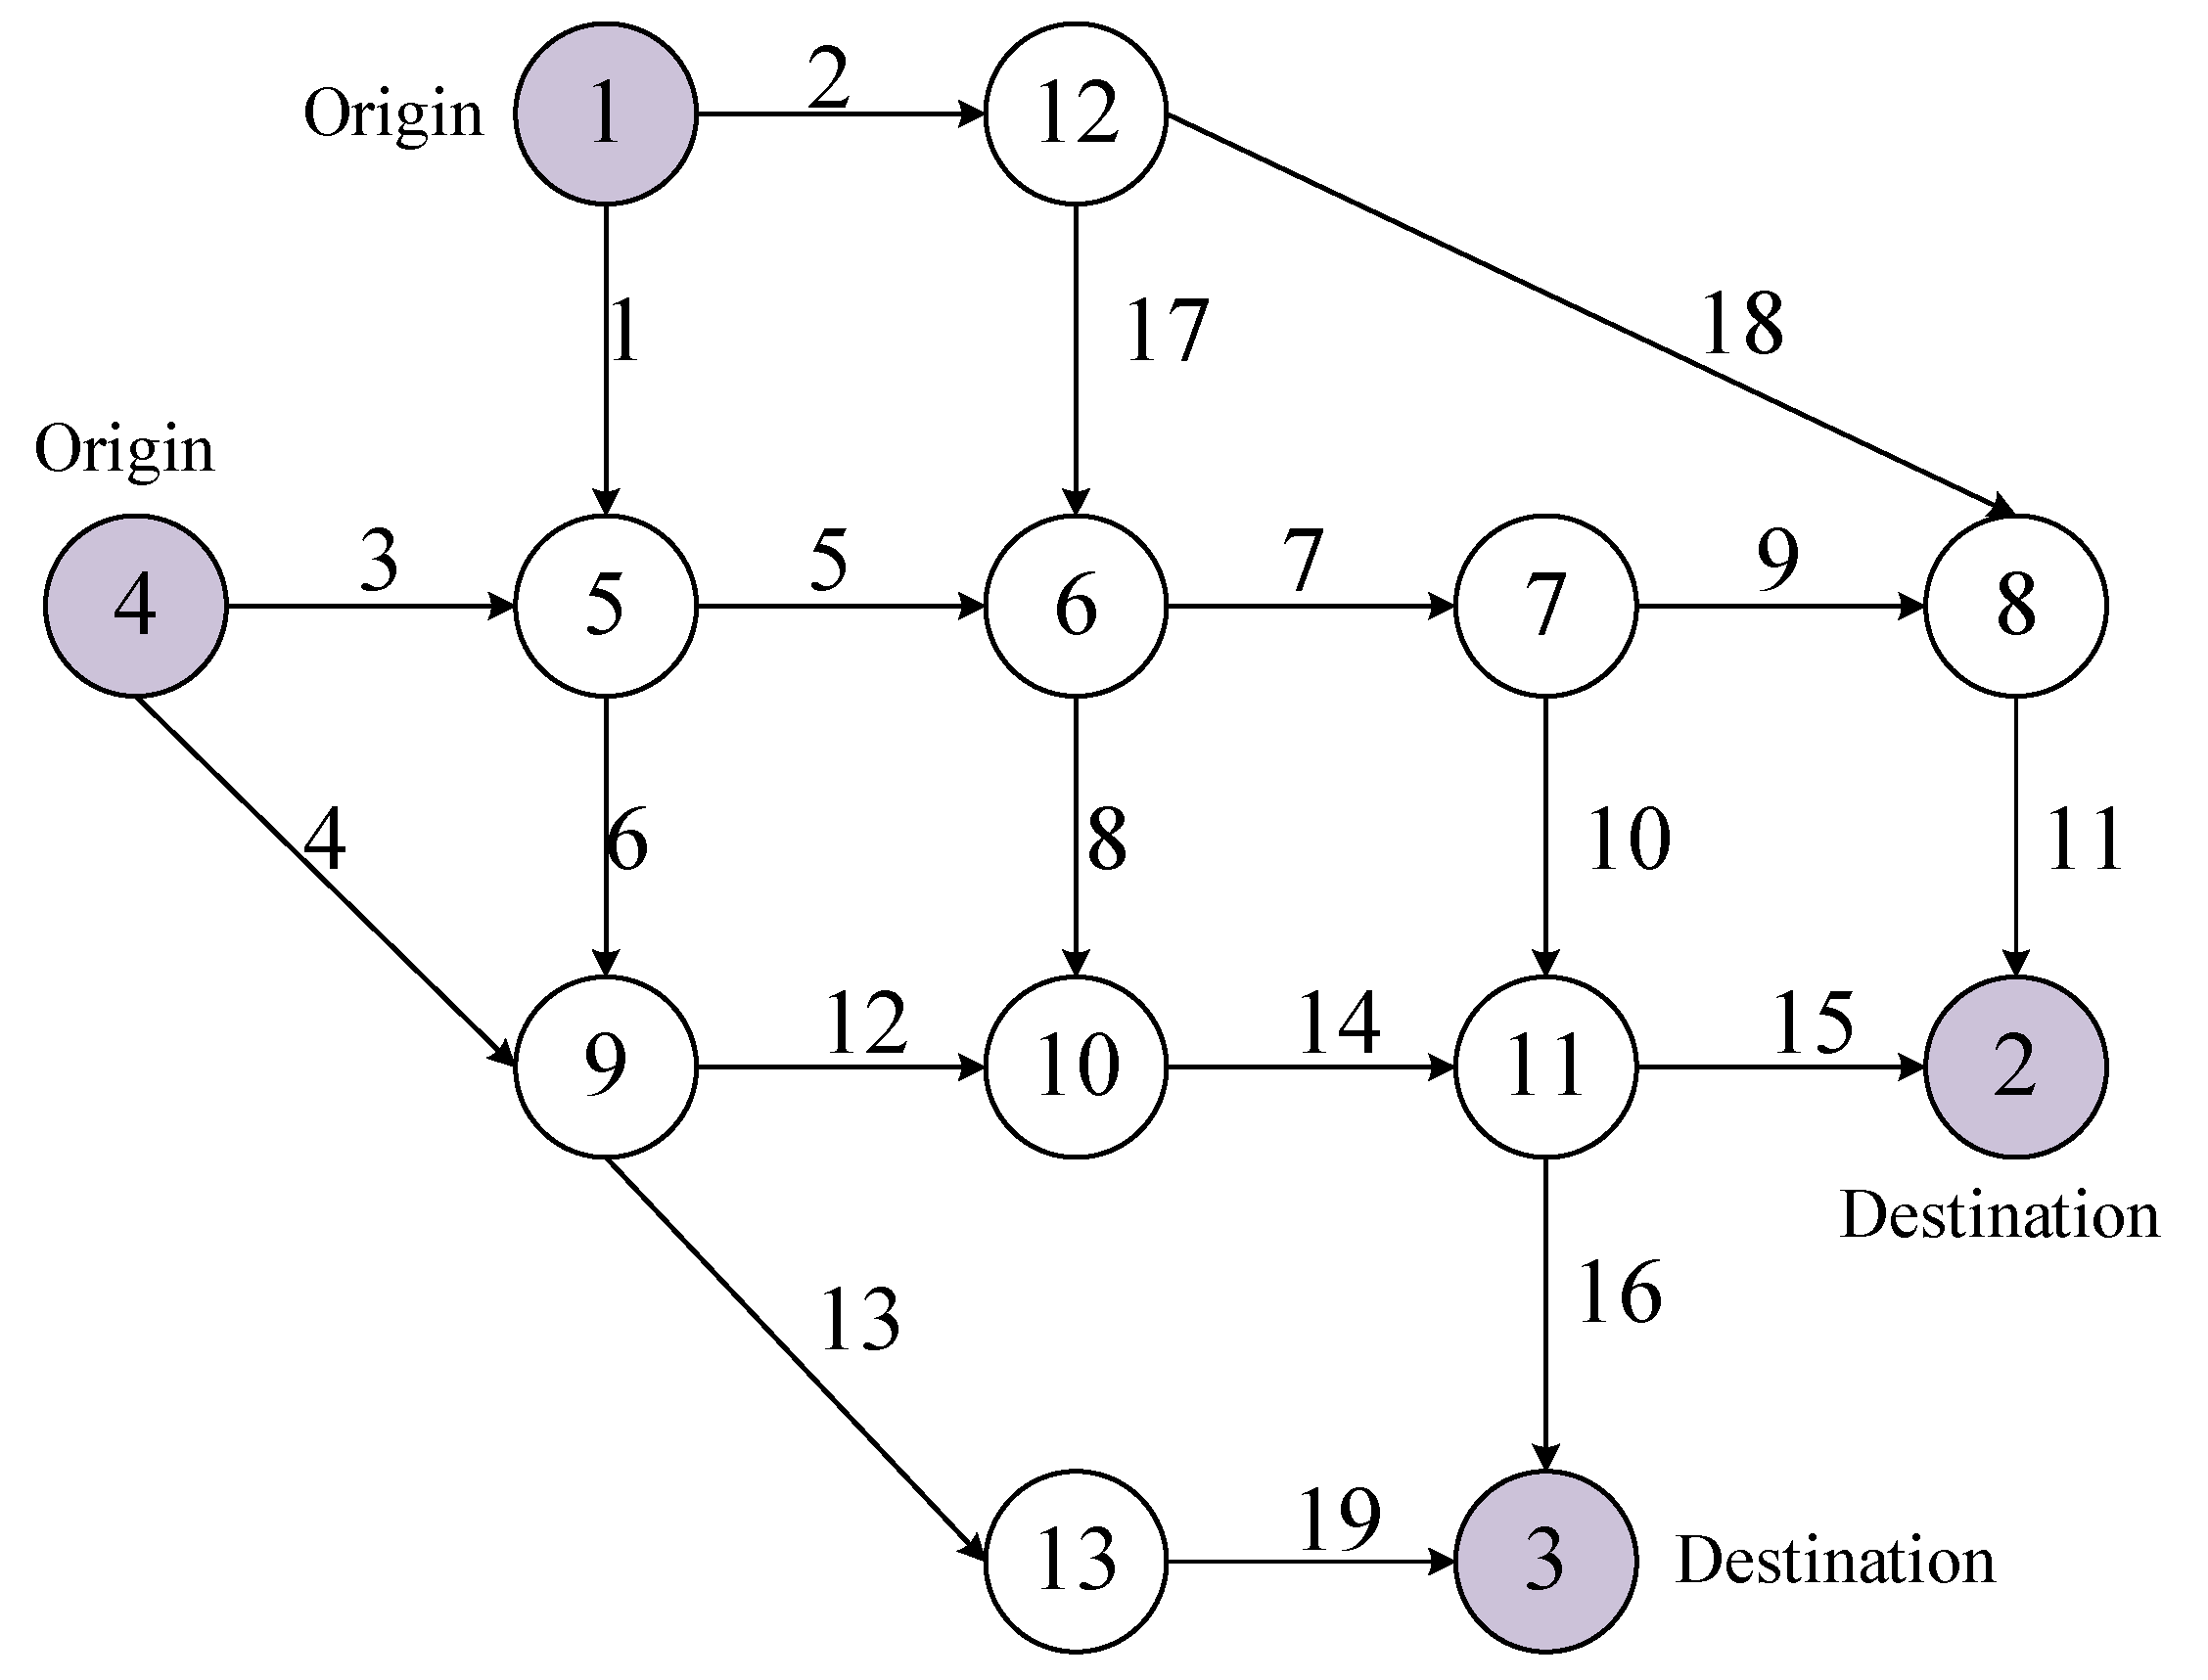
4. Numerical Examples

4.1. Example Data

In this section, we show how we used the Nguyen–Dupuis network (shown in Figure 4) as an example to evaluate the performance of the proposed model’s solution method through numerical experiments and illustrate the day-to-day dynamic flow evolution among various driver types. The network contains 4 OD pairs, with a total of 13 nodes, 19 links, and 25 paths. The link–path parameter relationships are shown in Table 1 and Table 2. The traffic demand for each OD pair was as follows: q 1 2 = 1000 veh; q 1 3 = 900 veh; q 4 2 = 1100 veh; and q 4 3 = 700 veh.
The parameters were set as follows: The simulation covered the 2 h morning peak period from 7:00 to 9:00, divided into 10 departure time windows (12 min each), with Δ T = 12 min . The initial allocation ratios of the two types of users were 0.4 and 0.6, respectively. The other parameters were set as t e D = 0.1 t b D ; t l D = 0.08 t b D ; t e S = 0.1 t w k m S ; t l S = 0.08 t w k m S ; T r S = T r D = 9 : 00 ; α i = 0.88 i = 1 , 2 , 3 ; μ = 100 ; λ 1 = 0.3 ; λ 2 = 0.5 ; λ 3 = 0.6 ; γ = 0.74 ; δ 1 = δ 2 = 0.05 ; δ 3 = δ 4 = 0.2 ; υ = 0.8 ; η 1 = Z m 1 d ; η 2 = 12 min ; η 3 = 0.5 P F k 2 m q w k m D d ; η 4 = 0.05 c w k m D ( d ) ; η 5 = 0.05 c w k m S ( d ) . The value of v a l was based on the research data from Kato et al. (2020) and set at 24.94 JPY/minute [49].
It should be noted that the Nguyen–Dupuis test network used in this study serves as a classical validation case, and its number of OD pairs significantly differs from that of real urban road networks. To enhance the applicability of the proposed model to large-scale and complex road networks, a network partitioning strategy could be considered, decomposing the entire network into interrelated sub-regions. Local optimization models could be developed individually for each sub-region, enabling parallel computation through a distributed computational framework. Ultimately, global optimality could be achieved through coordination mechanisms at boundary nodes (Figure 7).

4.2. Evolution Results Analysis

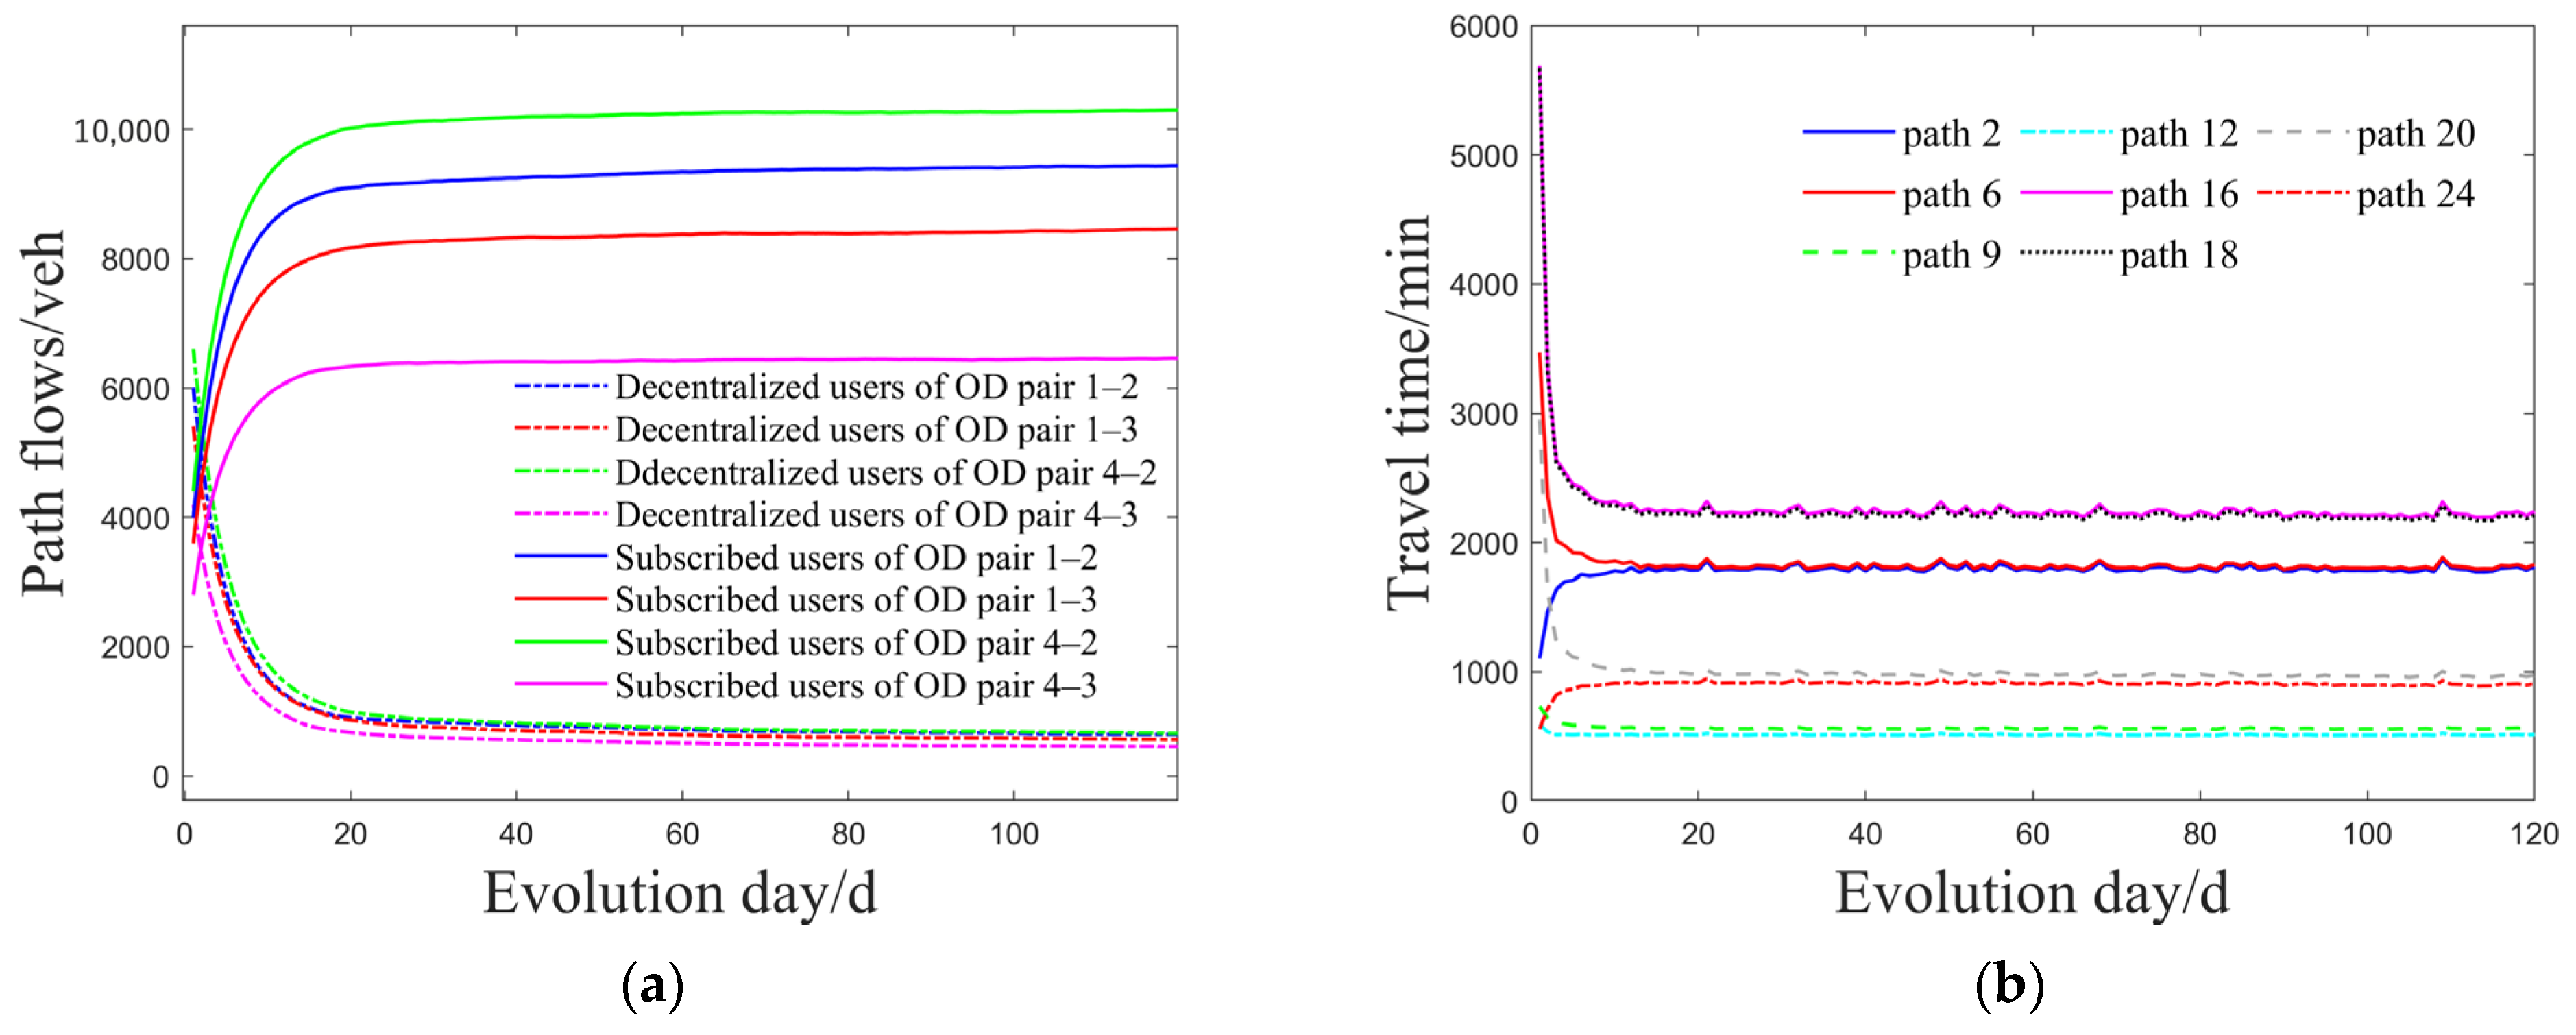
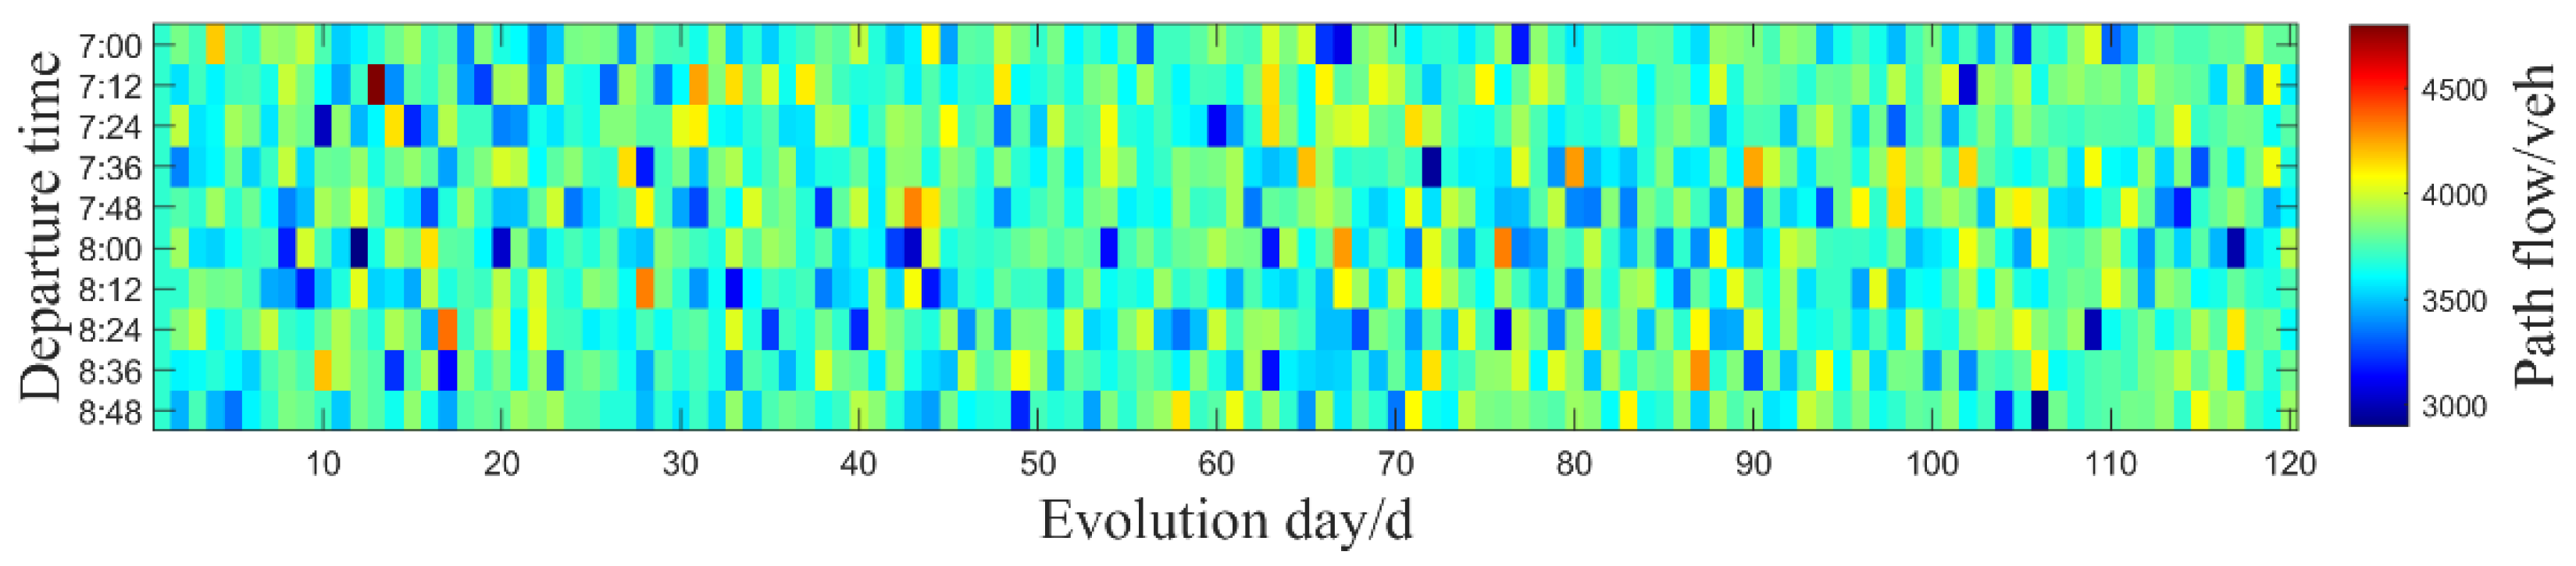
4.2.1. Analysis of Traffic Flow Evolution in the Network

Figure 8a illustrates the daily proportions of subscribed and decentralized users across various OD pairs under mixed-traffic conditions. At the initial stage of evolution, a notable shift occurs as a significant number of decentralized users transition to the MaaS platform, becoming subscribed users. This transition underscores the platform’s capability to attract users away from traditional travel modes towards more coordinated and systematic travel behaviors. This finding holds practical implications for urban traffic management, suggesting that policy incentives or subsidy mechanisms could be leveraged by authorities to further facilitate user transitions, thereby enhancing the coordination and efficiency of the overall transport system. As the evolutionary process progresses, the total number of users in both categories stabilizes, yet substantial variations persist among different OD pairs. This variability indicates distinct user behaviors associated with differing travel demands, highlighting the need for traffic managers to develop more nuanced strategies. Specifically, differentiated traffic guidance measures should be implemented based on the particular demand characteristics and capacities of road segments or regions.
Figure 8b and Figure 9a–c present results for two representative paths selected for each OD pair. Figure 8b specifically illustrates the evolution and stabilization of travel times for each path in the road network under mixed-traffic conditions. Figure 9 provides daily path flows for decentralized and subscribed users, as well as the aggregate daily flows for each path under mixed-traffic conditions. At the initial phase of evolution, adjustments are particularly evident, with Paths 9, 12, and 24 experiencing a significant increase in flow. After approximately 40 days, the traffic flows on each path gradually stabilize, with minor fluctuations attributable to the inherent characteristics of the genetic algorithm employed; these fluctuations remain within an acceptable range. These observations confirm that the MaaS assignment strategy effectively optimizes and stabilizes traffic flow. Practically, this characteristic enables urban traffic management agencies to monitor real-time traffic conditions through the MaaS platform, facilitating timely and dynamic interventions and flow control measures aimed at alleviating congestion on specific paths. Additionally, the substantial initial adjustments in path flow suggest that when introducing new traffic management strategies, a transitional adaptation period should be provided to mitigate the initial fluctuations resulting from these adjustments.

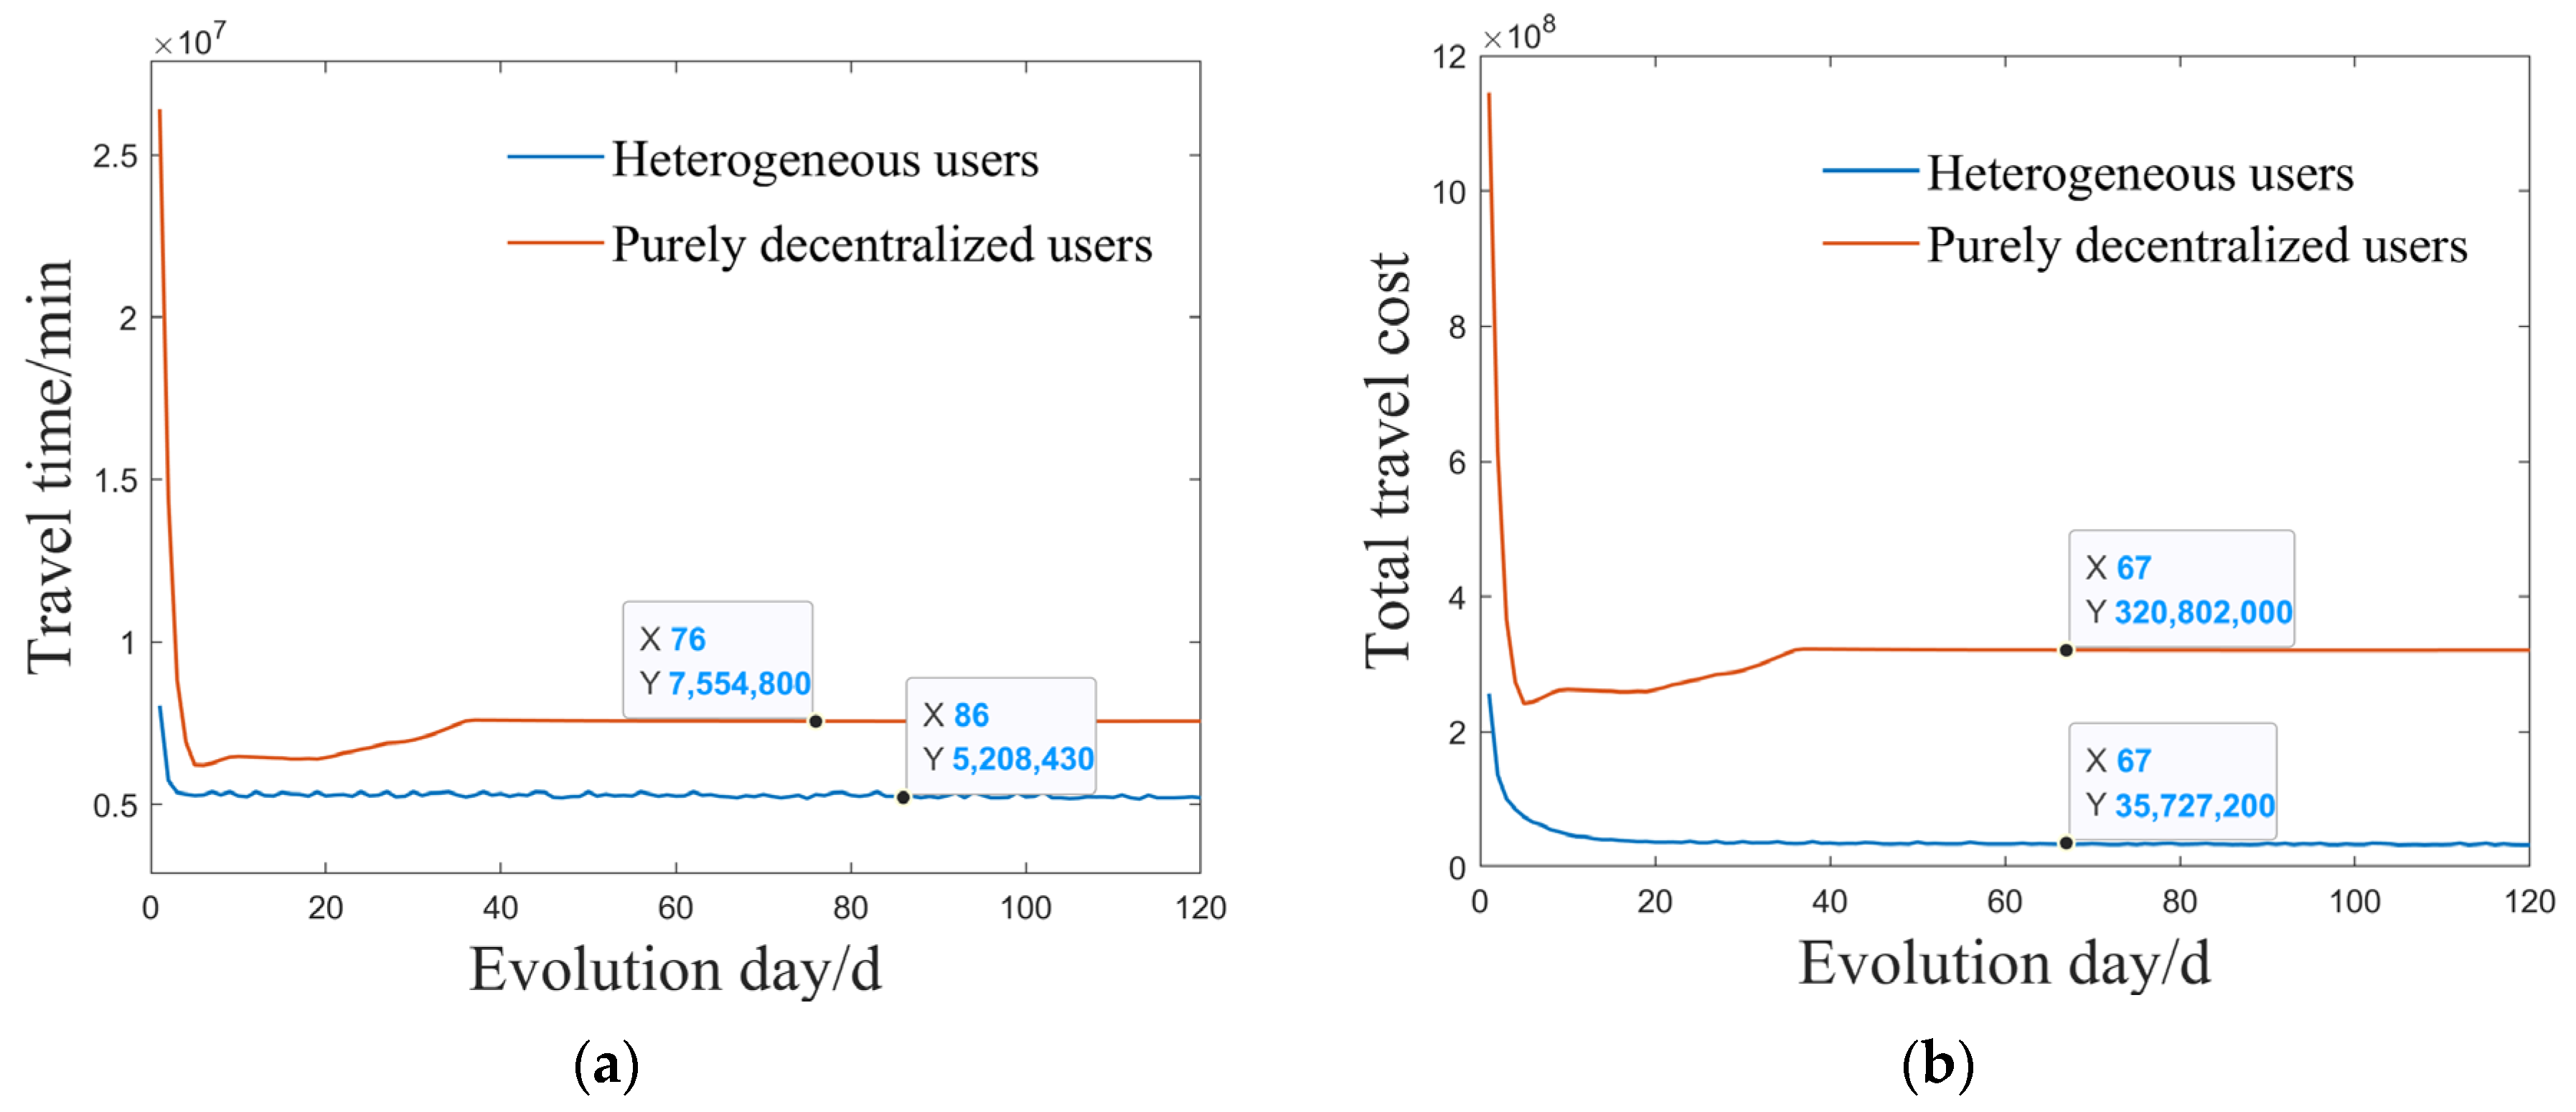
4.2.2. Evaluation of the IGA-MSA Hybrid Algorithm

To verify the effectiveness of the proposed hybrid IGA-MSA algorithm, comparative analyses were conducted against an unoptimized TGA, a standalone MSA algorithm, and a combined Ant Colony Optimization (ACO)-MSA approach.
For the standalone MSA algorithm, the departure-time-specific travel demand was uniformly distributed across the available time periods. In the case of applying ACO to the problem addressed in this study, the continuous demand allocation proportions were first converted into a discrete path-construction problem. Specifically, the demand allocation proportions were represented by a 40-dimensional vector, with each dimension corresponding to the demand allocation proportion for a particular time interval. Ants incrementally assigned demand proportions through a “path-construction” process. The solution procedure for each ant can be viewed as traversing a path composed of 40 stages, wherein each stage requires deciding the number of demand units allocated to the current time period before proceeding with the allocation of remaining units. By discretizing the total demand into fixed units, this method transformed the continuous problem into a combinatorial optimization problem solvable by the ACO algorithm. Furthermore, inspired by the heuristic approach commonly used in the traveling salesman problem—which utilizes inverse distances as heuristic information—this study employed anticipated travel times for each period as heuristic guidance. Consequently, periods characterized by shorter average travel times were preferentially assigned higher demand to minimize overall system costs. The heuristic information for each period was dynamically updated based on actual traffic assignment outcomes to adjust pheromone intensity during ant path selection.
Figure 10 and Figure 11 depict the algorithm performance comparison results. Figure 10a compares IGA with TGA, demonstrating that the IGA offers clear advantages, even in the initial iterations, characterized by a lower starting cost and faster decline rate. As iterations continued, the total travel cost of IGA consistently decreased and eventually stabilized at a significantly lower level, whereas TGA exhibited notable fluctuations in the later stages of iteration, indicating inferior overall convergence compared to IGA. Figure 10b contrasts IGA-MSA with the standalone MSA approach, showing that IGA-MSA achieves lower total travel costs in the middle to late iterative stages, along with a notably faster daily cost reduction rate. After roughly 80 days of iteration, the stable travel cost achieved by the IGA-MSA algorithm markedly outperformed the standalone MSA algorithm, highlighting the complementary benefits between the global exploration capability of IGA and the local adjustment properties of MSA.
Figure 10c and Figure 11 present performance comparisons between IGA-MSA and the ACO algorithm. Although both IGA and ACO exhibited rapid convergence initially, the IGA consistently maintained lower cost levels throughout the iteration process. Path flow allocation using the ACO algorithm required approximately 40 days to stabilize, yet, even after stabilization, considerable fluctuations persisted. In contrast, the convergence curve of IGA was smoother and more stable. Specifically, the unevenness and significant fluctuations in path flow distribution observed with the ACO algorithm primarily stemmed from biases in path selection and the strong local search characteristics associated with pheromone accumulation mechanisms. Conversely, IGA achieved more balanced path flow distributions through its population-based evolutionary mechanism. The experimental results suggest that, although the ACO’s strong local search capability enables rapid initial convergence, it is susceptible to becoming trapped in local optima. Meanwhile, IGA’s global search strategy continues optimization into the later stages of iterations. Consequently, the hybrid IGA-MSA algorithm demonstrates a superior adaptability and optimization capability relative to the ACO algorithm in addressing the departure-time allocation problem investigated in this study.

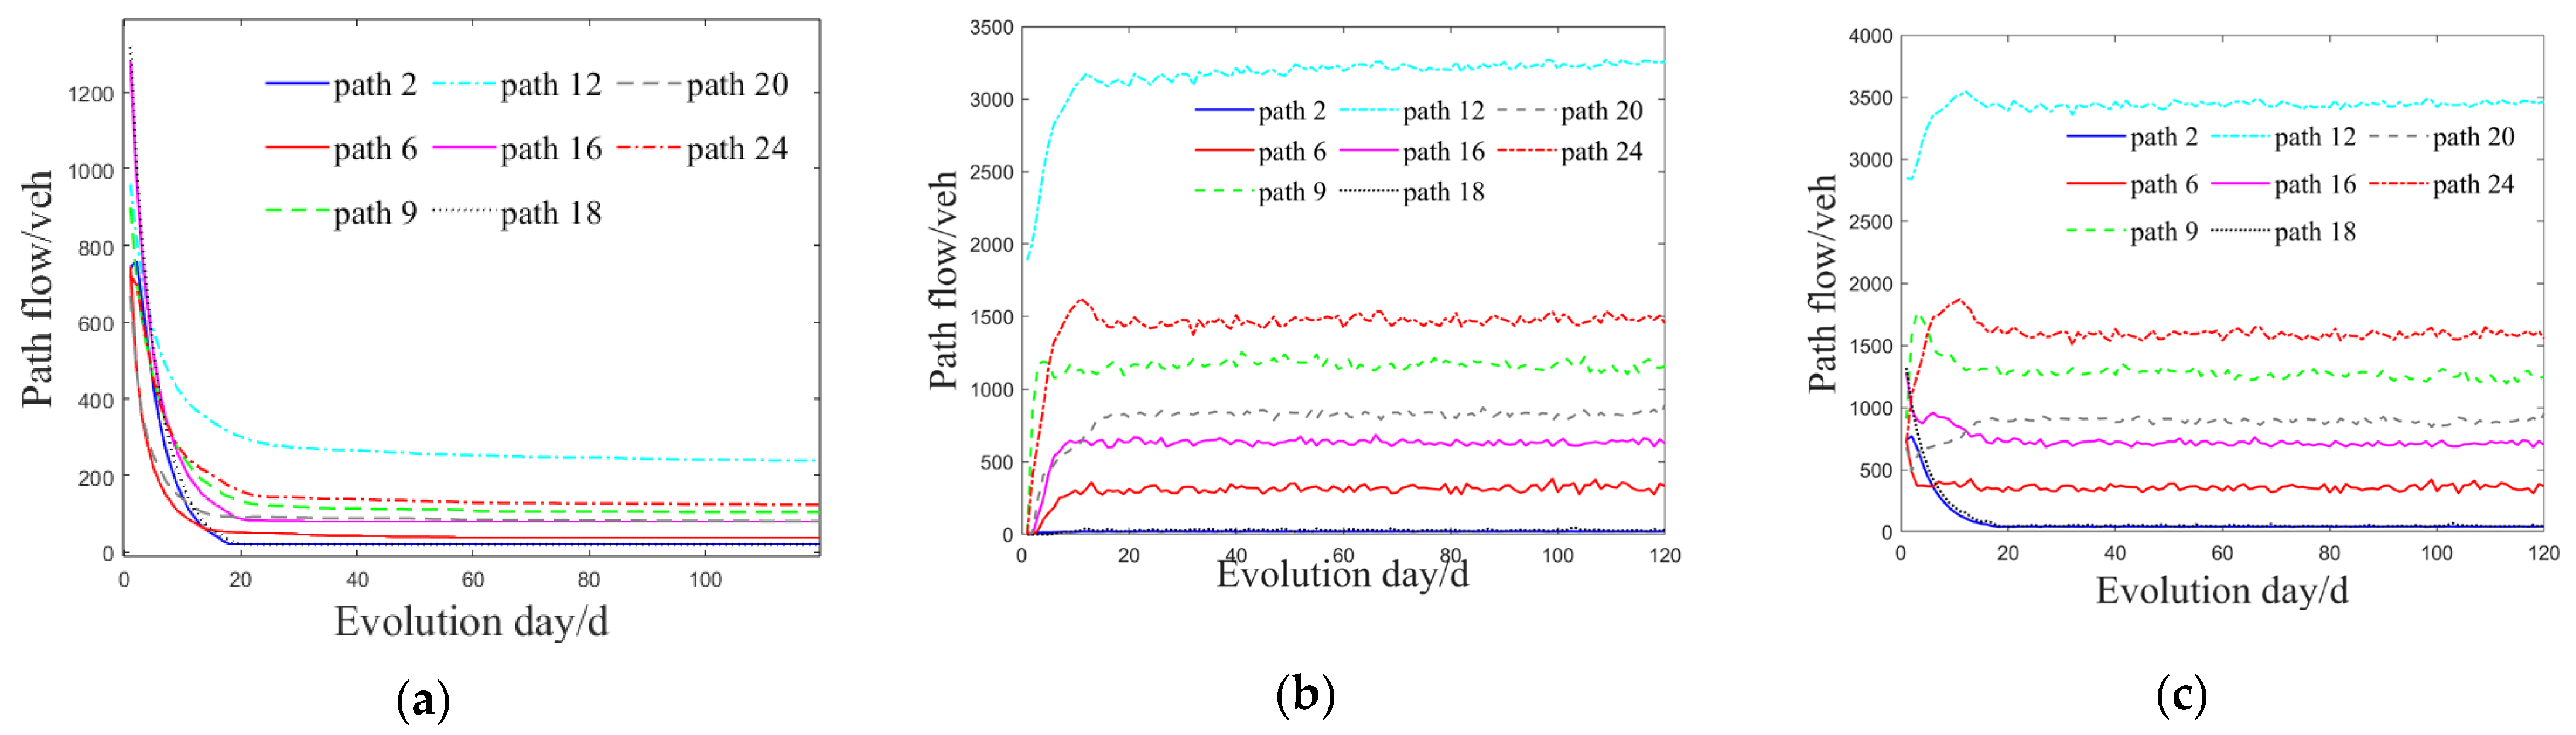
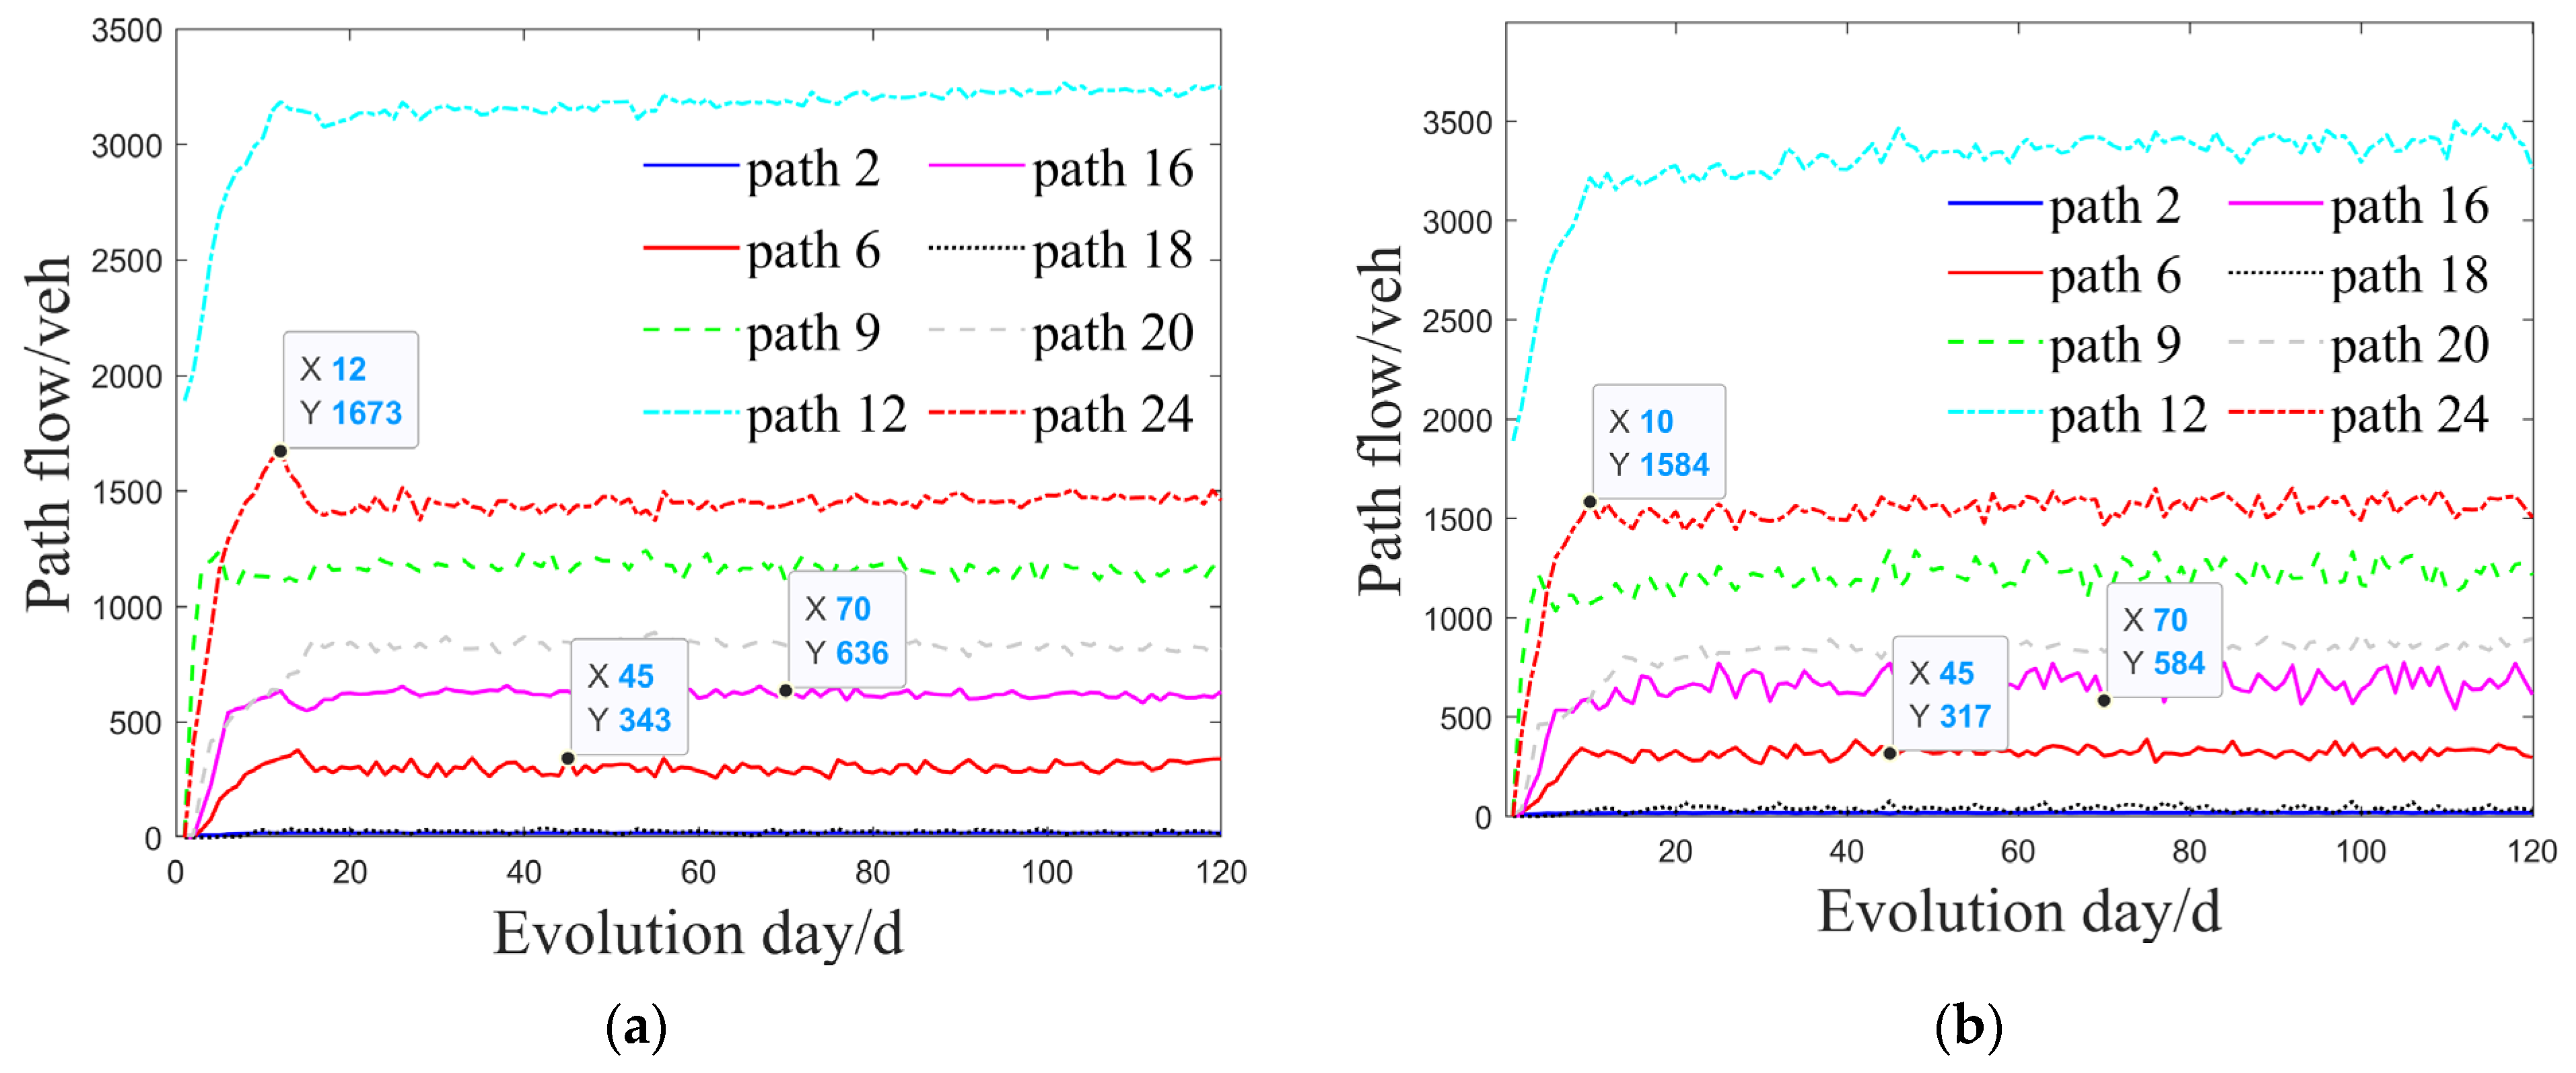
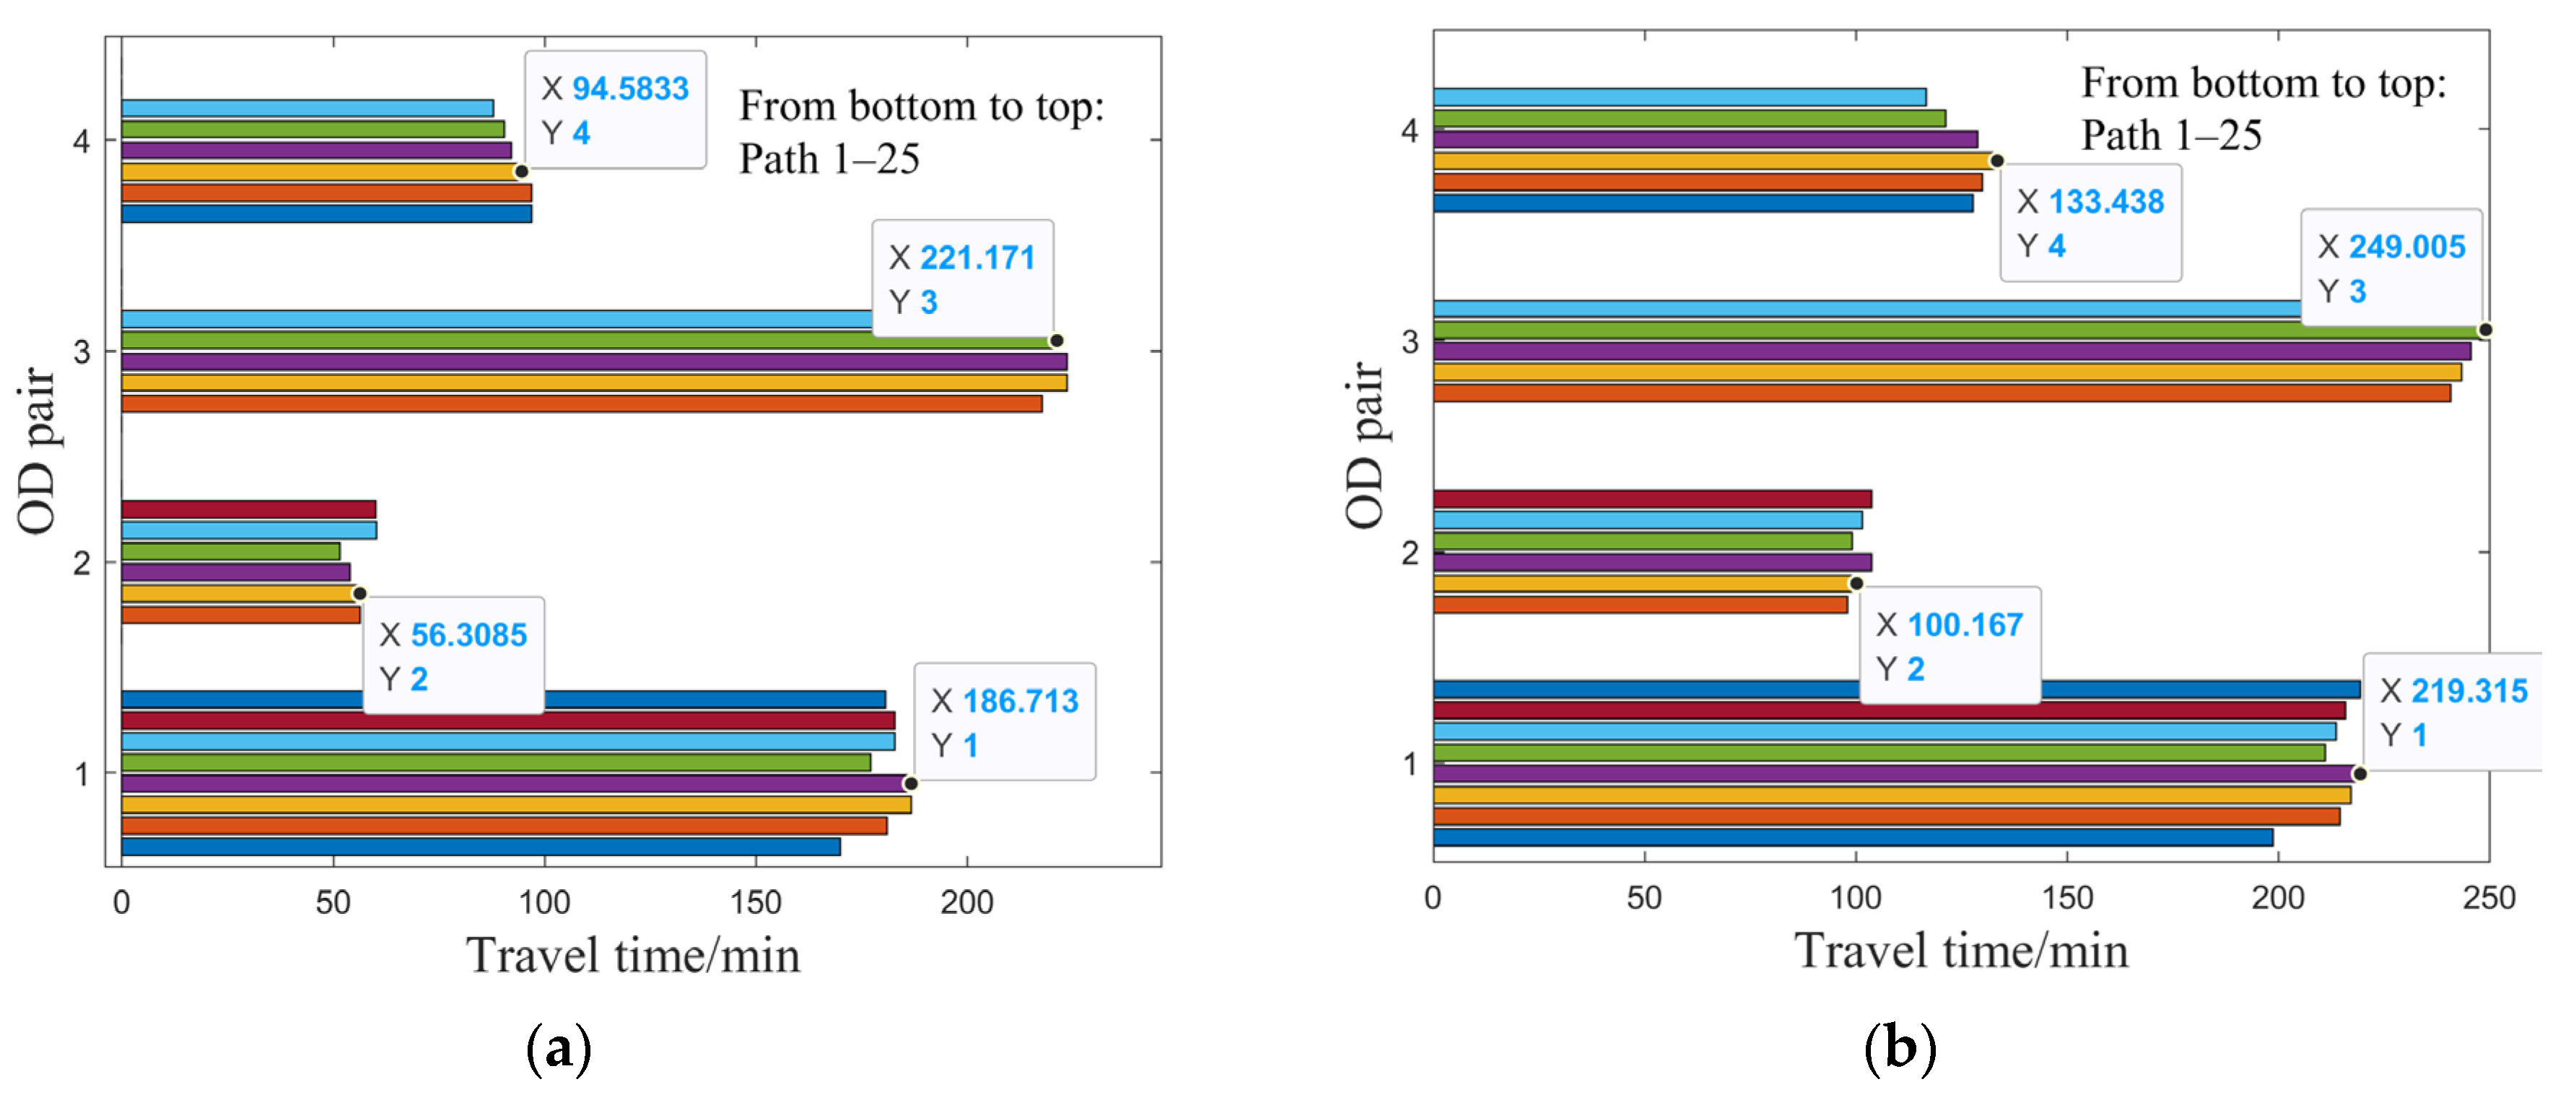
4.2.3. Impact of the MaaS Assignment Model on Traffic Flow Evolution

Figure 12 shows a comparison of the total system travel times and total travel costs during the evolution process for mixed heterogeneous users and pure decentralized users. It can be observed that the pure decentralized users reached a steady state more quickly because they only aimed to minimize their own travel times and arrival costs. In contrast, the mixed heterogeneous users in the network focused on minimizing the overall system costs, which required a longer adjustment period. However, the total system travel times and total travel costs for the mixed heterogeneous users were consistently lower than those of the pure decentralized users, indicating that the MaaS travel service, with its comprehensive real-time traffic information, had an overall optimization effect on system performance. This allowed for the full utilization of network facilities, effectively reducing costs. Figure 13 shows a comparison of the equilibrium path travel times for each OD pair for mixed heterogeneous users and pure decentralized users in the network. It can be observed that the travel times between different OD pairs and paths exhibited certain differences, reflecting varying travel characteristics and congestion levels among different OD pairs. This indicated that user behaviors varied under different OD conditions and that demand management strategies could be implemented to balance traffic loads in heavily congested areas. The equilibrium travel times for each OD pair also showed significant differences under different network conditions. In almost all paths, the travel times for pure decentralized users were longer, which suggested that relying solely on experience-based travel decisions lacked coordination among network users, potentially leading to greater congestion and subsequently affecting travel efficiency.
Figure 14 shows a comparison of travel flow allocation under mixed traffic conditions using the IGA-MSA algorithm, with the optimization objectives being the total system travel costs and the total system travel times. The results indicated that optimizing for total travel time resulted in a lower total system travel time. However, when optimizing for total travel time, the total travel costs in the early stages of evolution were significantly higher than when optimizing for total system costs and the final stable travel cost was also slightly higher. Nevertheless, both the total travel costs and travel times were significantly optimized compared to the system under pure decentralized users, demonstrating the effectiveness of the IGA-MSA algorithm in optimizing under different adjustment objectives.

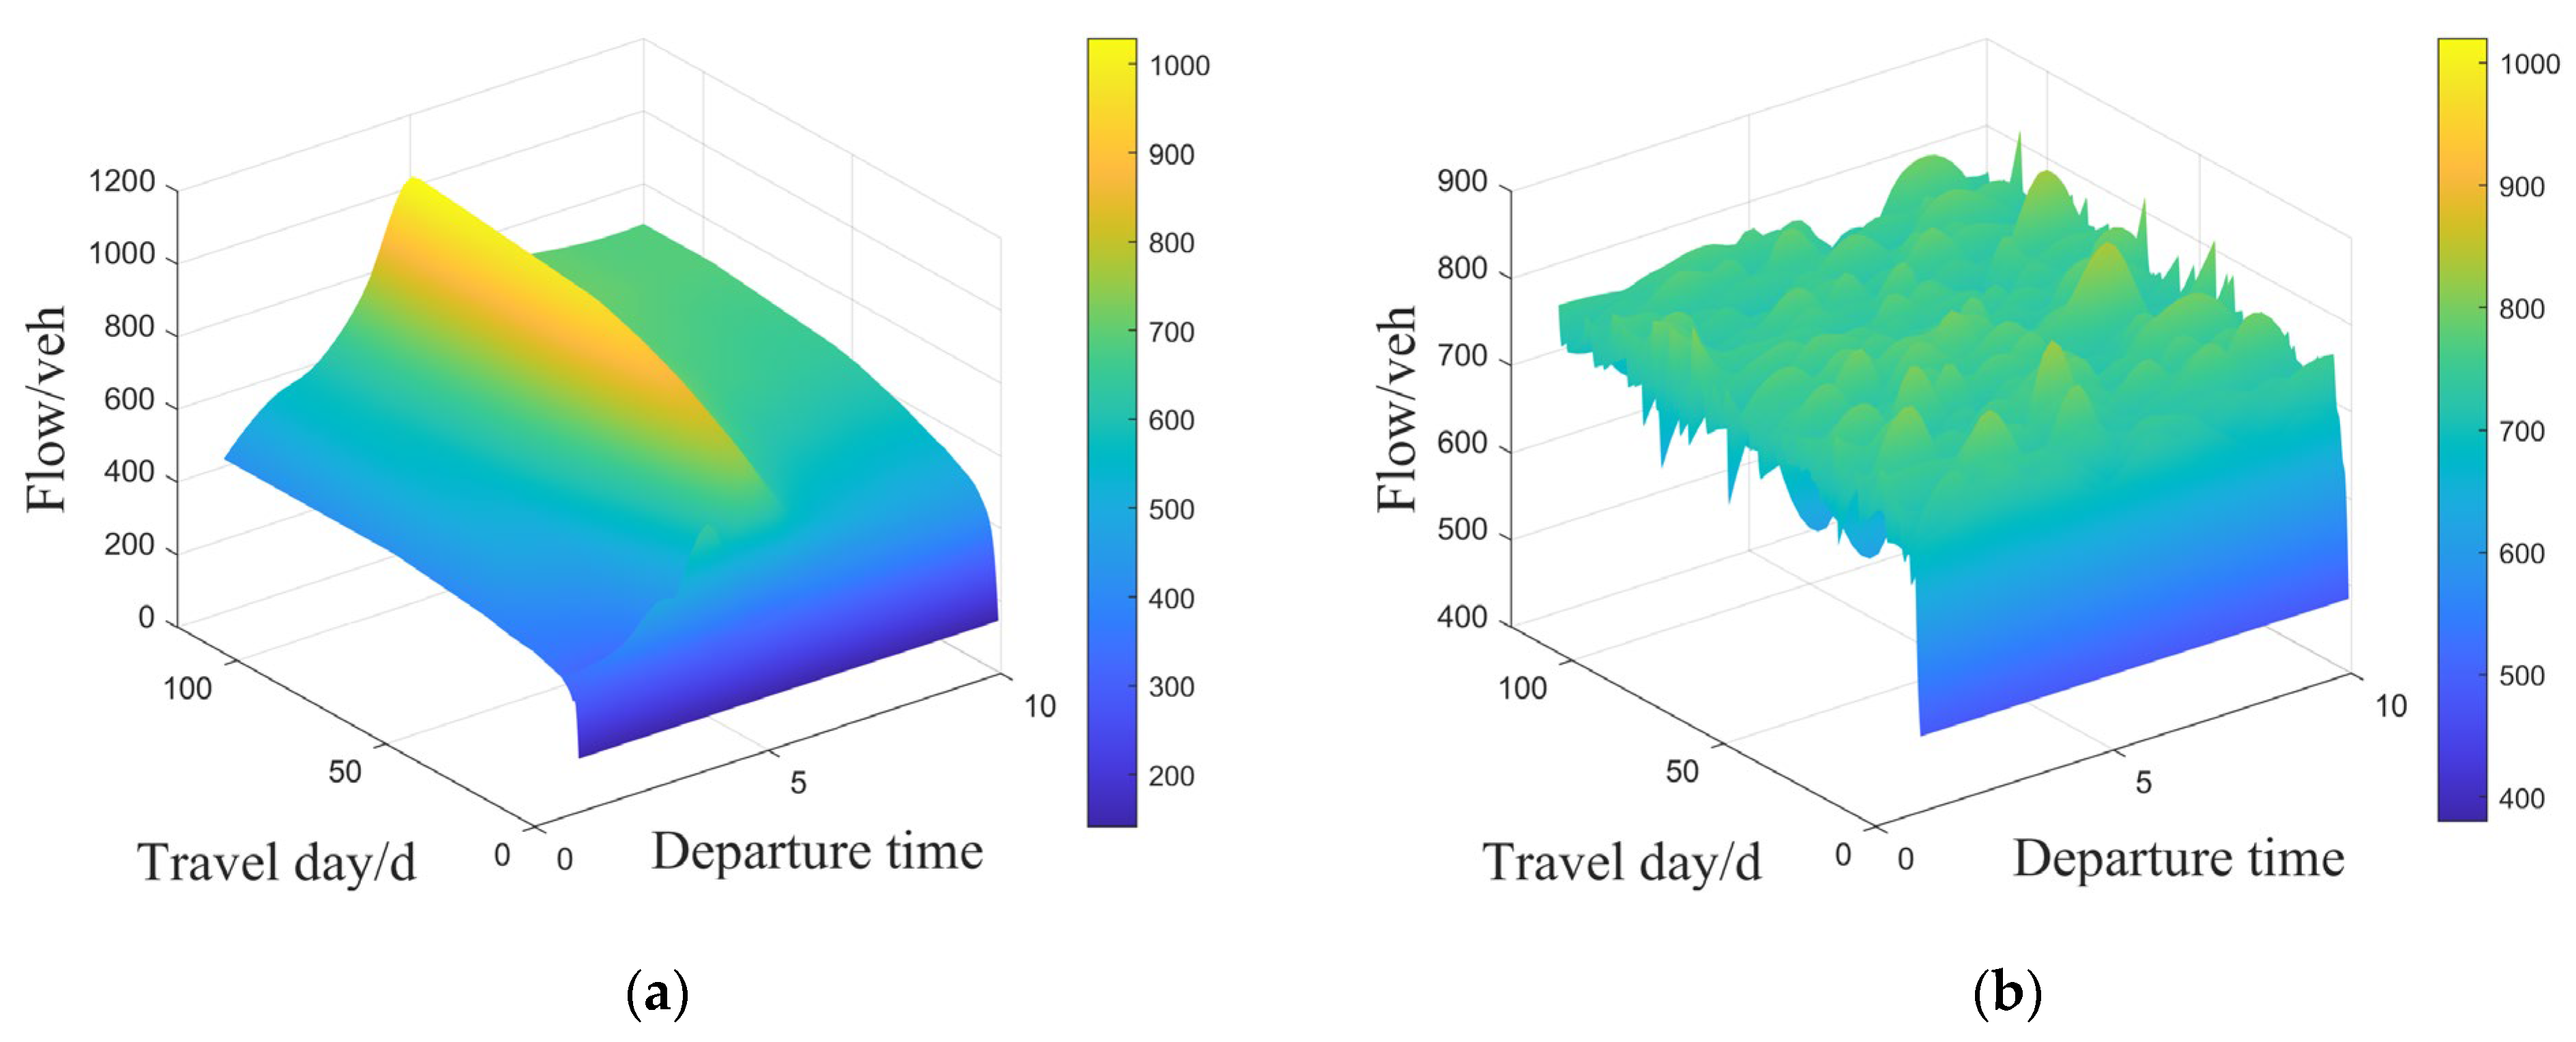
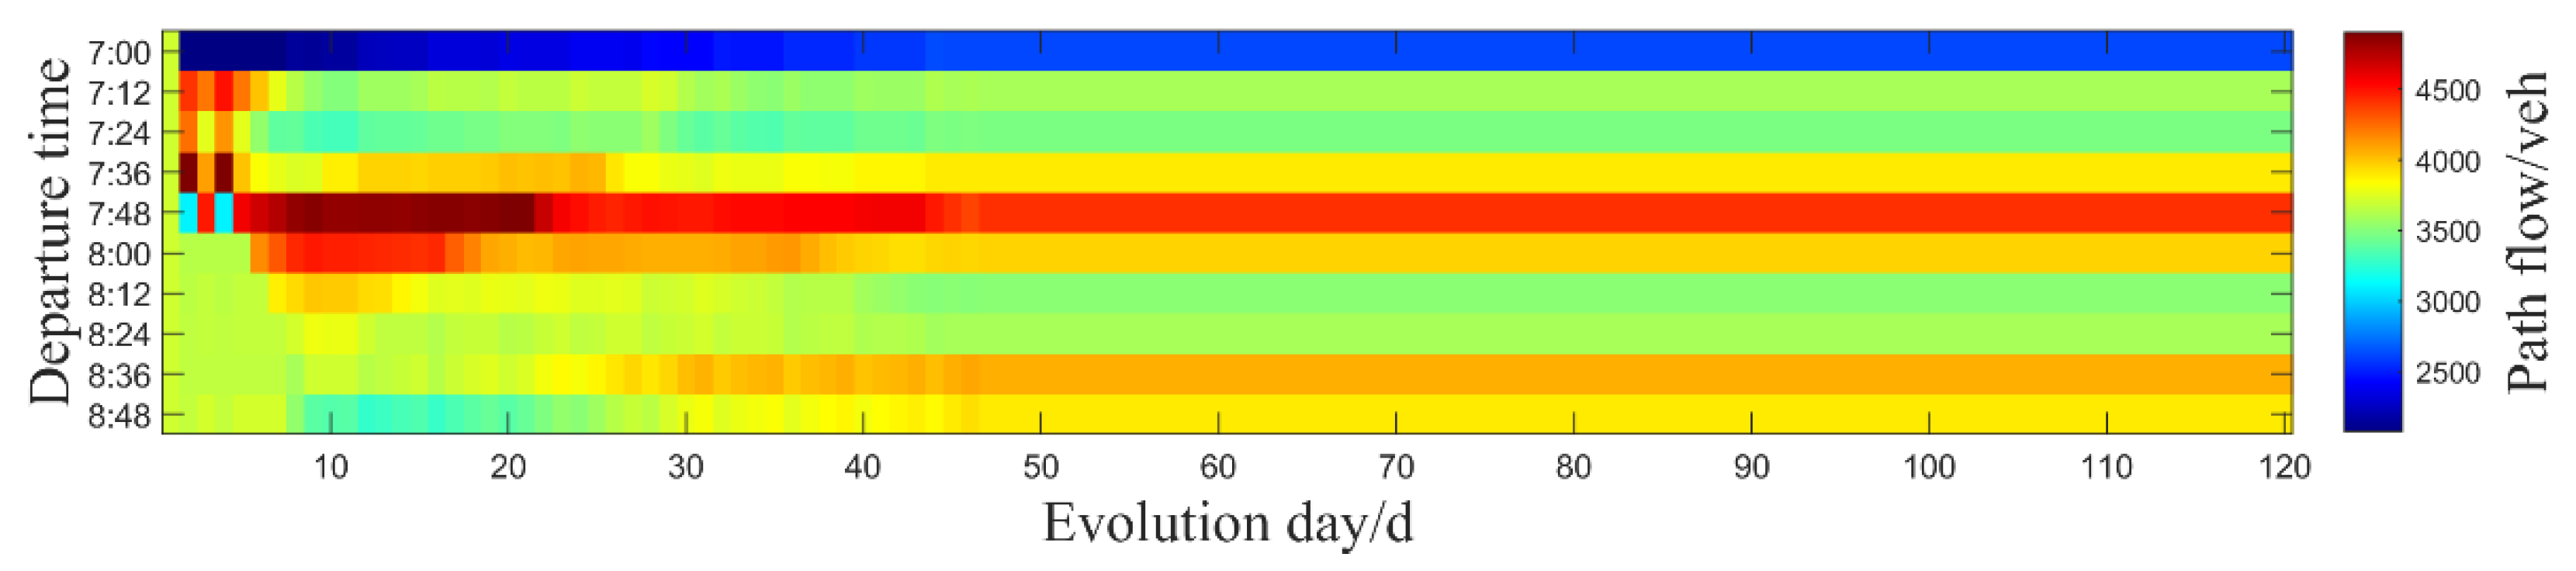
4.2.4. Impact of the MaaS Assignment Model on Departure Times

Figure 15 shows a comparison of total travel times for each departure time (7:00–8:48) under steady-state and non-steady-state conditions in the mixed-user network. It can be observed that, under non-steady-state conditions, the travel times for each departure time exhibited noticeable fluctuations, demonstrating high dynamism and uncertainty. In contrast, the travel times under steady-state conditions were more uniform.
Figure 16 shows the day-to-day evolution of Path 1 under mixed heterogeneous users and pure decentralized users for each departure time. It can be observed that, as the evolution progressed, the travel demand for Path 1 under pure decentralized users gradually stabilized for each departure time, with more travelers tending to depart during the fifth to seventh time windows (i.e., 7:48–8:12) to maximize their on-time arrival rate. This indicated that, under pure decentralized users, travelers tended to concentrate their departures at specific times to maximize their individual travel benefits, which could lead to congestion during these time periods. In contrast, the evolution process under mixed heterogeneous users showed relatively smoother peaks and troughs in terms of travel demand, reflecting the regulating effect of MaaS on departure times, leading to a more evenly distributed peak travel period.
Figure 17 and Figure 18 compare the daily flow distributions across different time intervals between scenarios involving heterogeneous users (mixed subscribed and decentralized users) and scenarios with purely decentralized users. As depicted, departure time choices among purely decentralized users tend to concentrate significantly, while heterogeneous user scenarios exhibit more evenly distributed utilization rates across various periods. This indicates that decentralized users typically rely more heavily on historical experiences for selecting departure times. Due to similar arrival time demands during peak morning periods, purely decentralized scenarios are prone to congestion, highlighting the critical role of the MaaS platform in guiding traveler behavior. In practice, urban traffic managers could leverage MaaS platforms to implement precise temporal adjustment strategies, such as dynamic pricing, reward points, or discounts for pre-scheduled travel, thereby effectively dispersing travel demand, smoothing peak traffic, and mitigating congestion during peak commuting hours.

5. Conclusions

This study applies the MaaS concept to influence the travel behaviors of private car users, dividing them into two groups: subscribed users, who utilize the MaaS platform, and decentralized users, who rely on experiential decision-making. Considering the differences in behavior between these user groups, separate models were developed for their day-to-day route choice and departure time decisions. A day-to-day and within-day dual dynamic traffic assignment model under the MaaS environment was constructed to analyze the evolutionary patterns of heterogeneous user behaviors. An IGA-MSA was designed to allocate daily traffic flows under scenarios involving multiple departure times and route choices. Numerical experiments were conducted, and the results revealed the distinct travel choice characteristics of heterogeneous users, further validating the effectiveness of the proposed model. The results were as follows:
  • The MaaS platform significantly attracts private car users by effectively reducing travel costs, prompting many decentralized users to transition to subscribed users gradually. As the system evolves day by day, path and departure-time selection behaviors for both user groups become stable; however, notable differences in path selections across various OD pairs suggest that traffic demand management strategies should be refined based on specific travel demand structures and network capacities;
  • Analysis of time-varying traffic demand revealed that decentralized users relying solely on personal experiences tend to concentrate travel within specific time windows, frequently causing peak-hour congestion. Conversely, users guided by the MaaS platform exhibit more evenly distributed departure times, emphasizing the platform’s considerable advantage in managing peak-period traffic flows and reducing congestion risks;
  • The proposed IGA-MSA algorithm demonstrated strong performance by effectively reducing total travel costs during the early stages of system evolution and consistently outperforming traditional uniform allocation strategies throughout the evolutionary process. This facilitates more rational and efficient utilization of network capacities.
Despite these contributions, certain limitations remain and warrant further investigation:
  • The travel behavior model developed in this study assumes all users are fully rational decision-makers, neglecting potential irrational or varied rational decision-making behaviors observed in real-world conditions. Future research could incorporate theories from behavioral economics and psychology to introduce diverse user behavior patterns, enabling more accurate modeling of real-world travel decision processes;
  • Although the IGA-MSA algorithm effectively reduces overall travel costs, its current applicability is limited to scenarios with fewer OD pairs and relatively simple, non-overlapping route networks, posing scalability challenges. Future studies could enhance this algorithm by integrating deep learning or advanced heuristic search methods, developing high-performance hybrid dynamic flow allocation algorithms suitable for large-scale, complex networks;
  • This research has not addressed the design and evaluation of differentiated incentive mechanisms, which are crucial for enhancing user acceptance of MaaS platforms and accelerating the system’s progression toward optimal conditions. Future studies could explore mixed incentive strategies combining dynamic incentive mechanisms, differentiated pricing, and multi-faceted subsidy models, evaluating their impacts on heterogeneous user travel behaviors. This approach would enable finer management of travel demand, enhancing the practical applicability and adaptability of the MaaS optimization framework proposed herein.

Author Contributions

Conceptualization, L.C. and Y.Y.; methodology, L.C.; software, Y.Y. and L.W.; validation, L.C. and Y.Y.; investigation, Y.Y., L.H. and M.M.; resources, L.C.; data curation, Y.Y. and C.X.; writing—original draft preparation, Y.Y.; writing—review and editing, L.C.; project administration, L.C.; funding acquisition, L.C. All authors have read and agreed to the published version of the manuscript.

Funding

This research was funded by a National Social Science Fund youth project (grant number 20CGL018).

Institutional Review Board Statement

Not applicable.

Informed Consent Statement

Not applicable.

Data Availability Statement

The datasets used in this study are available from the corresponding author upon reasonable request.

Conflicts of Interest

The authors declare no conflicts of interest.

References

  1. Jin, S.T.; Kong, H.; Wu, R.; Sui, D.Z. Ridesourcing, the Sharing Economy, and the Future of Cities. Cities 2018, 76, 96–104. [Google Scholar] [CrossRef]
  2. Merchant, D.K.; Nemhauser, G.L. A Model and an Algorithm for the Dynamic Traffic Assignment Problems. Transp. Sci. 1978, 12, 183–199. [Google Scholar] [CrossRef]
  3. Siri, E.; Siri, S.; Sacone, S. A Topology-Based Bounded Rationality Day-to-Day Traffic Assignment Model. Commun. Transp. Res. 2022, 2, 100076. [Google Scholar] [CrossRef]
  4. Yu, Y.; Han, K.; Ochieng, W. Day-to-Day Dynamic Traffic Assignment with Imperfect Information, Bounded Rationality and Information Sharing. Transp. Res. Part C Emerg. Technol. 2020, 114, 59–83. [Google Scholar] [CrossRef]
  5. Watling, D. Stability of the Stochastic Equilibrium Assignment Problem: A Dynamical Systems Approach. Transp. Res. Part B Methodol. 1999, 33, 281–312. [Google Scholar] [CrossRef]
  6. Watling, D.; Hazelton, M.L. The Dynamics and Equilibria of Day-to-Day Assignment Models. Netw. Spat. Econ. 2003, 3, 349–370. [Google Scholar]
  7. Ye, H.; Xiao, F.; Yang, H. Day-to-Day Dynamics with Advanced Traveler Information. Transp. Res. Part B Methodol. 2021, 144, 23–44. [Google Scholar] [CrossRef]
  8. Smith, M.J. The Stability of a Dynamic Model of Traffic Assignment—An Application of a Method of Lyapunov. Transp. Sci. 1984, 18, 245–252. [Google Scholar] [CrossRef]
  9. He, X.; Guo, X.; Liu, H.X. A Link-Based Day-to-Day Traffic Assignment Model. Transp. Res. Part B Methodol. 2010, 44, 597–608. [Google Scholar] [CrossRef]
  10. Bar-Gera, H. Continuous and Discrete Trajectory Models for Dynamic Traffic Assignment. Netw. Spat. Econ. 2005, 5, 41–70. [Google Scholar]
  11. Cantarella, G.E. Day-to-Day Dynamic Models for Intelligent Transportation Systems Design and Appraisal. Transp. Res. Part C Emerg. Technol. 2013, 29, 117–130. [Google Scholar] [CrossRef]
  12. Guo, R.-Y.; Yang, H.; Huang, H.-J.; Tan, Z. Day-to-Day Flow Dynamics and Congestion Control. Transp. Sci. 2016, 50, 982–997. [Google Scholar] [CrossRef]
  13. Horowitz, J.L. The stability of stochastic equilibrium in a two-link transportation network. Transp. Res. Part B Methodol. 2008, 18, 13–28. [Google Scholar]
  14. Han, L.; Du, L. On a Link-Based Day-to-Day Traffic Assignment Model. Transp. Res. Part B Methodol. 2012, 46, 72–84. [Google Scholar] [CrossRef]
  15. Kumar, A.; Peeta, S. A Day-to-Day Dynamical Model for the Evolution of Path Flows Under Disequilibrium of Traffic Networks with Fixed Demand. Transp. Res. Part B Methodol. 2015, 80, 235–256. [Google Scholar] [CrossRef]
  16. Cantarella, G.E.; Watling, D.P. Modelling Road Traffic Assignment as a Day-to-Day Dynamic, Deterministic Process: A Unified Approach to Discrete- and Continuous-Time Models. EURO J. Transp. Logist. 2016, 5, 69–98. [Google Scholar] [CrossRef]
  17. Cantarella, G.E.; Watling, D.P. A General Stochastic Process for Day-to-Day Dynamic Traffic Assignment: Formulation, Asymptotic Behaviour, and Stability Analysis. Transp. Res. Part B Methodol. 2016, 92, 3–21. [Google Scholar] [CrossRef]
  18. Cantarella, G.E.; Cascetta, E. Dynamic Processes and Equilibrium in Transportation Networks: Towards a Unifying Theory. Transp. Sci. 1995, 29, 305–329. [Google Scholar] [CrossRef]
  19. Bellei, G.; Gentile, G.; Meschini, L.; Papola, N. A Demand Model with Departure Time Choice for Within-Day Dynamic Traffic Assignment. Eur. J. Oper. Res. 2006, 175, 1557–1576. [Google Scholar] [CrossRef]
  20. De Palma, A.; Ben-Akiva, M.; Lefevre, C.; Litinas, N. Stochastic Equilibrium Model of Peak Period Traffic Congestion. Transp. Sci. 1983, 17, 430–453. [Google Scholar] [CrossRef]
  21. Arnott, R.; De Palma, A.; Lindsey, R. Departure Time and Route Choice for the Morning Commute. Transp. Res. Part B Methodol. 1990, 24, 209–228. [Google Scholar] [CrossRef]
  22. Cascetta, E.; Cantarella, C. A day-to-day and within-day dynamic stochastic assignment model. Transp. Res. Part A Gen. 1991, 25, 277–291. [Google Scholar] [CrossRef]
  23. Bhat, C.R.; Steed, J.L. A Continuous-Time Model of Departure Time Choice for Urban Shopping Trips. Transp. Res. Part B Methodol. 2002, 36, 207–224. [Google Scholar] [CrossRef]
  24. Srinivasan, K.K.; Guo, Z. Day-to-Day Evolution of Network Flows Under Departure Time Dynamics in Commuter Decisions. Transp. Res. Rec. J. Transp. Res. Board 2003, 1831, 47–56. [Google Scholar] [CrossRef]
  25. Xiao, Y.; Lo, H.K. Day-to-Day Departure Time Modeling under Social Network Influence. Transp. Res. Part B Methodol. 2016, 92, 54–72. [Google Scholar] [CrossRef]
  26. Jittrapirom, P.; Caiati, V.; Feneri, A.-M.; Ebrahimigharehbaghi, S.; González, M.J.A.; Narayan, J. Mobility as a Service: A Critical Review of Definitions, Assessments of Schemes, and Key Challenges. Urban Plan. 2017, 2, 13–25. [Google Scholar] [CrossRef]
  27. Sochor, J.; Arby, H.; Karlsson, I.C.M.; Sarasini, S. A Topological Approach to Mobility as a Service: A Proposed Tool for Understanding Requirements and Effects, and for Aiding the Integration of Societal Goals. Res. Transp. Bus. Manag. 2018, 27, 3–14. [Google Scholar] [CrossRef]
  28. Matyas, M.; Kamargianni, M. Survey Design for Exploring Demand for Mobility as a Service Plans. Transportation 2019, 46, 1525–1558. [Google Scholar] [CrossRef]
  29. Polydoropoulou, A.; Tsouros, I.; Pagoni, I.; Tsirimpa, A. Exploring Individual Preferences and Willingness to Pay for Mobility as a Service. Transp. Res. Rec. J. Transp. Res. Board 2020, 2674, 152–164. [Google Scholar] [CrossRef]
  30. Farahmand, Z.H.; Gkiotsalitis, K.; Geurs, K.T. Mobility-as-a-Service as a Transport Demand Management Tool: A Case Study among Employees in the Netherlands. Case Stud. Transp. Policy 2021, 9, 1615–1629. [Google Scholar] [CrossRef]
  31. Caiati, V.; Rasouli, S.; Timmermans, H. Bundling, Pricing Schemes and Extra Features Preferences for Mobility as a Service: Sequential Portfolio Choice Experiment. Transp. Res. Part A Policy Pract. 2020, 131, 123–148. [Google Scholar] [CrossRef]
  32. Butler, L.; Yigitcanlar, T.; Paz, A. Barriers and Risks of Mobility-as-a-Service (MaaS) Adoption in Cities: A Systematic Review of the Literature. Cities 2021, 109, 103036. [Google Scholar] [CrossRef]
  33. Ben-Elia, E.; Ettema, D. Rewarding Rush-Hour Avoidance: A Study of Commuters’ Travel Behavior. Transp. Res. Part A Policy Pract. 2011, 45, 567–582. [Google Scholar] [CrossRef]
  34. Karlsson, I.C.M.; Sochor, J.; Strömberg, H. Developing the ‘Service’ in Mobility as a Service: Experiences from a Field Trial of an Innovative Travel Brokerage. Transp. Res. Procedia 2016, 14, 3265–3273. [Google Scholar] [CrossRef]
  35. Hensher, D.A.; Hietanen, S. Mobility as a Feature (MaaF): Rethinking the Focus of the Second Generation of Mobility as a Service (MaaS). Transp. Rev. 2022, 43, 325–329. [Google Scholar] [CrossRef]
  36. Holland, J.H. Adaptation in Natural and Artificial Systems: An Introductory Analysis with Applications to Biology, Control, and Artificial Intelligence; MIT Press: Cambridge, MA, USA, 1992; ISBN 978-0-262-58111-0. [Google Scholar]
  37. Kumar, N.; Kumar, T.; Nema, S.; Thakur, T. A Comprehensive Planning Framework for Electric Vehicles Fast Charging Station Assisted by Solar and Battery Based on Queueing Theory and Non-Dominated Sorting Genetic Algorithm-II in a Co-Ordinated Transportation and Power Network. J. Energy Storage 2022, 49, 104180. [Google Scholar] [CrossRef]
  38. Victer Paul, P.; Ramalingam, A.; Baskaran, R.; Dhavachelvan, P.; Vivekanandan, K.; Subramanian, R. A New Population Seeding Technique for Permutation-Coded Genetic Algorithm: Service Transfer Approach. J. Comput. Sci. 2014, 5, 277–297. [Google Scholar] [CrossRef]
  39. Hassanat, A.B.; Prasath, V.B.S.; Abbadi, M.A.; Abu-Qdari, S.A.; Faris, H. An Improved Genetic Algorithm with a New Initialization Mechanism Based on Regression Techniques. Information 2018, 9, 167. [Google Scholar] [CrossRef]
  40. Kaabi, J.; Harrath, Y. Permutation Rules and Genetic Algorithm to Solve the Traveling Salesman Problem. Arab. J. Basic Appl. Sci. 2019, 26, 283–291. [Google Scholar] [CrossRef]
  41. Masmoudi, M.A.; Braekers, K.; Masmoudi, M.; Dammak, A. A Hybrid Genetic Algorithm for the Heterogeneous Dial-A-Ride Problem. Comput. Oper. Res. 2017, 81, 1–13. [Google Scholar] [CrossRef]
  42. Zhang, J.; Chung, H.S.H.; Hu, B.J. Adaptive Probabilities of Crossover and Mutation in Genetic Algorithms Based on Clustering Technique. In Proceedings of the Proceedings of the 2004 Congress on Evolutionary Computation (IEEE Cat. No.04TH8753), Portland, OR, USA, 19–23 June 2004; pp. 2280–2287. [Google Scholar]
  43. Wang, Y. The Hybrid Genetic Algorithm with Two Local Optimization Strategies for Traveling Salesman Problem. Comput. Ind. Eng. 2014, 70, 124–133. [Google Scholar] [CrossRef]
  44. Aygun, H.; Turan, O. Application of Genetic Algorithm in Exergy and Sustainability: A Case of Aero-Gas Turbine Engine at Cruise Phase. Energy 2022, 238, 121644. [Google Scholar] [CrossRef]
  45. Zhao, F.; Zeng, X. Optimization of Transit Network Layout and Headway with a Combined Genetic Algorithm and Simulated Annealing Method. Eng. Optim. 2006, 38, 701–722. [Google Scholar] [CrossRef]
  46. Li, K.-Q.; Yin, Z.-Y.; Zhang, N.; Liu, Y. A Data-Driven Method to Model Stress-Strain Behaviour of Frozen Soil Considering Uncertainty. Cold Reg. Sci. Technol. 2023, 213, 103906. [Google Scholar] [CrossRef]
  47. Li, K.-Q.; Yin, Z.-Y.; Zhang, N.; Li, J. A PINN-Based Modelling Approach for Hydromechanical Behaviour of Unsaturated Expansive Soils. Comput. Geotech. 2024, 169, 106174. [Google Scholar] [CrossRef]
  48. Sheffi, Y.; Powell, W.B. An Algorithm for the Equilibrium Assignment Problem with Random Link Times. Networks 1982, 12, 191–207. [Google Scholar] [CrossRef]
  49. Kato, H.; Sanko, N.; Ishibe, M.; Sakashita, A. Value of Travel Time Savings for Leisure Trip in Autonomous Vehicles: Case Study from the Tokyo Metropolitan Area. Transp. Res. Interdiscip. Perspect. 2024, 24, 101080. [Google Scholar] [CrossRef]
Figure 1. The framework for heterogeneous users’ travel mode selection.
Sustainability 17 02983 g001
Figure 2. Framework of the within-day and day-to-day doubly dynamic traffic assignment model for heterogeneous users.
Sustainability 17 02983 g002
Figure 3. A schematic diagram of the IGA-MSA hybrid algorithm.
Sustainability 17 02983 g003
Figure 4. Normalization encoding operation.
Sustainability 17 02983 g004
Figure 5. Improved crossover operation.
Sustainability 17 02983 g005
Figure 6. Improved mutation operation.
Sustainability 17 02983 g006
Figure 7. The Nguyen–Dupuis network.
Sustainability 17 02983 g007
Figure 8. (a) Flow transfer distribution of heterogeneous users for each OD pair under mixed traffic conditions; (b) day-to-day variation in travel times for each path.
Sustainability 17 02983 g008
Figure 9. (a) Day-to-day path flow of decentralized users under mixed traffic conditions; (b) day-to-day path flow of subscribed users under mixed traffic conditions; (c) day-to-day path flow of heterogeneous users under mixed traffic conditions.
Sustainability 17 02983 g009
Figure 10. (a) Comparison with the total travel cost of the road network under the TGA algorithm; (b) comparison with the total travel cost of the road network under the separate MSA algorithm; (c) comparison with the total travel cost of the road network under the ACO algorithm.
Sustainability 17 02983 g010
Figure 11. (a) Travel flow on each path under the IGA algorithm; (b) travel flow on each path under the ACO algorithm.
Sustainability 17 02983 g011
Figure 12. (a) Comparison of total travel times between mixed heterogeneous users and pure decentralized users; (b) comparison of total travel costs between mixed heterogeneous users and pure decentralized users.
Sustainability 17 02983 g012
Figure 13. (a) Path travel time for each OD pair at equilibrium for mixed heterogeneous users; (b) path travel time for each OD pair at equilibrium for pure decentralized users.
Sustainability 17 02983 g013
Figure 14. (a) Comparison of travel costs for mixed heterogeneous users using IGA; (b) comparison of travel times for mixed heterogeneous users using IGA.
Sustainability 17 02983 g014
Figure 15. Travel time variation at each departure time.
Sustainability 17 02983 g015
Figure 16. (a) Day-to-day and within-day flow distribution on Path 1 under pure decentralized users; (b) day-to-day and within-day flow distribution on Path 1 under mixed heterogeneous users.
Sustainability 17 02983 g016
Figure 17. Day-to-day flow variation at each time interval under mixed heterogeneous users.
Sustainability 17 02983 g017
Figure 18. Day-to-day flow variation at each time interval under pure decentralized users.
Sustainability 17 02983 g018
Table 1. Link-to-path relationship table.
OD PairPath IDRouteOD PairPath IDRoute
1–212-18-114–2153-5-7-9-11
22-17-7-9-11163-5-7-10-15
32-17-7-10-15173-5-8-14-15
42-17-8-14-15183-6-12-14-15
51-5-7-9-11194-12-14-15
61-5-7-10-154–3203-5-7-10-16
71-5-8-14-15213-5-8-14-16
81-6-12-14-15223-6-12-14-16
1–391-5-7-10-16233-6-13-19
101-5-8-14-16244-12-14-16
111-6-12-14-16 254-13-19
121-6-13-19
132-17-7-10-16
142-17-8-14-16
Table 2. Link parameter table.
Link IDFree-Flow Travel Time (min)Capacity of the RoadwayLink Length (m)
154004000
276005600
332002400
464004800
547003200
674005600
786006400
893007200
947003200
1064004800
1143003200
1236002400
1374005600
1457004000
1583006400
1645003200
1777005600
1864004800
1926001600
Disclaimer/Publisher’s Note: The statements, opinions and data contained in all publications are solely those of the individual author(s) and contributor(s) and not of MDPI and/or the editor(s). MDPI and/or the editor(s) disclaim responsibility for any injury to people or property resulting from any ideas, methods, instructions or products referred to in the content.

