Article

Carbon Content of Amazonian Commercial Tree Boles: Implications for Forest Management

by
Flora Magdaline Benitez Romero
1,2,3,
Laércio Antônio Gonçalves Jacovine
4,
Angélica de Cássia Oliveira Carneiro
4,
Marcelo Vitor Gualberto Santos Chaves
5,
Eronildo Braga Bezerra
6,7,
Juan Pablo Sandoval Lafuente
2,
Samuel José Silva Soares da Rocha
5,
Maria Teresa Gomes Lopes
8 and
Philip Martin Fearnside
1,*
1
Instituto Nacional de Pesquisas da Amazônia (INPA), Av. André Araújo, 2936, Manaus 69067-375, Amazonas, Brazil
2
Facultad de Ciencias Biológicas y Naturales, Universidad Amazónica de Pando (UAP), Cobija 69932-000, Pando, Bolivia
3
Departamento de Ciências Florestais, Faculdade de Ciências Agrarias, Universidade Federal do Amazonas (UFAM), Manaus 69077-000, Amazonas, Brazil
4
Departamento de Engenharia Florestal, Universidade Federal de Viçosa (UFV), Viçosa 36570-900, Minas Gerais, Brazil
5
Departamento de Ciências Florestais, Universidade Federal de Lavras (UFLA), Lavras 37200-000, Minas Gerais, Brazil
6
Departamento de Engenharia Agrícola e Solos, Faculdade de Ciências Agrarias, Universidade Federal do Amazonas (UFAM), Manaus 69077-000, Amazonas, Brazil
7
Centro de Ciências do Ambiente (CCA), Universidade Federal do Amazonas (UFAM), Manaus 69077-000, Amazonas, Brazil
8
Departamento de Produção Animal e Vegetal, Universidade Federal do Amazonas, Manaus 69077-000, Amazonas, Brazil
*
Author to whom correspondence should be addressed.
Sustainability 2025, 17(7), 2960; https://doi.org/10.3390/su17072960
Submission received: 20 January 2025 / Revised: 17 March 2025 / Accepted: 17 March 2025 / Published: 27 March 2025

Abstract

:
Reliable values for carbon content in trees are essential for quantifying forest carbon stocks and estimating carbon dioxide emissions. This study analyzed the carbon content in the boles of commercial tree species in the Brazilian state of Acre, in the southwestern Amazon. Composite samples were prepared from wood wedges obtained along each individual’s commercial bole (the trunk from the point of cut to the first significant branch). Fifty-seven trees were analyzed, spanning nine families, seventeen genera, and nineteen species in the Amazon forest. The results revealed a variation in carbon content ranging from 49.08% (±3.36) to 51.81% (±0.6), with an overall mean of 50.48% (±0.42). Handroanthus serratifolius, Astronium lecointei, and Dipteryx odorata exhibited the highest carbon contents. The statistical analysis included the calculation of 95% confidence intervals for each species, indicating the precision of the carbon content estimates. ANOVA analysis showed a large effect (η2 = 0.83), indicating that 83% of carbon variability is due to species differences, highlighting the distinct carbon profiles across species. One species (Ceiba pentandra) showed a significant increase in carbon with height along the bole, while the others showed varying but non-significant trends with height. Mean carbon content differed significantly (Tukey’s post hoc test) among the 19 species studied, with the greatest difference between H. serratifolius and Ceiba pentandra. Although differences between species may seem small, in some cases, they can lead to considerable underestimations or overestimations of carbon stocks and emissions when extrapolated to large areas such as the Amazon. The mean carbon content measured in this study (50.48%) exceeds the 0.47 IPCC default value generally used in national reports to the Climate Convention and in various estimates of deforestation emissions and Amazon carbon stocks. This suggests that both emissions and stocks may have been underestimated.

1. Introduction

To properly understand the relationship between carbon content, vegetation, and climate change, it is crucial to recognize the fundamental role that forests play in the global carbon cycle [1,2]. Carbon content refers to the amount of carbon stored in a particular material or environment [3]. In the context of vegetation, this includes the carbon contained in plants, trees, and soil [4,5]. Particularly, large trees act as significant “carbon sinks”, absorbing carbon dioxide (CO2) from the atmosphere through photosynthesis and storing it in their trunks, branches, and roots [6,7]. This process is essential for global climate regulation and carbon sequestration.
In forest management, large trees are often harvested for timber production, following guidelines that allow the extraction of trees with diameters at breast height (DBH) of 50 cm or greater [8,9]. This method involves removing the trunk from the forest, while the canopy and other parts of the tree remain, contributing to nutrient cycling and habitat maintenance [6,10]. Although these practices are designed to minimize environmental impact, the removal of large trees can significantly disturb the natural balance of forests and affect the ecosystem’s ability to function as a carbon stock [11].
Forest management practices aim to preserve ecosystem function, but human intervention, such as selective tree harvesting for timber, inevitably alters forest dynamics [12,13]. This can result in a reduction of the forest’s overall capacity to store carbon, as mature trees, which are effective at storing CO2, are removed [14]. It is important, therefore, that such practices are conducted in a way that does not exceed the forest’s natural regeneration capacity and maintains ecological balance [15,16].
The variability in carbon content observed among different species and even within a single tree, as highlighted in the study by Ma et al. 2018 [17], underscores the importance of conducting detailed research on carbon content. This variability is crucial for developing more precise and environmentally responsible forest management strategies that maximize carbon storage and help mitigate climate change [18,19].
Initiatives such as REDD (reducing emissions from deforestation and forest degradation) and Nature-Based Projects [20,21], which currently encompass carbon credit projects intended to reduce atmospheric CO2 concentrations through improved management practices, reforestation, renewable energy, energy efficiency, and waste management [22,23]. These efforts are essential to mitigate the adverse effects of climate change and promote environmental sustainability. However, the effectiveness of these projects fundamentally depends on a detailed understanding of carbon storage in forests and how management practices impact this storage [24]. Accurate assessments are crucial to ensure that the implemented strategies are effective and contribute significantly to global sustainability and climate stability [25]. This discussion is essential for the ongoing assessment of forest management policies and will be an important agenda item at COP 30, providing a crucial opportunity to review and reinforce global commitments towards a sustainable future.
Our study specifically examines the vertical variation in carbon content within the commercial boles of 19 tree species commercially harvested in a managed forest area in the state of Acre, Brazil. These species were selected for their ecological significance and representativeness within this managed forestry zone, providing a comprehensive view of the carbon dynamics within Amazonian forests subject to forest management. The research aims to refine our understanding of intra- and inter-species variations in carbon content, which are still poorly understood and surrounded by significant uncertainty. By focusing on key scientific questions—what is the variation in carbon storage capacities among selected tree species in the study area, and how do these variations impact the overall accuracy and reliability of carbon stock assessments in tropical forests?—this study seeks to enhance our understanding of the role of managed Amazon forests in the global carbon cycle and inform decision-making on forestry initiatives and payment for ecosystem services [26,27].

2. Materials and Methods
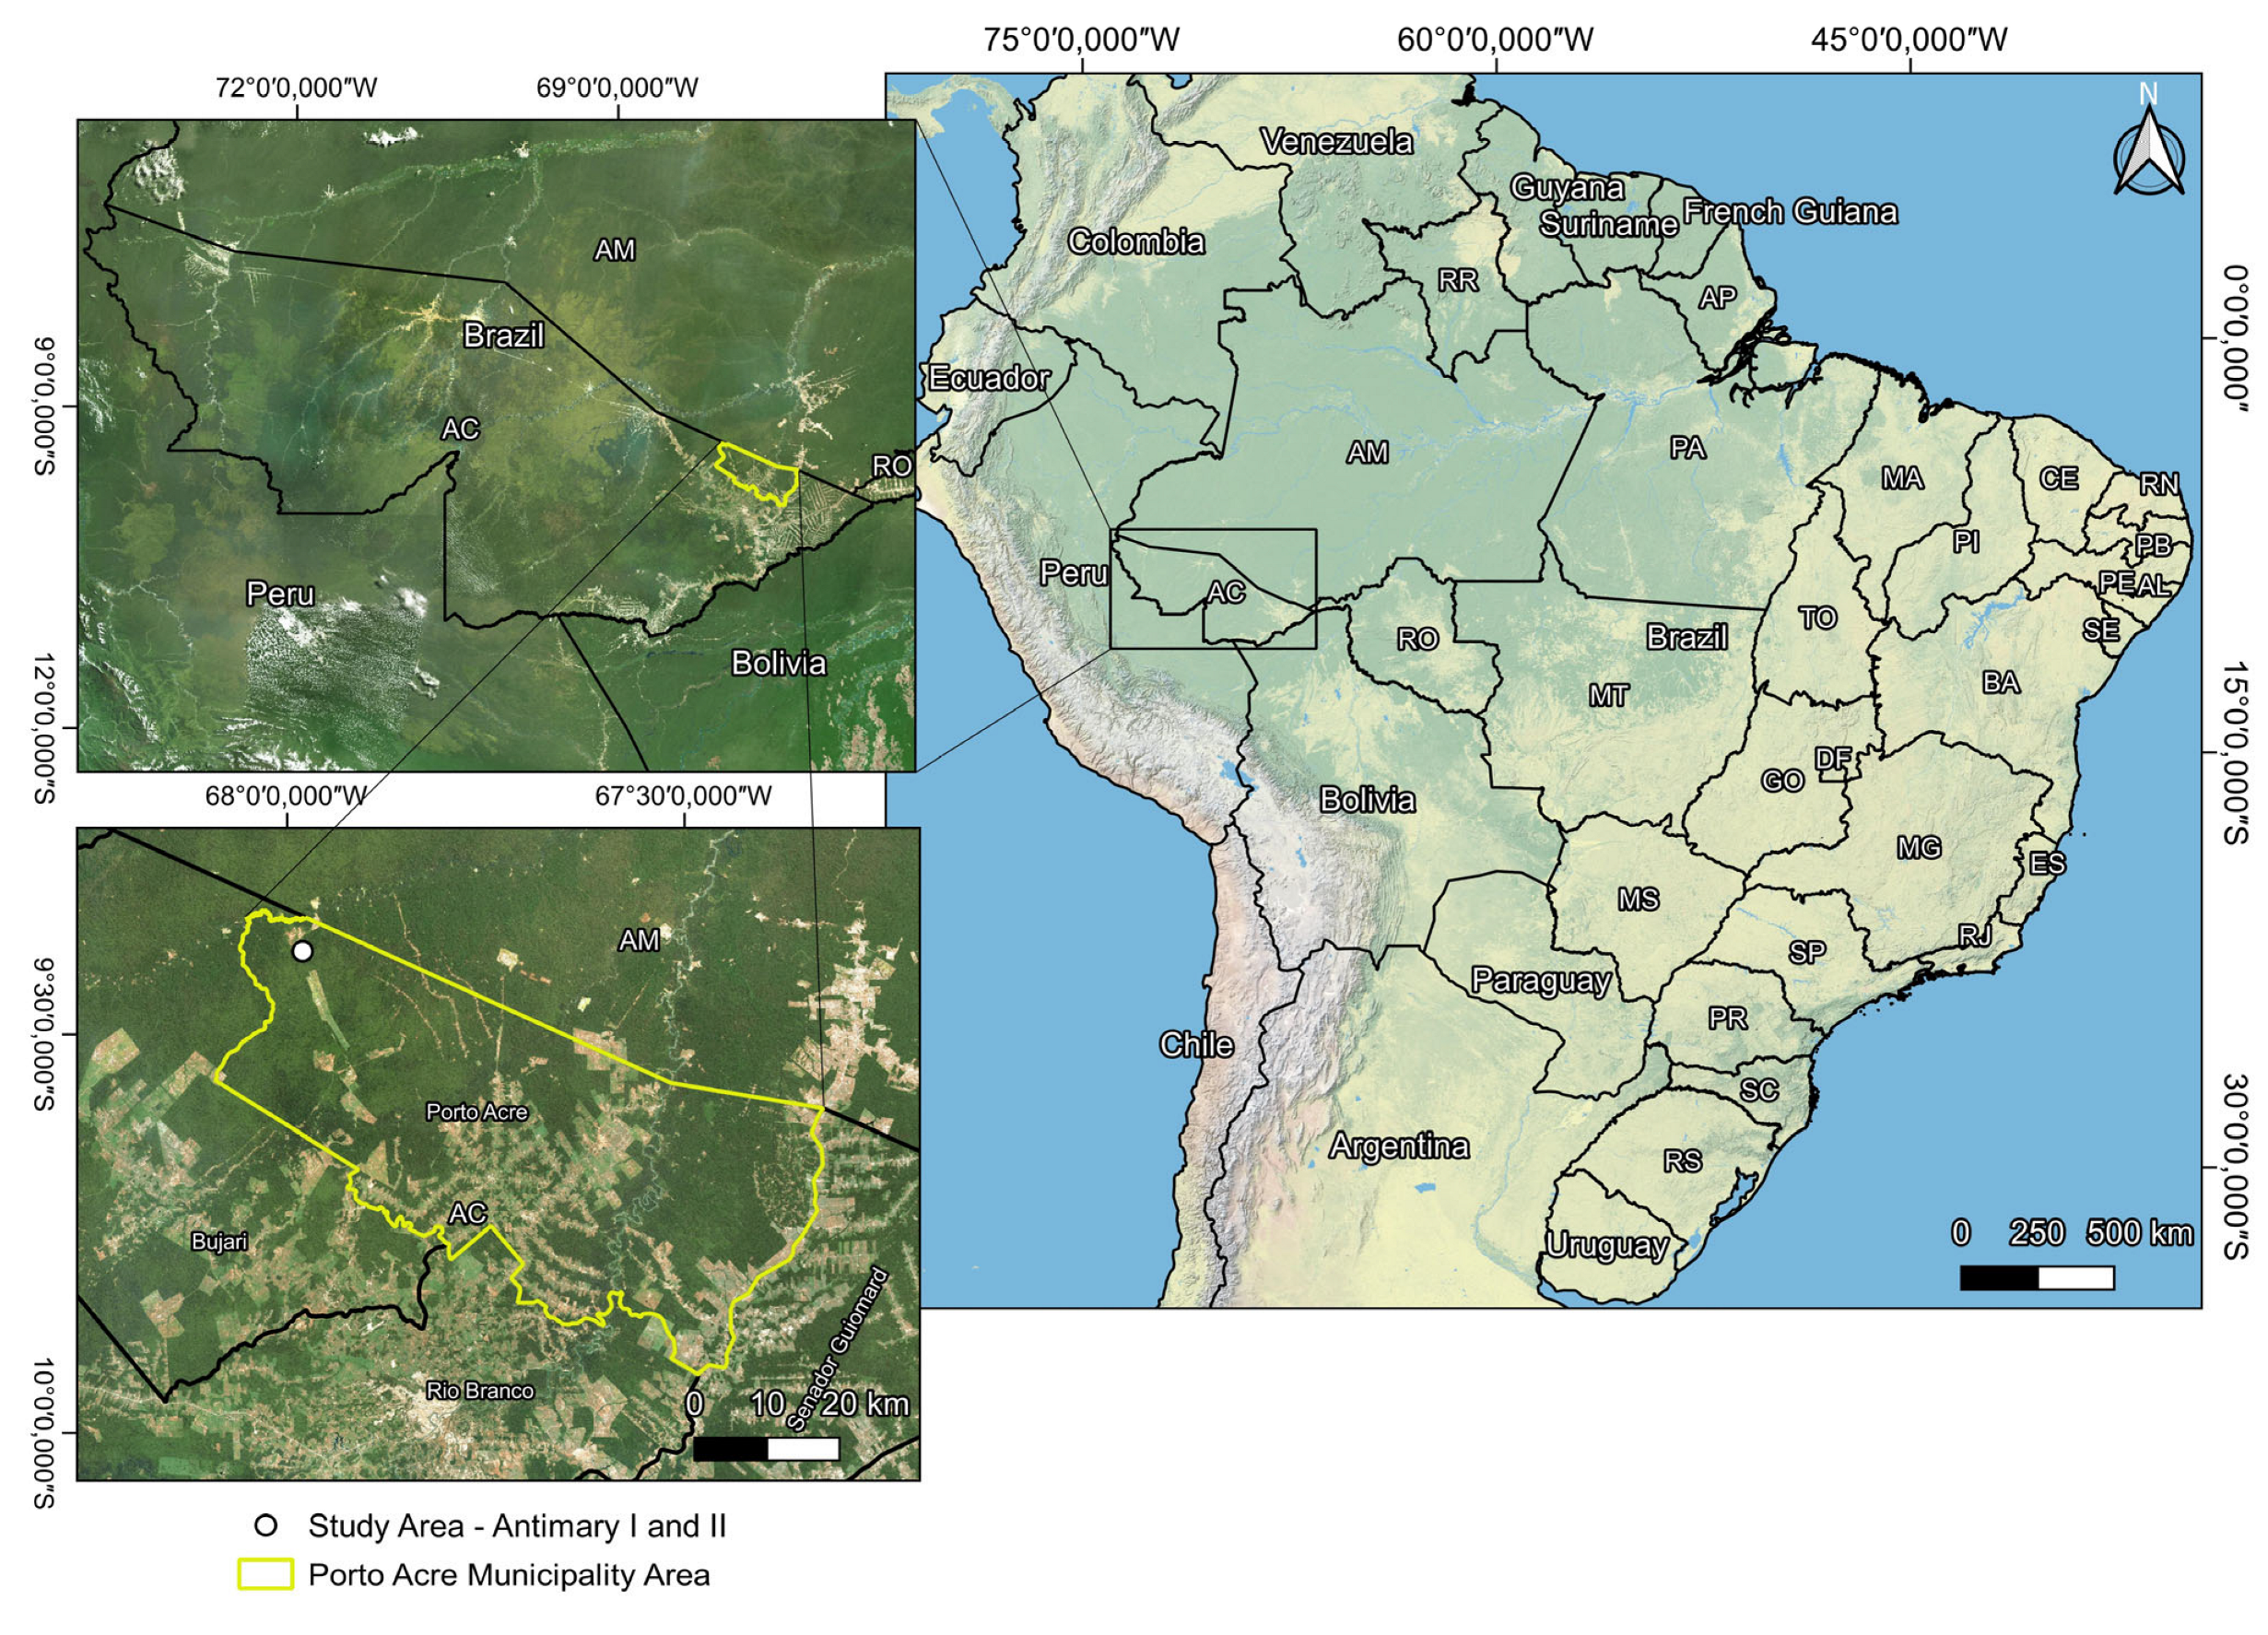
2.1. Study Area

The forest species chosen to be part of this study were large commercial species with significant timber potential. They were obtained in the Antimary I and II ranches (9°23′43″ South latitude, 67°58′50″ West longitude), located in the southwestern Amazon in the municipality of Porto Acre, Acre, Brazil (Figure 1). The vegetation at the site is classified as dryland humid forest [28,29,30], with a predominance of Open Forest with Bamboo, Open Forest with Palms, and Dense Forest [31,32,33].
The climate is type Am under the Köppen classification [34], with an average annual temperature of 24.5 °C [35]. Annual precipitation varies from 1750 to 2250 mm. The rainy season begins in October and lasts until May, with January to March having the greatest rainfall [35,36]. The study area has two types of soil: red argisol and dystrophic red-yellow latosol [33,37]. The predominant topography is flat, with a slope of around 5% [37]. The elevation varies between approximately 220 and 300 m above mean sea level [38].

2.2. Selection and Collection of Samples of Commercial Species

We selected 19 species that are of commercial interest due to their high frequencies of occurrence (stems ha−1) and basal areas (m2 ha−1), collectively accounting for 84.4% of the total commercial basal area at the research site. This selection was based on their significant timber potential and high coverage index values [39], ensuring that our findings would be applicable to the most economically and ecologically important species within the area.
The sampling protocol was carefully designed to reflect the natural distribution of these species. The number of individuals sampled per species was determined in proportion to their relative density and frequency of occurrence [40]. We sampled across a variety of diameter classes to represent the diversity within each species, with the number of trees sampled in each class mirroring the diameter distribution recorded in the company’s forest inventory. In total, 57 sample trees were selected—three from each species—to ensure a diverse and representative dataset. Each tree was initially cut 30 cm above ground level to standardize the starting point of the samples, including those with buttresses. The commercial boles of these trees were systematically sectioned into logs. From each log, a disc approximately 3 cm thick was removed starting from the base and continuing every 4.30 m up the top of the commercial bole for trees with DBH greater than 80 cm and every 8.30 m for trees with DBH between 50 and 80 cm. This method ensured that the first disc was consistently taken at 30 cm above the ground for all trees.
In total, 141 discs were collected, with each tree yielding between 2 and 4 discs based on its diameter and the commercial bole’s height. These discs were classified into sections labeled A, B, C, and D along the commercial bole, providing detailed samples for carbon content analysis [40]. Section A always represented the base of the bole, just 30 cm above the ground, while the heights of Sections B, C, and D varied according to the predetermined sectioning strategy of the commercial bole [41].

2.3. Statistical Analysis and Tree Classification

Our study commenced with the collection of samples from the commercial boles of selected tree species, processed in a laboratory to determine carbon content using a universal analyzer (Elementar, model Vario Micro Cube, Langenselbold, Germany) [42]. This preliminary step set the foundation for our subsequent in-depth statistical analysis that was designed to explore variations in carbon storage capacities among the species and to assess the accuracy of carbon stock assessments.
We utilized both descriptive and inferential statistics to understand the variations in carbon content and other physical characteristics of tree species. Initially, for each species, we calculated the mean and standard deviation to summarize the central tendency and dispersion of carbon content. We constructed confidence intervals (95% CI) for each mean, providing a statistical range within which the true mean is likely to lie with 95% certainty [43].
We employed box plots to visually present the distribution of physical characteristics such as DBH (diameter at breast height), commercial height, basal area, and volume. These plots effectively summarize a range of data points by displaying the median, interquartile range (IQR) and potential outliers, aiding in the comparison of these metrics across different species [43,44].
In addition to descriptive statistics, we used Analysis of Variance (ANOVA) to compare the mean carbon content across multiple tree species. This statistical test for significant differences among species was complemented by the Shapiro–Wilk test to ensure data normality, aligning with the assumptions necessary for accurate ANOVA analysis [45]. During this analysis, we also carefully controlled for Type I error, ensuring the precision of our statistical inferences [46,47]. The size of the effect was calculated using eta-squared (η2), providing insight into the magnitude of the differences observed [48].
Upon identifying significant differences through ANOVA, we conducted post hoc analysis using Tukey’s honest significant difference (HSD) test [47,48]. This test pinpointed specific pairs of species with statistically significant differences in carbon content, providing critical insights into species-specific characteristics that are crucial for effective carbon storage and forest management strategies.
Advanced visualizations further supported our analysis. Line graphs with error bars depicted carbon content across vertical sections (A, B, C, D) of the tree boles, utilizing repeated measures or mixed-effects models to handle data from the same trees at different heights. Additionally, density plots illustrated the distribution of carbon content percentages, offering detailed comparisons across different conditions or species [41].

3. Results

Fifty-seven large trees were sectioned and measured, representing nine families, seventeen genera, and nineteen species, as shown in Table 1. The mean carbon contents in the commercial boles of these trees ranged from 49.08% (±3.36) to 51.81% (±0.6), with an overall average of 50.48% (±0.42). Among the species analyzed, Handroanthus serratifolius stood out with the highest carbon content at 51.81% (±0.6), followed by Astronium lecointei with 51.71% (±0.72), Dipteryx odorata with 51.60% (±0.31) and Cedrela odorata with 51.60% (±0.18).
The study quantified the carbon content of each species, accompanied by the lower and upper bounds of the 95% confidence interval (Table 1). For example, for Ceiba pentandra, the 95% confidence interval was between 47.18% and 50.98%, indicating that, with high certainty, the true mean carbon content of this species lies within this range. Narrower confidence intervals reflect greater credibility in estimates of the mean, while wider intervals indicate higher variability in the data and consequently greater uncertainty in estimates. This information is crucial for species comparisons and for assessing the precision of estimates.

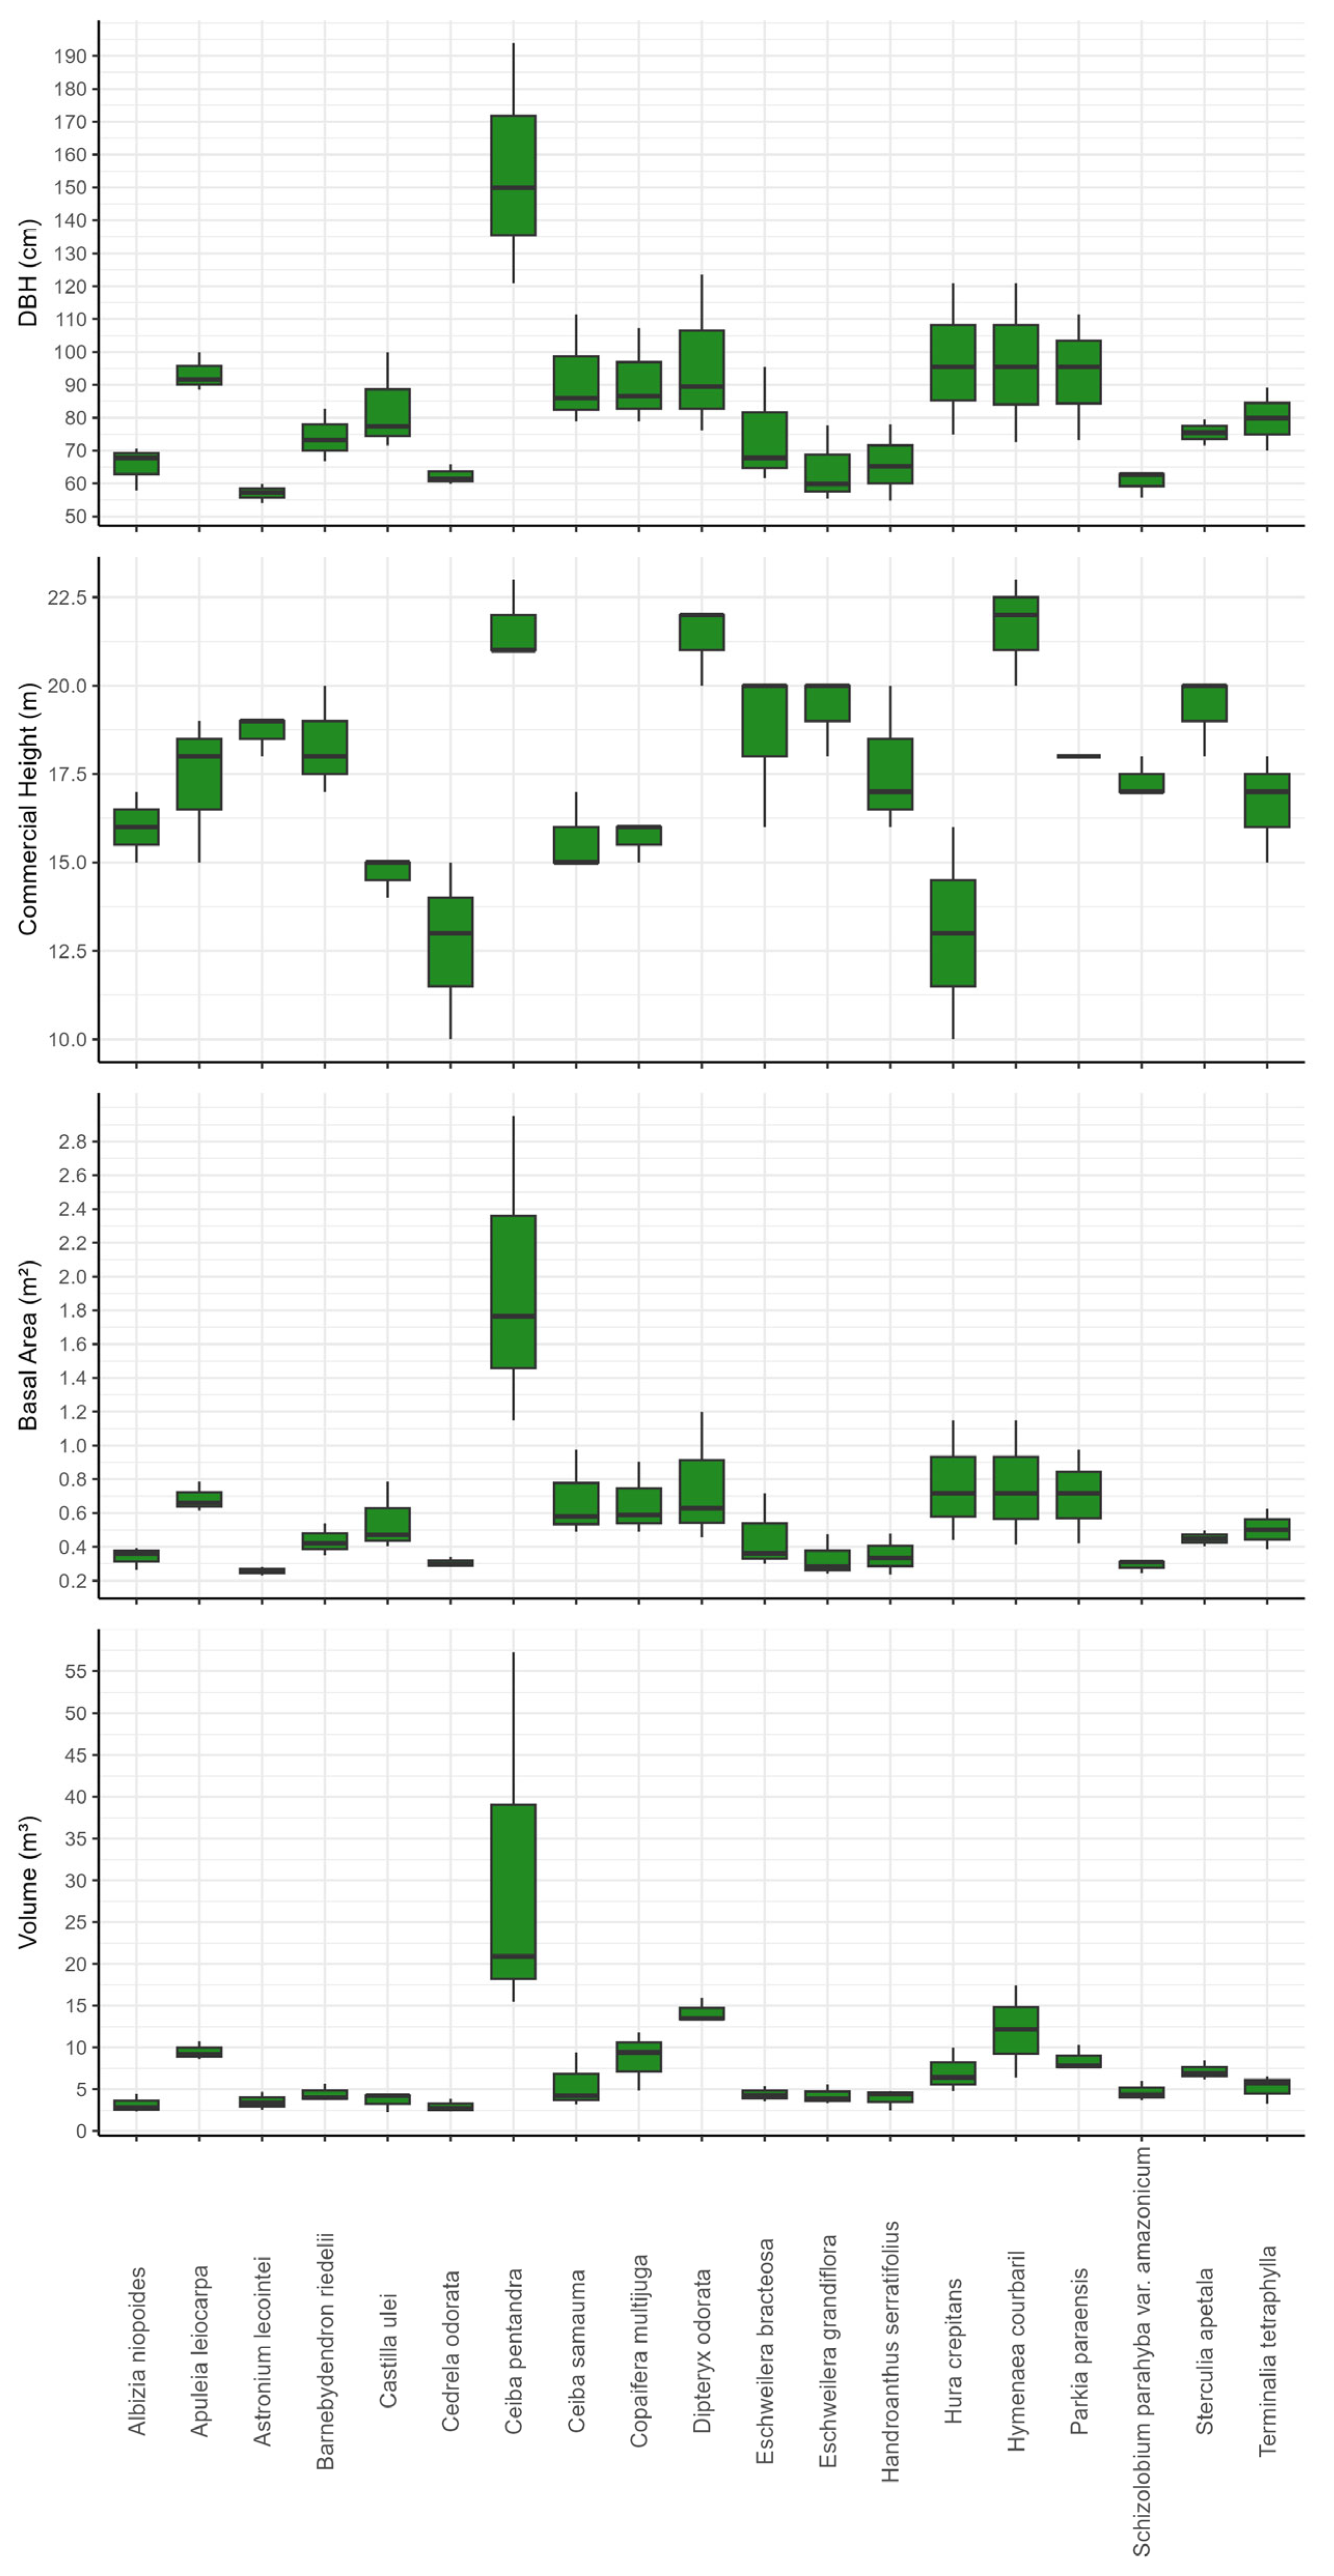
3.1. Variability of Diameter at Breast Height (DBH, Commercial Height, Basal Area and Volume in Commercial Boles

Figure 2 presents a comparative analysis of the variables diameter at breast height (DBH) in cm, commercial height in m, basal area in m2 and volume in m3 of the 19 species in this study. These variables are essential for evaluating the growth, biomass and timber production potential of the sampled species. Each boxplot illustrates the median, interquartile range and outliers, highlighting the variability of each metric among the species.
The first graph, referring to DBH in cm, indicates that most species have median values between 50 and 100 cm. Some species, such as Ceiba pentandra and Hura crepitans, stand out with significantly higher DBH values. The dispersion within certain species, shows a considerable variation in tree size.
The second graph, referring to commercial height in m, shows that most species have commercial heights ranging from 10 to 20 m. Ceiba pentandra has the highest commercial height, exceeding 20 m. The variation in commercial height among species reflects the heterogeneity in timber utilization, directly influencing management and exploitation decisions.
The third and fourth graphs, which represent basal area and volume, respectively, show that species such as Ceiba pentandra contribute significantly to the total biomass of the forest stand. The high volumes of these species indicate their commercial potential, while the lower variability in smaller species suggests a more limited contribution to timber production. These metrics are essential for forest management, allowing the identification of key species for conservation and exploitation.

3.2. Variation in Carbon Content of the Commercial Bole Among Species

The Shapiro–Wilk normality test was conducted to assess the distribution of data across the species, and the results confirmed that all species exhibited normal distributions, with p-values greater than 0.05. An analysis of variance (ANOVA) was conducted to examine the differences in mean carbon content in the commercial boles of the 19 tree species.
The ANOVA revealed significant variations in carbon content among tree families, as detailed in Table 2, emphasizing the differences in carbon storage potential at the family level. The total sum of squares was 50.80, with 25.4 attributed to family differences and an equal amount (25.4) to residuals. The family variation had 8 degrees of freedom while the residuals had 48 degrees of freedom. The mean square for family was 3.18, substantially greater than that of the residuals (0.53), leading to an F value of 6.001. This result indicated a highly significant difference in mean carbon content among the families (p < 0.0001).
Expanding this analysis to species-level differences (Table 3), the ANOVA results further highlighted the diversity in carbon storage capabilities. The total sum of squares remained 50.80, but 41.91 was attributed to species and only 8.89 to residuals. The species variation had 18 degrees of freedom, while the residuals had 38 degrees of freedom. The mean square for species was 2.33, substantially higher than the mean square of the residuals, which was 0.23. The calculated F value for this analysis was 9.954, demonstrating a highly significant difference in mean carbon content among the species (p < 0.0001). These findings underscore the importance of species-specific characteristics in conservation strategies.

Comparison Between Species Using Tukey’s Post Hoc Test and Eta-Squared (η2)

To complement the analysis of variance (ANOVA), Tukey’s post hoc test was conducted to compare the mean carbon contents among the 19 species. The objective was to identify which pairs of species exhibit significant differences in their carbon content. The results of Tukey’s test reveal significant differences between several pairs of species (Table 4). The comparisons presented in Table 4 include only those that showed statistically significant differences, with pairs displaying a p-value below 0.05, which indicates significant variability in carbon content among the species. The most substantial difference was observed between Handroanthus serratifolius and Ceiba pentandra, with a highly significant p-value of less than 0.0001. Conversely, species such as Barnebydendron riedellii and Ceiba samauma did not exhibit statistically significant differences in carbon content, as shown by their higher p-values. For a comprehensive overview of all species comparisons, including those that did not exhibit significant differences, readers are directed to consult the complete table available in the Supplementary Materials (Table S1).
The eta-squared (η2) for the ANOVA is 0.83, indicating a large effect, meaning that 83% of the variability in carbon content is explained by the differences between species. These results indicate that there are statistically significant differences between the mean carbon contents of the species, with some species having means distinctly different from others. The confidence intervals provide plausible ranges for the true population means of the species (Table 1).

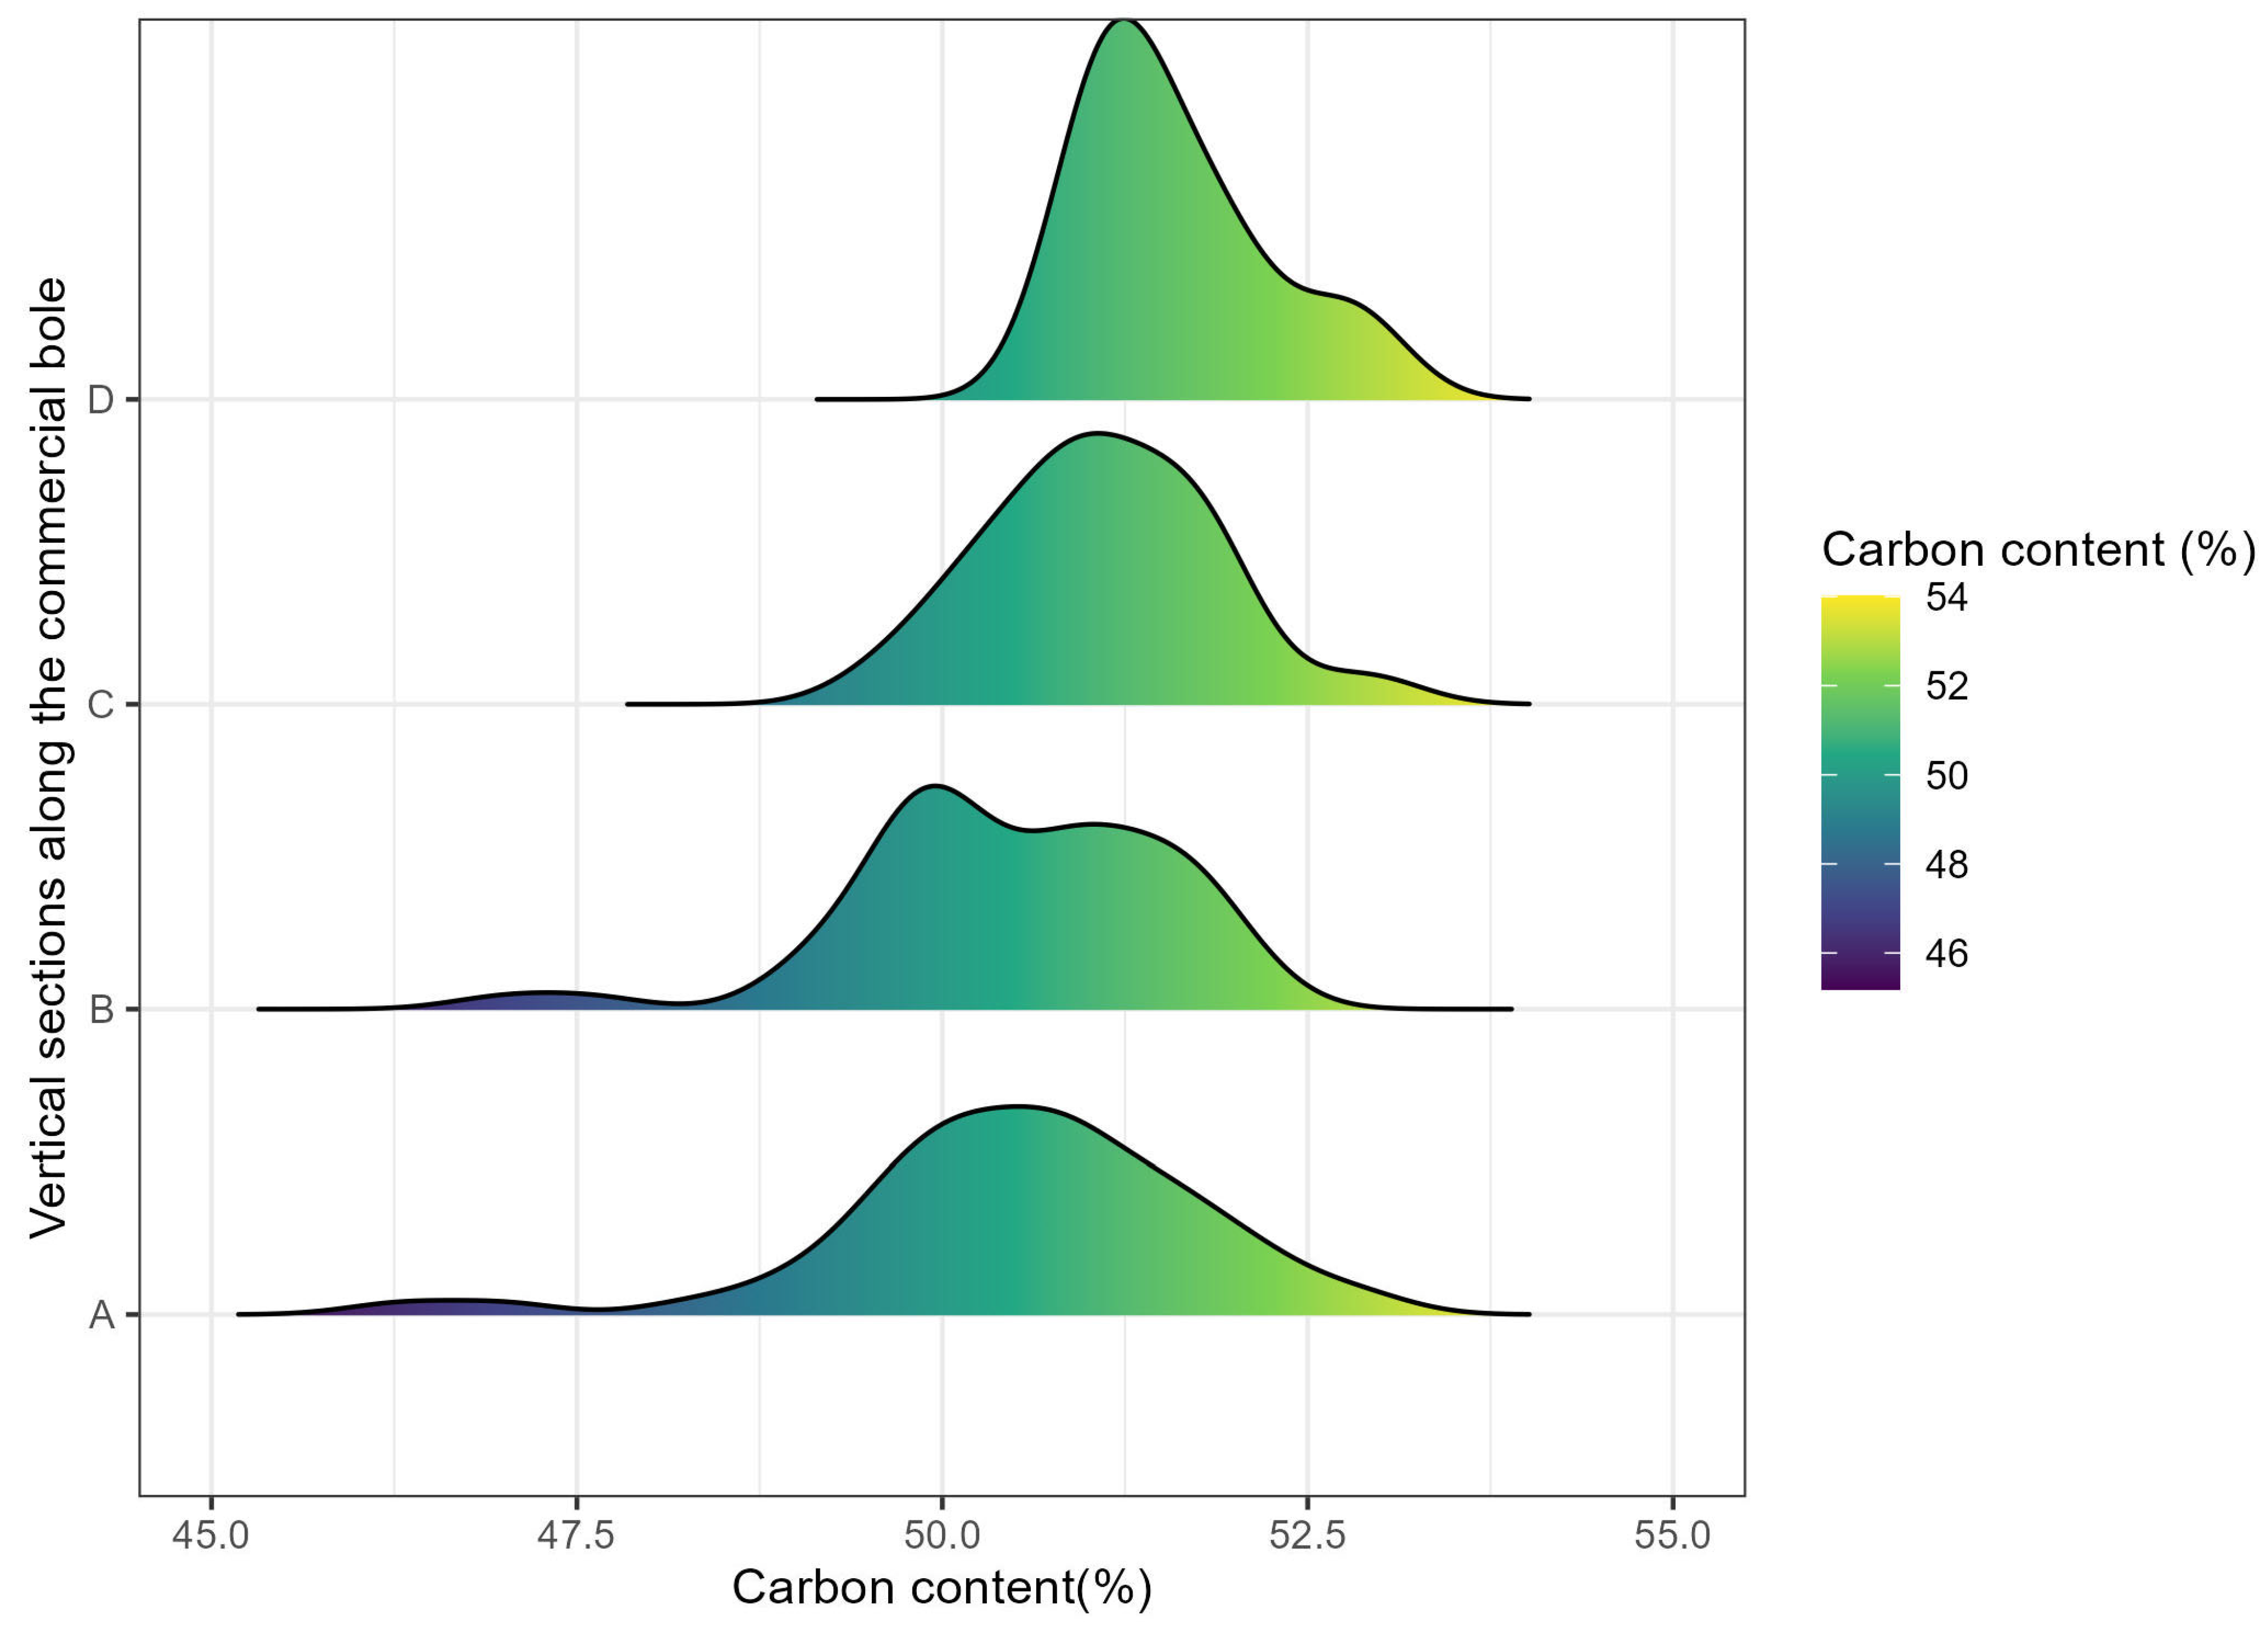
3.3. Variability of Carbon Content Along the Commercial Boles

Figure 3 demonstrates the variability in carbon content across four vertical sections (labeled A, B, C, and D) of commercial tree trunks from 19 tree species. Each line represents a different species, illustrating the vertical variation in carbon content within the stem. Notably, species such as Ceiba pentandra show a significant increase in carbon content from one section to the next, highlighting their unique pattern of carbon accumulation. In contrast, other species exhibit more stable or less pronounced trends in carbon content changes along the stem. This line graph is employed to clearly depict trends and differences in carbon content, making it easier to observe both general and species-specific patterns. The lines allow for direct visual comparison of carbon content across different sections and across species, effectively capturing the dynamics of carbon distribution within tree trunks.
Figure 4 shows the variation in carbon content (%) in five vertical sections of the commercial trunk of the trees analyzed, identified as A, B, C and D. The figure illustrates the distribution of carbon values in each section. The vertical sections are displayed on the x-axis, while the y-axis represents the carbon content in percentage, varying from 43.5% to 52.9%. In sections A and B, the trees show similar behavior, with medians close to 50.5% and relatively wide interquartile ranges. The presence of a value in section A for one species that is far below the values for other species, indicates the existence of local variability in carbon content. Section D presents a more consistent behavior, with a narrower interquartile range and a median of 51.3%. This smaller variation suggests greater uniformity in the distribution of carbon in the upper parts of the stem, indicating a stabilization in the wood composition.

4. Discussion

In this study, a detailed analysis of carbon content was conducted across 57 large trees, encompassing nine families, seventeen genera, and nineteen species. The observed carbon content variation in the commercial boles of these trees ranged significantly from 49.08% to 51.81%, with an overall average of 50.48%. Handroanthus serratifolius stood out with the highest carbon content at 51.81%, followed by Astronium lecointei, Dipteryx odorata, and Cedrela odorata. Therefore, this study highlights the biological diversity and variability in carbon sequestration capacity among the species, suggesting that forest management and conservation strategies should consider these differences to optimize carbon sequestration [49].
The 95% confidence intervals for each species provide important insights into the precision of carbon estimates. For example, for Ceiba pentandra, the confidence interval ranged from 47.18% to 50.98%, indicating high certainty that the true average carbon content of this species lies within this range [50]. Narrower confidence intervals reflect greater credibility in average estimates, while wider intervals indicate greater variability in the data and, consequently, more uncertainty in the estimates [51].
Variations in carbon content among different species underscore the complexity of carbon management in tropical forests and the importance of approaches tailored to the specific characteristics of each species [52,53]. This biological diversity must be considered when developing strategies for forest management, ensuring that the carbon sequestration potential of each species is fully utilized [54]. Additionally, the data obtained reinforce the need for policies based on solid scientific evidence to maximize the effectiveness of conservation and forest management initiatives.

4.1. Variability in Biomass and Its Contribution to Timber Production

The variability observed in the physical dimensions of the trees, as evidenced by results for diameter at breast height (DBH), commercial height, basal area, and volume, has significant implications for sustainable forest management. Trees with larger DBH and commercial height, such as Ceiba pentandra and Hura crepitans, not only indicate maturity and structural stability but also possess a high potential for carbon storage due to their large biomass. These characteristics make them crucial for management strategies aimed at maximizing carbon storage, a key element in combating climate change.
The analysis of basal area and volume shows that certain species contribute significantly to the total biomass of the forest. These trees, due to their high volume, are of substantial commercial interest but are also important for maintaining biodiversity and ecological integrity of the forest. The management of these trees must balance timber production with environmental conservation, ensuring that extraction does not compromise the forest’s regenerative capacity [55].
Specific species, such as Ceiba pentandra, stand out not only for their larger diameters, greater heights, and significant volumes but also for demonstrating a substantial increase in carbon content from one section to the next. This reflects a specialized adaptation to optimize light capture and photosynthetic efficiency in the canopy [56,57]. Conversely, other species, such as Handroanthus serratifolius, although exhibiting a similar pattern of carbon content increase, have smaller diameters and lower heights, resulting in smaller volumes but with higher carbon content than Ceiba pentandra.
The accumulation in the upper parts of the trunk indicates an effective carbon storage strategy, important for regulating the carbon cycle in the ecosystem. This characteristic is particularly important, considering that the 19 species analyzed exhibit various carbon storage strategies, influenced by their physical dimensions and adapted to their specific ecological conditions [58,59]. Understanding these differences is essential for developing forest management practices that respect the unique characteristics of each species, optimizing both timber production and carbon storage.

4.2. Variability of Carbon Content Along the Commercial Boles Among Species

The analysis of variance (ANOVA) highlighted significant variations in carbon content among the studied species, emphasizing the diversity in their carbon storage capabilities. The marked differences between species, indicated by an F value of 9.954 and p < 0.0001, not only highlight biological heterogeneity but also have significant implications for forest resource management and conservation policy formulation [60].
The Tukey post hoc test identified significant differences in carbon content between pairs of species, providing essential insights for forest management. For example, the notable difference between Handroanthus serratifolius and Ceiba pentandra suggests that specific management strategies may be needed to optimize carbon storage in the forest for these species. The high eta-squared value (η2 = 0.83) reveals that most of the variability in carbon content is explained by differences between species, highlighting the importance of carbon models that integrate this specific variability to refine carbon estimates.
Figure 3 and Figure 4 illustrate the variability of carbon content along different vertical sections of the commercial boles of various tree species, revealing distinct patterns of carbon accumulation. These patterns are crucial for understanding the dynamics of carbon storage in forests and their implications for forest management and conservation strategies.
The observed variability in vertical sections of the boles indicates that carbon stock estimates that overlook this variability might significantly underestimate the amount of carbon stored. This underscores the need for carbon stock models that incorporate detailed data from different parts of the trees to enhance the accuracy of estimates.
Understanding these patterns of carbon accumulation can guide forest management strategies, particularly in selecting species and harvesting practices that consider the carbon storage profile of the trees. Strategies that preserve parts of the trunk with higher carbon content can increase carbon retention in the system, significantly contributing to climate change mitigation.
The consistency observed in section D, with less variability, suggests that the wood composition stabilizes in the upper parts of the trunk, an important consideration for management strategies focused on the use of specific parts of the tree for different commercial purposes. It may also indicate that the younger parts of the trunk, which generally grow more rapidly, might play a less significant role in carbon storage compared to the lower parts.
This point is corroborated by a review by Ma et al. [17], who calculated an average carbon content of 47.9% in tree trunks on a global scale, a value lower than that for any species we studied in southwestern Amazonia. In contrast, a study near Manaus (in central Amazonia) conducted by da Silva ([61], p. 61) reported an average carbon content of 48.5% (±0.3%) in the trunks of 44 trees, suggesting that carbon values can vary significantly between different regions of the Amazon, although both studies in the Amazon show higher carbon content than the 47% IPCC (Intergovernmental Panel on Climate Change) default value [62].

4.3. Implications for Climate Change Policies and Forest Management

Substantial variations in carbon content among species underscore the urgent need to adapt forest management practices and conservation strategies to optimize carbon sequestration. Incorporating detailed knowledge of each species’ unique characteristics into land use and conservation policies can significantly enhance the management of forest resources, boosting the contribution of forests in combating climate change.
The carbon content data collected provide a fundamental basis for future research into species’ adaptive responses in forest management areas, particularly in scenarios where trees undergo cutting and regeneration cycles ranging from 20 to 30 years [63]. Each species uniquely contributes to the biodiversity and ecological functionality of forests, and harvesting these trees can result in the loss of critical ecological functions.
The study highlights concerns about the vulnerability of species in managed areas, exemplified by mahogany (Swietenia macrophylla), which is banned from exploitation in Brazil due to its threatened status. Similarly, garapeira (Apuleia leiocarpa), despite its abundance in study areas, is classified as vulnerable, emphasizing the urgent need for its conservation to prevent extinction [63]. Human exploitation has globally accelerated species extinction, with events that would naturally occur once in periods of millennia recurring in just a few decades [64,65,66]. This acceleration not only threatens the survival of species like garapeira but also compromises the ecological integrity of their habitats.
Previous research shows that the overexploitation of key species, particularly commercial large trees that store significant amounts of carbon, results in significant ecological imbalances. By extracting the trunk and leaving only the crown and stump, the forest loses regenerative capacity [67]. This underscores the need to develop conservation strategies that not only quantify but also enhance the ecological quality of regeneration. Such strategies should focus on replenishing carbon stocks and recovering ecological diversity.
Reviewing carbon estimates based on local studies is crucial, especially considering the significant impact of deforestation in the Amazon on global emissions. The data collected in this study reveal a notable discrepancy between the mean carbon content of the analyzed species, at 50.48%, and the standard value of 47% used by the IPCC [62]. This difference is particularly relevant in forest management areas, where large trees with higher basic densities (hardwood) predominate, which are directly related to biomass stocks [47,68].
To put this in perspective, the difference between the average carbon content of the 19 tree species we studied (50.48) and the IPCC standard value of 47% used in Brazil’s most recent climate communication ([69], p. 161) implies 7.40% higher emissions from deforestation, or an increase of 29.42 TgCO2e (8.02 TgC) above the 397.4 TgCO2e reported in the last inventory year (2016) ([69], p. 12). The entire energy sector of Brazil, including all fossil fuel use for vehicles and electricity generation, emitted 423.6 TgCO2e in 2016 ([70], p. 12). The metropolitan area of São Paulo, the fourth largest city in the world, represents 10% of Brazil’s population and approximately this percentage of its energy emissions, meaning the implicit underestimation of annual deforestation emissions due to the Amazon forest’s carbon content represents approximately 68% of São Paulo’s energy emissions. This merely illustrates the scale of the problem, as 19 species are insufficient to adequately characterize the Amazon Forest. However, disregarding differences in carbon content may compromise the accuracy of estimates of carbon stocks and the impact of degradation and loss of Amazon Forest on global climate.

5. Conclusions

This study has detailed the variability in carbon content among different tree species in the Amazon, revealing significant differences that could influence forest management strategies and climate change policies. We observed that the mean carbon content (50.48%) across the 19 species studied is higher than the IPCC’s standard value of 47%, suggesting that previous estimates of carbon stocks in the Amazon might have been underestimated. This finding is crucial as it implies that current policies based on standard values may not be robust enough to capture the real contribution of tropical forests in carbon storage and climate change mitigation.
The diversity in carbon storage capacity among species underscores the need to develop forest management models that consider the specific characteristics of each species to maximize carbon storage potential. Additionally, the observed variability suggests that standard management practices may not be suitable for all species, reinforcing the importance of tailored approaches to conservation and forest management.
For the future, we recommend conducting further studies to explore more deeply the intra- and interspecific variability in carbon content in other regions of the Amazon. This will help refine carbon estimates further and develop more effective management strategies that align with global sustainability and environmental conservation goals. Finally, this study not only contributes to the scientific understanding of carbon storage in tropical forests but also provides practical insights for forest management and conservation policies that are essential for combating climate change on a global scale.

Supplementary Materials

The following supporting information can be downloaded at: https://www.mdpi.com/article/10.3390/su17072960/s1, Table S1. Tukey’s Post-Hoc test results for species comparisons.

Author Contributions

Conceptualization, F.M.B.R.; formal analysis, F.M.B.R.; investigation, F.M.B.R., L.A.G.J., J.P.S.L., A.d.C.O.C. and P.M.F.; supervision, P.M.F. and E.B.B.; writing—original draft, F.M.B.R.; writing—review and editing, L.A.G.J., E.B.B., J.P.S.L., A.d.C.O.C., M.V.G.S.C., M.T.G.L., S.J.S.S.d.R. and P.M.F., funding, E.B.B., J.P.S.L., F.M.B.R. and P.M.F. All authors have read and agreed to the published version of the manuscript.

Funding

This research was funded by Conselho Nacional de Desenvolvimento Científico e Tecnológico (CNPq 311103/2015-4, 406941/2022-0), Rede Clima (FINEP/Rede Clima 01.13.0353-00), Coordenação de Aperfeiçoamento de Pessoal de Nível Superior (CAPES) and INPA (PRJ15.125 & Programa PCI).

Institutional Review Board Statement

Not applicable.

Informed Consent Statement

Not applicable.

Data Availability Statement

The data presented in this study are openly available in Zenodo at https://doi.org/10.5281/zenodo.14263317 (accessed on 15 March 2025).

Acknowledgments

We thank Fox Laminados, Ltda for allowing us to collect samples in their forest management area. MBR thanks the Coordenação de Aperfeiçoamento de Pessoal de Nível Superior (CAPES) for a postdoctoral fellowship at the Federal University of Viçosa and INPA’s Programa de Capacitação Institucional (PCI) for a post-doctoral fellowship at INPA.

Conflicts of Interest

The authors declare no conflicts of interest.

References

  1. Fearnside, P.M. Effects of land use and forest management on the carbon cycle in the Brazilian Amazon. J. Sustain. For. 2001, 12, 79–97. [Google Scholar] [CrossRef]
  2. Flato, G.; Marotzke, J.; Abiodun, B.; Braconnot, P.; Chou, S.C.; Collins, W.; Cox, P.; Driouech, F.; Emori, S.; Eyring, V. Evaluation of climate models. In Climate Change 2013: The Physical Science Basis. Contribution of Working Group I to the Fifth Assessment Report of the Intergovernmental Panel on Climate Change; Cambridge University Press: Cambridge, UK, 2014; pp. 741–866. [Google Scholar]
  3. Nieder, R.; Benbi, D.K. Carbon and Nitrogen in the Terrestrial Environment; Springer Science & Business Media: Dordrecht, The Netherlands, 2008. [Google Scholar]
  4. Mooney, H. The carbon balance of plants. Annu. Rev. Ecol. Syst. 1972, 3, 315–346. [Google Scholar] [CrossRef]
  5. Kuzyakov, Y.; Domanski, G. Carbon input by plants into the soil. Review. J. Plant Nutr. Soil Sci. 2000, 163, 421–431. [Google Scholar] [CrossRef]
  6. Romero, F.M.B.; Jacovine, L.A.G.; Torres, C.M.M.E.; Ribeiro, S.C.; da Rocha, S.J.S.S.; Novais, T.D.N.O.; de Oliveira Gaspar, R.; da Silva, L.F.; Vidal, E.; Leite, H.G.; et al. Aboveground biomass allometric models for large trees in southwestern Amazonia. Trees For. People 2022, 9, 100317. [Google Scholar] [CrossRef]
  7. de Lima, R.B.; Görgens, E.B.; da Silva, D.A.S.; de Oliveira, C.P.; Batista, A.P.B.; Caraciolo Ferreira, R.L.; Costa, F.R.C.; de Lima, R.A.F.; Aparício, P.d.S.; de Abreu, J.C.; et al. Giants of the Amazon: How does environmental variation drive the diversity patterns of large trees? Glob. Change Biol. 2023, 29, 4861–4879. [Google Scholar] [CrossRef]
  8. Lutz, J.A.; Furniss, T.J.; Johnson, D.J.; Davies, S.J.; Allen, D.; Alonso, A.; Anderson-Teixeira, K.J.; Andrade, A.; Baltzer, J.; Becker, K.M.L.; et al. Global importance of large-diameter trees. Glob. Ecol. Biogeogr. 2018, 27, 849–864. [Google Scholar] [CrossRef]
  9. Brazil, CONAMA (Conselho Nacional do Meio Ambiente). Resolução No 406, de 02 de Fevereiro de 2009. Diário Oficial da União. No 26, 2 February 2009, Brasília, DF, Brazil. Available online: http://www.tjpa.jus.br/CMSPortal/VisualizarArquivo?idArquivo=8372 (accessed on 3 August 2020).
  10. Romero, F.M.B.; Jacovine, L.A.G.; Ribeiro, S.C.; Ferreira Neto, J.A.; Ferrante, L.; da Rocha, S.J.; Torres, C.M.; de Morais Junior, V.T.; Gaspar, R.D.; Velasquez, S.I.; et al. Stocks of carbon in logs and timber products from forest management in the southwestern Amazon. Forests 2020, 11, 1113. [Google Scholar] [CrossRef]
  11. Wyant, J.G.; Meganck, R.A.; Ham, S.H. A planning and decision-making framework for ecological restoration. Environ. Manag. 1995, 19, 789–796. [Google Scholar]
  12. Frelich, L.E.; Jõgiste, K.; Stanturf, J.A.; Parro, K.; Baders, E. Natural disturbances and forest management: Interacting patterns on the landscape. In Ecosystem Services from Forest Landscapes: Broadscale Considerations; Springer: Cham, Switzerland, 2018; pp. 221–248. [Google Scholar]
  13. Franklin, J.F.; Johnson, K.N.; Johnson, D.L. Ecological Forest Management; Waveland Press: Long Grove, IL, USA, 2018. [Google Scholar]
  14. Nunes, L.J.; Meireles, C.I.; Pinto Gomes, C.J.; Almeida Ribeiro, N.M. Forest contribution to climate change mitigation: Management oriented to carbon capture and storage. Climate 2020, 8, 21. [Google Scholar] [CrossRef]
  15. Roopsind, A.; Wortel, V.; Hanoeman, W.; Putz, F.E. Quantifying uncertainty about forest recovery 32-years after selective logging in Suriname. For. Ecol. Manag. 2017, 391, 246–255. [Google Scholar] [CrossRef]
  16. David, H.C.; Carvalho, J.O.; Pires, I.P.; Santos, L.S.; Barbosa, E.S.; Braga, N.S. A 20-year tree liberation experiment in the Amazon: Highlights for diameter growth rates and species-specific management. For. Ecol. Manag. 2019, 453, 117584. [Google Scholar] [CrossRef]
  17. Ma, S.; He, F.; Tian, D.; Zou, D.; Yan, Z.; Yang, Y.; Zhou, T.; Huang, K.; Shen, H.; Fang, J. Variations and determinants of carbon content in plants: A global synthesis. Biogeosciences 2018, 15, 693–702. [Google Scholar] [CrossRef]
  18. Ussiri, D.A.; Lal, R. Carbon Sequestration for Climate Change Mitigation and Adaptation; Springer: Cham, Switzerland, 2017; pp. 287–325. [Google Scholar]
  19. Golden, D.; Smith, M.A.; Colombo, S. Forest carbon management and carbon trading: A review of Canadian forest options for climate change mitigation. For. Chron. 2011, 87, 625–635. [Google Scholar] [CrossRef]
  20. Thorburn, C. Seeing the forest for the carbon: Interrogating reduced emissions from deforestation and degradation (REDD). In Critical Reflections on Development; Palgrave Macmillan: London, UK, 2013; pp. 139–161. [Google Scholar]
  21. Miah, M.D. Reducing Emissions from Deforestation and Forest Degradation (REDD+). In Life on Land; Springer: Berlin/Heidelberg, Germany, 2020; pp. 797–807. [Google Scholar]
  22. Salma, A.; Fryda, L.; Djelal, H. Biochar: A key player in carbon credits and climate mitigation. Resources 2024, 13, 31. [Google Scholar] [CrossRef]
  23. Amowine, N. The impact of forestation and renewable energy utilisation on environmental efficiency in Africa. Econ. Res.-Ekon. Istraživanja 2023, 36, 2180412. [Google Scholar] [CrossRef]
  24. Vidal, E.; West, T.A.P.; Putz, F.E. Recovery of biomass and merchantable timber volumes twenty years after conventional and reduced-impact logging in Amazonian Brazil. For. Ecol. Manag. 2016, 376, 1–8. [Google Scholar] [CrossRef]
  25. Avila, A.L.; Schwartz, G.; Ruschel, A.R.; Lopes, J.C.; Silva, J.N.M.; Carvalho, J.O.P.; Dormann, C.F.; Mazzei, L.; Soares, M.H.M.; Bauhus, J. Recruitment, growth and recovery of commercial tree species over 30 years following logging and thinning in a tropical rain forest. For. Ecol. Manag. 2017, 385, 225–235. [Google Scholar] [CrossRef]
  26. Chambers, J.Q.; dos Santos, J.; Ribeiro, R.J.; Higuchi, N. Tree damage, allometric relationships, and above-ground net primary production in central Amazon forest. For. Ecol. Manag. 2001, 152, 73–84. [Google Scholar] [CrossRef]
  27. Nandal, A.; Yadav, S.S.; Rao, A.S.; Meena, R.S.; Lal, R. Advance methodological approaches for carbon stock estimation in forest ecosystems. Environ. Monit. Assess. 2023, 195, 315. [Google Scholar] [CrossRef]
  28. Goodman, R.C.; Phillips, O.L.; Baker, T.R. The importance of crown dimensions to improve tropical tree biomass estimates. Ecol. Appl. 2014, 24, 680–698. [Google Scholar] [CrossRef]
  29. Higuchi, N.; dos Santos, J.; Ribeiro, R.J.; Minette, L.; Biot, Y. Biomassa da parte aérea da vegetação da floresta tropical úmida de terra-firme da Amazônia brasileira. Acta Amaz. 1998, 28, 153. [Google Scholar] [CrossRef]
  30. Achard, F.H.; Stibig, F.; Eva, H.; Mayaux, P. Tropical forest cover monitoring in the humid tropics: TREES project. Trop. Ecol. 2002, 43, 9–20. Available online: https://publications.jrc.ec.europa.eu/repository/handle/JRC22838 (accessed on 15 March 2025).
  31. d’Oliveira, M.V.N. Sustainable Forest Management for Small Farmers in Acre State in the Brazilian Amazon. Ph.D. Thesis, University of Aberdeen, Aberdeen, UK, 2000. [Google Scholar]
  32. Salimon, C.I.; Putz, F.E.; Menezes-Filho, L.; Anderson, A.; Silveira, M.; Brown, I.F.; Oliveira, L. Estimating state-wide biomass carbon stocks for a REDD plan in Acre, Brazil. For. Ecol. Manag. 2011, 262, 555–560. [Google Scholar] [CrossRef]
  33. Selivon, C.A. Plano de Operação Anual-POA, UPA-002. Fazenda Antimari I e II; Fox Laminados Ltd.: Rio Branco, Acre, Brazil, 2014. [Google Scholar]
  34. Alvares, C.A.; Stape, J.L.; Sentelhas, P.C.; Gonçalves, J.L.M.; Sparovek, G. Köppen’s climate classification map for Brazil. Meteorol. Z. 2013, 22, 711–728. [Google Scholar] [CrossRef]
  35. d’Oliveira, M.V.; Braz, E.M. Estudo da dinâmica da floresta manejada no projeto de manejo florestal comunitário do PC Pedro Peixoto na Amazônia Ocidental. Acta Amaz. 2006, 36, 177–182. [Google Scholar] [CrossRef]
  36. RADAMBRASIL. Folha SC. 19, Levantamento de Recursos Naturais (Geologia, Geomorfologia, Pedologia, Vegetação, Uso Potencial da Terra Rio Branco, v. 12. DNPM: Rio de Janeiro, RJ, Brazil. 1976. Available online: https://biblioteca.ibge.gov.br/visualizacao/livros/liv3591_cd.zip (accessed on 7 March 2025).
  37. IBGE (Instituto Brasileiro de Geografia e Estatística). Mapas Temáticos: Solos Estaduais/Acre. 2005. Available online: https://mapas.ibge.gov.br/tematicos/solos.html (accessed on 18 January 2024).
  38. Acre. SEMA (Secretaria do Meio Ambiente). Zoneamento Ecológico-Econômico do Estado do Acre, Fase II (Escala 1:250.000): Documento Síntese, 2nd ed.; Secretaria do Meio Ambiente (SEMA): Rio Branco, Acre, Brazil, 2010; 152p, Available online: https://drive.google.com/drive/folders/1K3MH1K6fenD7_e33EH1biwRS_ykU2RWa (accessed on 7 March 2025).
  39. Moro, M.F.; Martins, F.R. Métodos de levantamento do componente arbóreo-arbustivo. In Fitossociologia No Brasil, Métodos e Estudos de Caso; Felfili, J.M., Eisenlohr, P.V., d’Melo, M.M.d’.F., d’Andrade, L.A., Neto, J.A.A.M., Eds.; Universidade Federal de Viçosa: Viçosa, MG, Brazil, 2011; pp. 174–212. [Google Scholar]
  40. Silva, H.F.; Ribeiro, S.C.; Botelho, S.A.; Faria, R.A.V.B.; Teixeira, M.B.R.; Mello, J.M. Estimativa do estoque de carbono por métodos indiretos em área de restauração florestal em Minas Gerais. Sci. For. 2015, 43, 943–953. [Google Scholar] [CrossRef]
  41. Romero, F.M.B.; de Nazaré Oliveira Novais, T.; Jacovine, L.A.G.; Bezerra, E.B.; de Castro Lopes, R.B.; de Holanda, J.S.; Reyna, E.F.; Fearnside, P.M. Wood basic density in large trees: Impacts on biomass estimates in the southwestern Brazilian Amazon. Forests 2024, 15, 734. [Google Scholar] [CrossRef]
  42. Pulidori, E.; Gonzalez-Rivera, J.; Pelosi, C.; Ferrari, C.; Bernazzani, L.; Bramanti, E.; Tiné, M.R.; Duce, C. Thermochemical evaluation of different waste biomasses (citrus peels, aromatic herbs, and poultry feathers) towards their use for energy production. Thermo 2023, 3, 66–75. [Google Scholar] [CrossRef]
  43. Husch, B. Forest Mensuration and Statistics; Ronald Press: New York, NY, USA, 1963. [Google Scholar]
  44. Spurr, S.H. Forest Inventory; Ronald Press: New York, NY, USA, 1952. [Google Scholar]
  45. Peck, R.; Olsen, C.; Devore, J.L. Introduction to Statistics and Data Analysis; Cengage Learning: Independence, KY, USA, 2015. [Google Scholar]
  46. Parra-Frutos, I. Preliminary tests when comparing means. Comput. Stat. 2016, 31, 1607–1631. [Google Scholar] [CrossRef]
  47. Sokal, R.R.; Rohlf, F.J. Biometry: The Principles and Practices of Statistics in Biological Research, 3rd ed.; W.H. Freeman: New York, NY, USA, 1995; 887p. [Google Scholar]
  48. Montgomery, D.C. Design and Analysis of Experiments; John Wiley & Sons: New York, NY, USA, 2017; 735p. [Google Scholar]
  49. Mansourian, S.; Parrotta, J.A.; Sasaki, N.; Schmitt, C.B.; Thompson, I.D.; van Vliet, N. Impacts of forest and land management on biodiversity and carbon. In Understanding Relationships Between Biodiversity, Carbon, Forests and People: The Key to Achieving REDD+ Objectives; International Union of Forest Research Organizations: Vienna, Austria, 2012; pp. 53–82. [Google Scholar]
  50. Worbes, M.; Staschel, R.; Roloff, A.; Junk, W.J. Tree ring analysis reveals age structure, dynamics and wood production of a natural forest stand in Cameroon. For. Ecol. Manag. 2003, 173, 105–123. [Google Scholar] [CrossRef]
  51. Lu, D.; Ye, M.; Hill, M.C. Analysis of regression confidence intervals and Bayesian credible intervals for uncertainty quantification. Water Resour. Res. 2012, 48, W09550. [Google Scholar] [CrossRef]
  52. Feng, Q.; Yang, H.; Liu, Y.; Liu, Z.; Xia, S.; Wu, Z.; Zhang, Y. Interdisciplinary perspectives on forest ecosystems and climate interplay: A review. Environ. Rev. 2024, 33, 1–21. [Google Scholar] [CrossRef]
  53. Wolfslehner, B.; Linser, S.; Pülzl, H.; Bastrup-Birk, A.; Camia, A.; Marchetti, M. Forest Bioeconomy—A New Scope for Sustainability Indicators; European Forest Institute: Joensuu, Finland, 2016; 31p. [Google Scholar]
  54. Palo, M.; Uusivuori, J.; Mery, G.; Korotkov, A.V.; Humphreys, D. World Forests, Markets and Policies: Towards a Balance; Springer: Dordrecht, The Netherlands, 2001; pp. 3–19. [Google Scholar] [CrossRef]
  55. Betts, M.G.; Phalan, B.T.; Wolf, C.; Baker, S.C.; Messier, C.; Puettmann, K.J.; Green, R.; Harris, S.H.; Edwards, D.P.; Lindenmayer, D.B.; et al. Producing wood at least cost to biodiversity: Integrating Triad and sharing–sparing approaches to inform forest landscape management. Biol. Rev. 2021, 96, 1301–1317. [Google Scholar] [CrossRef] [PubMed]
  56. Stenberg, P.; DeLucia, E.H.; Schoettle, A.W.; Smolander, H. Photosynthetic light capture and processing from cell to canopy. In Resource Physiology of Conifers; Academic Press: Cambridge, MA, USA, 1995; pp. 3–38. [Google Scholar] [CrossRef]
  57. Slattery, R.A.; Ort, D.R. Perspectives on improving light distribution and light use efficiency in crop canopies. Plant Physiol. 2021, 185, 34–48. [Google Scholar] [CrossRef]
  58. Ali, A.; Yan, E.R. Relationships between biodiversity and carbon stocks in forest ecosystems: A systematic literature review. Trop. Ecol. 2017, 58, 1–14. Available online: https://www.researchgate.net/publication/281375930 (accessed on 15 March 2025).
  59. Reynolds, C.S. Ecological pattern and ecosystem theory. Ecol. Model. 2002, 158, 181–200. [Google Scholar] [CrossRef]
  60. Spake, R.; Doncaster, C.P. Use of meta-analysis in forest biodiversity research: Key challenges and considerations. For. Ecol. Manag. 2017, 400, 429–437. [Google Scholar] [CrossRef]
  61. da Silva, R.P. Alometria, Estoque e Dinâmica da Biomassa de Florestas Primárias e Secundárias na Região de Manaus (AM). Ph.D. Thesis, Instituto Nacional de Pesquisas da Amazônia (INPA), Manaus, AM, Brazil, 2007; 135p. Available online: https://repositorio.inpa.gov.br/bitstream/1/4966/1/Roseana_Silva.pdf (accessed on 15 March 2025).
  62. IPCC (Intergovernmental Panel on Climate Change). Forest lands. Intergovernmental Panel on Climate Change Guidelines for National Greenhouse Gas Inventories; Institute for Global Environmental Strategies (IGES): Hayama, Japan, 2006; 83p, Available online: https://www.ipcc-nggip.iges.or.jp/public/2006gl/pdf/4_Volume4/V4_04_Ch4_Forest_Land.pdf (accessed on 15 March 2025).
  63. REFLORA. Flora do Brasil 2020—Algas, Fungos e Plantas. 2019. Available online: http://floradobrasil.jbrj.gov.br/reflora/listaBrasil/PrincipalUC/PrincipalUC.do;jsessionid=21250D75FD7F1FEE1A402F5E30D08648#CondicaoTaxonCP (accessed on 7 March 2025).
  64. Romero, F.M.B.; Jacovine, L.A.G.; Torres, C.M.M.E.; Ribeiro, S.C.; de Morais Junior, V.T.M.; da Rocha, S.J.S.S.; Romero, R.A.B.; de Oliveira Gaspar, R.; Velasquez, S.I.S.; Staudhammer, C.L.; et al. Forest management with reduced-impact logging in Amazonia: Estimated aboveground volume and carbon in commercial tree species in managed forest in Brazil’s State of Acre. Forests 2021, 12, 481. [Google Scholar] [CrossRef]
  65. Fearnside, P.M. Biodiversity as an environmental service in Brazil’s Amazonian forests: Risks, value and conservation. Environ. Conserv. 1999, 26, 305–321. [Google Scholar] [CrossRef]
  66. Fearnside, P.M. The intrinsic value of Amazon biodiversity. Biodivers. Conserv. 2021, 30, 1199–1202. [Google Scholar] [CrossRef]
  67. Udali, A.; Chung, W.; Talbot, B.; Grigolato, S. Managing harvesting residues: A systematic review of management treatments around the world. For. Int. J. For. Res. 2024, 98, 117–135. [Google Scholar] [CrossRef]
  68. Nakagawa, M.; Hori, M.; Umemura, M.; Ishida, T. Relationships of wood density and wood chemical traits between stems and coarse roots across 53 Bornean tropical tree species. J. Trop. Ecol. 2016, 32, 175–178. [Google Scholar] [CrossRef]
  69. Brazil, MCTI (Ministério de Ciência, Tecnologia e Inovação). Fourth National Communication of Brazil to the United Nations Framework Convention on Climate Change; MCTI: Brasília, DF, Brazil, 2020; 531p, Available online: https://unfccc.int/documents/267657 (accessed on 15 March 2025).
  70. Brazil, MCTI (Ministério da Ciência, Tecnologia e Inovações). Quarta Comunicação Nacional do Brasil à Convenção Quadro das Nações Unidas Sobre Mudança do Clima, Sumário Executivo; MCTI: Brasília, DF, Brazil, 2021; 32p. Available online: https://www.gov.br/mcti/pt-br/acompanhe-o-mcti/sirene/publicacoes/comunicacoes-nacionais-do-brasil-a-unfccc/arquivos/4comunicacao/sumario_executivo_4cn_brasil_web.pdf (accessed on 15 March 2025).
Figure 1. Antimary I and II study area in the municipality of Porto Acre, Acre, Brazil.
Sustainability 17 02960 g001
Figure 2. Variability of diameter at breast height (DBH) in cm, commercial height in m, basal area in m2 and volume in m3 in the commercial boles of 19 forest species.
Sustainability 17 02960 g002
Figure 3. Variability of carbon content along the commercial boles of 19 forest species.
Sustainability 17 02960 g003
Figure 4. Variability of carbon content in sections A, B, C and D in commercial boles of 19 forest species.
Sustainability 17 02960 g004
Table 1. Variation in the carbon content in the commercial boles of large trees of the 19 species.
FamilyScientific NameN x ¯ S.D.Confidence Interval (95% CI)
L.L.UL
EuphorbiaceaeHura crepitans349.7061.8348.1651.36
FabaceaeParkia paraensis350.530.2950.3250.74
MalvaceaeSterculia apetala350.390.5649.9850.80
LecythidaceaeEschweilera bracteosa350.520.3550.2450.80
LecythidaceaeEschweilera grandiflora350.540.5850.1650.92
MoraceaeCastilla ulei349.980.4049.6350.33
MeliaceaeCedrela odorata351.600.1851.4651.74
FabaceaeCopaifera multijuga351.510.3751.2751.75
FabaceaeDipteryx odorata351.600.3151.4251.78
FabaceaeAlbizia niopoides349.500.4349.1649.84
FabaceaeApuleia leiocarpa351.040.2750.8651.22
FabaceaeBarnebydendron riedelii349.570.4949.1849.96
BignoniaceaeHandroanthus serratifolius351.810.6051.3752.25
FabaceaeHymenaea courbaril350.680.2550.5250.84
AnacardiaceaeAstronium lecointei351.710.7251.1852.24
CombretaceaeTerminalia tetraphylla349.830.2749.6150.05
FabaceaeSchizolobium parahyba var. amazonicum350.110.1749.9850.24
MalvaceaeCeiba pentandra349.083.3647.1850.98
MalvaceaeCeiba samauma349.450.2149.2849.62
N, Mean, SD & CI 1950.480.4250.0750.90
N = number of trees; x ¯ = mean percent carbon content; S.D. = standard deviation; lower limit (LL) and upper limit (UL) (95% CI).
Table 2. ANOVA for differences in carbon content in commercial boles among 9 tree families.
Source of VariationSum of SquaresDegrees of FreedomMean SquareFp-Value
Families25.483.186.001<0.0001
Residuals25.4480.53
Total50.856
Table 3. ANOVA for differences in carbon content in commercial boles among 19 tree species.
Source of VariationSum of SquaresDegrees of FreedomMean SquareFp-Value
Species41.91182.339.954<0.0001
Residuals8.89380.23
Total50.8056
Table 4. Tukey’s post hoc test results for species comparisons.
No.Species Comparison *Mean DifferenceL.L.U.L.p-Value
1Handroanthus serratifolius vs. Ceiba pentandra2.711.224.20<0.0001
2Dipteryx odorata vs. Ceiba pentandra2.521.034.01<0.0001
3Copaifera multijuga vs. Ceiba pentandra2.430.943.92<0.0001
4Handroanthus serratifolius vs. Ceiba samauma2.340.853.83<0.0001
5Astronium lecointei vs. Albizia niopoides2.330.843.820.0001
6Handroanthus serratifolius vs. Albizia niopoides2.290.803.780.0001
7Handroanthus serratifolius vs. Barnebydendron riedelii2.230.743.720.0002
8Dipteryx odorata vs. Ceiba samauma2.150.663.640.0004
9Cedrela odorata vs. Albizia niopoides2.100.613.590.0007
10Dipteryx odorata vs. Albizia niopoides2.100.613.590.0007
11Copaifera multijuga vs. Ceiba samauma2.060.573.550.0009
12Cedrela odorata vs. Barnebydendron riedelii2.030.543.520.0011
13Dipteryx odorata vs. Barnebydendron riedelii2.030.543.520.0011
14Copaifera multijuga vs. Albizia niopoides2.010.523.500.0013
15Copaifera multijuga vs. Barnebydendron riedelii1.940.453.430.0021
16Handroanthus serratifolius vs. Castilla ulei1.760.273.250.0081
17Hymenaea courbaril vs. Ceiba pentandra1.590.103.080.0260
18Cedrela odorata vs. Castilla ulei1.570.083.060.0304
19Dipteryx odorata vs. Castilla ulei1.570.083.060.0304
20Apuleia leiocarpa vs. Albizia niopoides1.550.063.040.0346
Where lower limit (LL) and upper limit (UL); * for a comprehensive view of all species comparisons, including those without sig-nificant differences, refer to the complete table provided in the Supplementary Materials (Table S1).
Disclaimer/Publisher’s Note: The statements, opinions and data contained in all publications are solely those of the individual author(s) and contributor(s) and not of MDPI and/or the editor(s). MDPI and/or the editor(s) disclaim responsibility for any injury to people or property resulting from any ideas, methods, instructions or products referred to in the content.

