Article

Environmental Regulation and Green Investment Efficiency: Threshold and Spatial Spillover Analysis for China

Department of Economics and Management, North China Electric Power University, Baoding 071000, China
*
Author to whom correspondence should be addressed.
Sustainability 2025, 17(7), 2934; https://doi.org/10.3390/su17072934
Submission received: 6 February 2025 / Revised: 17 March 2025 / Accepted: 21 March 2025 / Published: 26 March 2025

Abstract

:
To achieve the mutual coordination and sustainable development of ecology and the economy, China has been consistently strengthening its environmental regulations while simultaneously bolstering the green investments of heavily polluting enterprises. This study utilizes panel data from heavily polluting enterprises between 2017 and 2022. Firstly, it employs the SBM-DEA method to quantify the green investment efficiency of the sampled enterprises. Secondly, it constructs panel threshold and spatial autoregressive models to investigate how environmental regulations impact the efficiency of green investments by these enterprises. The findings indicate that the green investment efficiency of heavily polluting enterprises in China is low. The relationship between environmental regulations and green investment efficiency exhibits double threshold effects and spatial spillover effects, forming an inverted “N” shape. After incorporating internal control factors, the threshold effect persists, displaying an inverted “N” shape, but with a broader promotion interval. These findings are crucial for formulating government policies on environmental regulation intensity, optimizing the efficiency of corporate green investment, and advancing the practice of sustainable development.

1. Introduction

China faces substantial environmental pollution challenges amid its rapid economic growth. In the past few decades, China’s development model has been largely extensive, marked by high investment, high consumption, high pollution, and low efficiency, leading to significant costs for the ecological environment. The “2022 Environmental Performance Index Report” reveals that China ranks 157th out of 180 countries globally in terms of air quality. Among the 339 prefecture-level and above cities in China, 126 exceeded air quality standards, representing a significant 37.2%. While this marks a decrease compared to previous years, the situation remains serious. Additionally, the “2023 Carbon Dioxide Emissions” report shows that China’s greenhouse gas emissions reached 12.6 billion tons of CO2 equivalents in 2023, an increase of 4.13% from 12.1 billion tons in 2022, solidifying its status as one of the world’s largest carbon emitters. Furthermore, issues such as water pollution and land contamination are widespread in China’s ecological environment. Immediate environmental improvements are essential.
However, relying solely on the market and enterprises is insufficient to alleviate environmental pollution. In China’s resource-intensive development context, companies often lack the intrinsic motivation for green transformation; in their pursuit of better financial performance, they frequently overlook environmental concerns and externalize their costs [1]. Therefore, to effectively address global climate change, protect the ecological environment, and achieve green economic transformation and sustainable development, while also enhancing international image and economic competitiveness, the Chinese government must strengthen environmental regulations and increase investments in environmental protection.
Environmental regulation serves as an effective tool for addressing environmental pollution externalities and plays a crucial role in promoting the development of a green economy [2]. In recent years, the Chinese government has implemented various measures to regulate the environment. On one hand, they have enacted laws such as the “Energy Conservation Law of the People’s Republic of China”, “Environmental Protection Law of the People’s Republic of China”, and “Renewable Energy Law of the People’s Republic of China” to legally regulate the utilization of energy resources and environmental practices by economic entities [3]. On the other hand, China has significantly increased its investment in environmental pollution control. According to the China Statistical Yearbook, the investment in industrial pollution control surged from CNY 17.45 billion in 2001 to CNY 68.153 billion in 2017. However, due to the decentralization of environmental governance in China, the various environmental policies and regulations established by the central government are mainly implemented by local governments [4]. This has led to persistent issues, including the inadequate enforcement of environmental policies and compromises for local economic development. Additionally, the phenomenon of pollution transfer resulting from intergovernmental “race to the bottom” competition presents significant challenges to the advancement of environmental regulation in China.
Enterprises are significant consumers of resources and major contributors to environmental issues, generating pollution alongside economic growth [5]. Consequently, the Chinese government encourages enterprises to undertake green transformations aimed at improving environmental outcomes. Some scholars argue that integrating environmental considerations into major financial decisions can balance economic growth with environmental protection. Green investment, a component of corporate social responsibility (CSR), involves funds allocated toward green infrastructure and technologies [6]. Its objective is to translate environmental goals into economic actions, thereby achieving sustainable development and maximizing societal benefits.
However, the effectiveness of enterprise green investments in promoting green transformation is subject to scrutiny. The motivations behind management’s green investments often include regulatory compliance, enhancing green credentials, and achieving cost savings. Therefore, it raises questions: Do green investments by Chinese enterprises genuinely facilitate green transformation? And, does the actual efficiency of green investments improve after implementation?
In previous research, scholars have predominantly focused on green investment rather than assessing its efficiency. Due to limited availability of corporate environmental data, studies on green investment efficiency have mostly been conducted at the macro or meso level, with minimal attention given to the micro enterprise level. Government regulations play a crucial role in shaping corporate environmental behavior, acting as primary drivers of environmental practices within corporations [7]. As a reflection of corporate environmental performance, the efficiency of green investments is significantly influenced by the government’s environmental regulations.
In light of this, this paper adopts a research approach that integrates a theoretical analysis with empirical testing. The theoretical analysis utilizes methods such as literature induction and deduction for logical reasoning, comparative analysis, and summarization. By identifying gaps in the existing literature, this study establishes the necessary background and theoretical foundation for the research. In the empirical testing section, this study first utilizes the SBM-DEA method to integrate financial data related to corporate green investments with pollutant emission data, thereby quantifying green investment efficiency. Subsequently, a panel threshold model is constructed to explore the nonlinear relationship between environmental regulations and green investment efficiency. Furthermore, by considering internal factors, this study investigates how the nonlinear relationship between explanatory and explained variables evolves under the influence of internal control factors and external pressures from environmental regulations. Lastly, adopting a spatial spillover perspective, this research examines how environmental regulations in neighboring regions impact the green investment efficiency of enterprises within the study area. The empirical analysis method is directly grounded in real data from enterprises, minimizing subjectivity and enhancing the objectivity and reliability of the research results. Additionally, it further validates the findings from the theoretical analysis.
The contributions of this paper include: (1) theoretical contributions—It enriches the theoretical framework in environmental economics. This research supports the development of theories related to the environment and sustainable development, further validating the “Porter Hypothesis” and deepening the understanding of the relationship between environmental regulation and corporate behavior. It enhances and refines the theoretical understanding of the link between environmental regulation and corporate green investment efficiency, providing empirical support for these concepts. (2) Research methodology—It utilizes the interaction term of environmental regulation and internal control as a threshold variable while considering the interplay between external pressures and internal adjustments. A spatial econometric model is employed to account for regional interconnections and to avoid endogeneity issues that may arise from neglecting spatial spillover effects. (3) Research perspective—Focusing on the economic consequences of corporate green investment as a key entry point, this study integrates environmental regulation and corporate green investment efficiency into a unified analytical framework. It also emphasizes the enterprise level, enriching micro-level research. (4) Practical significance—This study provides a theoretical foundation for the formulation of relevant policies and facilitates both economic growth and green transformation in China at this stage.
The structure of the paper is shown in Figure 1.

2. Theoretical Analysis and Research Hypothesis

2.1. Environmental Regulation and Corporate Green Investment Efficiency

The “Porter Hypothesis” asserts that well-designed environmental standards can drive innovation from the perspective of dynamic competitiveness. It suggests that a company’s technological innovations can lead to increased resource productivity, creating a compensatory advantage that partially or fully offsets the costs of compliance with these standards [8]. While this viewpoint has been controversial, a substantial body of subsequent research supports it. For example, Song et al. (2020) [9] found that low-carbon city pilot policies can significantly enhance ecological efficiency. Lin and Zhu (2019) [10] demonstrated that government-led formal environmental regulation fosters improvements in ecological efficiency. Pan et al. (2022) [11] showed that public concern for the environment significantly boosts corporate green investment efficiency. Rubashkina et al. (2015) [12] indicated that environmental regulation can enhance the efficiency of innovative activities. Moreover, Guo et al. (2023) [13] provided further evidence that environmental regulation positively impacts corporate green innovation, indirectly supporting the Porter Hypothesis.
However, the Compliance Cost Hypothesis asserts that environmental regulation significantly raises compliance costs, which can lead to a decrease in technological innovation and, consequently, a decline in production efficiency [14]. Specifically, as companies encounter increasingly stringent environmental regulations, they are compelled to invest in green initiatives, such as purchasing pollution control equipment, developing clean energy solutions, and innovating green technologies. These escalating costs can hinder improvements in efficiency. Hou et al. (2020) [15] demonstrated that market-based carbon emission trading programs significantly suppress growth in green total factor productivity. Zhan et al. (2022) [16] confirmed that environmental regulation restricts green development efficiency by obstructing technological progress. Yu Binbin et al. (2019) [17] argued that environmental regulation increases companies’ “compliance costs”, which can crowd out other productive and profitable investments. Therefore, while maintaining a constant level of energy input may reduce pollution emissions, the rising production costs and declining output levels can ultimately suppress overall production efficiency.
The third perspective integrates the two previous hypotheses, proposing that the impact of environmental regulation on green investment efficiency is nonlinear. Wu (2020) [3] argues that the relationship between the two depends on which effect—“innovation compensation” or “compliance costs”—is more dominant during a given period, demonstrating a U-shaped relationship between environmental regulation and energy efficiency. Xie (2017) [18] established that both command-and-control and market-based environmental regulations exhibit a nonlinear relationship with “green” productivity. Song (2020b) [19] found that environmental regulation can directly influence ecological efficiency levels through both “compliance costs” and “cost-saving innovations”, with their relationship also following a U-shape. Zhang and Song (2021) [20], using a sample from the metal industry, demonstrated a significant inverted U-shaped relationship between environmental regulation and corporate environmental performance.
In summary, there is currently no definitive conclusion regarding the relationship between environmental regulation and green investment efficiency. Building on existing research, this paper posits that the impact of environmental regulation on corporate green investment efficiency is nonlinear. When the regulatory intensity is low, compliance costs often far exceed the potential benefits. In such cases, companies are more likely to pay fines or engage in basic mechanical green investments rather than pursue technological innovation [17], which suppresses green investment efficiency. However, as the regulatory intensity increases and measures become more robust, compliance costs rise significantly, prompting companies to adopt green management practices. They actively upgrade equipment and production processes and modify their methods to reduce pollution [3]. Furthermore, high-intensity environmental regulations create stringent barriers for new entrants, requiring them to meet high environmental standards to access the market [21]. As a result, some high-pollution and high-energy-consuming enterprises may be driven out of the market due to their inability to adapt to these heightened demands [22]. This, in turn, enhances companies’ capabilities in pollution management and efficiency improvement. However, if the intensity of environmental regulation becomes excessively high, the overwhelming pressure on companies can lead to reckless investments. Additionally, the phenomenon of “race to the bottom” among local governments may incentivize companies to relocate to regions with weaker environmental regulations [23]. All these factors can contribute to a decline in green investment efficiency. Based on this, we propose Hypothesis 1:
H1. 
The impact of environmental regulation on corporate green investment efficiency exhibits a threshold effect characterized by a nonlinear relationship that forms an inverted “N” shape.

2.2. Environmental Regulation, Internal Control, and Corporate Green Investment Efficiency

The efficiency of corporate green investment is influenced not only by external environmental regulations but also by internal factors. Cheng (2013) [24] found that internal control interacts with external environmental systems to impact companies. The benefits of a high-quality internal control system are evident in two key areas. First, a robust internal control framework enables companies to effectively respond to external pressures. Gao Kai et al. (2022) [25] argue that internal control is a crucial governance mechanism in corporate development; a strong internal control system can mitigate systemic risks in business operations and innovation activities. Tang Xiaojian (2016) [26] asserts that effective internal control can alleviate conflicts of interest arising from environmental regulations and address imbalances in corporate governance structures, thereby compensating for deficiencies in corporate social responsibility. Boulhaga et al. (2023) [27] demonstrated that strong internal control enhances corporate performance while helping companies meet their social and environmental responsibilities.
Second, high-quality internal control can significantly enhance corporate efficiency. In 2008, the Chinese Ministry of Finance issued documents such as the “Basic Norms for Internal Control” and “Guidelines for Internal Control”, which highlighted the critical role of internal control in fostering environmental protection and corporate green investment. The quality of internal control influences both the scale and efficiency of environmental investments. Cheng (2018) [28] confirmed that an effective internal control system can alleviate potential barriers to environmental investments by appropriately distributing power and responsibility within the organization. Furthermore, during the investment process, high-quality internal control compels management to measure, track, and optimize environmental performance [29]. This system effectively addresses issues of managerial adverse selection and moral hazards by enhancing investment decision-making through a series of checks and balances and oversight mechanisms, thereby reducing opportunistic behavior among managers [24] and improving green investment efficiency. Based on this, we propose Hypothesis 2 as follows:
H2. 
Under the combined influence of internal control and environmental regulation, the relationship between environmental regulation and corporate green investment efficiency is enhanced.

2.3. Spatial Spillover Effects of Environmental Regulation on Corporate Green Investment

Regions are not completely independent; economic and policy changes in one area inevitably impact neighboring regions. Increasingly, scholars are considering spatial correlations in their research. Li and Wu (2016) [30] employed a spatial Durbin model to analyze the effect of environmental regulation on green total factor productivity in China, finding that while environmental regulation enhanced green total factor productivity within the region, it also had a suppressive effect on neighboring areas. Huang et al. (2023) [31] developed a spatial econometric model that demonstrated a decreasing trend in China’s net carbon emissions from east to west, revealing significant spatial agglomeration characteristics. Additionally, Cai et al. (2016) [32] investigated the cross-border spillover effects of water pollution by assessing the impact of a wastewater charging system.
The pollution haven hypothesis posits that when a country strengthens its environmental regulations, polluting enterprises may relocate to countries with weaker regulatory frameworks to reduce pollution control costs [33]. In China, the government practices environmental decentralization, granting local governments discretion in formulating and enforcing environmental regulations. This results in varying levels of environmental regulation across different regions [34], creating fertile ground for the emergence of pollution havens. Additionally, local governments in China are strongly incentivized to pursue economic growth and tax revenue, with environmental protection and other social objectives often taking a backseat [32]. Consequently, local governments frequently exhibit a tendency to “relax” the enforcement of environmental regulations [35], using more lenient regulatory environments to attract capital investment [36]. This intergovernmental “race to the bottom” phenomenon leads to industrial migration between regions [37], which in turn creates spatial spillover effects on corporate green investment efficiency. Based on this, we propose Hypothesis 3:
H3. 
Environmental regulation has spatial spillover effects on the green investment efficiency of neighboring regions’ enterprises.

3. Data, Methodology, and Models

3.1. SBM–DEA

Given that this paper includes enterprise pollutant emissions as a non-desirable output, the relaxation-based SBM (Slacks-Based Measure) model is chosen to assess green investment efficiency, integrating financial and environmental data. The model expression is as follows:
min ρ = 1 1 m i = 1 m S i x i a 1 + 1 q 1 + q 2 r = 1 q 1 s r + y r a + t = 1 q 2 s t b b r a
s . t . x a = X δ + s y a = Y δ s + b a = B δ + s b δ 0 , s 0 , s + 0 , s b 0
where ρ is the efficiency value of the evaluated unit; q 1 , q 2 are the numbers of desired and undesired outputs for each decision-making unit, respectively; x a , y a , and b a represent the actual inputs, desired outputs, and non-desired outputs, respectively; X, Y, and B represent the optimal target values for inputs, desired outputs, and non-desired outputs, respectively; s , s + , s b are slack variables for the inputs, desired outputs, and undesired outputs of efficiency, respectively; and δ denotes weight.
When constructing the model, each sample enterprise is treated as a decision-making unit (DMU), and panel data for the input, expected output, and undesirable output variables are organized [38]. Given the variability in enterprises’ green investment efficiency, where inputs and outputs are not uniformly scaled, the SBM–DEA (Slacks-Based Measure–Data Envelopment Analysis) model with variable returns to scale (VRS) is selected. The efficiency measurements are conducted using MATLAB2017 software.

3.2. Panel Threshold Model

Based on the panel threshold model with individual effects first proposed by Hansen in 1999 [39], this paper explores the threshold effect of environmental regulation on the green investment efficiency of heavily polluting enterprises. The following multi-threshold estimation model is constructed:
G I E i , t = θ 0 + θ 1 E N i , t · I t h r i , t h 1 + θ 2 E N i , t · I h 1 < t h r i , t h 2 + + θ 4 Z i , t + ε i , t
where green investment efficiency G I E i , t is the explained variable, environmental regulation E N i , t is the explanatory variable, and t h r i , t is the threshold variable. I · is the indicator function and h is the threshold value. Z i , t is the control variable and ε i , t is the random disturbance term.

3.3. Spatial Autoregressive Model

3.3.1. The Design of the Spatial Autoregressive Model

Due to the interdependence among regions, the efficiency of corporate green investment is influenced not only by local environmental regulations but also by those in neighboring regions. Traditional econometric models, however, fail to account for these spatial spillover effects across regions [40]. Therefore, based on the research requirements and empirical findings, this paper establishes the following spatial autoregressive model:
G I E i , t = α + ρ W × G I E i , t + δ 1 E N i , t + δ 2 X i , t + μ t + η t + ε i , t
where green investment efficiency G I E i , t is the explained variable, environmental regulation E N i , t is the explanatory variable, X i , t is the control variable, W is the spatial weight matrix, α is the constant term, μ t and η t denote individual and time effects, respectively, and ε i , t is a randomized perturbation term.

3.3.2. Setting the Spatial Weight Matrix

Establishing a spatial weight matrix is crucial in spatial econometric analysis and is a prerequisite for a spatial statistical analysis [41]. Previous studies have predominantly utilized various types of matrices, such as adjacency matrices (0–1 matrices), geographic distance matrices, and economic matrices. Given that this paper focuses on micro-enterprises where many samples share the same registration location, adjacency and geographic distance matrices are not suitable. Instead, an economic matrix ( W ) is employed to measure spatial spillover effects. To align with the objectives of this study, the traditional economic matrix’s GDP data for each province is substituted with the business revenue (TR) data for each sample enterprise. The calculation method is depicted in Equation (5):
W i , j 1 T R i ¯ T R j ¯ i j 1 i = j w h e r e , i = 1 n ; j = 1 n ; n = 181
T R i and T R j are the average gross operating revenues during the sample period for firm i and firm j , respectively.

3.4. Variables

On 9 December 2016, the China Securities Regulatory Commission issued the “Guidelines for the Content and Format of Information Disclosure for Publicly Issued Securities No. 2—Content and Format of Annual Reports (Revised 2016)”. These guidelines require listed companies identified as key pollutant discharge units by environmental protection authorities to disclose detailed information on pollutant emissions in their annual reports starting from 2016. Since measuring green investment efficiency involves firms’ undesirable outputs, we chose 2017 as the starting point for our data. At the same time, due to data availability issues in empirical research and the fact that consolidated financial statements reflect the overall financial status, operating performance, economic substance, and risk profile of corporate groups, the data exhibit higher comparability and applicability. Therefore, this study selects the consolidated financial statement data of heavily polluting enterprises listed on the Shanghai Stock Exchange and Shenzhen Stock Exchange from 2017 to 2022 as the research sample and applies the following screening criteria: (1) exclusion of ST and *ST companies; (2) elimination of companies with missing sample data; and (3) truncation of variables at the upper and lower 1% levels. Ultimately, a total of 1087 panel data points from 181 enterprises were compiled.
Among these sources, the input variables and desirable output of corporate green investment efficiency, along with corporate-level control variable data, are derived from the financial statements of listed companies in the CSMAR (China Stock Market & Accounting Research) database. The undesirable output of corporate green investment efficiency is based on pollution emission data published in the China Tax Survey. The data on external environmental control variables and original environmental regulations are obtained from the National Bureau of Statistics of China, the China Statistical Yearbook, and the China Environmental Statistical Yearbook. Meanwhile, internal control quality data comes from the DIB database. Furthermore, considering data availability, completeness, and temporal consistency, along with the fact that annual data can better reflect long-term trends and cyclical variations while reducing noise caused by short-term fluctuations, this study is based on annual data for the analysis to enhance the robustness and reliability of the research findings. Finally, since the selected sample data come from companies listed on the Shenzhen Stock Exchange and the Shanghai Stock Exchange, most of the sample firms primarily operate within China. Upon verification, all consolidated financial statement data used in this study are sourced from CSMAR and are prepared in accordance with CAS.
The definition of heavily polluting industries in this study is based on the “Industry Classification Guidelines for Listed Companies” revised by the China Securities Regulatory Commission (CSRC), the “Industry Classification Management Directory for Environmental Protection Inspection of Listed Companies” formulated by the Ministry of Environmental Protection of China, and the “Environmental Information Disclosure Guidelines for Listed Companies”. The specific classification criteria in these documents are based on factors such as pollutant emissions, resource consumption, and environmental risks. The sample industries include coal, mining, textiles, leather, paper, petrochemicals, pharmaceuticals, chemicals, metallurgy, and thermal power generation.

3.4.1. Enterprise Green Investment Efficiency (GIE)

The green investment efficiency of enterprises serves as the dependent variable in this study, as assessed through the SBM-DEA method. Referring to Su Fang et al. [38], Tian J et al. [42], Xiao Liming et al. [43], and Li Pengsheng et al. [44] for the measurement of green investment efficiency, this paper constructs a comprehensive measurement index system for evaluating green investment efficiency. The input variables encompass three key indicators: ① labor input—defined by the number of employees in each company at the end of the year; ② technology level—the ratio of intangible assets to total assets at the end of the year; and ③ investment in enterprise environmental protection projects—manual collection of sample enterprises in construction projects, R & D expenditure, fixed assets, and management costs can be divided into green investment data. Output indicators include desirable output and undesirable output. ① Desirable output is the net profit, and ② undesirable output is the logarithm of total pollution equivalent. In reference to the methodologies employed by Li Pengsheng et al. (2019) [44] and Mao Jie et al. (2022) [45], this paper selects industrial wastewater pollutants such as the chemical oxygen demand, ammonia nitrogen emissions, and industrial waste gas pollutants, including sulfur dioxide and nitrogen oxides. Based on the pollution equivalent calculation formula provided on the Regulations on the Collection and Use of Pollutant Discharge Fees implemented in China in 2003 ( Pollution   equivalent   of   a   certain   pollutant = Emission   amount   of   the   pollutant Pollution   equivalent   value   of   the   pollutant ), the emission volumes of various pollutants from enterprises are converted into standardized pollution equivalent units and then summed. Finally, the total pollution equivalent is log-transformed after adding 1, yielding the logarithm of total pollution equivalent as the measure of undesirable output.

3.4.2. Environmental Regulation (EN)

This paper draws on the methods of Yan S et al. (2019) [46] and Shen N et al. (2012) [47] to construct an environmental regulation evaluation index as a proxy variable for the intensity of environmental regulation in each province. The construction steps are as follows.
First of all, calculate the pollution control investment per unit of industrial output value in each province:
F E R I i , t * = E i , t Y i , t
F E R I i , t * is the unit industrial output value of pollution control investment in province i in year t , E i , t is the amount of completed investment in industrial pollution control in province i in year t , and Y i , t is the total industrial output value in province i in year t .
Secondly, the weights of industrial structures are calculated for each province. Due to the differences in industrial structure between different regions, provinces with a concentration of heavily polluting industries will overestimate the environmental regulatory intensity. On the contrary, it will be underestimated in provinces with a concentration of clean and environmentally friendly industries. Therefore, the definition is as follows:
F E R I i , t * * = Y i , t G D P i , t
F E R I i , t * * is the proportion of industrial structure of province i in year t , Y i , t is the total industrial output value of province i in year t , and G D P i , t is the gross domestic product of province i in year t .
Finally, environmental regulations are amended by industrial structures. Thus, environmental regulation is defined as follows:
F E R I i , t = F E R I i , t * F E R I i , t * * × 10,000
The larger the value of F E R I i , t , the stronger the environmental regulation, and conversely, the weaker the environmental regulation.
The environmental regulation data in China from 2017 to 2022 are calculated and shown in Figure 2 below.

3.4.3. Internal Control (ICQ)

The internal control quality is measured by the logarithm of the internal control evaluation index in the DIB database.

3.4.4. Control Variables

Given that the issue of corporate green investment efficiency involves corporate investment behavior, environmental performance, and corporate environmental governance, this study, following relevant research [48,49,50], selects the most representative variables from both the corporate level and external environment to control for factors affecting corporate green investment efficiency.
At the corporate level, four categories of control variables are selected: (1) firm size (Size) and financial leverage (Leverage) represent the firm’s fundamental characteristics; (2) the newly added green investment standardized by total assets (GIscale) measures differences in corporate green investment structures; (3) investment opportunities (Opportunity) reflect factors influencing corporate investment behavior; and (4) corporate governance factors include ownership concentration (LSR), the board size (BDsize), and CEO duality (Duality). Since firms are dispersed across the country, regional differences also impact corporate green investment efficiency. Therefore, from the perspective of the external environment, this study controls for per capita regional GDP (PGDP), environmental quality ranking (EQRank), and the scale of industrial enterprises (lnIEN).
The definition of each variable is shown in Table 1.

4. Empirical Analysis

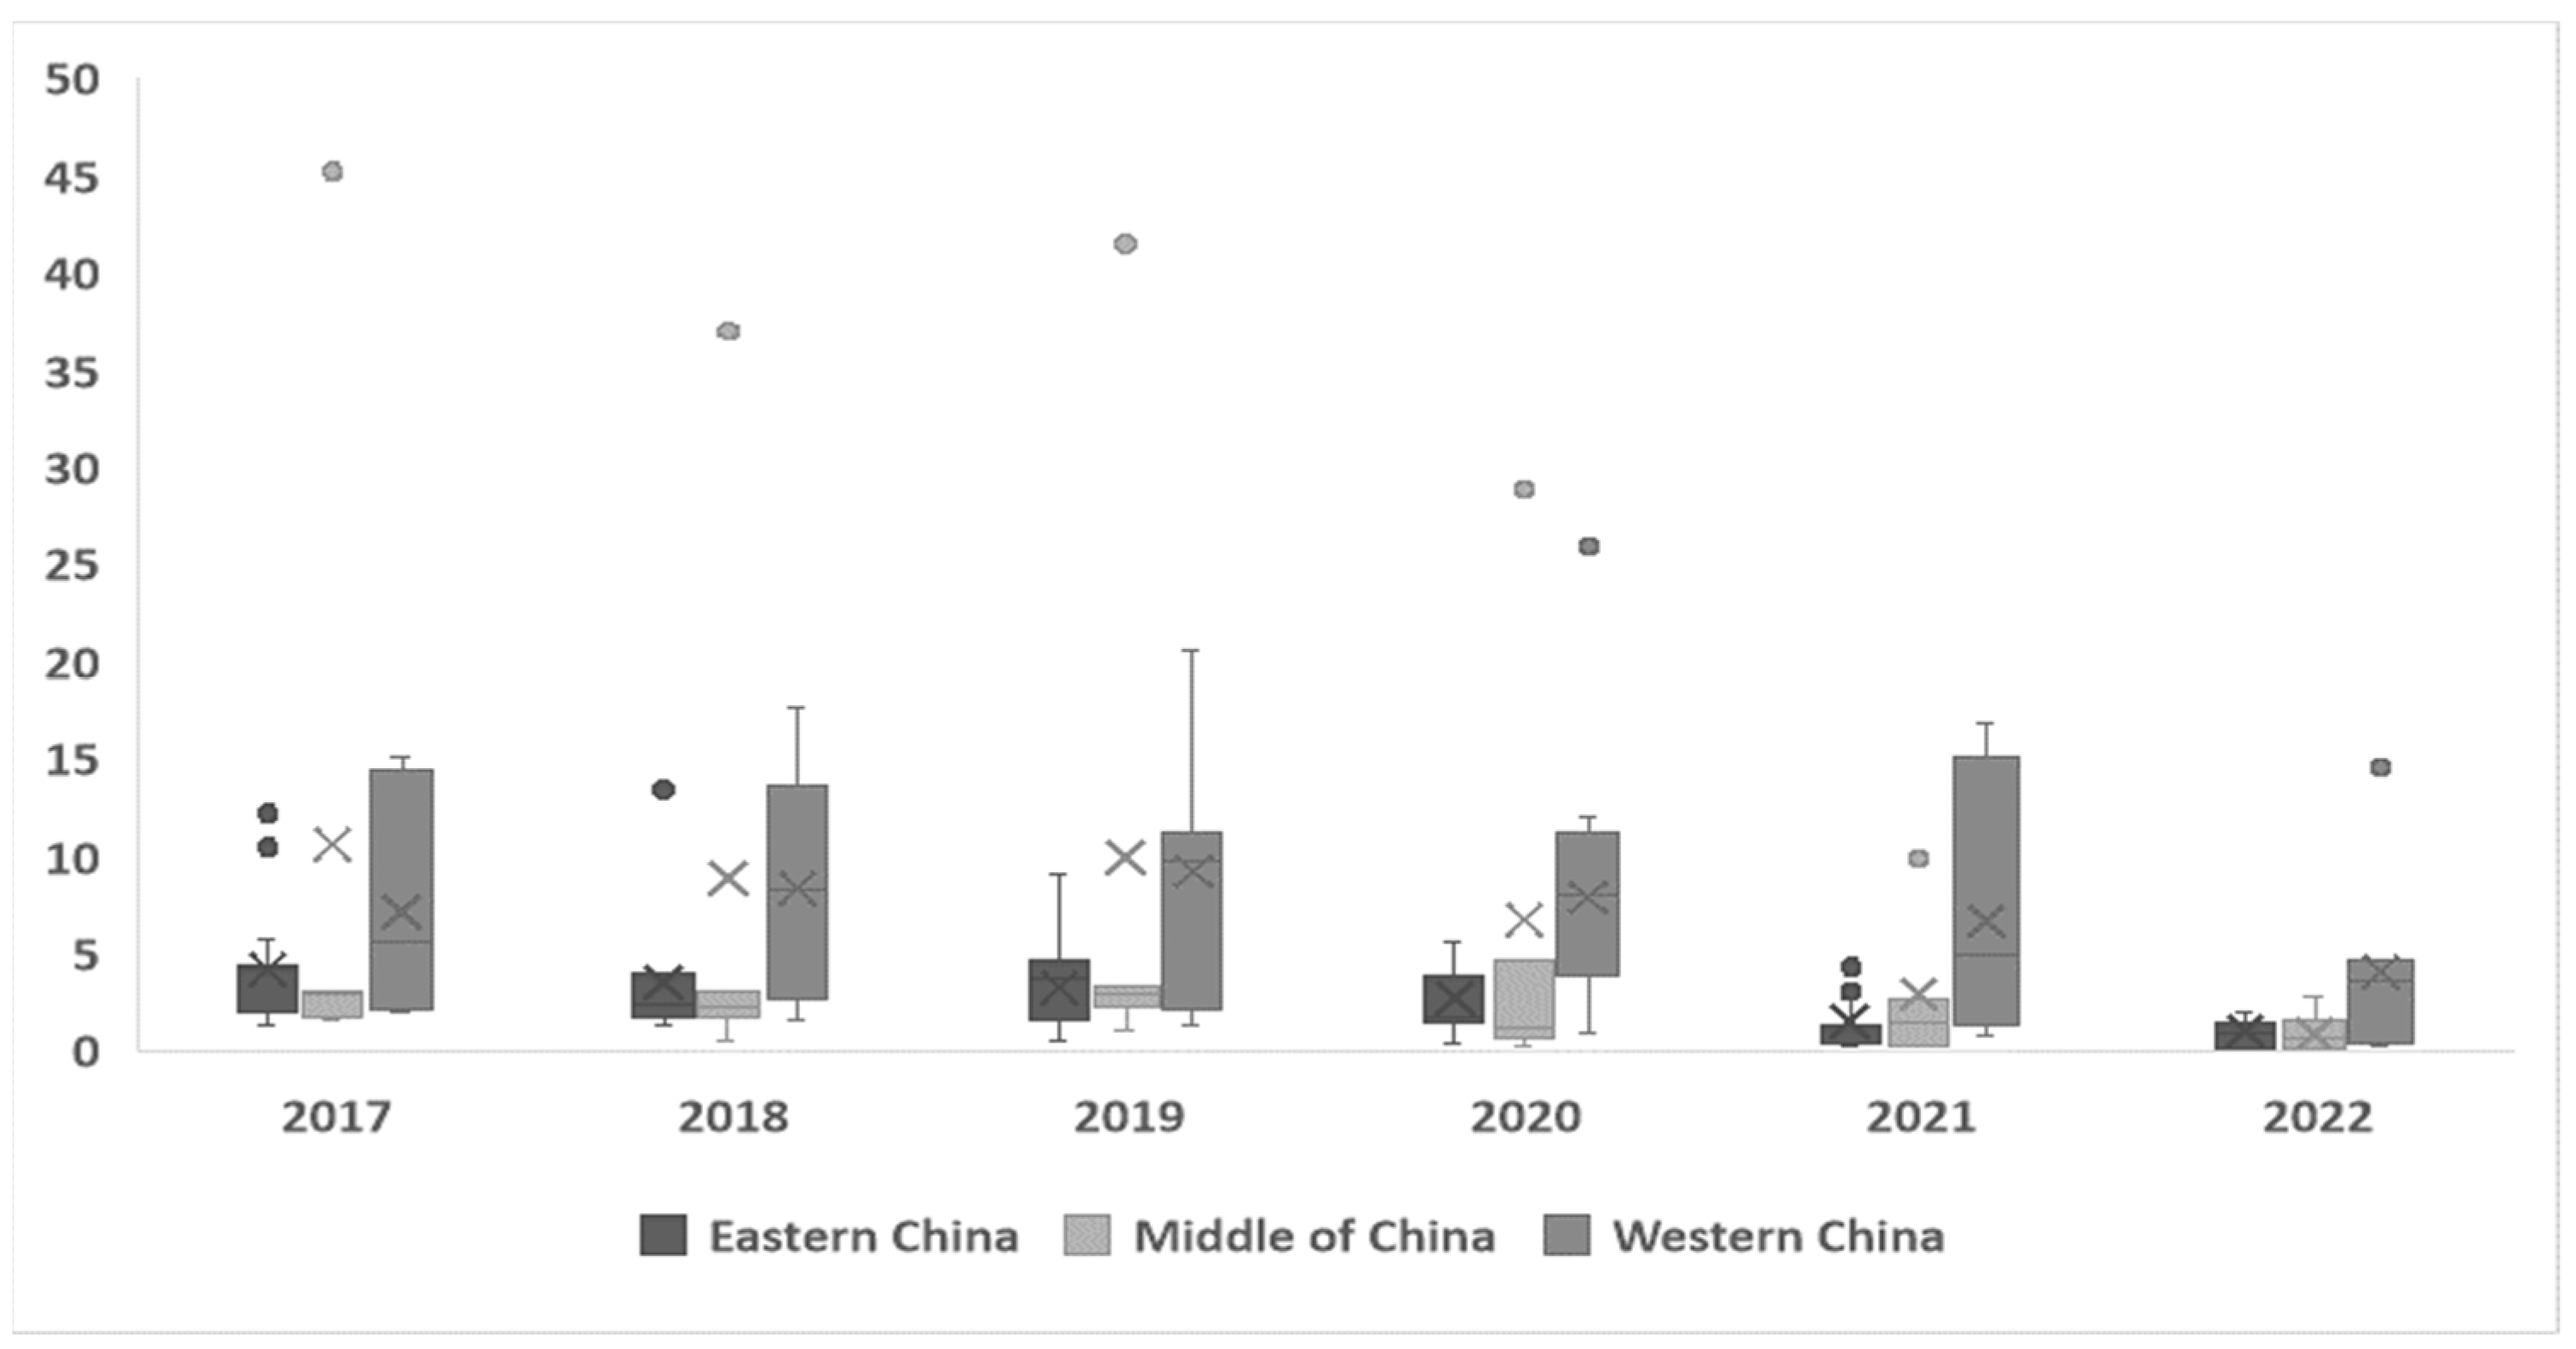
4.1. Results and Discussion of Green Investment Efficiency

This study employs the return-to-scale SBM-DEA model to calculate corporate green investment efficiency over the five-year period from 2017 to 2022. The research results are shown in Table 2. DEA efficiency values of one indicate effective resource allocation and Pareto optimality [51]. Table 2 reveals that the green investment efficiency among sampled enterprises is generally low, with most below 0.5. In 2017, only 23.2% of sampled enterprises achieved Pareto optimality in green investment efficiency. Over the following four years, these proportions fluctuated between 17.13%, 6.08%, 9.39%, 16.57% and 14.36%, indicating consistent but minor variations in low efficiency levels.
The “U-shaped” results could be attributed to increased environmental focus by the Chinese government, prompting more firms to invest in environmental projects. However, due to extended payback periods for many of these projects [52], fewer firms initially attain Pareto optimality, leading to fluctuations before a potential rebound. In addition, as shown in Table 2 above, the median of the green investment efficiency results for the sample enterprises during the six years from 2017 to 2022 is consistently lower than the average value. This indicates that the majority of enterprises have relatively low green investment efficiency. Overall, the efficiency of green investments across enterprises remains low and unevenly distributed.
These findings suggest that there is potential for significantly higher green investment efficiency among listed companies in heavily polluting industries, indicating that enterprises could allocate resources more effectively in their green management practices. The observed inefficiencies may stem from enterprises making extensive green investments without ensuring optimal resource allocation. This can lead to redundant green investments as management responds to increasingly stringent environmental regulations without a careful consideration of resource allocation strategies.
Moreover, the green resources invested may not be fully leveraged to enhance green management performance, resulting in a certain degree of resource wastage [53]. Managers should therefore critically evaluate the allocation and utilization of resources within their enterprises to identify and mitigate instances of inefficient resource allocation. This approach is crucial for minimizing wasteful practices and improving the overall efficiency and effectiveness of green investments in heavily polluting industries.

4.2. Panel Threshold Model Results and Discussion

To investigate the nonlinear relationship between environmental regulation and green investment efficiency, this paper employs a panel threshold model. Initially, threshold effect tests are conducted on the data of heavily polluting enterprises from 2017 to 2022, and the results are presented in Table 3 below. The table indicates that when the threshold variable is environmental regulation, the model successfully passes both the single-threshold and double-threshold tests, but fails the triple-threshold test, leading to an analysis based on the double-threshold model. Conversely, when the threshold variable is the interaction term of environmental regulation and internal control, all threshold tests are significant; thus, the analysis relies on the triple-threshold model.
According to the two threshold values of environmental regulation, it is divided into low environmental regulation (EN ≤ 3.9842), medium environmental regulation (3.9842 < EN ≤ 4.7055), and high environmental regulation (EN > 4.7055). This paper investigates the impact of environmental regulation on the efficiency of green investment under different levels of environmental regulation, as shown in Table 4. When environmental regulation is 3.9842 or less, the relationship between them is significantly negative [54]. However, when environmental regulation surpasses the first threshold, the regression coefficient increases to 0.1369, which is statistically significant at the 1% level, indicating a positive relationship [11,55]. As environmental regulation exceeds the second threshold, the regression coefficient decreases to −0.00925, suggesting a significant negative correlation between the two variables [54].
When local government environmental regulations are weak, due to the high opportunity costs associated with green investment [56] and the fact that the compliance costs arising from environmental regulations constitute only a small portion of a company’s total expenses, enterprises often lack the motivation to pursue green technology innovations aimed at energy conservation and emission reduction [57]. In these cases, businesses may marginally increase their green investments to meet regulatory requirements without evaluating their effectiveness. Furthermore, environmental investments are typically long-term commitments that require time to generate positive returns [53]. Consequently, these can result in a decline in green investment efficiency.
As environmental requirements increase, compliance costs for enterprises surge. A passive response can hinder their growth; so, to effectively meet policy demands, companies must actively implement green management practices [58]. They invest in green business initiatives, conduct research and development for green technologies, and adopt energy-saving equipment to mitigate environmental pollution, thereby enhancing the efficiency of green investments [59].
However, as environmental regulations become excessively stringent, their impacts on enterprise green investment efficiency shift from being supportive to prohibitive. Excessive regulatory pressure can lead enterprises to indiscriminately increase green investments merely to meet compliance standards, resulting in redundant investments and inefficient resource allocation. Moreover, the phenomenon of pollution havens may arise [60], where some enterprises relocate to regions with less stringent environmental regulations to evade compliance costs [61]. This behavior diminishes the local environmental regulations’ ability to stimulate green management practices among enterprises, thereby establishing a negative correlation between environmental regulations and green investment efficiency. The empirical findings support Hypothesis 1, confirming a threshold effect of environmental regulations on the green investment efficiency of heavily polluting enterprises, characterized by an inverted “N”-shaped relationship.
Meanwhile, when considering Figure 2 alongside Table 4, it becomes evident that China’s environmental regulations have reached a relatively high level. This trend aligns with China’s commitment to the “double carbon” goal and its recent robust efforts in energy conservation, emission reduction, and environmental protection. However, upon closer examination from a regional perspective, the intensity of regulations varies.
In some regions, there has been a noticeable decline in regulatory intensity. This shift suggests that some provinces have recognized the limitations of overly stringent environmental regulations in effectively enhancing green performance. In the western region, the comparatively stringent environmental regulations may be a result of the significant share of the secondary industry, which contributes to elevated pollution levels. Local governments in these areas continue to prioritize environmental governance, thereby maintaining a relatively high level of regulatory stringency.
As an influential factor affecting enterprise investment efficiency, internal control also significantly impacts green investment efficiency in response to external environmental regulation requirements. To explore this relationship, the interaction term of environmental regulation and internal control is introduced, enhancing our understanding of their combined influence on corporate green investment efficiency.
From Table 4, it is clear that environmental regulation and corporate green investment efficiency exhibit an inverted “N”-shaped relationship, verifying Hypothesis 2. As previously mentioned, in the absence of internal control factors, there is a positive correlation observed between environmental regulation intensity ranging from 3.9842 to 4.7055. However, upon incorporating internal control variables, this positive correlation extends to the range of 3.0327 to 5.6974. This highlights the regulatory role played by internal controls [54].
A well-structured organization, efficient business processes, and a scientifically sound division of labor facilitate the effective integration of internal and external resources, optimizing resource allocation and supply [62]. This enables companies to effectively respond to intense external environmental pressures, quickly identify and analyze potential environmental risks, and adapt flexibly. By reducing impulsive actions, they can achieve better environmental performance [63] and ultimately enhance green investment efficiency. The initial decline observed in the first phase may be attributed to weak internal controls that have a minimal impact. Conversely, the downward trend in the third phase might be linked to the insufficient effectiveness of internal controls in coping with an excessively high environmental regulation intensity. The slowdown in the promoting trend in the third stage, as compared to the second stage, further reinforces this point.
It is evident that the relationship between the environmental regulation intensity and enterprise green investment efficiency is nonlinear, suggesting an optimal range of environmental regulation intensity. In this context, a well-developed internal control system plays a crucial role in enabling enterprises to effectively navigate government environmental regulations.

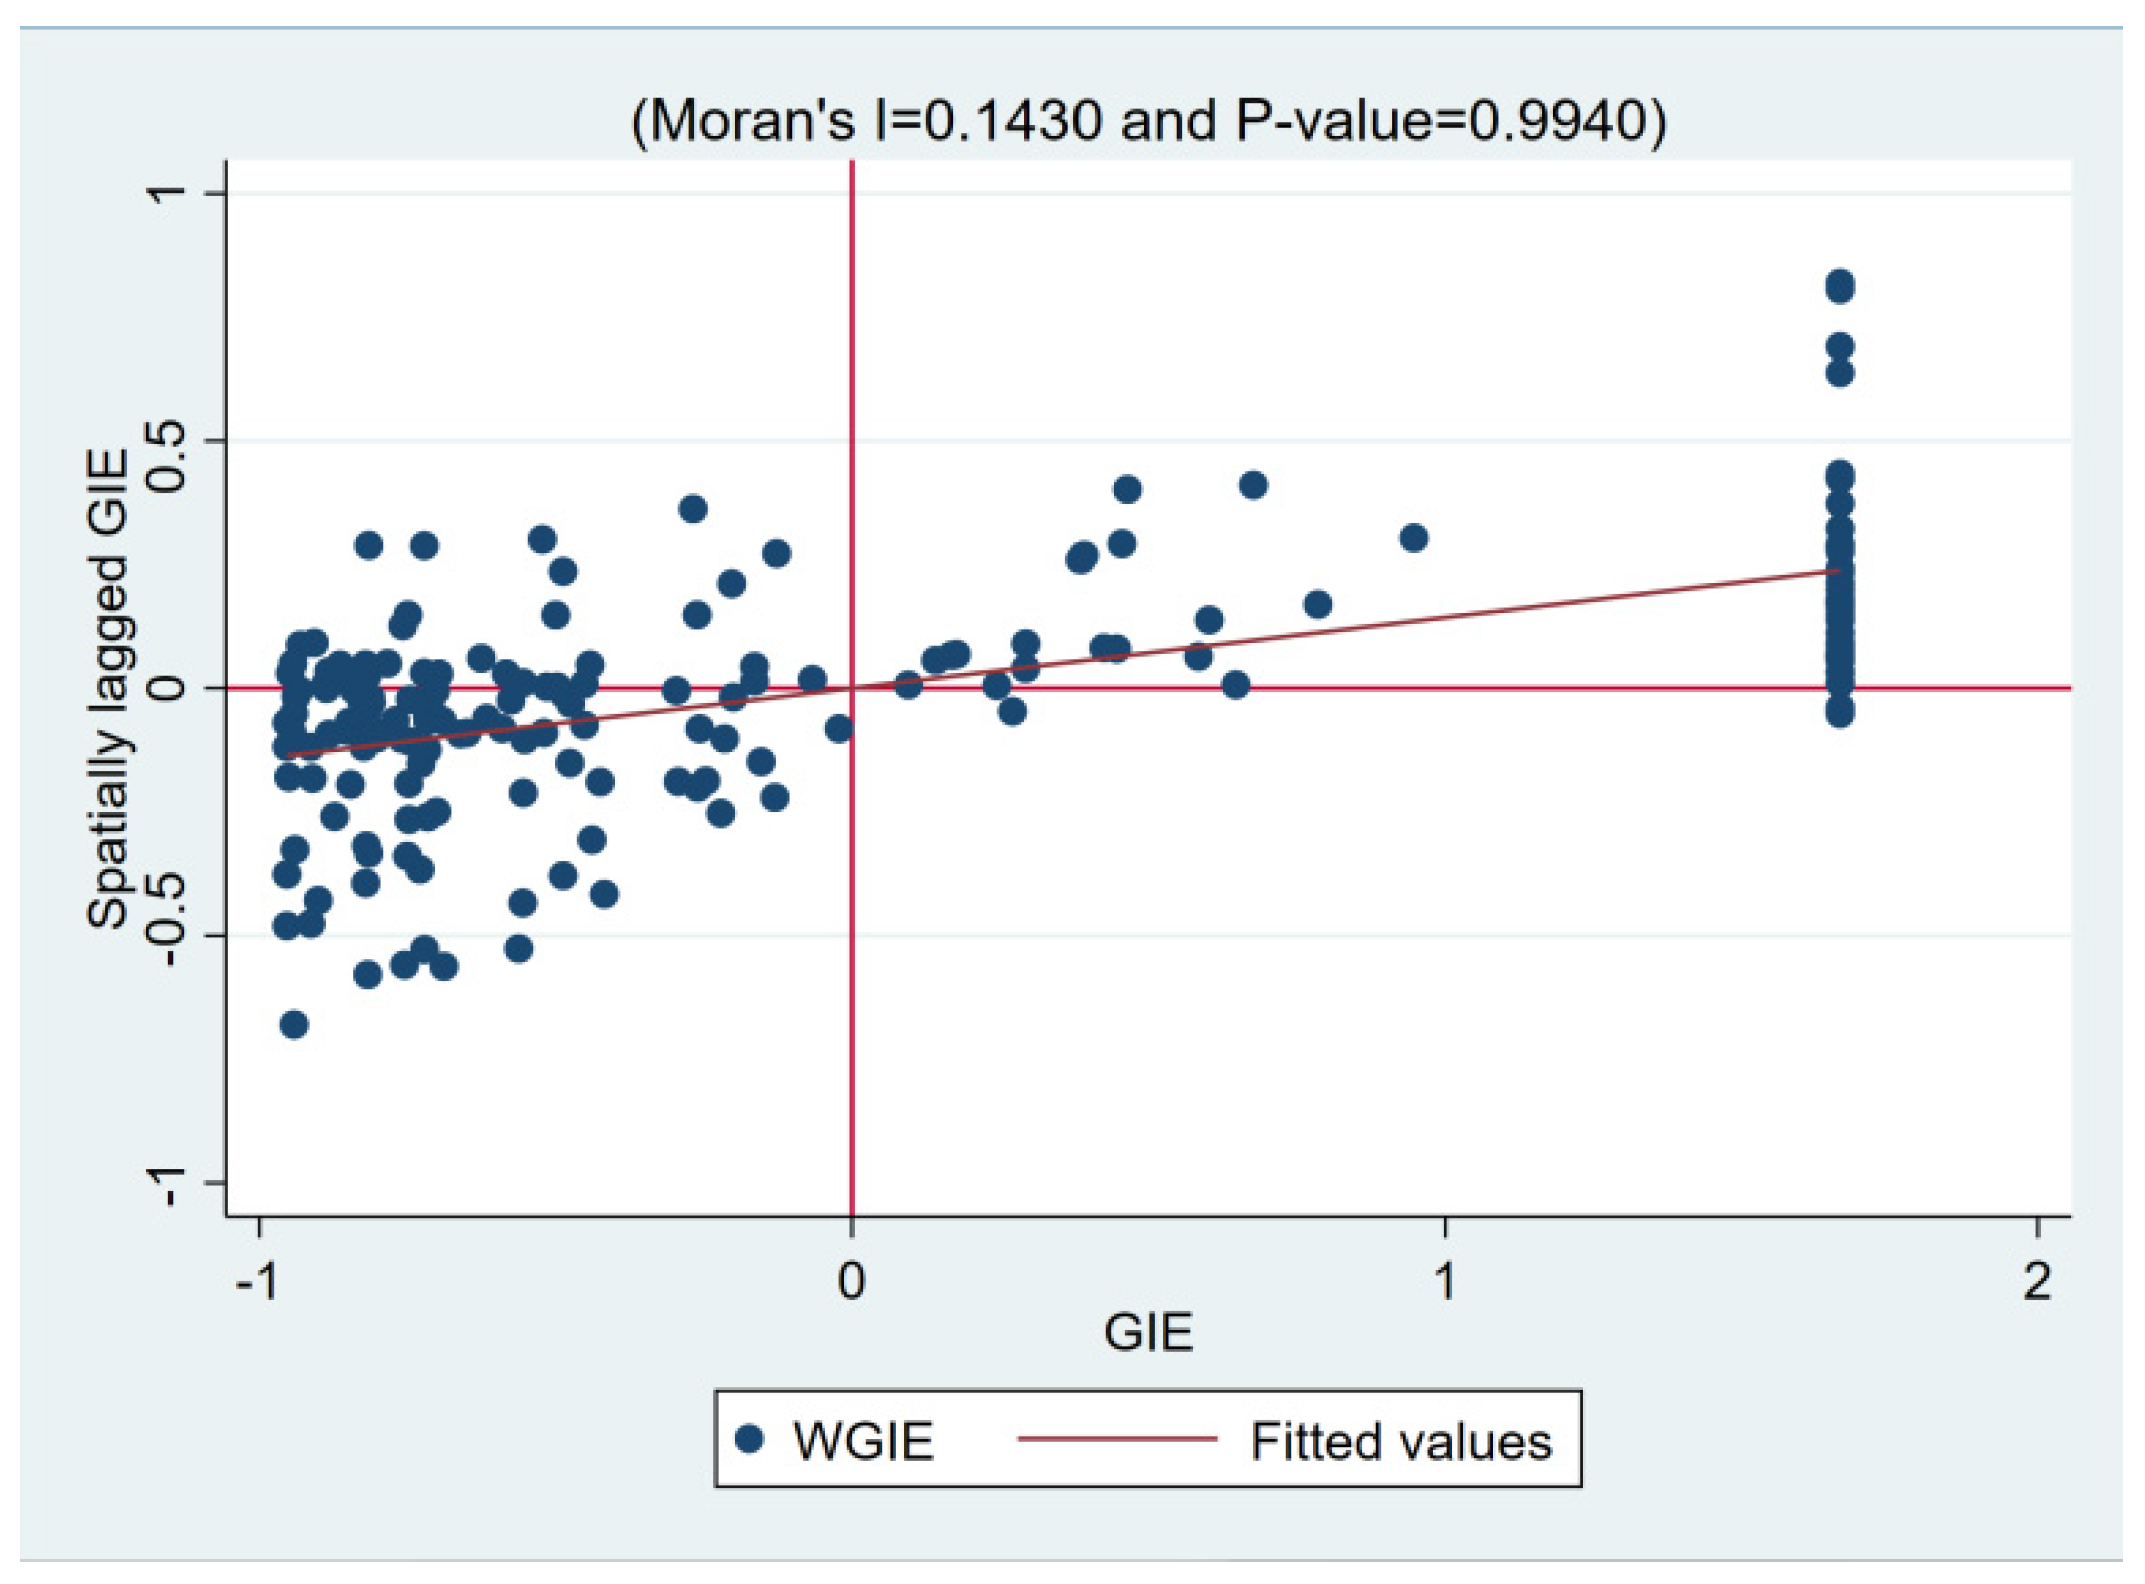
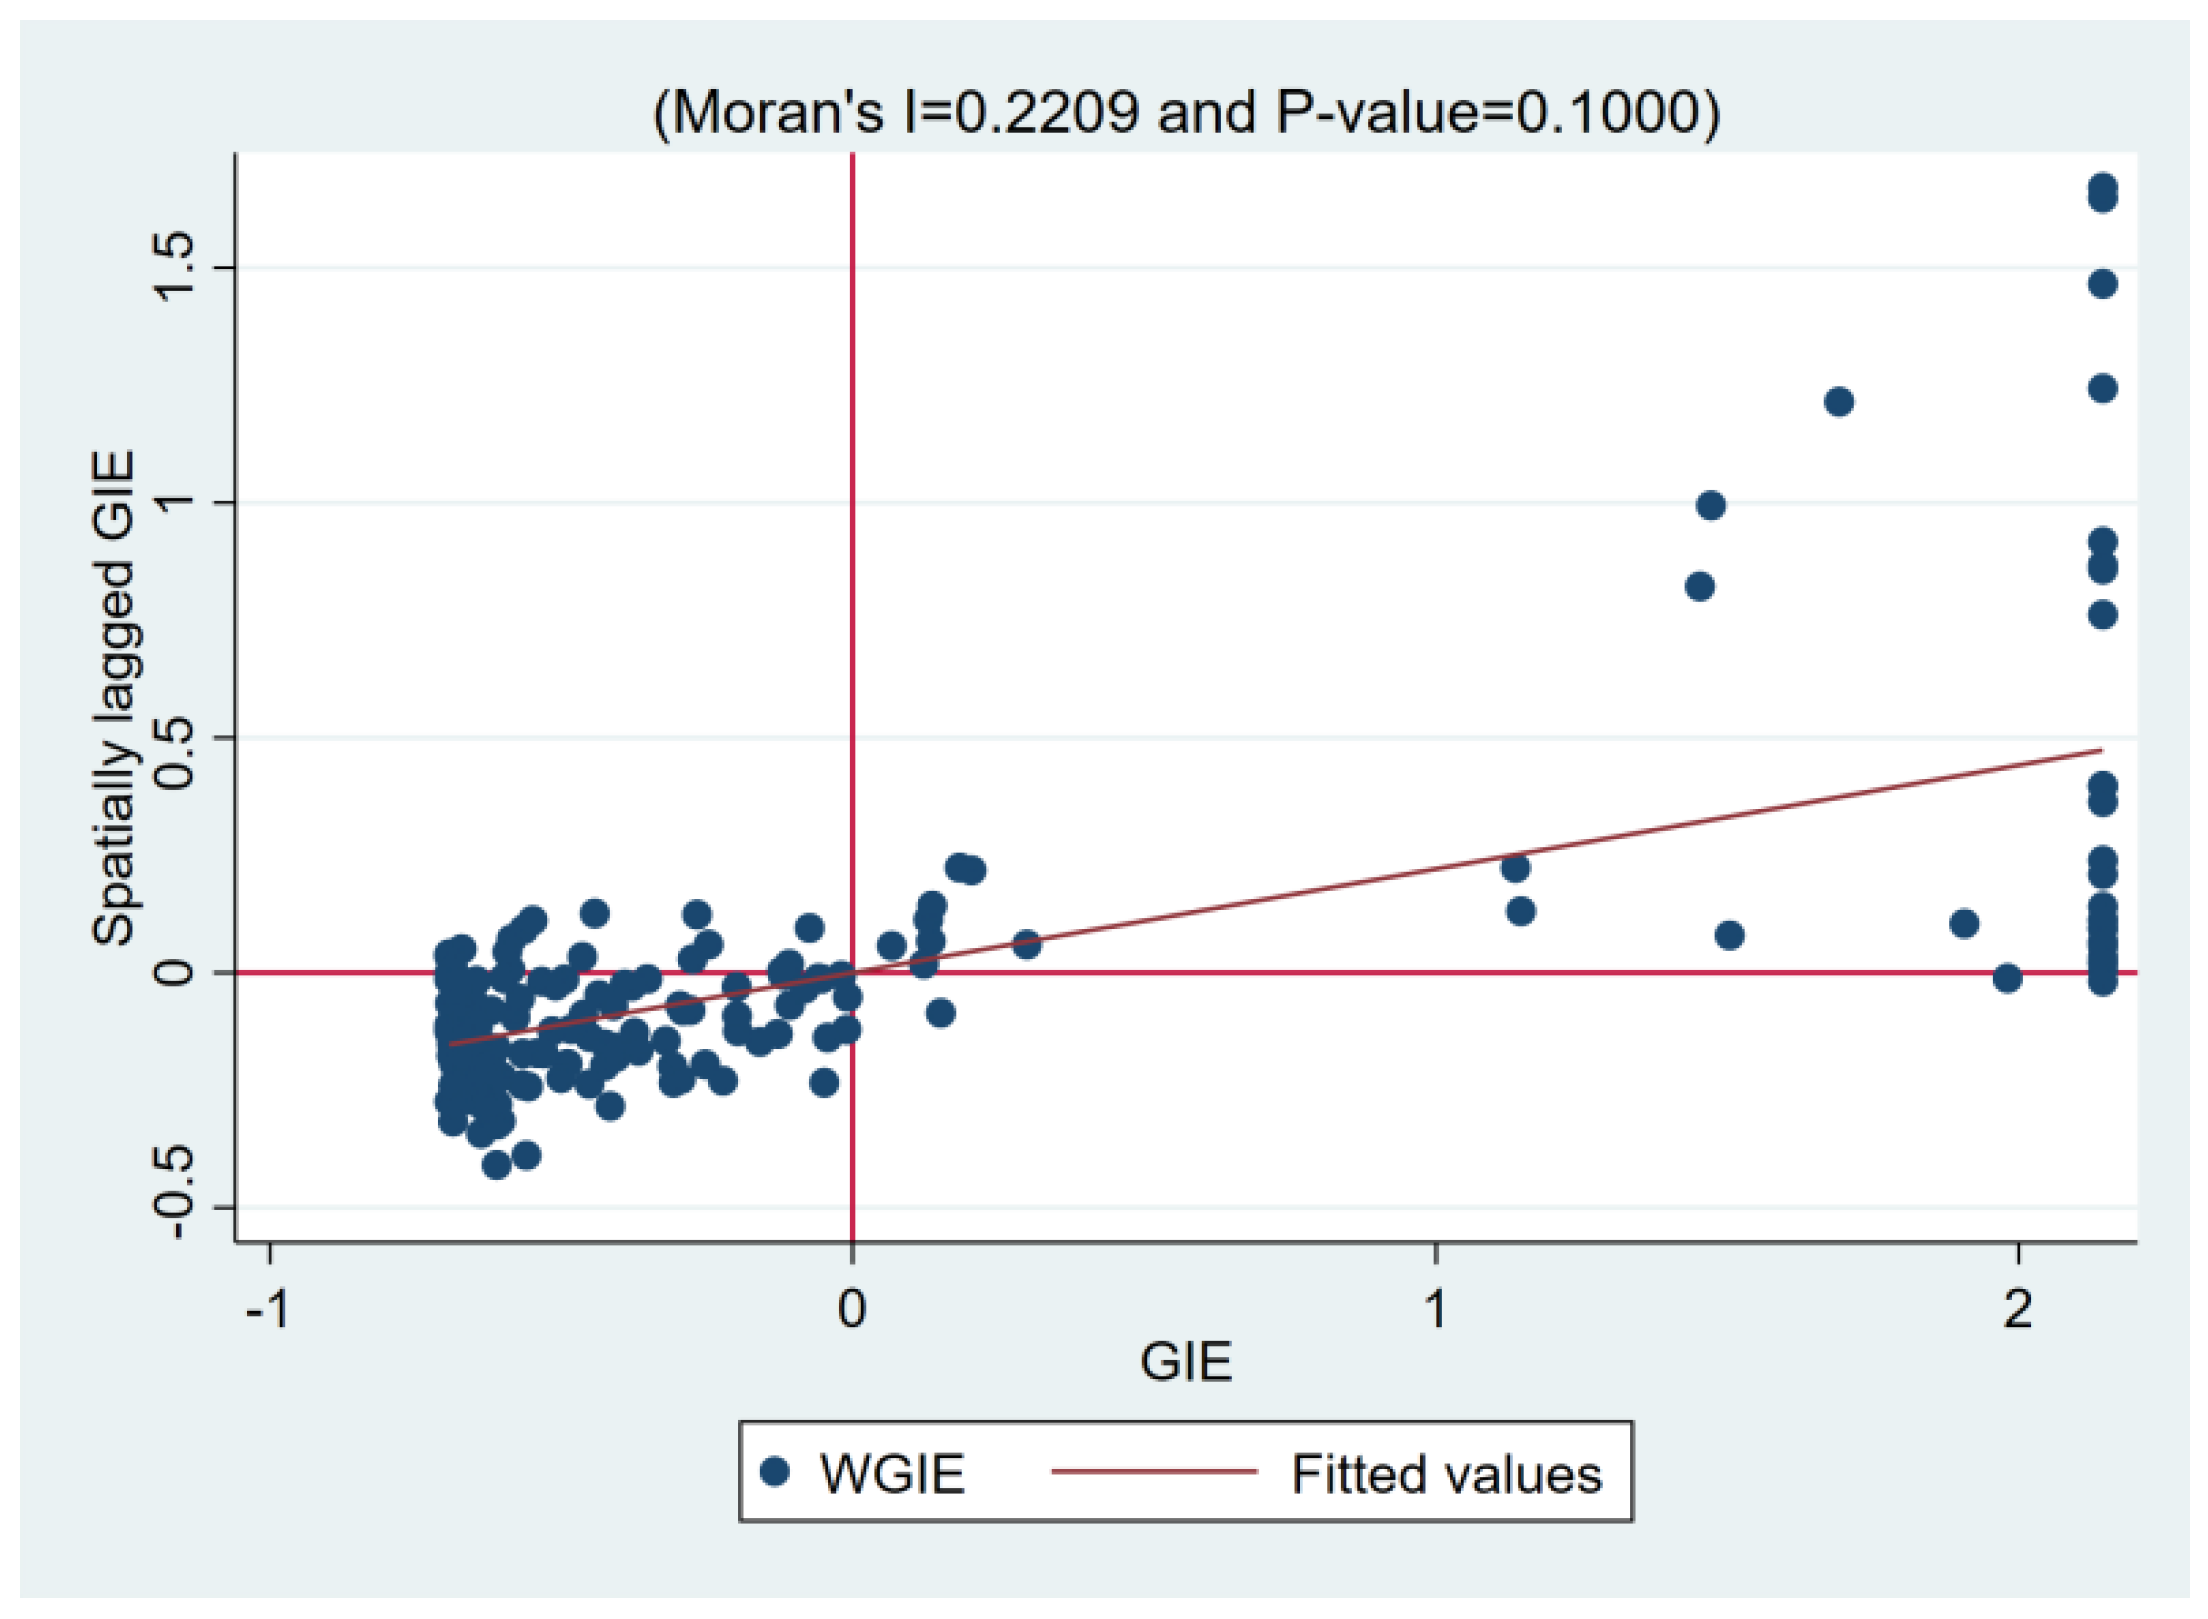
4.3. Analysis of the Spatial Spillover Effect

4.3.1. Baseline Regression

Before proceeding with formal regression analysis, the sample data for heavily polluting enterprises from 2017 to 2022 is first tested. Preliminary tests, including Moran’s I, Wald test, LR test, and others, were conducted. The results are presented in Table 5 and Table 6 and Figure 3 and Figure 4 below, which indicate a clear spatial clustering of green investment efficiency among regions for heavy polluters. The non-significance of both the Wald and LR tests suggests that the SDM model should be revised to either an SAR model or an SEM model. Thus, the spatial autoregressive (SAR) model with double fixed effects is selected as the optimal approach for this study. The test outcomes are summarized as follows.
Ordinary Least Squares (OLS) is inadequate for capturing spatial correlations between regions, potentially leading to biased parameter estimates [64]. Hence, maximum likelihood estimation (MLE) is widely adopted in existing research to estimate the spatial autoregressive (SAR) model, which is more suitable for handling spatial data. Therefore, this paper employs the maximum likelihood estimation method to examine the relationship between environmental regulation and corporate green investment efficiency. For comparison, the results from Fixed Effects (FE), Spatial Error (SEM), and spatial Durbin (SDM) models are presented in Table 7 as a reference.
In Table 7, Model 1 presents the regression results for Equation (4). The findings reveal that the coefficient for environmental regulation (EN) is significantly negative at the 1% significance level. When considered alongside the threshold regression outcomes, this indicates that the impact of environmental regulation on the green investment efficiency of enterprises fluctuates but generally shows a declining trend [65,66,67]. The spatial autocorrelation coefficient, rho, is also significantly negative, suggesting spatial correlation and competition among regions regarding green investment efficiency [64]. Enhanced green investment efficiency among local enterprises in this region could potentially hinder the green investment efficiency of enterprises in neighboring areas. Moreover, the results of the spatial autoregressive (SAR) model align closely with Models 2 to 4 in Table 7, thereby bolstering the robustness of the estimated findings and offering preliminary validation for Hypothesis 3.
In spatial econometrics, total effects can be decomposed into direct effects and indirect effects. Direct effects indicate the direct impact of local explanatory variables on the local dependent variable. Indirect effects, on the other hand, measure spatial spillover effects, showing how explanatory variables in neighboring areas affect the local region. Table 8 provides the breakdown of the total effects from the spatial autoregressive (SAR) model.
From Table 8, the significant indirect effect at the 1% level indicates a positive spatial spillover effect. Environmental regulations in the local area not only impact the green investment efficiency of local enterprises but also positively influence neighboring regions. Interestingly, an increase in local environmental regulation intensity does not necessarily lead to a substantial improvement in local enterprise green investment efficiency. This highlights the importance for neighboring regions to adopt scientifically and rationally formulated regulations, thereby fostering beneficial transmission effects.
Furthermore, this outcome emphasizes that regions are interconnected rather than isolated, developing in coordination with each other. It underscores the necessity of considering spatial spillover effects; disregarding these effects may underestimate the impact of environmental regulations.

4.3.2. Robustness Test

To ensure the reliability of the regression outcomes, this study conducts robustness tests as follows: (1) spatial weight matrix replacement—specific coordinates of 181 sample enterprise office locations are manually collected, and an inverse distance spatial matrix replaces the economic matrix for regression; and (2) replace the core explanatory variable—the number of environmental protection penalty cases in various prefecture-level cities in China is used as a proxy variable for environmental regulation in spatial econometric regression.
The regression results are presented in Table 9. In Model 1, the coefficient for environmental regulation (EN) remains significantly negative; however, in Model 2, it becomes significantly positive. This underscores the non-linear nature of the environmental regulation’s impact on enterprise green investment efficiency, suggesting that within reasonable regulatory intensity ranges, environmental measures can enhance green investments.
Both the spatial autocorrelation coefficient and the indirect effect of EN are significant, confirming the existence of spatial spillover effects. Nevertheless, the negative spatial spillover effect of EN might arise because a high environmental regulation intensity in neighboring areas could lead some heavily polluting enterprises to relocate, thereby potentially reducing green investment efficiency in those regions.
Furthermore, while the spatial autoregressive coefficient in Model 1 is notably positive, it shifts to a significant negative in Model 2 and the baseline regression results. This discrepancy indicates that local enterprises’ green investment efficiency does influence neighboring regions, highlighting spatial spillover effects characterized by both competitive dynamics and mutual reinforcement.
In conclusion, robustness checks support the baseline regression results, affirming their reliability and suggesting the robustness of the findings.

5. Conclusions

Based on panel data from China’s heavily polluting enterprises spanning from 2017 to 2022, this study explores the impact of regional environmental regulations on the green investment efficiency of micro-enterprises. The paper arrives at four main conclusions. Firstly, the green investment efficiency among China’s heavily polluting enterprises is generally low. Many enterprises invest primarily in environmental pollution control to comply with regulations, neglecting efficient resource allocation and value creation, and leading to resource wastage. Secondly, there exists a threshold effect in how environmental regulations influence the green investment efficiency of heavily polluting enterprises, demonstrating an inverted N-shaped relationship. This result verifies Hypothesis 1. Thirdly, even after introducing the cross term of internal control and environmental regulation as a threshold variable, a threshold effect persists. At this juncture, their relationship still forms an inverted “N” shape, albeit with an expanded range of promotion intervals. The inclusion of internal control indeed strengthens the relationship between environmental regulation and corporate green investment efficiency, verifying Hypothesis 2. Lastly, environmental regulation shows a notable positive spatial spillover effect on the green investment efficiency of heavily polluting enterprises in neighboring regions. The green investment efficiency of local enterprises in this region will be influenced by both the environmental regulations in neighboring areas and the green investment efficiency of enterprises themselves. This conclusion is consistent with Hypothesis 3.
The conclusions drawn in this paper provide valuable insights for both government environmental supervision and corporate green governance. For the government, several recommendations emerge. Firstly, the environmental supervision of polluting enterprises should transition from a focus on driving green investments to emphasizing green investment efficiency. This shift entails incorporating measures of green investment efficiency into the environmental evaluation system [11]. By doing so, governments can guide enterprises towards adopting forward-thinking environmental strategies while reducing redundant and low-value inputs. Secondly, provincial governments should undertake a comprehensive review to develop more tailored environmental regulation policies. Currently, many environmental regulations are perceived as overly stringent, which may not effectively promote the green investment efficiency of enterprises [18]. Hence, it is crucial for provincial authorities to adjust their regulatory strategies according to the local circumstances [68]. This adjustment helps alleviate undue policy pressures and encourages enterprises to actively engage in green management practices. Lastly, provincial governments should proactively foster “urban agglomerations” and “metropolitan areas” to harness the mutual demonstration and guidance effects between adjacent regions [3,68]. Such initiatives can significantly bolster regional progress towards environmental goals and enhance collective environmental governance efforts.
Regarding heavy polluting enterprises, several recommendations are proposed. Firstly, enterprises should prioritize creating social value as their developmental focus. This entails minimizing the inefficient allocation of limited resources and enhancing the efficiency of green investments. By doing so, enterprises can contribute more effectively to environmental sustainability [69,70]. Secondly, appropriate incentives should be implemented to encourage executives to actively embrace corporate environmental responsibility. Rather than merely complying with governmental regulations, executives should be motivated to understand and prioritize the enhancement of green investment efficiency. This approach helps strike a balance between self-interest and altruistic goals. Thirdly, attention should be given to strengthening the internal control systems of enterprises [24,25,26,27]. This involves enhancing internal supervision mechanisms and ensuring the effective operation of internal control systems. By doing this, enterprises can bolster their corporate governance practices and elevate their overall operational standards.
Although this paper provides insightful recommendations, it does have certain limitations. For instance, the study only employs a single indicator as a proxy for environmental regulation when examining its impact on corporate green investment efficiency. This approach overlooks the potential heterogeneity within environmental regulations. Therefore, future research could explore the distinct impacts of formal and informal environmental regulations on green investment efficiency separately. Additionally, due to data constraints, the measurement and evaluation of green investment efficiency in this study may not encompass all relevant factors comprehensively. Future research could aim to develop more accurate evaluation methods and indices for assessing green investment efficiency. This would be a crucial direction for advancing the field and enhancing the precision of findings in similar studies.

Author Contributions

Conceptualization, L.D. and R.Z.; methodology, L.D. and R.Z.; software, L.D. and R.Z.; validation, L.D. and R.Z.; formal analysis, L.D. and R.Z.; investigation, L.D. and R.Z.; resources, L.D. and R.Z.; data curation, L.D. and R.Z.; writing—original draft preparation, L.D. and R.Z.; writing—review and editing, L.D. and R.Z.; visualization, L.D. and R.Z.; supervision, L.D. and R.Z.; project administration, L.D. and R.Z.; funding acquisition, L.D. and R.Z. All authors have read and agreed to the published version of the manuscript.

Funding

This work was supported by the Social Science Foundation of Heibei Province (Grant No. HB24GL036).

Institutional Review Board Statement

Not applicable.

Informed Consent Statement

Not applicable.

Data Availability Statement

All of the data in this paper are from the CSMAR database, website: https://data.csmar.com/ (accessed on 18 September 2024). If you need detailed data, please ask the corresponding author separately.

Conflicts of Interest

The authors declare no conflicts of interest.

References

  1. Yu, B. Urban spatial structure and total-factor energy efficiency in Chinese provinces. Ecol. Indic. 2021, 126, 107662. [Google Scholar] [CrossRef]
  2. Tian, Y.; Feng, C. The internal-structural effects of different types of environmental regulations on China’s green total-factor productivity. Energy Econ. 2022, 113, 106246. [Google Scholar] [CrossRef]
  3. Wu, H.; Hao, Y.; Ren, S. How do environmental regulation and environmental decentralization affect green total factor energy efficiency: Evidence from China. Energy Econ. 2020, 91, 104880. [Google Scholar] [CrossRef]
  4. Wang, Y.; Zhang, S. The Impact of the ‘Environmental Protection Vertical Reform’ Policy on Urban Economic Green Transformation from the Perspective of Environmental Decentralization. China Popul. Resour. Environ. 2024, 34, 47–58. [Google Scholar]
  5. Liu, W.; Wang, Z. The effects of climate policy on corporate technological upgrading in energy intensive industries: Evidence from China. J. Clean. Prod. 2017, 142, 3748–3758. [Google Scholar] [CrossRef]
  6. Baixun, W.; Wenjuan, Z. Interplay of renewable energy investment efficiency, shareholder control and green financial development in China. Renew. Energy 2022, 199, 192–203. [Google Scholar]
  7. Wang, C.; Wu, J.; Zhang, B. Environmental Regulation, Emissions and Productivity: Evidence from Chinese Cod-E-mitting Manufacturers. J. Environ. Econ. Manag. 2018, 92, 54–73. [Google Scholar] [CrossRef]
  8. Porter, M.E.; van der Linde, C. Toward a New Conception of the Environment-Competitiveness Relationship. J. Econ. Perspect. 1995, 9, 97–118. [Google Scholar] [CrossRef]
  9. Song, M.; Zhao, X.; Shang, Y. The impact of low-carbon city construction on ecological efficiency: Empirical evidence from quasi-natural experiments. Resour. Conserv. Recycl. 2020, 157, 104777. [Google Scholar] [CrossRef]
  10. Lin, B.; Zhu, J. Impact of energy saving and emission reduction policy on urban sustainable development: Empirical evidence from China. Appl. Energy 2019, 239, 12–22. [Google Scholar] [CrossRef]
  11. Pan, K.; He, F. Does Public Environmental Attention Improve Green Investment Efficiency?—Based on the Perspective of Environmental Regulation and Environmental Responsibility. Sustainability 2022, 14, 12861. [Google Scholar] [CrossRef]
  12. Rubashkina, Y.; Galeotti, M.; Verdolini, E. Environmental regulation and competitiveness: Empirical evidence on the Porter Hypothesis from European manufacturing sectors. Energy Policy 2015, 83, 288–300. [Google Scholar]
  13. Guo, M.; Wang, H.; Kuai, Y. Environmental regulation and green innovation: Evidence from heavily polluting firms in China. Financ. Res. Lett. 2023, 53, 103624. [Google Scholar] [CrossRef]
  14. Barbera, A.J.; McConnell, V.D. The impact of environmental regulations on industry productivity: Direct and indirect effects. J. Environ. Econ. Manag. 1990, 18, 50–65. [Google Scholar] [CrossRef]
  15. Hou, B.; Wang, B.; Du, M.; Zhang, N. Does the SO2 emissions trading scheme encourage green total factor productivity? An empirical assessment on China’s cities. Environ. Sci. Pollut. Res. 2020, 27, 6375–6388. [Google Scholar] [CrossRef] [PubMed]
  16. Zhan, L.; Guo, P.; Pan, G.Q. The effect of mandatory environmental regulation on green development efficiency: Evidence from China. Environ. Sci. Pollut. Res. 2022, 30, 9782–9792. [Google Scholar]
  17. Yu, B.; Jin, G.; Cheng, Z. The Economic Effects of Environmental Regulation: ‘Emission Reduction’ or ‘Efficiency Enhancement’. Stat. Res. 2019, 36, 88–100. [Google Scholar]
  18. Xie, R.; Yuan, Y.; Huang, J. Different types of environmental regulations and heterogeneous influence on “green” productivity: Evidence from China. Ecol. Econ. 2017, 132, 104–112. [Google Scholar]
  19. Song, M.; Zhao, X.; Shang, Y.; Chen, B. Realization of green transition based on the anti-driving mechanism: An analysis of environmental regulation from the perspective of resource dependence in China. Sci. Total Environ. 2020, 698, 134317. [Google Scholar]
  20. Zhang, Y.; Song, Y. Environmental regulations, energy and environment efficiency of China’s metal industries: A provincial panel data analysis. J. Clean. Prod. 2021, 280, 124437. [Google Scholar] [CrossRef]
  21. Li, Y.; Xu, X.; Zheng, Y. The Impact of Environmental Regulation Intensity on Total Factor Energy Efficiency in Chinese Industry: An Empirical Study Based on Panel Data from 30 Provinces from 2003 to 2016. Manag. Rev. 2019, 31, 40–48. [Google Scholar]
  22. Sun, H.; Guo, J. The Impact and Mechanism of Environmental Regulation and Industrial Agglomeration on Energy Efficiency: A Perspective Based on Spatial Effects. J. Nat. Resour. 2022, 37, 3234–3251. [Google Scholar]
  23. Wu, H.; Guo, H.; Zhang, B.; Bu, M. Westward movement of new polluting firms in China: Pollution reduction mandates and location choice. J. Comp. Econ. 2017, 45, 119–138. [Google Scholar]
  24. Cheng, M.; Dhaliwal, D.; Zhang, Y. Does investment efficiency improve after the disclosure of material weaknesses in internal control over financial reporting? J. Account. Econ. 2013, 56, 1–18. [Google Scholar]
  25. Gao, K.; Zhao, H.; Wang, L. Director and Officer Liability Insurance and Green Innovation in Manufacturing Enterprises: Based on the Mediating Effect of Internal Control. East China Econ. Manag. 2022, 36, 119–128. [Google Scholar]
  26. Tang, X.; Zhang, J. Can Voluntary Disclosure of Internal Control Audit Fees Enhance the Independence of Internal Control Audits? Audit. Res. 2017, 197, 90–96. [Google Scholar]
  27. Boulhaga, M.; Bouri, A.; Elamer, A.A.; Ibrahim, B.A. Environmental, social and governance ratings and firm performance: The moderating role of internal control quality. Corp. Soc. Responsib. Environ. Manag. 2023, 30, 134–145. [Google Scholar]
  28. Cheng, Q.; Goh, B.W.; Kim, J.B. Internal control and operational efficiency. Contemp. Account. Res. 2018, 35, 1102–1139. [Google Scholar]
  29. Liu, X.; Liu, S.; Wang, J.; Chen, H. Does internal control affect corporate environmental responsibility? Evidence from China. Int. J. Emerg. Mark. 2024; ahead-of-print. [Google Scholar] [CrossRef]
  30. Li, B.; Wu, S. Effects of local and civil environmental regulation on green total factor productivity in China: A spatial Durbin econometric analysis. J. Clean. Prod. 2016, 153, 342–353. [Google Scholar]
  31. Huang, X.L.; Tian, P. How does heterogeneous environmental regulation affect net carbon emissions: Spatial and threshold analysis for China. J. Environ. Manag. 2023, 330, 117161. [Google Scholar] [CrossRef] [PubMed]
  32. Cai, H.; Chen, Y.; Gong, Q. Polluting thy neighbor: Unintended consequences of China’s pollution reduction mandates. J. Environ. Econ. Manag. 2016, 76, 86–104. [Google Scholar] [CrossRef]
  33. Copeland, B.R.; Taylor, M.S. Trade, Growth and the Environment. J. Econ. Lit. 2004, 42, 7–71. [Google Scholar] [CrossRef] [PubMed]
  34. Sun, W.; Yang, Q.; Ni, Q.; Kim, Y. The impact of environmental regulation on employment: An empirical study of China’s Two Control Zone policy. Environ. Sci. Pollut. Res. 2019, 26, 26472–26487. [Google Scholar] [CrossRef]
  35. Han, C.; Liu, X.; Wang, H. Regulatory Officials’ Incentives and Behavioral Preferences: A New Explanation for the Failure of Environmental Regulation Under a Lack of Independence. Manag. World 2016, 2, 82–94. [Google Scholar] [CrossRef]
  36. Pu, Z.; Fu, J. Economic growth, environmental sustainability and China mayors’ promotion. J. Clean. Prod. 2018, 172, 454–465. [Google Scholar] [CrossRef]
  37. Feng, T.; Du, H.; Zhang, Z.; Mi, Z.; Guan, D.; Zuo, J. Carbon transfer within China: Insights from production fragmentation. Energy Econ. 2020, 86, 104647. [Google Scholar] [CrossRef]
  38. Su, F.; Qi, L.; He, J. Analysis of the Spatiotemporal Evolution and Spatial Spillover Effects of Green Investment Efficiency in Chinese Enterprises. Ecol. Econ. 2024, 40, 75–85. [Google Scholar]
  39. Wang, Q. Fixed-Effect Panel Threshold Model using Stata. Stata J. Promot. Commun. Stat. Stata 2015, 15, 121–134. [Google Scholar] [CrossRef]
  40. Lou, L.; Li, J.; Zhong, S. Sulfur dioxide (SO2) emission reduction and its spatial spillover effect in high-tech industries: Based on panel data from 30 provinces in China. Environ. Sci. Pollut. Res. Int. 2021, 28, 31340–31357. [Google Scholar] [CrossRef]
  41. Yang, X.D.; Wu, H.T.; Ren, S.Y.; Ran, Q.Y.; Zhang, J.N. Does the development of the internet contribute to air pollution control in China? Mechanism discussion and empirical test. Struct. Change Econ. Dynam. 2021, 56, 207–224. [Google Scholar]
  42. Tian, J.; Sun, S.; Cao, W.; Bu, B.; Xue, R. Make every dollar count: The impact of green credit regulation on corporate green investment efficiency. Energy Econ. 2024, 130, 107307. [Google Scholar]
  43. Xiao, L.; Li, X. The Impact of Green Securities on Corporate Green Investment Efficiency: Evidence from Listed Companies in Six High-Energy-Consumption Industries. Financ. Regul. Res. 2020, 12, 78–97. [Google Scholar]
  44. Li, P.; Chen, Y. Environmental Regulation, Corporate Bargaining Power, and Green Total Factor Productivity. Financ. Trade Econ. 2019, 40, 144–160. [Google Scholar]
  45. Mao, J.; Guo, Y.; Cao, J.; Xu, J. Local Government Financing Platform Debt and Environmental Pollution Control. Manag. World 2022, 38, 96–118. [Google Scholar]
  46. Yan, S.; Tingting, Y.; Ming, Z. Research on the impact of environmental regulation on enterprise technology innovation-an empirical analysis based on Chinese provincial panel data. Environ. Sci. Pollut. Res. Int. 2019, 26, 21835–22184. [Google Scholar]
  47. Shen, N.; Liu, F.C. Can intensive environmental regulation promote technological innovation? Porter hypothesis reexamined. Chin. Soft Sci. 2012, 4, 49–59. [Google Scholar]
  48. Tang, G.; Li, L.; Wu, D. Environmental Regulation, Industry Attributes, and Corporate Environmental Investment. Account. Res. 2013, 6, 83–89+96. [Google Scholar]
  49. Hu, J.; Song, X.; Wang, H. Informal Institutions, Hometown Identity, and Corporate Environmental Governance. Manag. World 2017, 3, 76–94+187–188. [Google Scholar]
  50. Xu, C.; Wang, M.; Ma, Y. Debt Contracts and Overinvestment: “Governance Distortion” or “Empire Building”. J. Shanxi Univ. Financ. Econ. 2018, 40, 113–124. [Google Scholar]
  51. Mahla, D.; Agarwal, S.; Mathur, T. A novel fuzzy non-radial data envelopment analysis: An application in transportation. RAIRO Oper. Res. 2021, 55, 2189–2202. [Google Scholar] [CrossRef]
  52. Bendell, B.L. Environmental investment decisions of family firms—An analysis of competitor and government influence. Bus. Strat. Environ. 2021, 31, 1–14. [Google Scholar] [CrossRef]
  53. Liu, L.; Zhao, Z.; Zhang, M.; Zhou, D. Green investment efficiency in the Chinese energy sector: Overinvestment or underinvestment? Energy Policy 2022, 160, 112694. [Google Scholar] [CrossRef]
  54. Zhao, L.; Tang, Y.; Liu, Y. How Does Environmental Tax Influence the Scale and Efficiency of Green Investment among China’s Heavily Polluting Enterprises? Sustainability 2023, 15, 15021. [Google Scholar] [CrossRef]
  55. Ren, F.-R.; Wu, T.-F.; Ren, Y.-J.; Liu, X.-Y.; Yuan, X. The impact of environmental regulation on green investment efficiency of thermal power enterprises in China-based on a three-stage exogenous variable model. Sci. Rep. 2024, 14, 8400. [Google Scholar] [CrossRef]
  56. Saidi, K.; Hammami, S. The impact of CO2 emissions and economic growth on energy consumption in 58 countries. Energy Rep. 2015, 1, 62–70. [Google Scholar] [CrossRef]
  57. Lyu, C.; Xie, Z.; Li, Z. Market supervision, innovation offsets and energy efficiency: Evidence from environmental pollution liability insurance in China. Energy Policy 2022, 171, 113267. [Google Scholar] [CrossRef]
  58. Shi, D.; Li, S. The Emission Trading System and Energy Utilization Efficiency: Measurement and Empirical Analysis of Prefectural-Level Cities and Above. China Ind. Econ. 2020, 9, 5–23. [Google Scholar]
  59. Umanskaya, V.I.; Barbier, E.B. Can Rich Countries Become Pollution Havens? Rev. Int. Econ. 2008, 16, 627–640. [Google Scholar] [CrossRef]
  60. Shen, K.; Zhou, L. Local Government Competition, Vertical Environmental Regulation, and Pollution Rebound Effect. Econ. Res. 2020, 55, 35–49. [Google Scholar]
  61. Wang, P.; Bu, H.; Liu, F. Internal Control and Enterprise Green Innovation. Energies 2022, 15, 2193. [Google Scholar] [CrossRef]
  62. Tao, L.; Wei, X.; Wang, W. Does Enterprise Internal Control Improve Environmental Performance—Empirical Evidence from China. Sustainability 2023, 15, 10199. [Google Scholar] [CrossRef]
  63. Bu, Y.; Wang, E.; Qiu, Y.; Möst, D. Impact assessment of population migration on energy consumption and carbon emissions in China: A spatial econometric investigation. Environ. Impact Assess. Rev. 2022, 93, 106744. [Google Scholar]
  64. Du, L.; Tian, M.; Cheng, J.; Chen, W.; Zhao, Z. Environmental regulation and green energy efficiency: An analysis of spatial Durbin model from 30 provinces in China. Environ. Sci. Pollut. Res. Int. 2022, 29, 67046–67062. [Google Scholar] [CrossRef]
  65. Zhang, X.; Xu, F. Environmental Regulation and Spatial Spillover Effect of Green Technology Innovation: An Empirical Study on the Spatial Durbin Model. Sustainability 2023, 15, 14133. [Google Scholar] [CrossRef]
  66. Wang, X.; Li, M. The Spatial Spillover Effects of Environmental Regulation on China’s Industrial Green Growth Performance. Energies 2019, 12, 267. [Google Scholar] [CrossRef]
  67. Ren, X.; Wu, X.; Liu, Y.; Sun, S. The Spatial Spillover Effect of Environmental Regulation and Technological Innovation on Industrial Carbon Productivity in China: A Two-Dimensional Structural Heterogeneity Analysis. Math. Probl. Eng. 2021, 2021, 5613525. [Google Scholar]
  68. Chen, J.; Hu, L. Does Environmental Regulation Drive Economic Growth through Technological Innovation: Application of Nonlinear and Spatial Spillover Effect. Sustainability 2022, 14, 16455. [Google Scholar] [CrossRef]
  69. Sun, H.; Bai, T.; Fan, Y.; Liu, Z. Environmental, social, and governance performance and enterprise sustainable green innovation: Evidence from China. Corp. Soc. Responsib. Environ. Manag. 2024, 31, 3633–3650. [Google Scholar] [CrossRef]
  70. Jie, G.; Jiahui, L. Media attention, green technology innovation and industrial enterprises’ sustainable development: The moderating effect of environmental regulation. Econ. Anal. Policy 2023, 79, 873–889. [Google Scholar]
Figure 1. The structure of this paper.
Sustainability 17 02934 g001
Figure 2. The environmental regulation in the three major regions of China from 2017 to 2022.
Sustainability 17 02934 g002
Figure 3. Moran scatter plot of enterprises’ green investment efficiency in 2017 under the economic weight matrix.
Sustainability 17 02934 g003
Figure 4. Moran scatter plot of enterprises’ green investment efficiency in 2022 under the economic weight matrix.
Sustainability 17 02934 g004
Table 1. Definition of control variables.
Variable TypeVariableDescription of Variables
Firm level
control variable
SizeNatural logarithm of total assets of the enterprise at the end of the year
LeverageGearing ratio = total liabilities/total assets
GIscaleRatio of new green investments made by firms in the sample year to total assets at the end of the year
OpportunityTobin’s Q = market capitalization/total assets
LSRShareholding of the first largest shareholder in the enterprise
BDsizeTotal number of directors in the enterprise
DualityDummy variable that takes the value of 1 if the chairman and the general manager of the enterprise are the same person, and 0 otherwise
External environment
control variable
PGDPGross regional product/average total population of the province (autonomous region or municipality directly under the central government) to which the enterprise belongs
EQRankThe annual average concentration of PM2.5 in the province (autonomous region or municipality) to which the enterprise belongs
lnIENNatural logarithm of the total number of industrial enterprises in the province (autonomous region or municipality directly under the central government) to which the enterprise belongs
Table 2. Analysis of the corporate green investment efficiency with the SBM-DEA model.
201720182019202020212022
Std. Dev.0.38060.34780.27280.29280.34910.3515
Mean0.36590.28710.21720.25000.33200.2462
Median0.18030.13080.10900.13870.14400.0833
Green Investment Efficiency Pareto Optimal Number of Firms423111173026
Optimal Percentage23.20%17.13%6.08%9.39%16.57%14.36%
Obs181181181181181181
Table 3. Results of threshold existence tests.
Threshold VariableThreshold NumberF-Valuep-ValueBSCritical Value
1%5%10%
ENSingle91.81 ***0.00030013.2659.5968.448
Double290.12 ***0.00030061.05611.2209.255
Triple23.480.350300289.87689.23847.311
EN × ICQSingle14.98 ***0.0003005.4663.7332.791
Double181.83 ***0.00030013.10510.3887.676
Triple9.49 **0.05030014.6099.2216.868
Note: ***, and ** indicate significance at the 1% and 5% levels, respectively.
Table 4. Threshold regression results.
Regression
Coefficient
Regression
Coefficient
EN
(EN ≤ 3.9842)
−0.0218 **
(0.0089)
EN × ICQ
(EN × ICQ ≤ −0.397)
−0.00747 ***
(0.0028)
EN
(3.9842 < EN ≤ 4.7055)
0.1369 ***
(0.0085)
EN × ICQ
(−0.397 < EN × ICQ ≤ −0.027)
0.1263 ***
(0.00836)
EN
(EN > 4.7055)
−0.00925 ***
(0.00219)
EN × ICQ
(−0.027 < EN × ICQ ≤ 0.17)
0.0362 ***
(0.0129)
EN × ICQ
(EN × ICQ > 0.17)
−0.00863 ***
(0.00216)
ControlsYesControlsYes
_cons3.4972 **
(1.1847)
_cons4.649 ***
(1.2124)
Note: ***, and ** indicate significance at the 1% and 5% levels, respectively. The values in parentheses represent standard errors.
Table 5. Global Moran’s index of corporate green investment efficiency.
YearMoran’s IndexZp
20170.143 ***4.8530.000
20180.151 ***5.1180.000
20190.251 ***8.4550.000
20200.194 ***6.5470.000
20210.162 ***5.4860.000
20220.221 ***7.4250.000
Note: *** indicates significance at the 1% level.
Table 6. Test results for spatial econometric model selection.
Matrix: The Economic Weight Matrix
Wald test (lag)11.78Wald test (error)11.23
LR test (lag)8.92LR test (error)2.49
Spatial fixed effect42.36 ***Time fixed effect433.59 ***
Hausman test37.66 ***
Note: *** indicates significance at the 1% level.
Table 7. Benchmark regression results for environmental regulation and firms’ green investment efficiency.
Model 1Model 2Model 3Model 4
SARSDMSEMFE
EN−0.00970 ***
(0.00234)
−0.00914 ***
(0.00338)
−0.00918 ***
(0.00221)
−0.00920 ***
(0.00248)
Size−0.157 ***
(0.0394)
−0.179 ***
(0.0488)
−0.151 ***
(0.0382)
−0.154 ***
(0.0419)
Leverage0.168
(0.130)
0.360 **
(0.168)
0.154
(0.125)
0.175
(0.138)
LSR−0.00112
(0.00239)
0.00238
(0.00327)
−0.00128
(0.00230)
−0.000960
(0.00254)
Opportunity0.00557
(0.0135)
0.00547
(0.0161)
0.00558
(0.0131)
0.00553
(0.0144)
BDsize0.0105 **
(0.00512)
0.0102
(0.00666)
0.0101 **
(0.00493)
0.0101 *
(0.00544)
Duality−0.0303
(0.0267)
−0.0591
(0.0367)
−0.0259
(0.0252)
−0.0298
(0.0284)
EQRank−0.0271 ***
(0.00964)
−0.0160
(0.0127)
−0.0264 ***
(0.00918)
−0.0253 **
(0.0102)
PGDP1.76 × 10−6
(1.88 × 10⁻⁶)
1.13 × 10⁻⁶
(2.48 × 10⁻⁶)
1.66 × 10⁻⁶
(1.80 × 10⁻⁶)
1.62 × 10⁻⁶
(1.99 × 10⁻⁶)
lnIEN−0.0541
(0.0690)
−0.120
(0.0872)
−0.0460
(0.0669)
−0.0529
(0.0734)
GIscale−0.231
(0.908)
0.471
(1.079)
−0.271
(0.884)
−0.00920 ***
(0.00248)
W*EN −0.000206
(0.0107)
Spa-rho−0.232 **
(0.104)
−0.281 ***
(0.109)
lambda −0.246 **
(0.107)
sigma2_e0.0753 ***
(0.00419)
0.0757 ***
(0.00426)
0.0757 ***
(0.00426)
Area/Year fixed effectYesYesYesYes
R-squared0.0060.0000.0060.080
Number of IDs181181181181
Note: ***, **, and * indicate significance at the 1%, 5%, and 10% levels, respectively. The values in parentheses represent standard errors.
Table 8. Test results for the spatial autoregressive model.
VariableDirect EffectIndirect EffectTotal Effect
EN−0.00930 ***
(0.00225)
0.00141 **
(0.000676)
−0.00789 ***
(0.00198)
ControlsYesYesYes
Observations108610861086
Note: *** and ** indicate significance at the 1%, and 5% levels, respectively. The values in parentheses represent standard errors.
Table 9. Test results for the robustness test.
Model 1Model 2
Replace Spatial Weight MatrixReplace Core Explanatory Variable
EN−0.00723 ***
(0.00210)
0.0277 ***
(0.00959)
Size−0.134 ***
(0.0355)
−0.157 ***
(0.0396)
Leverage0.259 **
(0.117)
0.111
(0.129)
LSR−0.000787
(0.00215)
−0.00124
(0.00240)
Opportunity0.0114
(0.0122)
0.00742
(0.0135)
BDsize0.00994 **
(0.00461)
0.00885 *
(0.00514)
Duality−0.0273
(0.0240)
−0.0268
(0.0268)
EQRank−0.0152 *
(0.00868)
−0.0293 ***
(0.00964)
PGDP6.27 × 10−7
(1.69 × 10⁻⁶)
2.23 × 10⁻⁶
(1.88 × 10⁻⁶)
lnIEN−0.0259
(0.0621)
0.0442
(0.0668)
GIscale−0.639
(0.817)
−0.323
(0.910)
Spa-rho0.578 ***
(0.0499)
−0.221 **
(0.103)
sigma2_e0.0609 ***
(0.00265)
0.0756 ***
(0.00421)
Direct (EN)−0.00754 ***
(0.00220)
0.0267 ***
(0.00921)
Indirect (EN)−0.00972 ***
(0.00340)
−0.00389 *
(0.00226)
Total (EN)−0.0173 ***
(0.00531)
0.0228 ***
(0.00796)
Area/Year fixed effectYesYes
R-squared0.0060.015
Observations10861086
Note: ***, **, and * indicate significance at the 1%, 5%, and 10% levels, respectively. The values in parentheses represent standard errors.
Disclaimer/Publisher’s Note: The statements, opinions and data contained in all publications are solely those of the individual author(s) and contributor(s) and not of MDPI and/or the editor(s). MDPI and/or the editor(s) disclaim responsibility for any injury to people or property resulting from any ideas, methods, instructions or products referred to in the content.

