Article

Spatiotemporal Analysis of Heavy Metal Pollution and Risks in Soils from a Shut-Down Electroplating Plant

1
College of Marine and Environmental Sciences, Tianjin University of Science & Technology, Tianjin 300457, China
2
Research Institute for Environmental Innovation (Binhai, Tianjin), Tianjin 300450, China
3
Tianjin Geological Engineering Survey and Design Institute Co., Ltd., Tianjin 300191, China
4
State Environmental Protection Key Laboratory of Simulation and Control of Groundwater Pollution, Chinese Research Academy of Environmental Sciences, Beijing 100012, China
*
Author to whom correspondence should be addressed.
Sustainability 2025, 17(7), 2931; https://doi.org/10.3390/su17072931
Submission received: 22 November 2024 / Revised: 10 January 2025 / Accepted: 14 February 2025 / Published: 26 March 2025

Abstract

:
Spatiotemporal analysis of heavy metal pollution and risks in soils from a shut-down electroplating plant was carried out. Two batch samples were tested in December 2020 and August 2022, obtained from different sampling positions and depths. The results show that Cu, Pb, As, and Ni were the main pollutants, and their spatial distribution characteristics in December 2020 and August 2022 were similar. The pollution depth of Cu, Pb, As, and Ni was mainly concentrated within 1.0 m from the ground. In the horizontal direction, the four kinds of pollutants had some relatively concentrated pollution areas and many dispersed pollution points. In December 2020, Cu contamination was heavy, and the comprehensive ecological risk was slight. In August 2022, Cu contamination was heavy, Pb contamination was moderate, and the comprehensive ecological risk was moderate as well. Both As and Ni posed carcinogenic risks in both samples. Cu, Pb, As, and Ni migrated very slowly under the action of rainfall infiltration. Soil pollution was primarily attributed to wastewater discharge, while dispersed pollution sites were mainly caused by the landfilling of production waste. The research findings hold significant implications for heavy metal pollution control and risk prevention in the soil of electroplating enterprises.

1. Introduction

Keeping the soil’s environmental quality safe is essential for the sustainable development of both the social economy and human health. In recent years, with the rapid development of the global economy and the acceleration of urbanization, the issue of soil heavy metal pollution has received increasing emphasis. Soil contamination by heavy metals (HMs) represents a significant risk to both ecosystems and human health, attributable to their inherent properties of being hidden, highly toxic, persistent, bio-accumulative, and difficult to degrade [1,2]. Therefore, it is of great significance to thoroughly investigate the spatial distribution, pollution characteristics, and potential health risks associated with heavy metals in soil.
The electroplating industry produces a lot of high-concentration heavy metal wastewater and waste residue during its processes, to the extent that it is now recognized as the world’s most prolific heavy metal polluter industry. With the closure and relocation of a large number of electroplating enterprises, a large number of heavy-metal-contaminated plots have been left behind, causing substantial harm to human health. According to the 2014 report of the National General Survey on Soil Contamination of China, the exceedance points of soil inorganic pollutants represented 82.8% of all exceedance points, with cadmium (Cd), mercury (Hg), arsenic (As), copper (Cu), lead (Pb), and nickel (Ni) accounting for 7.0%, 1.6%, 2.7%, 2.1%, 1.5%, and 4.8%, respectively [3]. The excess rate of heavy metal pollution in heavily polluting enterprises and relocated plots was as high as 36.3% and 34.9%, respectively [4], and electroplating enterprises are just one such type of business.
The systematic identification and assessment of soil heavy metal pollution status and risk are key to future management decisions. A lot of work has been carried out in relation to sampling methods, identification of pollution characteristics, and risk assessments. At present, there is no internationally recognized uniform soil sampling standard around field sampling methods. For example, the European Soil Sampling Guidelines (SSGs) do not provide a specification of the sampling scale, and the Italian SSG proposes the following: a study area < 1 ha having at least 5 samples; 1–5 ha, 5 to 15 samples; and 5–25 ha, 15–60 samples [5,6]. In the Technical Guidelines for the Investigation of Soil Pollution on Construction Land in China (HJ25.1–2019), the sampling scale for detailed soil investigations is specified as 40 × 40 m. In principle, at least one soil sampling point every 1600 m2 should be established; there should be at least one soil sampling point every 400 m2 in heavily polluted areas [7]. In terms of pollution characteristic identification and risk assessment, the soil enrichment factor (EF), pollution factor (CF), pollution load index (PLI), soil accumulation index ( I g e o ), and potential ecological risk index (RI) have been widely used in soil heavy metal pollution research.
The soils of electroplating enterprises are generally polluted by a variety of heavy metals, with differences in pollution depth, enrichment status, and ecological risk under complex formation conditions. The pollution characteristics and environmental risks of Cu, Pb, As, and Ni in the soil of shut-down electroplating plants have been studied previously. However, prior to our study, a spatiotemporal analysis of the pollution characteristics and risks of various heavy metals in the soils from a shut-down electroplating plant had yet to be conducted. Therefore, for a typical shut-down electroplating enterprise, the current study carried out two detailed investigations over two years. The spatial distribution characteristics of the heavy metals in the soil were analyzed. The Nemerow pollution index and potential ecological risk index, human health risk assessments, and Hydrus-2D (Version 2.04.0580) software simulations were used to study the pollution characteristics and environmental risks of heavy metals in the soil from the perspective of time and space scales.

2. Materials and Methods
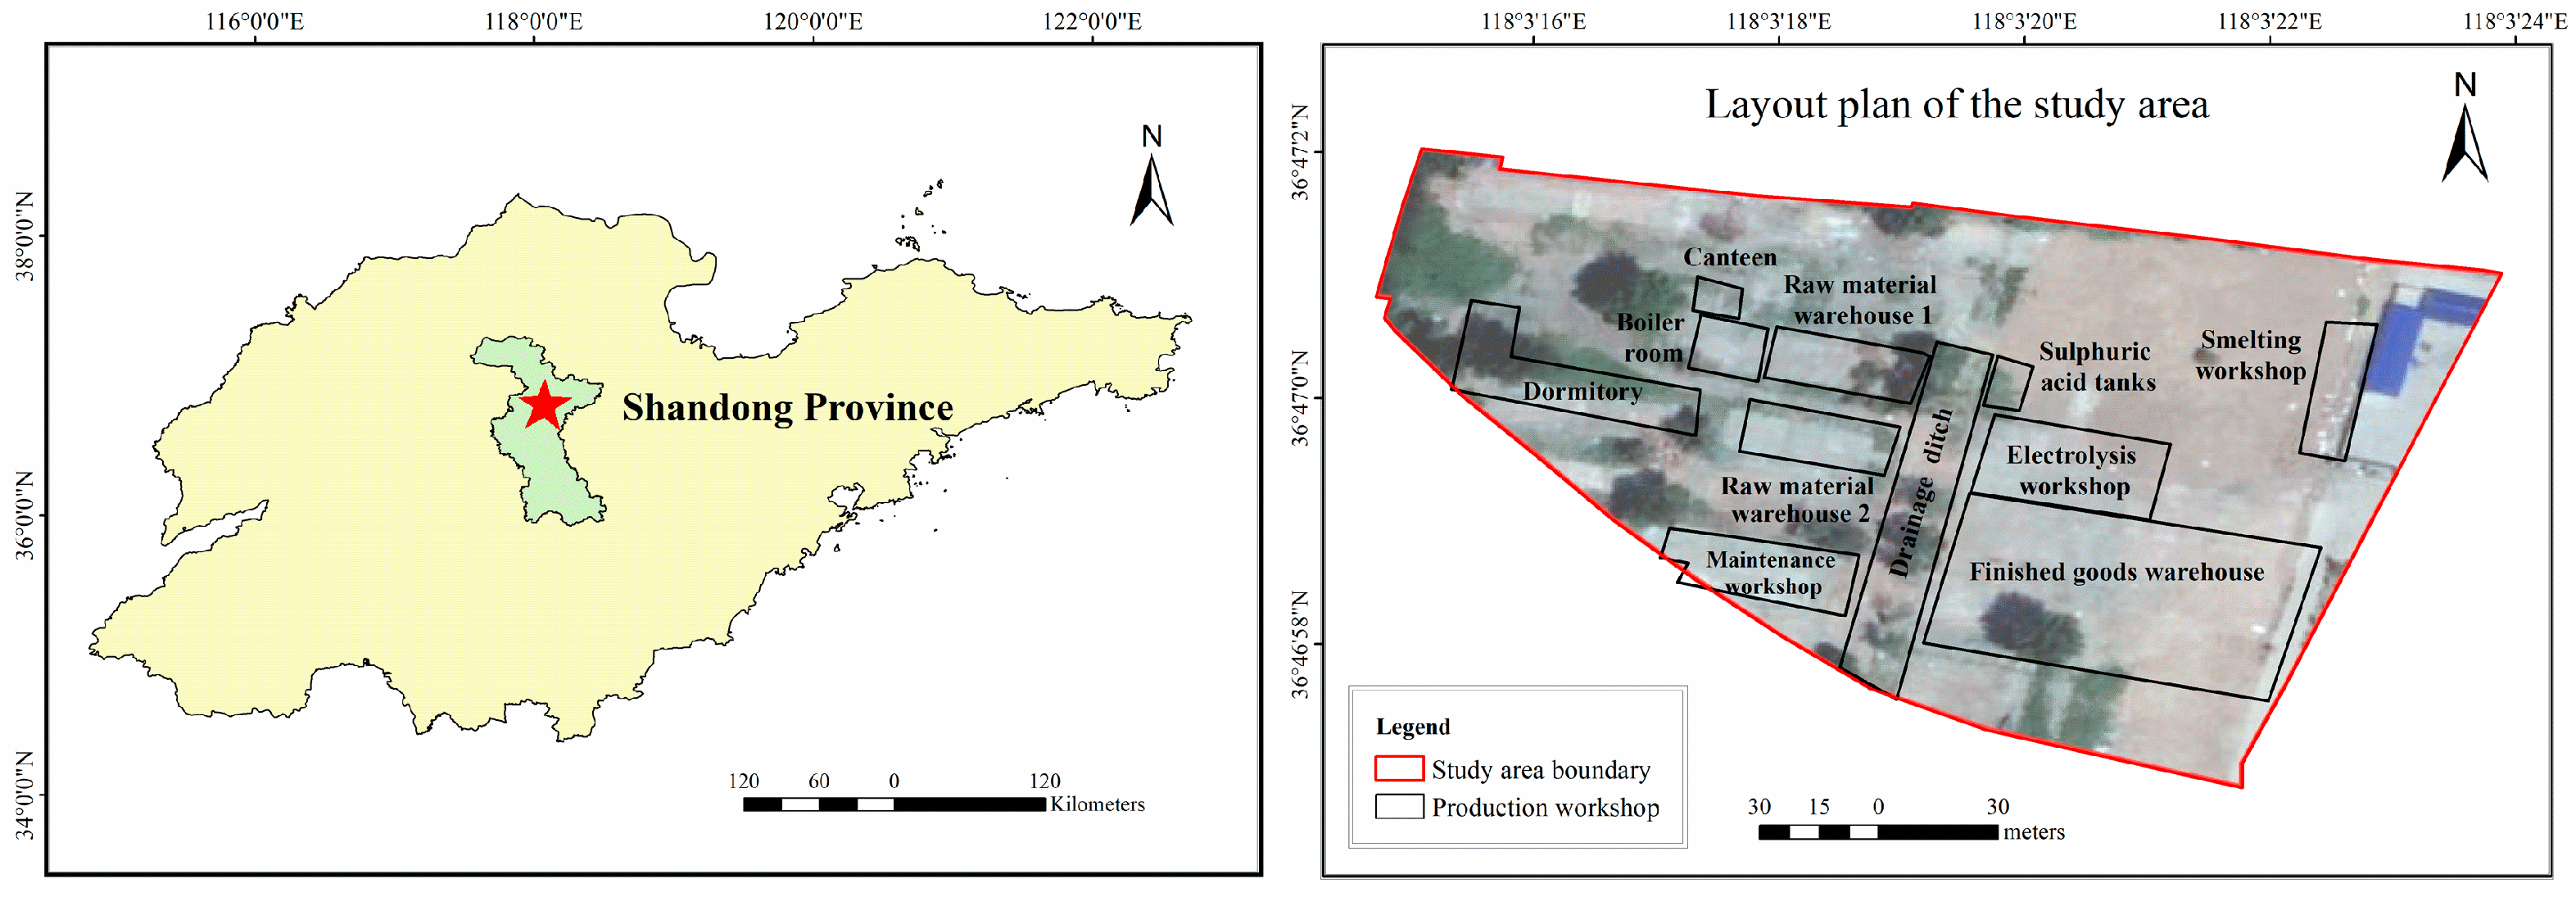
2.1. Study Area

The study area is located in Shandong Province, China. It belongs to the semi-humid and semi-arid continental climate of the warm temperate monsoon type, and the dominant wind direction is southwest. The average annual temperature is 12.3~13.1 °C, and the average monthly precipitation is 75.83 mm. In the summer, the average temperature fluctuates between 26.5 °C and 27.5 °C, while in the winter, it typically falls within −3~−7 °C. The vadose zone mainly consists of silty clay and a mixed fill layer, a silty soil layer, and a silty clay layer. The study area was originally a copper factory established in 1994, which went bankrupt in 2001 and has been out of operation for 23 years. The factory mainly specialized in the electrolytic processing of recycled copper scrap using the copper scrap pyrometallurgical smelting process, with a production scale of 800 tons per year (location, workshop, and material storage unit shown in Figure 1). No other heavy pollution enterprises were found around the study area.

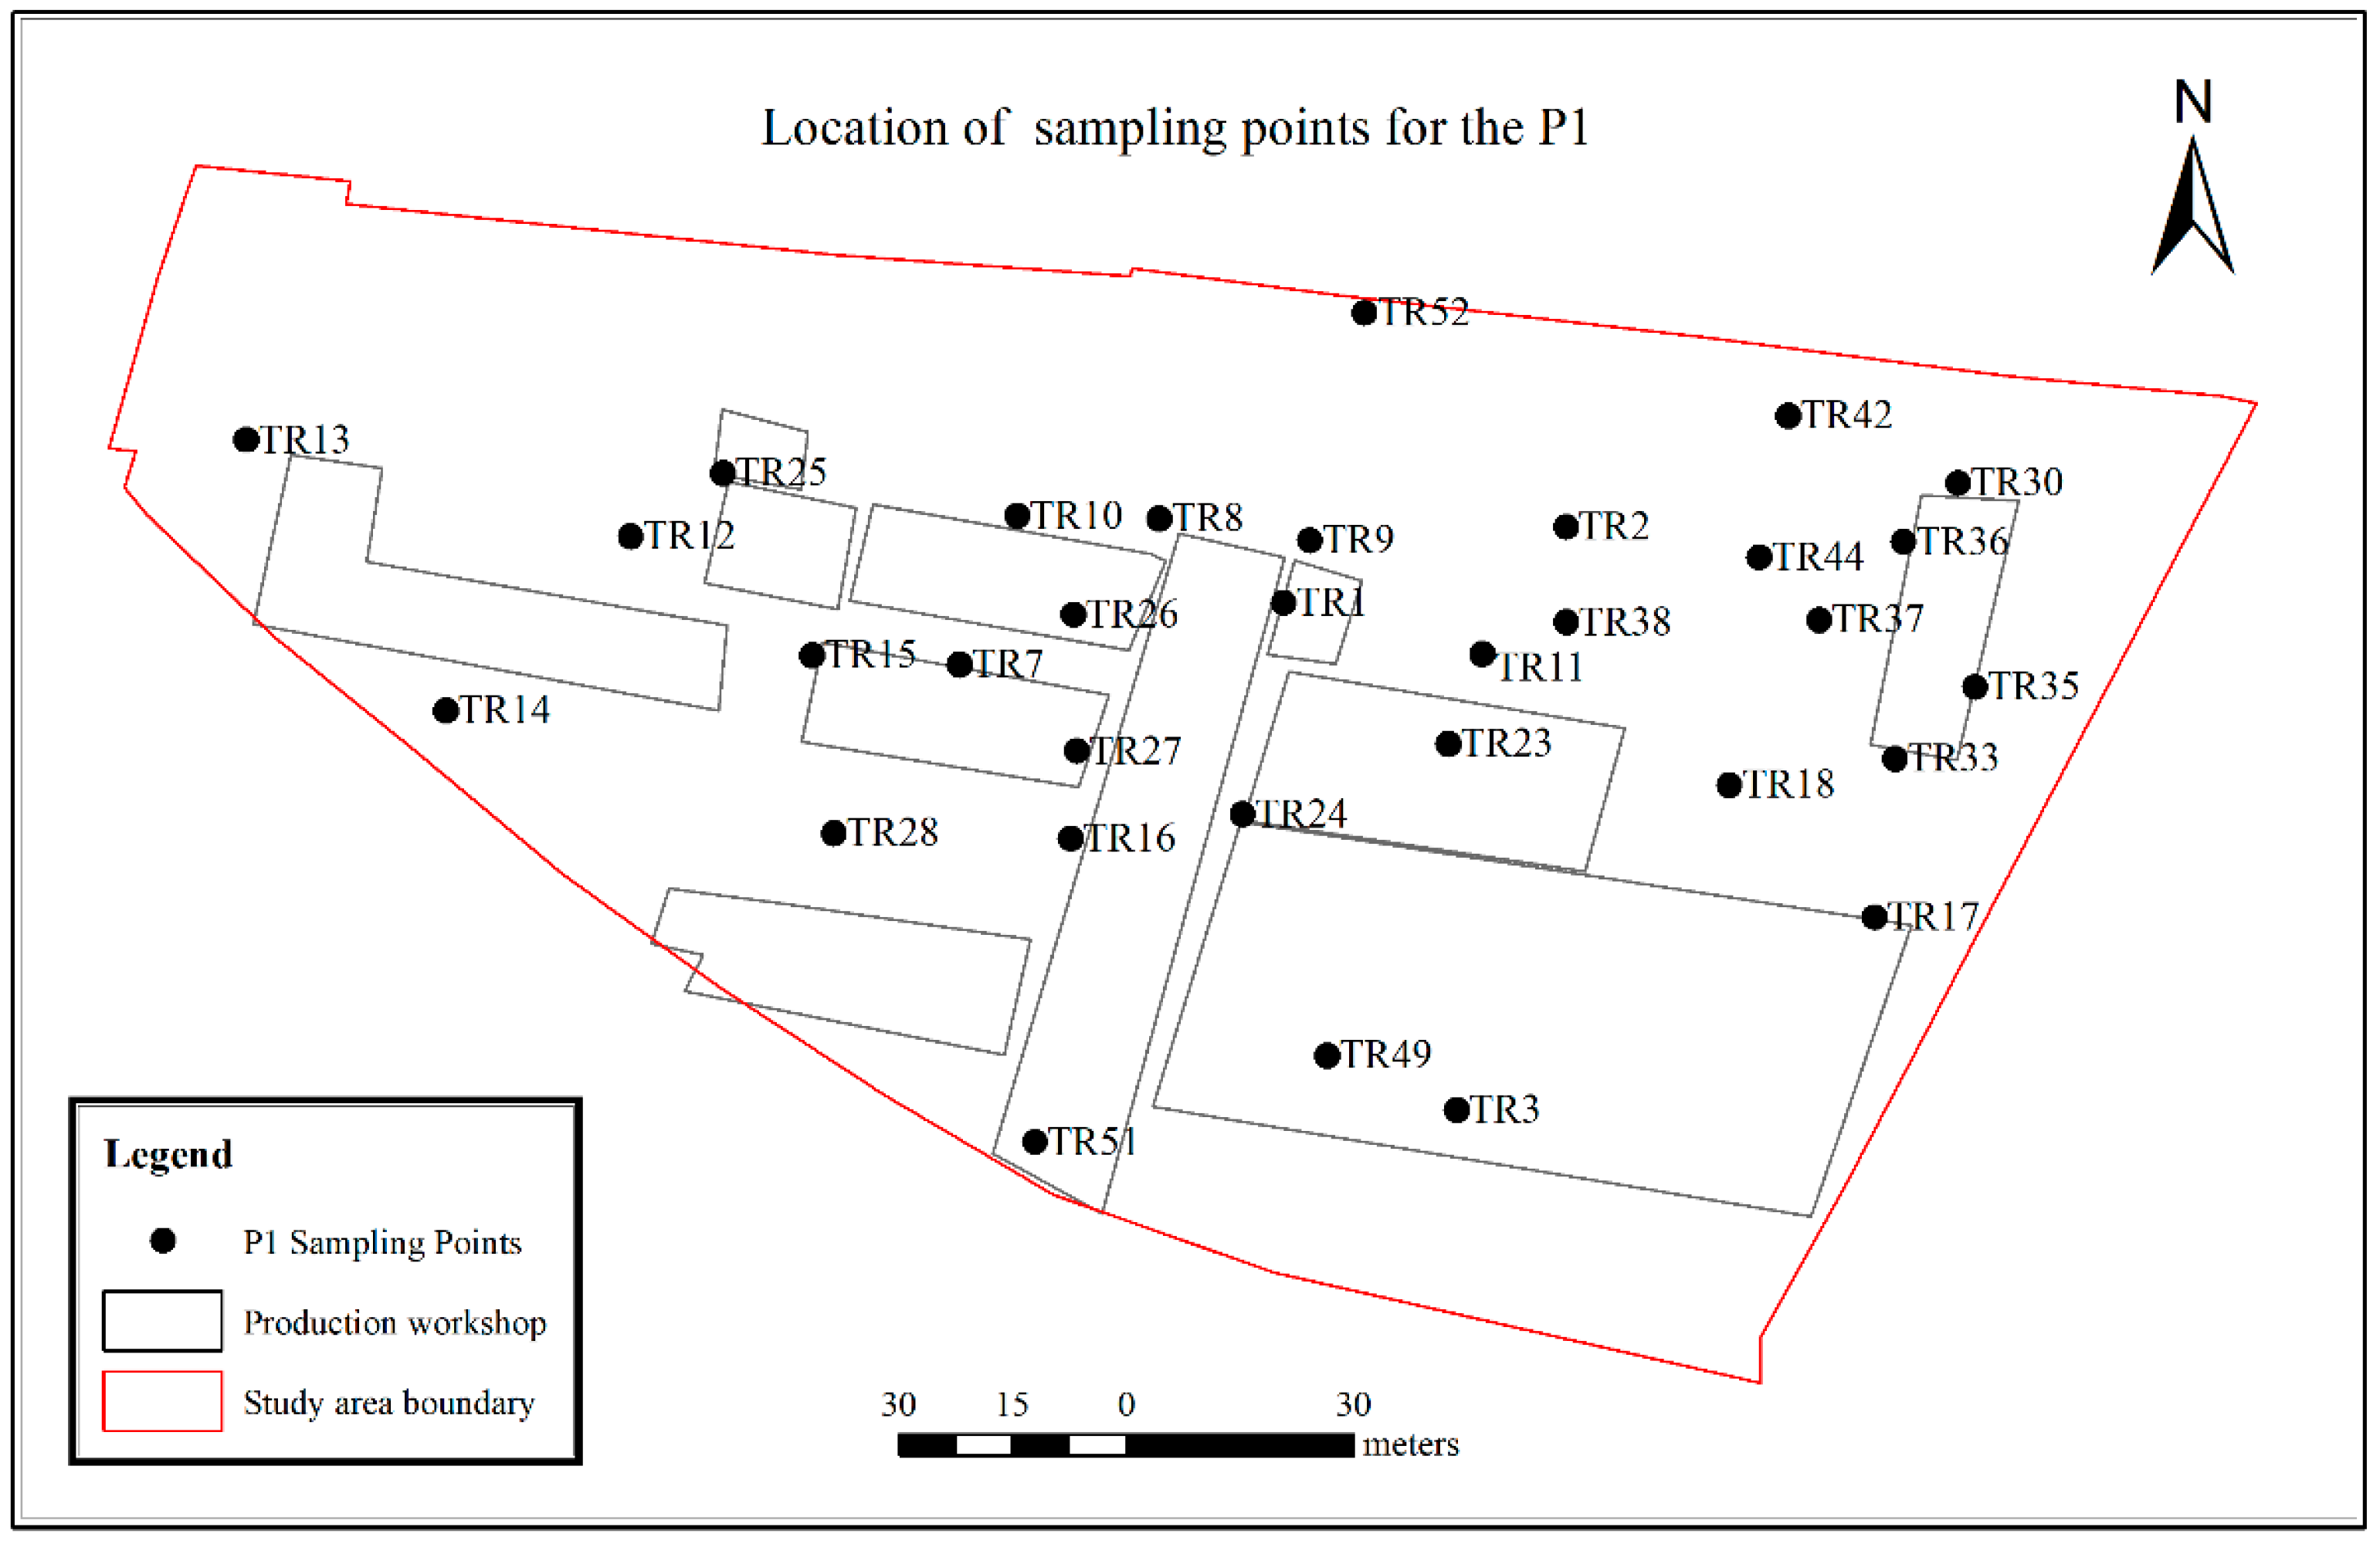
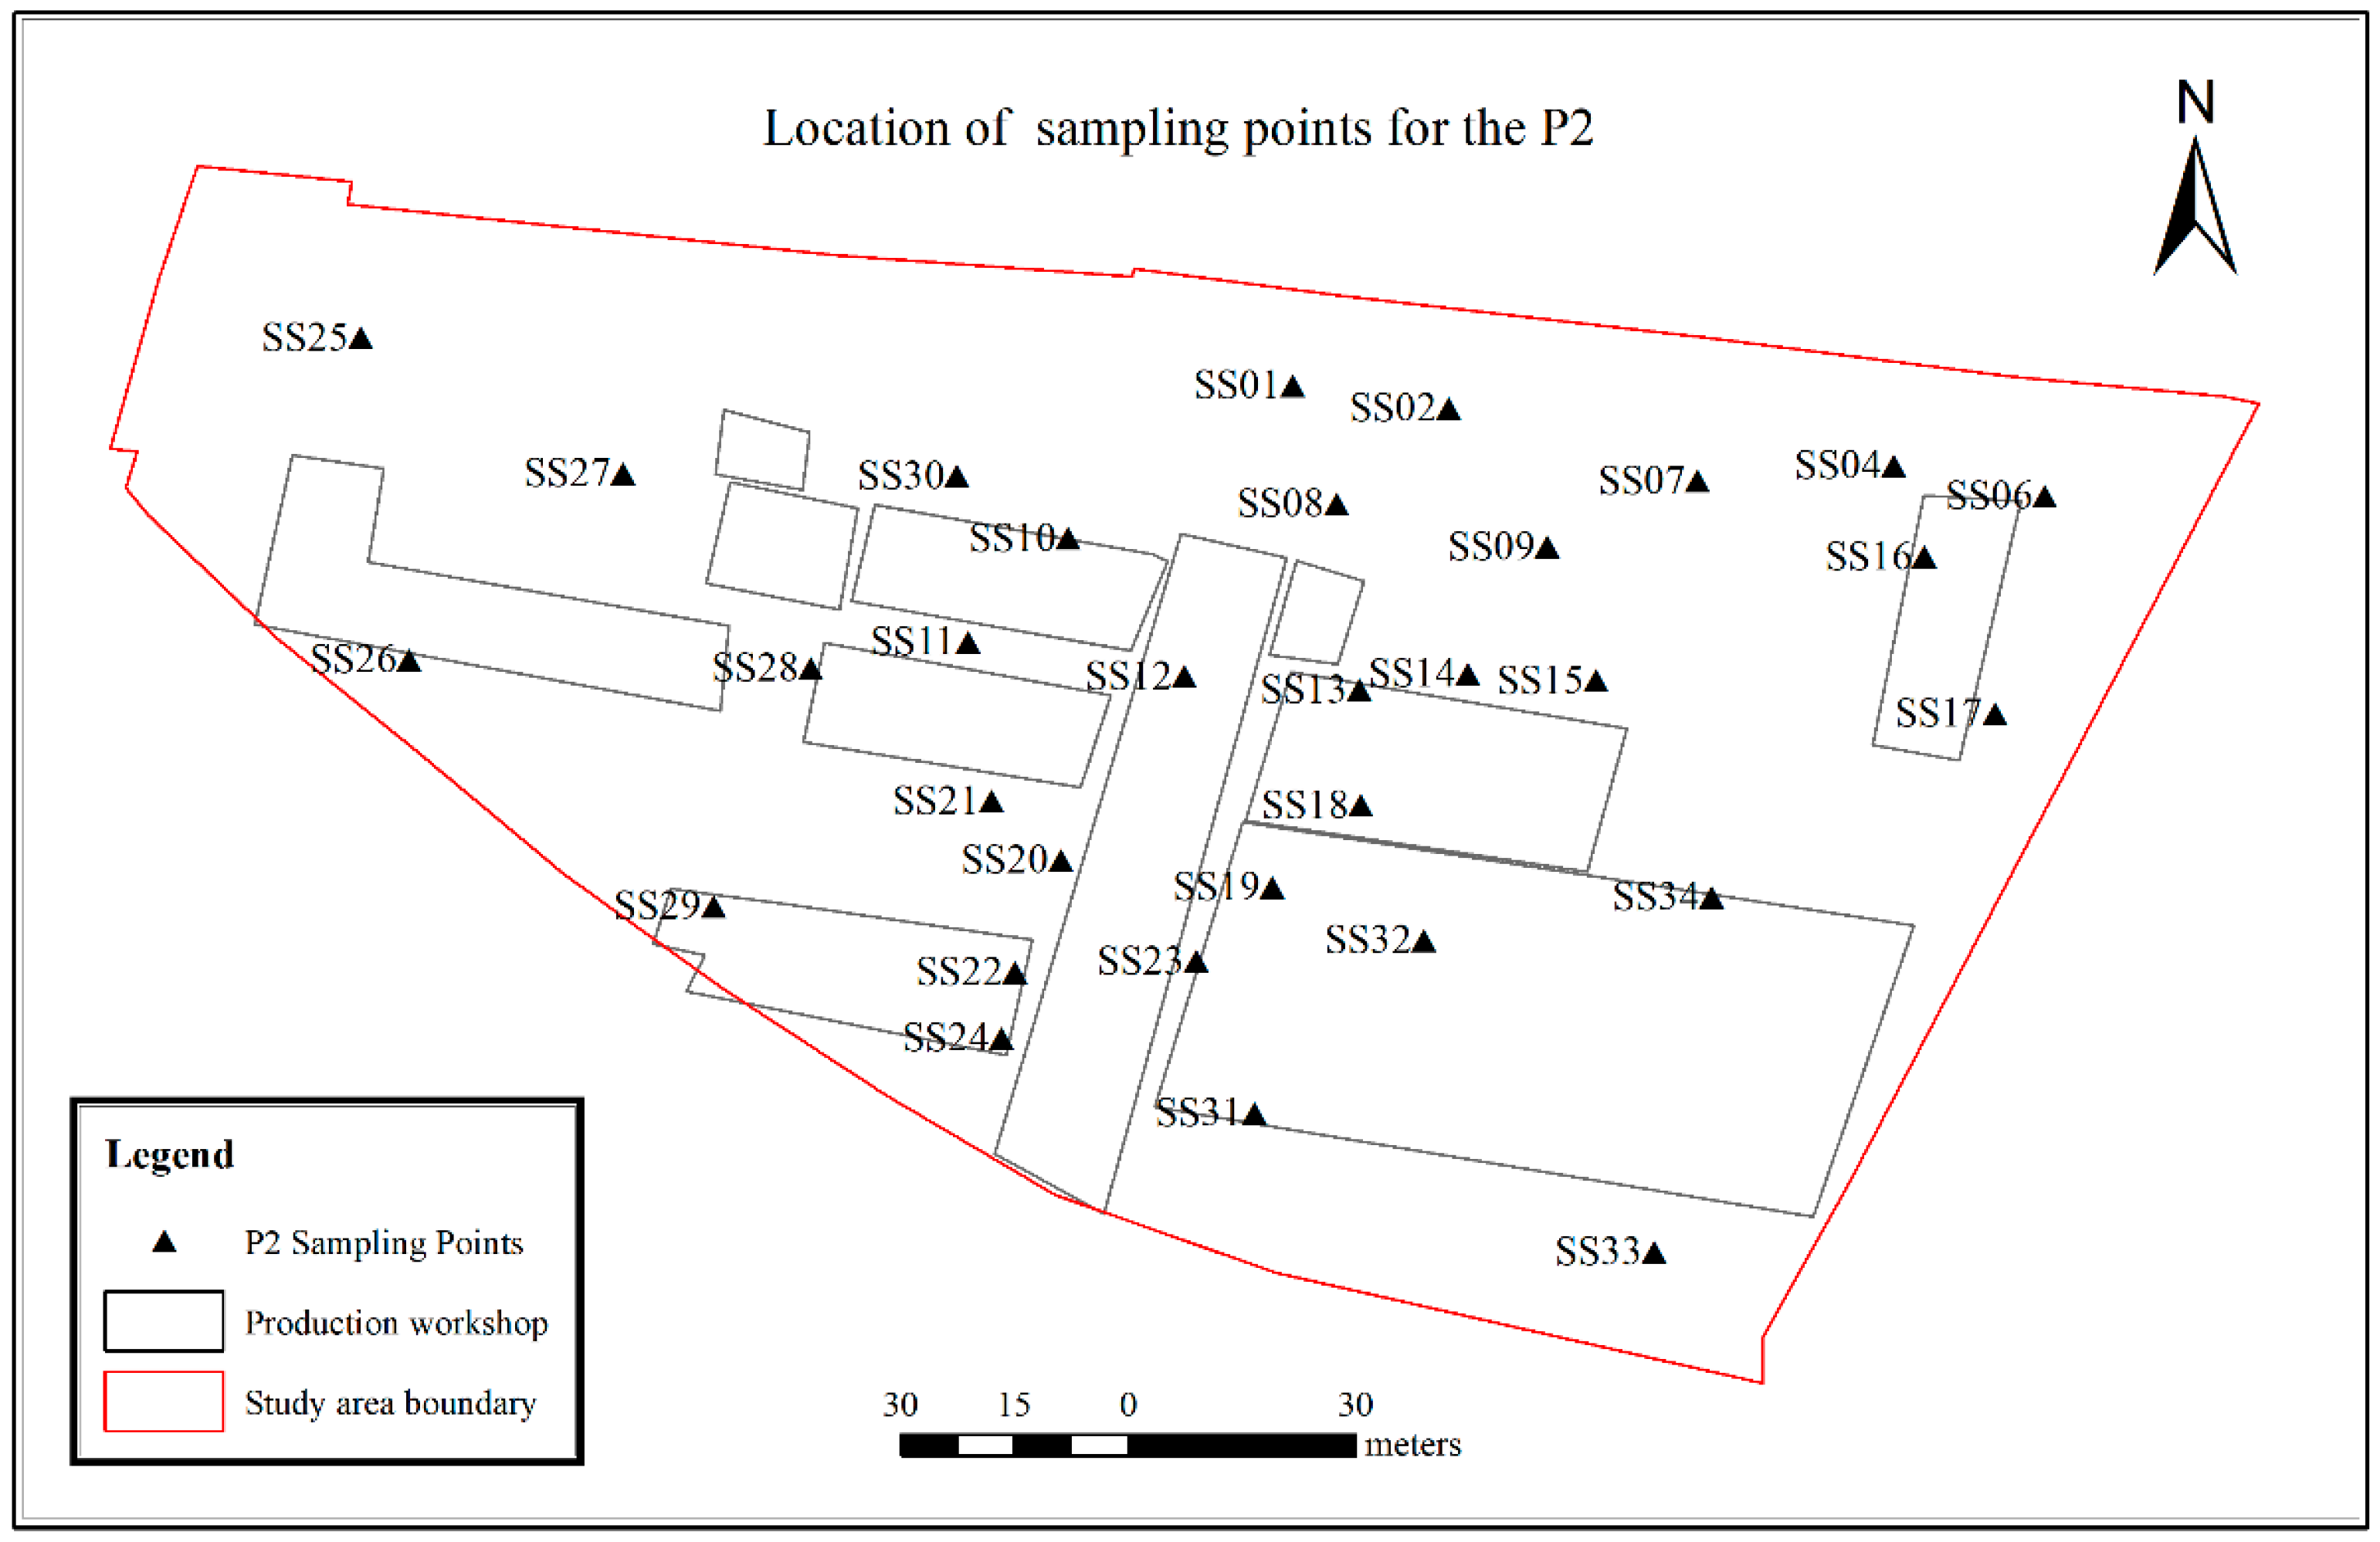
2.2. Sampling and Programs

Soil samples were collected from the study area in December 2020 and August 2022. The soil sampling points were set up using the grid distribution method. The distribution grid spacing for key production areas, such as the ditch, raw material warehouses, sulfuric acid tank, and electrolytic workshop, was 20 × 20 m, and the distribution grid of other areas was 40 × 40 m. The soil samples collected in December 2020 were labeled as batch P1, and those collected in August 2022 as batch P2. A total of thirty-two sampling points were set up for both batches. The P1 soil samples were taken at a depth of 6.0 m. Seven layers of soil samples were collected from different depths: the first layer (0–0.5 m), the second layer (0.5–1.0 m), the third layer (1.0–2.0 m), the fourth layer (2.0–3.0 m), the fifth layer (3.0–4.0 m), the sixth layer (4.0–5.0 m), and the seventh layer (5.0–6.0 m. To investigate the longitudinal changes in heavy metal concentration in the soil within two years, the sampling depth of soil sample P2 was extended to 7.0 m. Six layers of soil samples were collected at different depths: the first layer (0–0.5 m), the second layer (0.5–1.0 m), the third layer (1.0–2.0 m), the fourth layer (2.0–3.0 m), the fifth layer (3.0–5.0 m), and the sixth layer (5.0–7.0 m). The locations of the sampling points for the two batches are shown in Figure 2 and Figure 3.
For sample pretreatment, debris, such as roots and gravel, was removed from the sample. All samples were dried in an oven at 40 °C until a constant weight was achieved. The soil samples were ground and sieved through a 100-mesh nylon sieve and placed in sealed polyethylene bags for analysis. Mercury (Hg), hexavalent chromium (Cr6+), copper (Cu), lead (Pb), arsenic (As), nickel (Ni), and cadmium (Cd) were detected. The detection methods followed those described by Wang et al. [8]. Parallel samples were obtained by selecting 10% of the total samples at random and tested thrice. For each batch of samples, two field blanks (full program blank and transport blank) were measured to ensure that these items did not interfere with the determination of the samples. Through quality control techniques, such as blank value determination, parallel sample determination, spiked sample determination, and standard sample determination, the quality control rate was ensured to be no less than 30%. National standard soil samples (GBW07401, Geophysical Standard Reference Sample Soil) were used for analysis, and the deviation between the measured values and the standard values was controlled within <15% to ensure quality control.

2.3. Evaluation Methods

The planned land use for the study area is residential land (R2). Therefore, the heavy metal pollution status of the sampling sites was evaluated and referred to the R2 soil contamination risk screening and control values (Table S1) of the Soil Environmental Quality Risk Control Standard for Soil Contamination of Development Land (GB36600-2018) [9] in China.

2.3.1. Nemerow Pollution Index

The Nemerow pollution index method is a multifactor environmental quality index that takes into account extreme values. It is a comprehensive index method widely used when evaluating heavy metal pollution in soil, which reflects the impact of each element on soil quality [10,11]. The Nemerow pollution index is calculated using the following equation:
P i = C i / S i
P N = P i m a x 2 + P i a v g 2 / 2
where P i is the single pollution index, C is the soil heavy metal element content, S i is the environmental quality standard value of the heavy metal element, P N is the Nemerow comprehensive pollution index, P i m a x is the maximum value of the pollution index, and P i a v g is the average value of the pollution index.
The Nemerow comprehensive pollution index can reflect the overall pollution level of each sample point in the study area. The classification of pollution levels [12] is shown in Table 1.

2.3.2. Ecological Risk Assessment

Ecological risks were evaluated using the potential ecological risk index method proposed by Hakanson [13]. The potential ecological risk index ( R I ) reflects the impact of all kinds of pollutants on the environment and their comprehensive effect. It also quantitatively expresses the degree of potential ecological risk of heavy metal pollutants. It is calculated using the following equation [14,15]:
R I = i = 1 n E r i = i = 1 n T r i × C f i = i = 1 n T r i × C s i C n i
where R I is the potential ecological risk index, E r i is the single potential ecological risk coefficient of a heavy metal, T r i is the toxicity response coefficient of a heavy metal, C f i is the enrichment coefficient of a heavy metal, C s i is the concentration of a heavy metal in soil, and C n i is the reference value of a heavy metal (generally quoted as the background value). The corresponding T r i values of Cu, Pb, As, Ni, Cd, Hg, and Cr are 5, 5, 10, 5, 30, 40, and 2, respectively [16].
The classification of potential ecological risks is based on the toxicity response coefficients of different heavy metals. E r i only represents the potential risk of a heavy metal in a certain area. R I is related to the type and quantity of the evaluated pollutant, and the greater the R I value is, the more toxic the pollutant is [17,18]. The classifications of E r i and R I [19] are presented in Table 2.

2.3.3. Human Health Risk Model

The carcinogenic risk or hazardous level of heavy metals in soil to human health was evaluated using the soil health risk model, following the technical guidelines for risk assessment of soil contamination of land for construction (HJ25.3-2019) in China. The evaluation was mainly divided into exposure measurement calculation and health risk characterization [20]. Soil heavy metals pose non-carcinogenic and carcinogenic risks to the human body, mainly through oral ingestion, dermal contact, and inhalation of soil particles into the human body. The calculation method is described in Supplementary Material S1. The acceptable risk value for carcinogens of a single contaminant is 10−6, and the acceptable hazard quotient (HQ) for non-carcinogens of a single contaminant is 1. The carcinogenic (CR) and non-carcinogenic (HI) risk levels are shown in Table 3.

2.4. Hydrus Simulation

The migration and diffusion of four heavy metals (Cu, Pb, As, and Ni) in the soil were simulated with Hydrus-2D software. Further, the migration of the heavy metals in the natural environment was analyzed for its impact on soil contamination at the sites over a two-year period. The Hydrus solute transport model was designed to study the processes, mechanisms, and laws of migration and transformation of various organic and inorganic solutes in soil [21]. The convection–dispersion equation (CDE) is currently the basic equation for studying soil solute transport processes [22,23], and it is expressed as follows:
θ c t + ρ s t = z θ D c z q c z ϕ
where c is the solute liquid phase concentration, g·cm−3; s is the solute solid phase concentration, g·g−1; D is the dispersion coefficient, cm2·a−1; q is the soil water flux density, m·a−1; and ϕ is the source-sink term that accounts for various zero-order, first-order, and other reactions occurring in the solute, g·(m3·a)−1.
The CDEs for the transport of inert non-adsorbed solutes in both Hydrus-1D and Hydrus-2D were calculated using the following equations [24]:
Hydrus-1D:
θ C t = z θ D C z z q w C
Hydrus-2D:
θ C t = x θ D C x + z θ D C z z q w C
where C is the solute concentration, g·cm−3; q w is the water flux, cm·day−1; θ is the volumetric water content, cm3·cm−3; and D is the hydrodynamic dispersion coefficient ignoring the molecular diffusion, cm2·day−1.
(1)
Model parameters
Only the transport of soil water and solute was considered in the modeling process. In this study, the movement of water vapor in the soil was ignored, and the impact of the soil on pollution factors, such as pollutant adsorption, desorption, volatilization, biodegradation, and other physicochemical–biological reactions, was disregarded. The time and distance in the model were measured in days (d) and centimeters (cm), respectively. The simulation period lasted for 610 days, from 14 December 2020 to 16 August 2022. The time interval from T1 to T20 was set at every 30 days. The model utilized various time-step profiles and adjusted the time step based on the number of convergence iterations. The Van Genuchten–Mualem (VG) model was chosen for the soil water flow model without considering hysteresis. The parameters for Hydrus-2D are shown in Table 4.
(2)
Grid division, observation points, and boundary condition
Three sampling points (TR14, TR18, and TR27) were chosen as simulation points. The vadose zone of TR14 is characterized by a mixed layer of silt clay and miscellaneous fill, a silt layer, and a silty clay layer. The vadose zones of TR18 and TR27 consist of a mixed layer of silt clay and miscellaneous fill, as well as a silt layer. The simulation domain was set as a rectangle with a width of 300 cm and a depth of 700 cm, discretized into 1612 equidistant finite elements involving 857 nodes. The initial value of the water head in the unsaturated zone was set to −100 cm across the soil profile (i.e., the soil was in a dry state). The change in soil contamination status with excessive heavy metals was simulated within 610 d. To track the change in soil heavy metal concentration over time, the observation nodes were set in the simulation area. In order to compare the observed and simulated data (N1-N8 were 0.5, 1.0, 2.0, 3.0, 4.0, 5.0, 6.0, and 7.0 m, respectively, below the surface), the depths of the observation nodes were similar to the soil sampling depths. The initial soil heavy metal degree was set to 0, which was assumed to indicate that there was no background pollution. The meteorological inputs (precipitation and evaporation) were reflected in the model as atmospheric boundary conditions; the lower boundary condition was free drainage, and the impervious surface was set as a no-flux boundary.

3. Results and Discussion

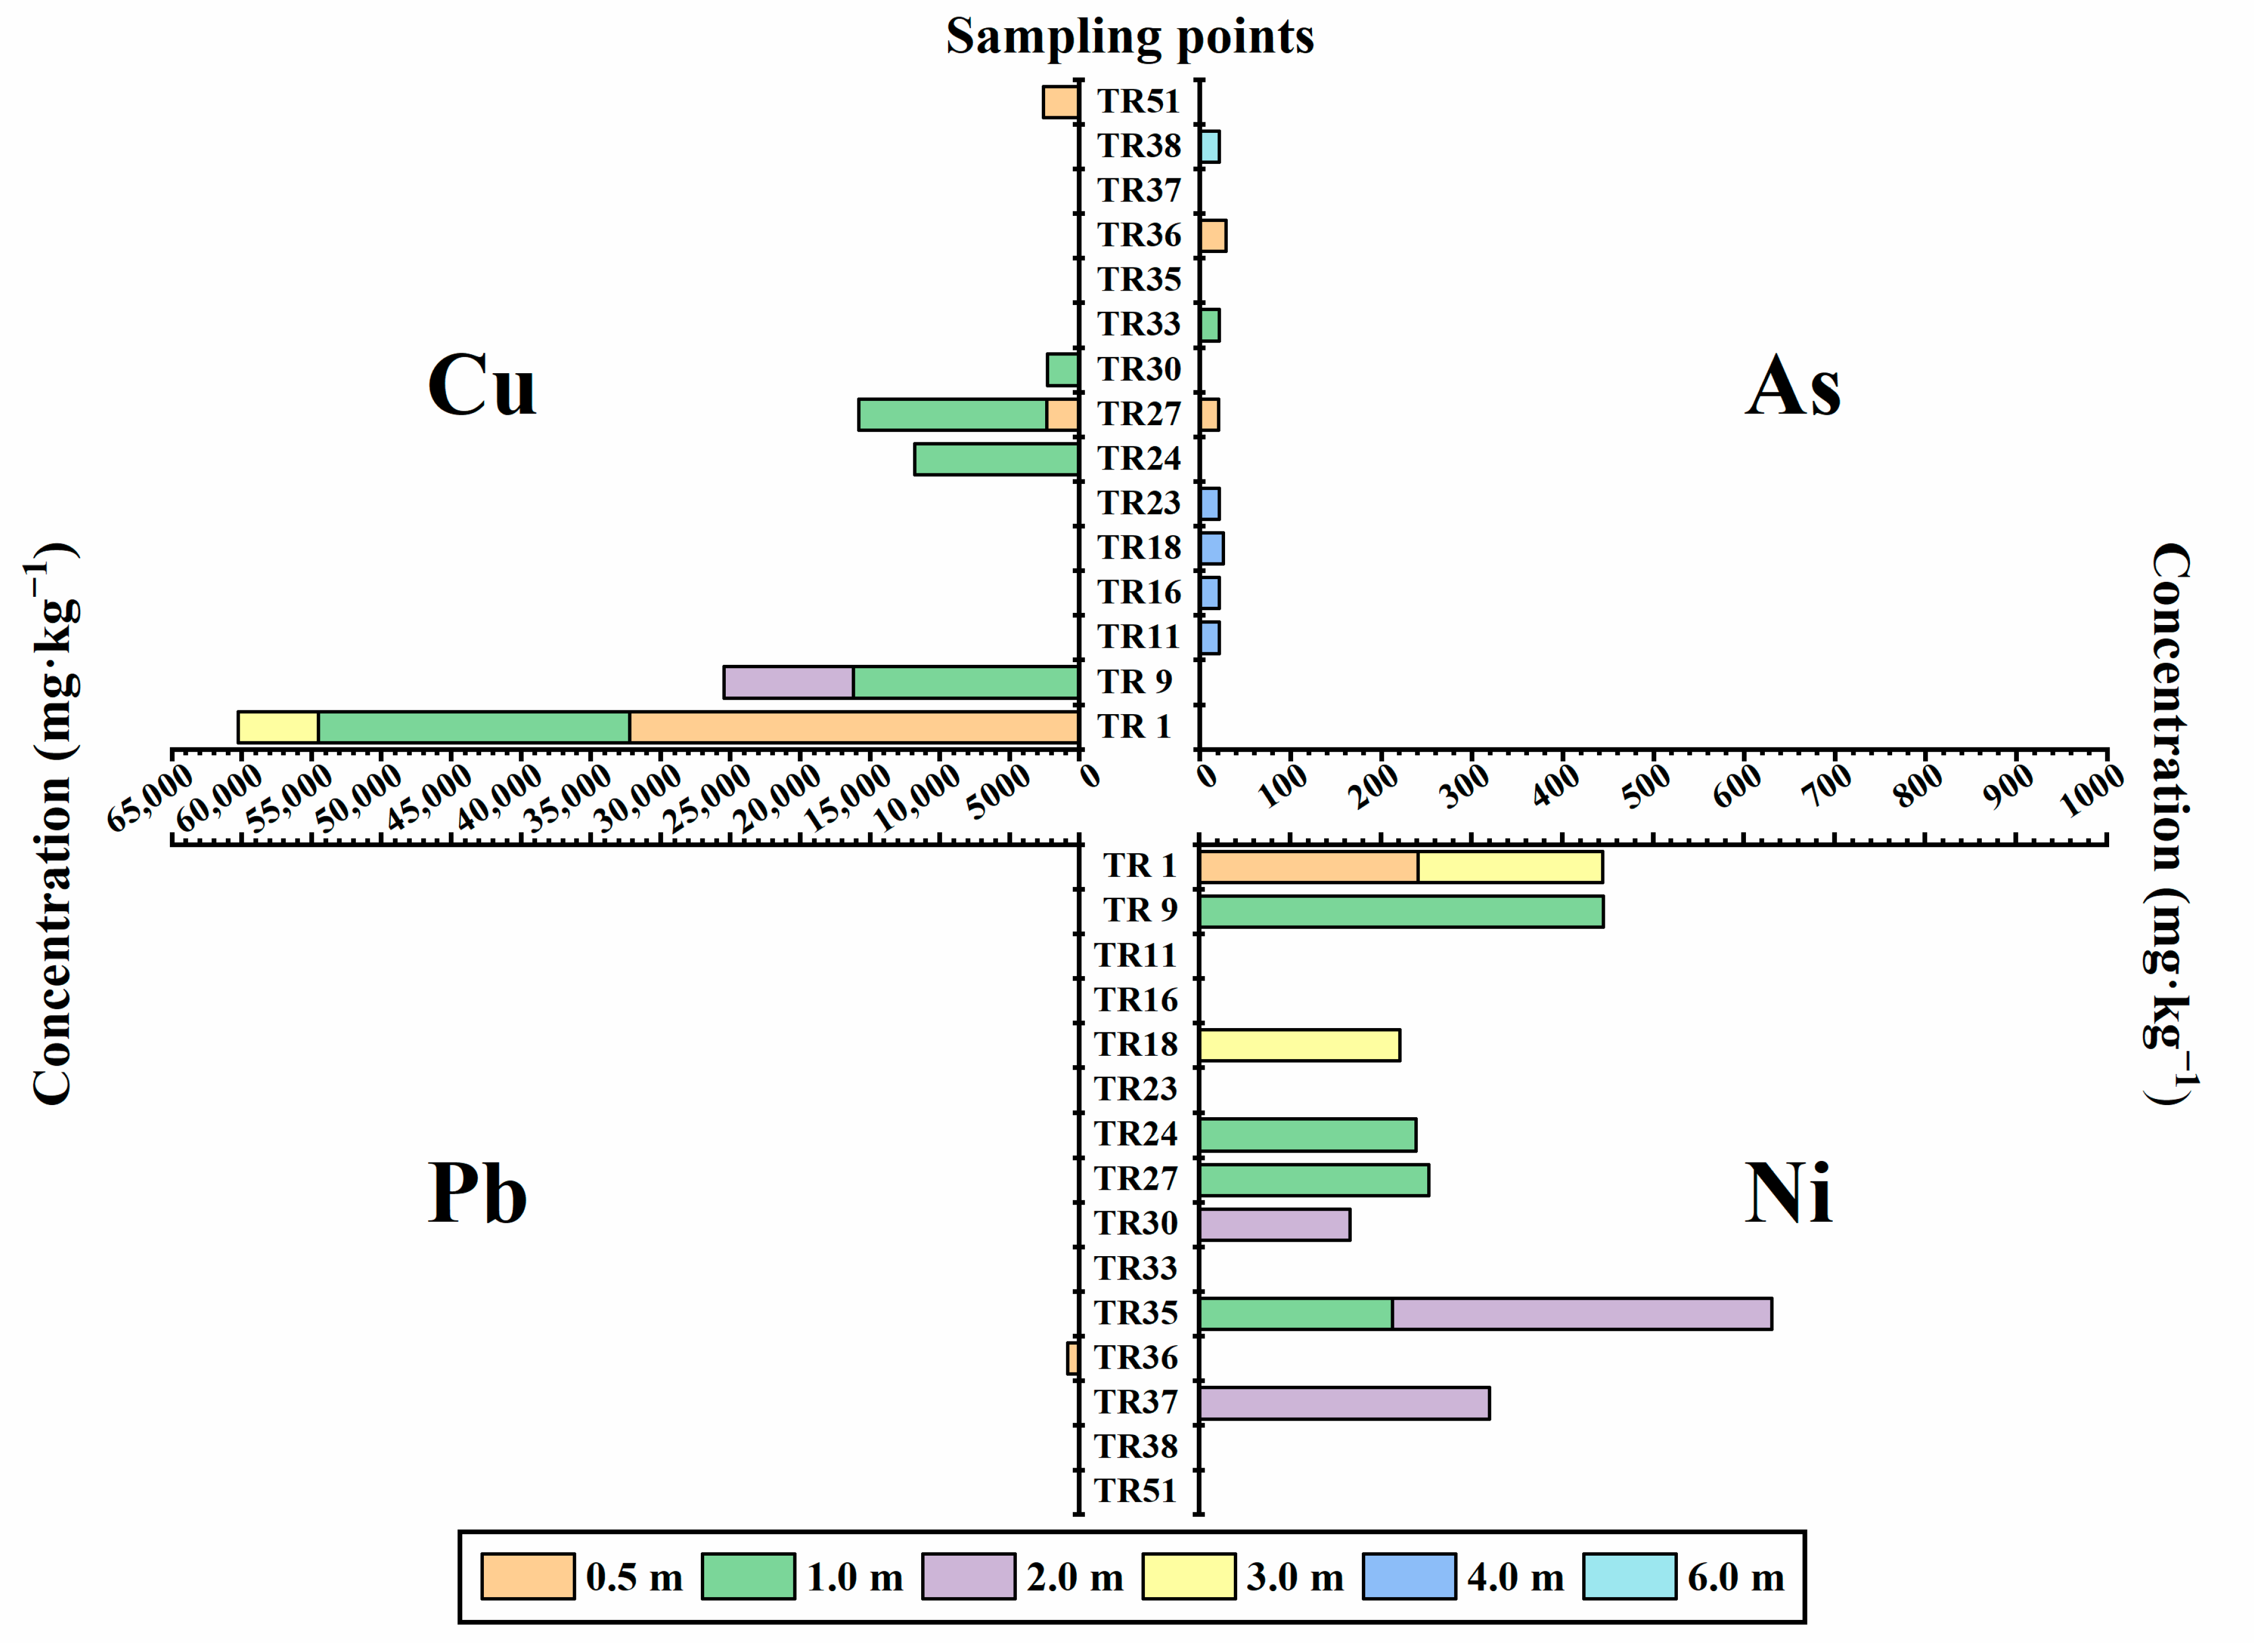
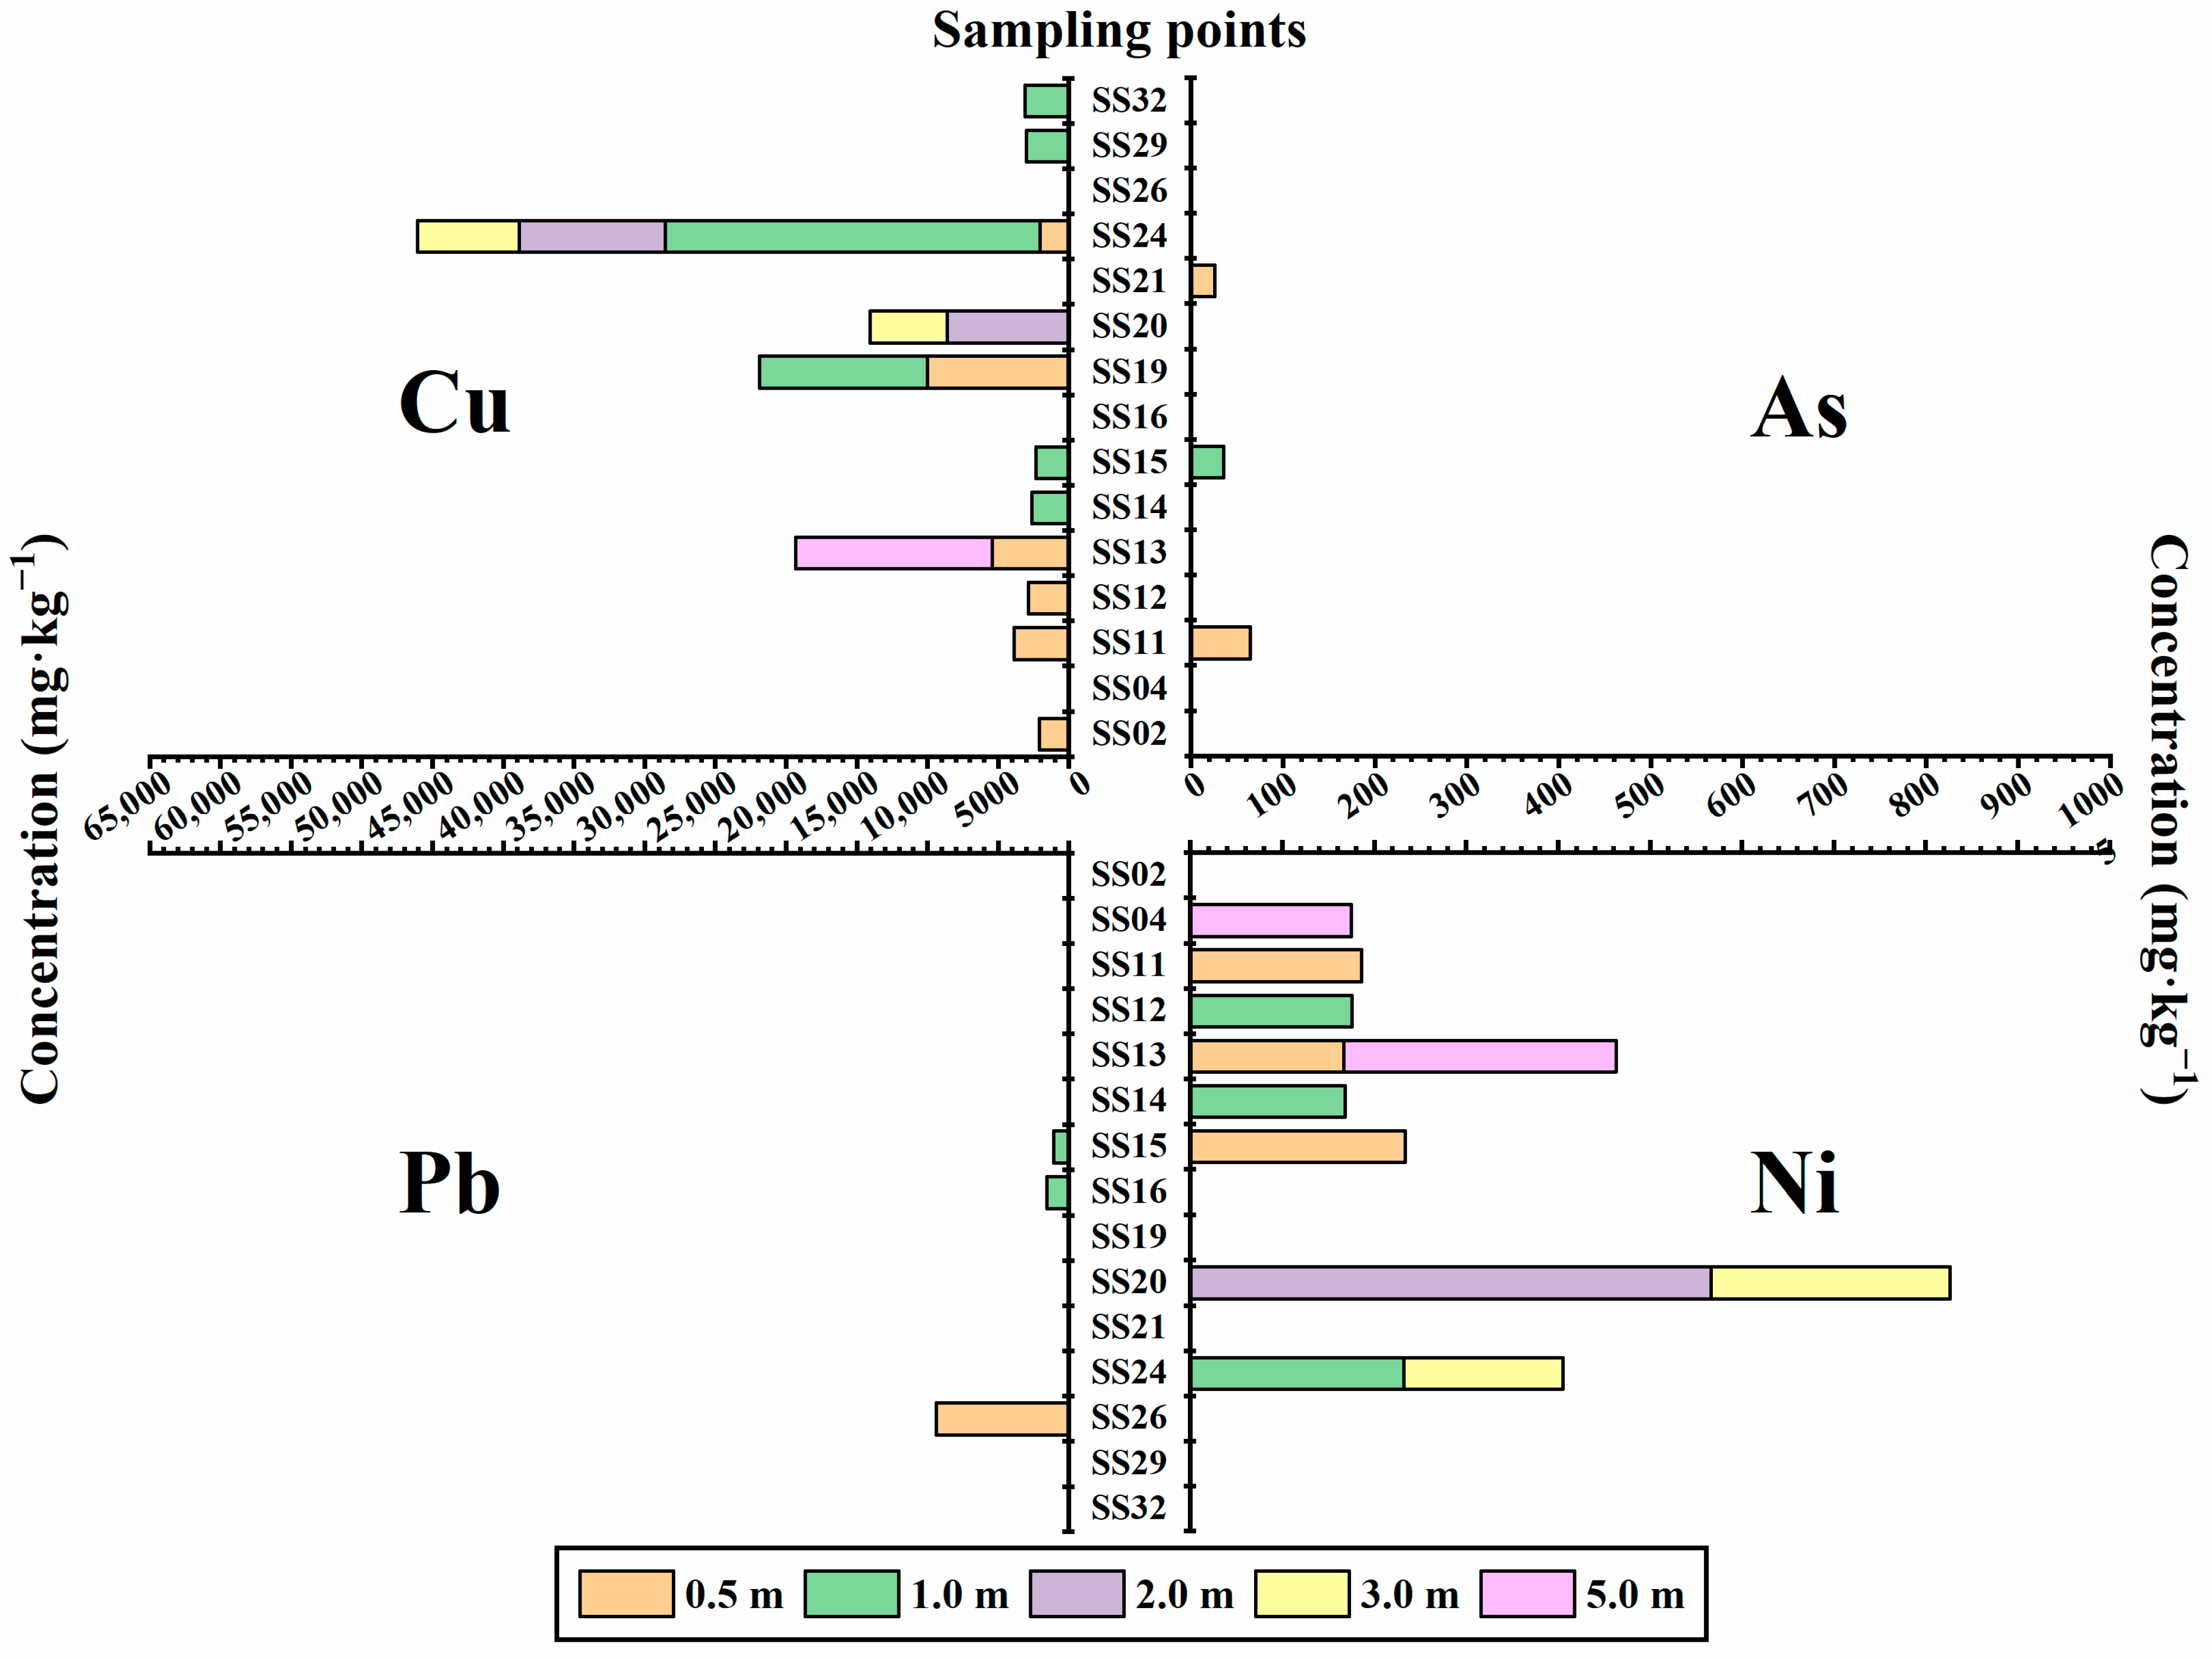
3.1. Heavy Metal Pollution Status in Soil

The statistical results of the heavy metal content in the soil of the study area are presented in Table 5. No detectable concentrations of hexavalent chromium were observed, while the detection limits for Hg and Ni reached 100%, closely resembling the local soil background values (Table 6). Thus, Cu, Pb, As, and Ni emerged as the dominant contaminants in the soil. The coefficients of variation (CVs) of the four pollutants in P1 and P2 ranged from 0.43 to 5.31 and 0.64 to 7.26, respectively. Cu, Pb, and Ni demonstrated higher variability, with their CVs exceeding the threshold of 1. The concentration distribution exhibited significant spatial heterogeneity, indicating that anthropogenic inputs were likely the major source of contamination [27].
The risk control value of soil environmental quality in China (the first category of land in the GB36600-2018 standard) was used as the reference value to evaluate whether the four pollutants exceeded the standard (Table S1). Figure 4 and Figure 5 reveal that the exceedance rate and pollution depth of the four pollutants in P1 and P2 were different. In P1, the exceedance rate was As (25.0%) = Ni (25.0%) > Cu (18.75%) > Pb (3.125%), while in P2, it was Cu (34.375%) > Ni (25.0%) > As (9.375%) = Pb (9.375%). The pollution depth of Cu, Pb, As, and Ni in the soil in the study area was mainly concentrated within 1.0 m from the ground. Moreover, in the vertical direction, most of the heavy metal concentrations at the exceedance points were discontinuous. There are obvious differences between P1 and P2 in the exceedance rate and pollution depth. These results indicate that wastewater discharge and surface seepage in the production phase of enterprises are not the only causes of soil heavy metal pollution in the study area. The soil in the study area may be filled with production waste.
The heavy metal content was analyzed through the application of the inverse distance weighted interpolation method. The spatial distribution of Cu, Pb, As, and Ni in soil is shown in Figure 6. Within the vertical range of 0–5.0 m, Cu contamination was predominantly observed in the maintenance workshop, drainage ditch, and raw material warehouse. Locations adjacent to the drainage ditch exhibited the highest level of contamination. Different from P1, in P2, the continuous Cu contamination area between 1.0 and 2.0 m in soil was mainly distributed around the electrolytic workshop and product warehouse. In P1, Pb only had one exceedance point on the east side of the smelting plant, and the pollution depth was 0.5–1.0 m. In P2, continuous Pb pollution was mainly distributed in the dormitory area and the northwest of the research area, and the pollution depth was 0.5–1.0 m. At the east side of the smelting plant, the pollution depth was 1.0–2.0 m. Across the entire research area, no pollution exceedance points existed at depths greater than 2.0 m. The As exceedance points in P1 were relatively dispersed; in P2, the continuous pollution was mainly distributed around the raw material warehouse, and the pollution depth was 0.5–1.0 m. In P1, Ni contamination exceeded the regulatory limits at only one location within a depth of 0–0.5 m, while continuous pollution patterns were observed near the raw material warehouse and drainage ditch across the 1.0–2.0 m depth range. In P2, Ni exceeding the standard at a depth of 0–5.0 m was relatively dispersed, mainly being distributed in the vicinity of the raw material warehouse, drainage ditch, and electrolytic workshop. In general, Cu, Pb, As, and Ni in the study area exhibited both relatively concentrated pollution areas and many dispersed exceedance points. The raw material warehouse, melting workshop, finished product warehouse, and electrolysis workshop all had cement-hardened floors without special anti-seepage measures. The ditch had a brick-concrete structure and no anti-seepage measures. In these areas, pollutants can easily penetrate into the ground once leaked, resulting in soil pollution. Dispersed exceedance points may result from the improper disposal of waste residues through landfill operations.
The stratigraphic profile of the study area (Figure 7) shows that miscellaneous fill occupies the subsurface layer at depths of 0–2.0 m. To investigate whether heavy metals were present in the miscellaneous fill, black waste residue samples were collected and analyzed. The geotechnical samples TK1 and TK2 were obtained during hydrogeological drilling operations conducted in P2. Black waste residues were found at sampling points SS15 and SS21. The structure and composition of the waste residues were characterized using scanning electron microscopy (SEM). As shown in Figure 8, the waste residues collected from the two sites displayed irregular granular shapes, rough surfaces, and messy porous structures. SEM mapping analysis revealed the presence of Cu, Pb, and Ni in the two waste residues. Energy-dispersive spectrometer (EDS) results indicated that the average contents (wt.%) of the three elements in the waste residues were 0.86%, 0.38%, and 0.01%, respectively (Table S3, Figures S1 and S2). These results indicate the presence of waste landfill within the study area. In this study, heavy metals in soil were detected in full quantity. The landfill of waste residues in the study area was relatively scattered, leading to both isolated points of heavy metal pollution and discontinuous variations in heavy metal concentrations at different depths. These observations highlight the complex nature of subsurface pollutant distribution.

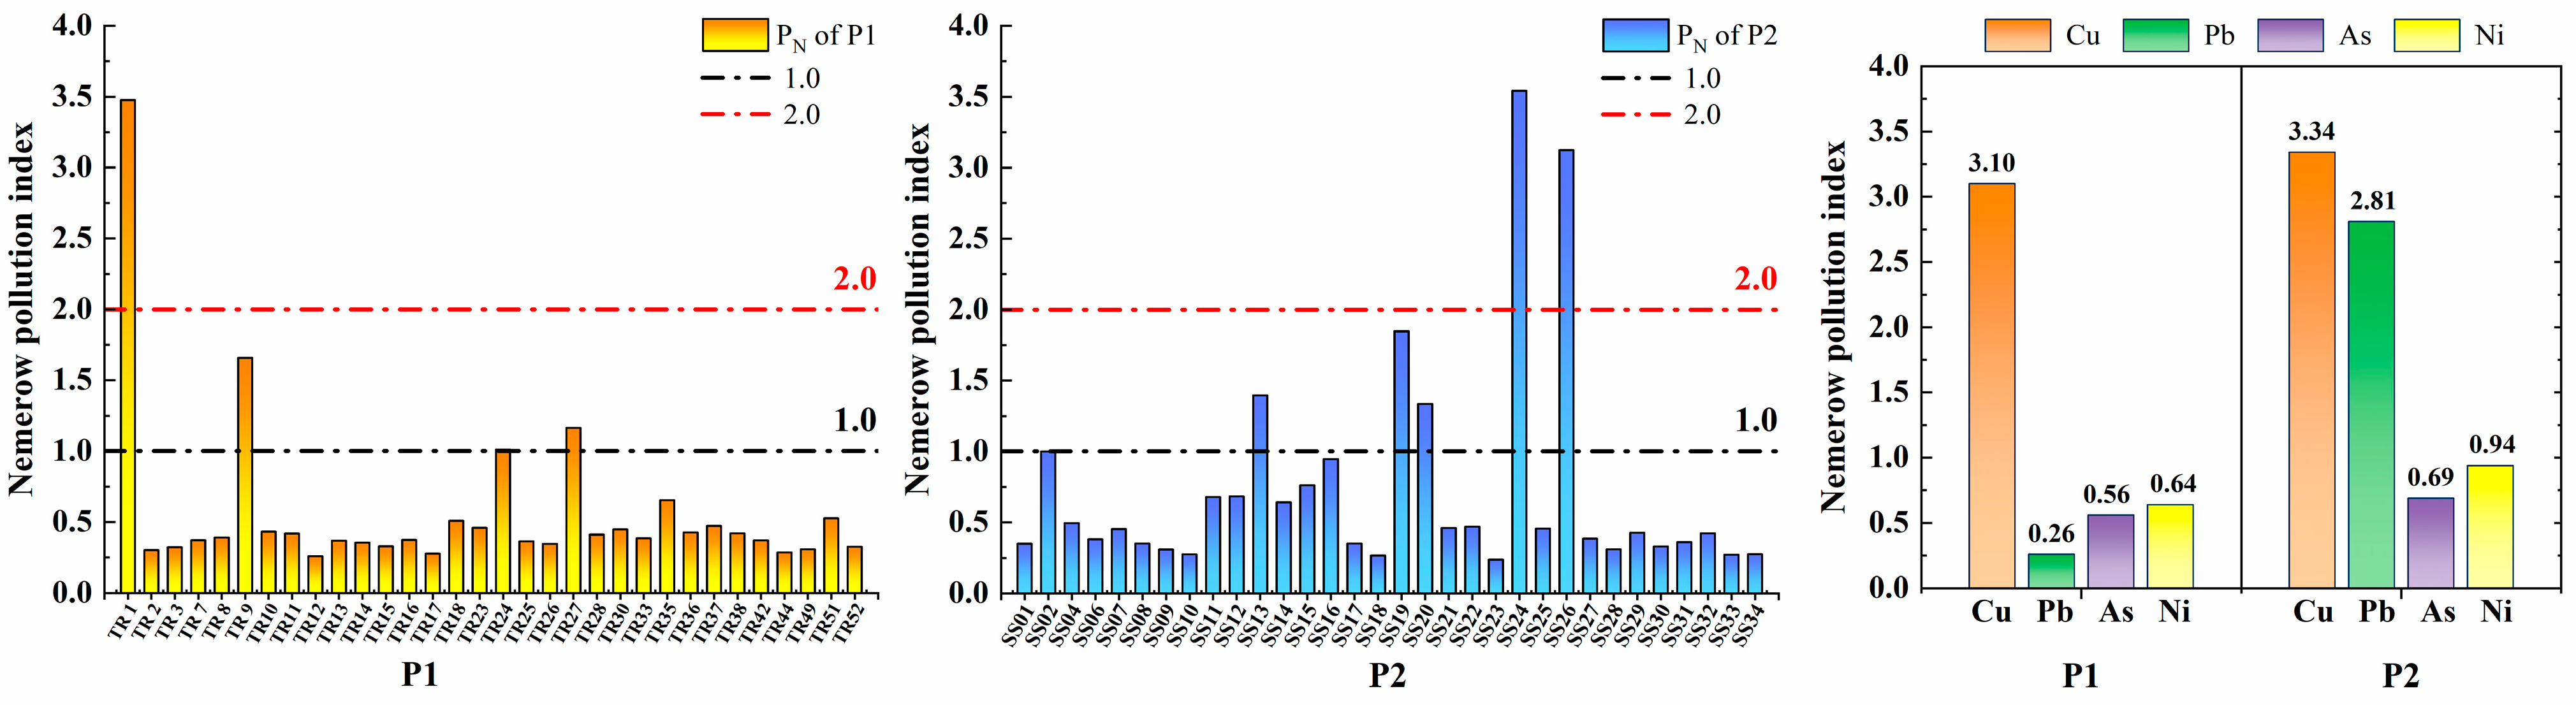
3.2. Soil Environmental Quality Assessment

To comprehensively assess the pollution level of the study area, the P N values of each point and four heavy metals were calculated using the Nemerow pollution index method, and the results are shown in Figure 9. Two batches of samples from December 2020 and August 2022 revealed heavily contaminated sites within the study area. In P1, contamination points were identified around the drainage ditch (TR1, TR9, TR24, TR27), while other areas remained clean or still clean. In P2, there were pollution points (SS13, SS19, SS20, SS24, SS26) around the drainage ditch and dormitory, with other regions remaining unaffected. Notably, the Nemerow pollution index values of SS24 and SS26 were greater than 3, which indicated heavy pollution. For SS13, SS19, and SS20, the P N values were between 1 and 2, indicating low pollution. Based on the comprehensive evaluation results of the pollutants, the Nemerow pollution index of Cu in P1 was 3.10, indicating heavy pollution. The Nemerow pollution index values of Pb, As, and Ni were 0.259, 0.556, and 0.637, indicating a clean state. In P2, the Nemerow pollution index of Cu was 3.34, indicating heavy pollution. The Nemerow pollution index of Pb was 2.81, indicating moderate pollution. The Nemerow pollution index values for Ni and As were 0.94 and 0.69, respectively, which were still clean and clean states.

3.3. Risk Assessment

In order to assess the ecological risk status of heavy metal pollution in the soil of the study area, the Hakanson potential ecological risk index method was employed to calculate the E r i and R I values of the four pollutants, and the results are shown in Table 6. Between P1 and P2, there was little difference between the individual ecological risk and the comprehensive ecological risk of the four heavy metals. From the results of the single ecological risk assessment, the E r i values of Cu were between 80 and 160, and the ecological risk was low pollution. The E r i values of Pb, As, and Ni were all below 40, and the ecological risk was pollution-free. According to the results of the comprehensive ecological risk assessment, the R I value for P1 ranged from 16.83 to 1550.82, with an average value of 125.09, indicating that the ecological risk was slight pollution. The R I value for P2 ranged from 20.78 to 1662.76, with an average of 177.80, and the ecological risk was moderate pollution.
The carcinogenic (CRn) and non-carcinogenic (HIn) risks of the four heavy metals under different exposure pathways were calculated using a human health risk assessment model, and the evaluation results are shown in Table 7. In both P1 and P2, As and Ni showed carcinogenic risk (CRn > 1 × 10⁻⁶). The difference is that the carcinogenic risk levels of As were different: P1 was in the acceptable range, and the CRn of As in P2 was greater than 10−4, which is beyond the tolerance level of the human body. According to the results of the non-carcinogenic risk assessment, Cu, Pb, and As in P1 and P2 all had non-carcinogenic risks (HIn > 1). However, the degree of non-carcinogenic risk varied between the two batch samples: in P1, Cu > Pb > As, while in P2, Pb > As > Cu.

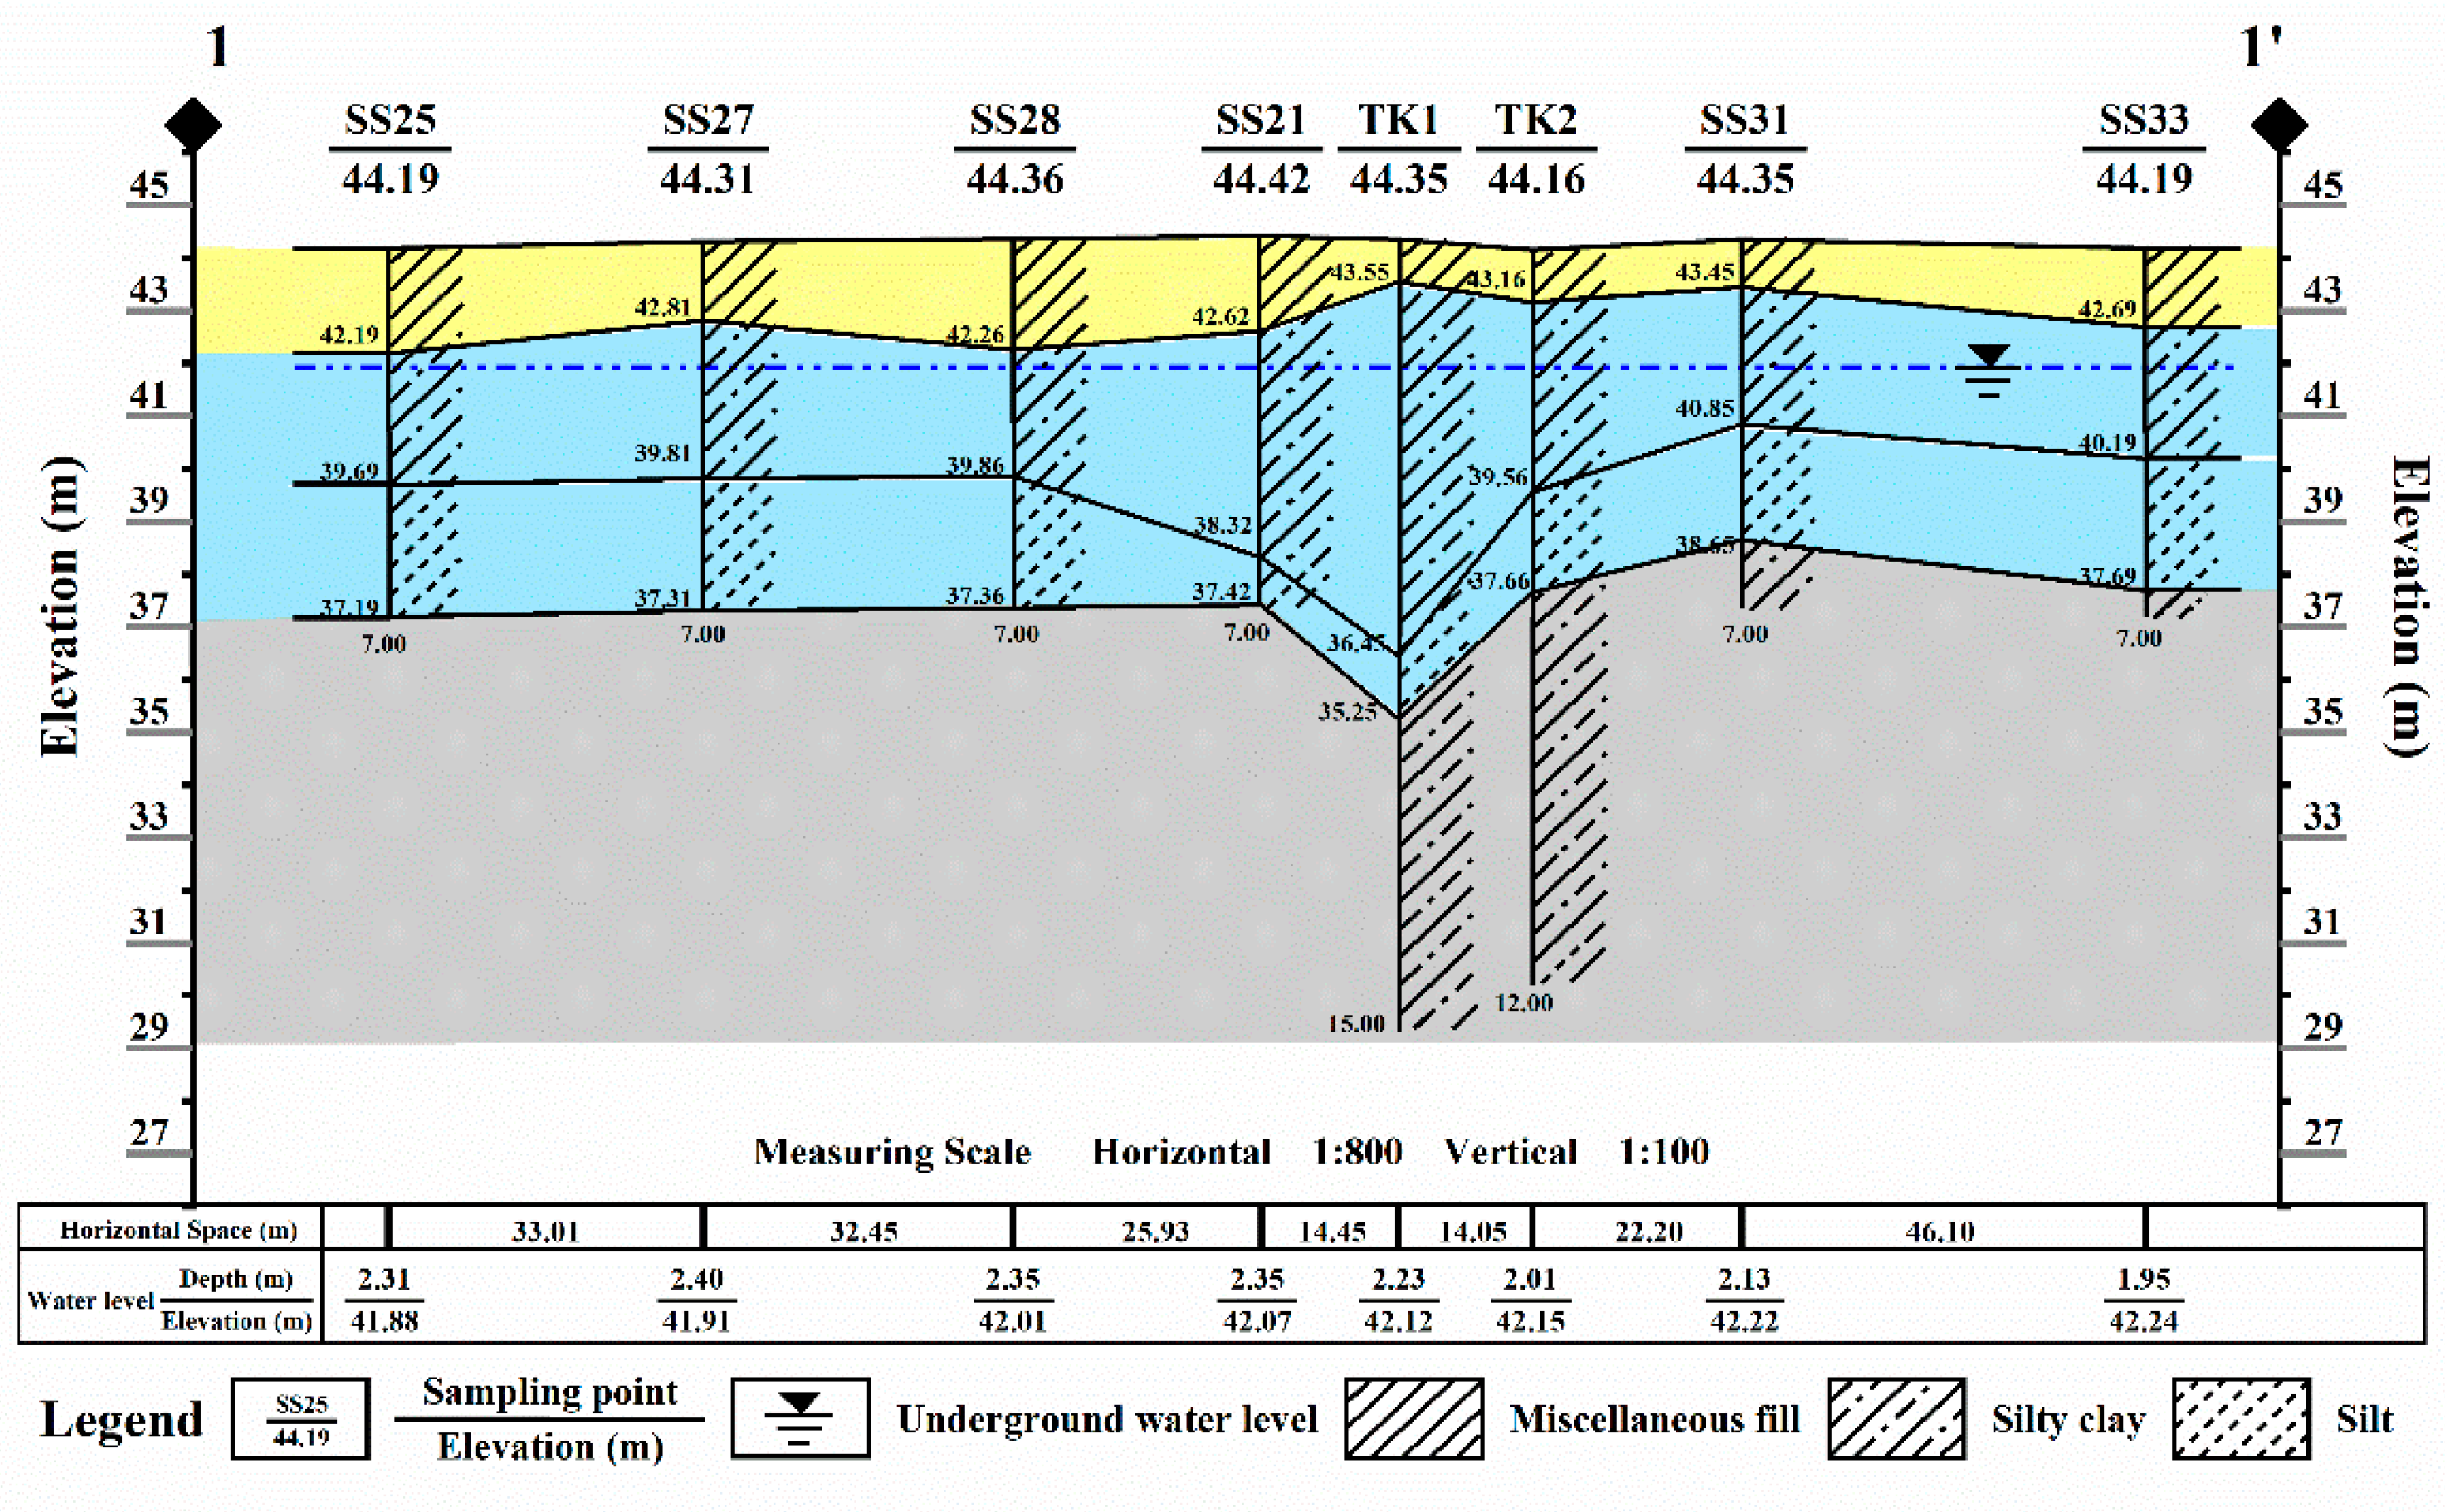
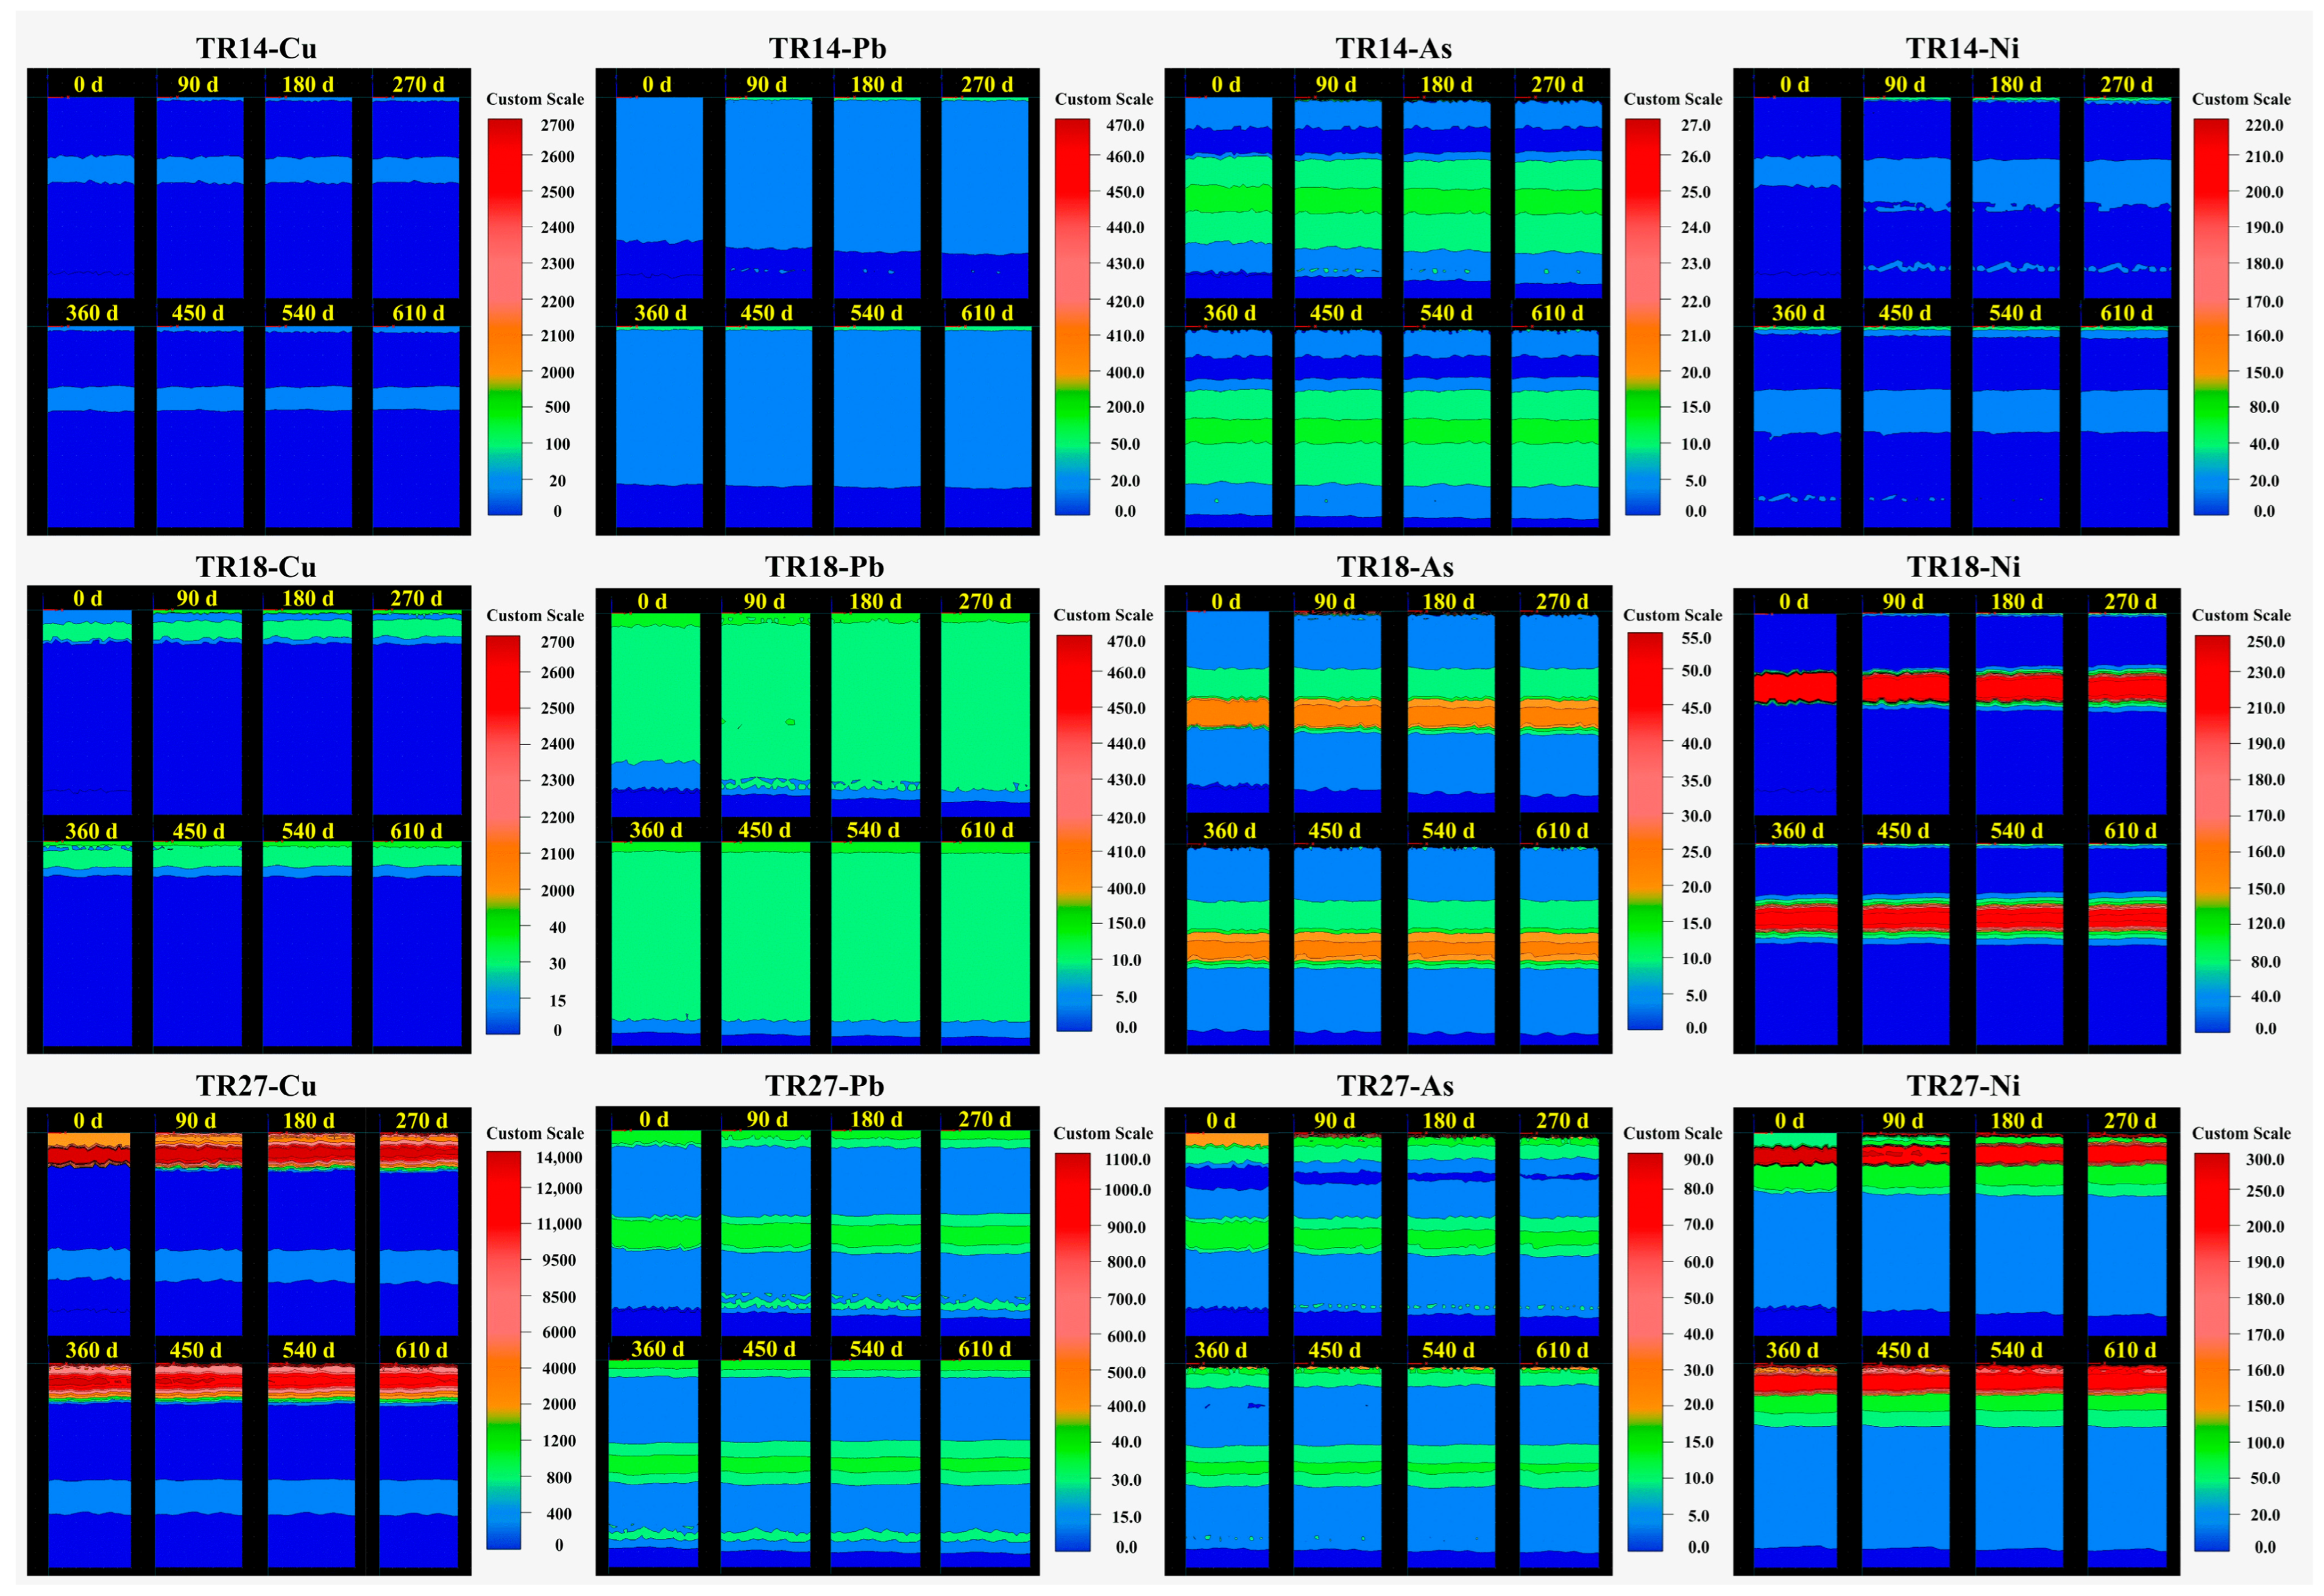
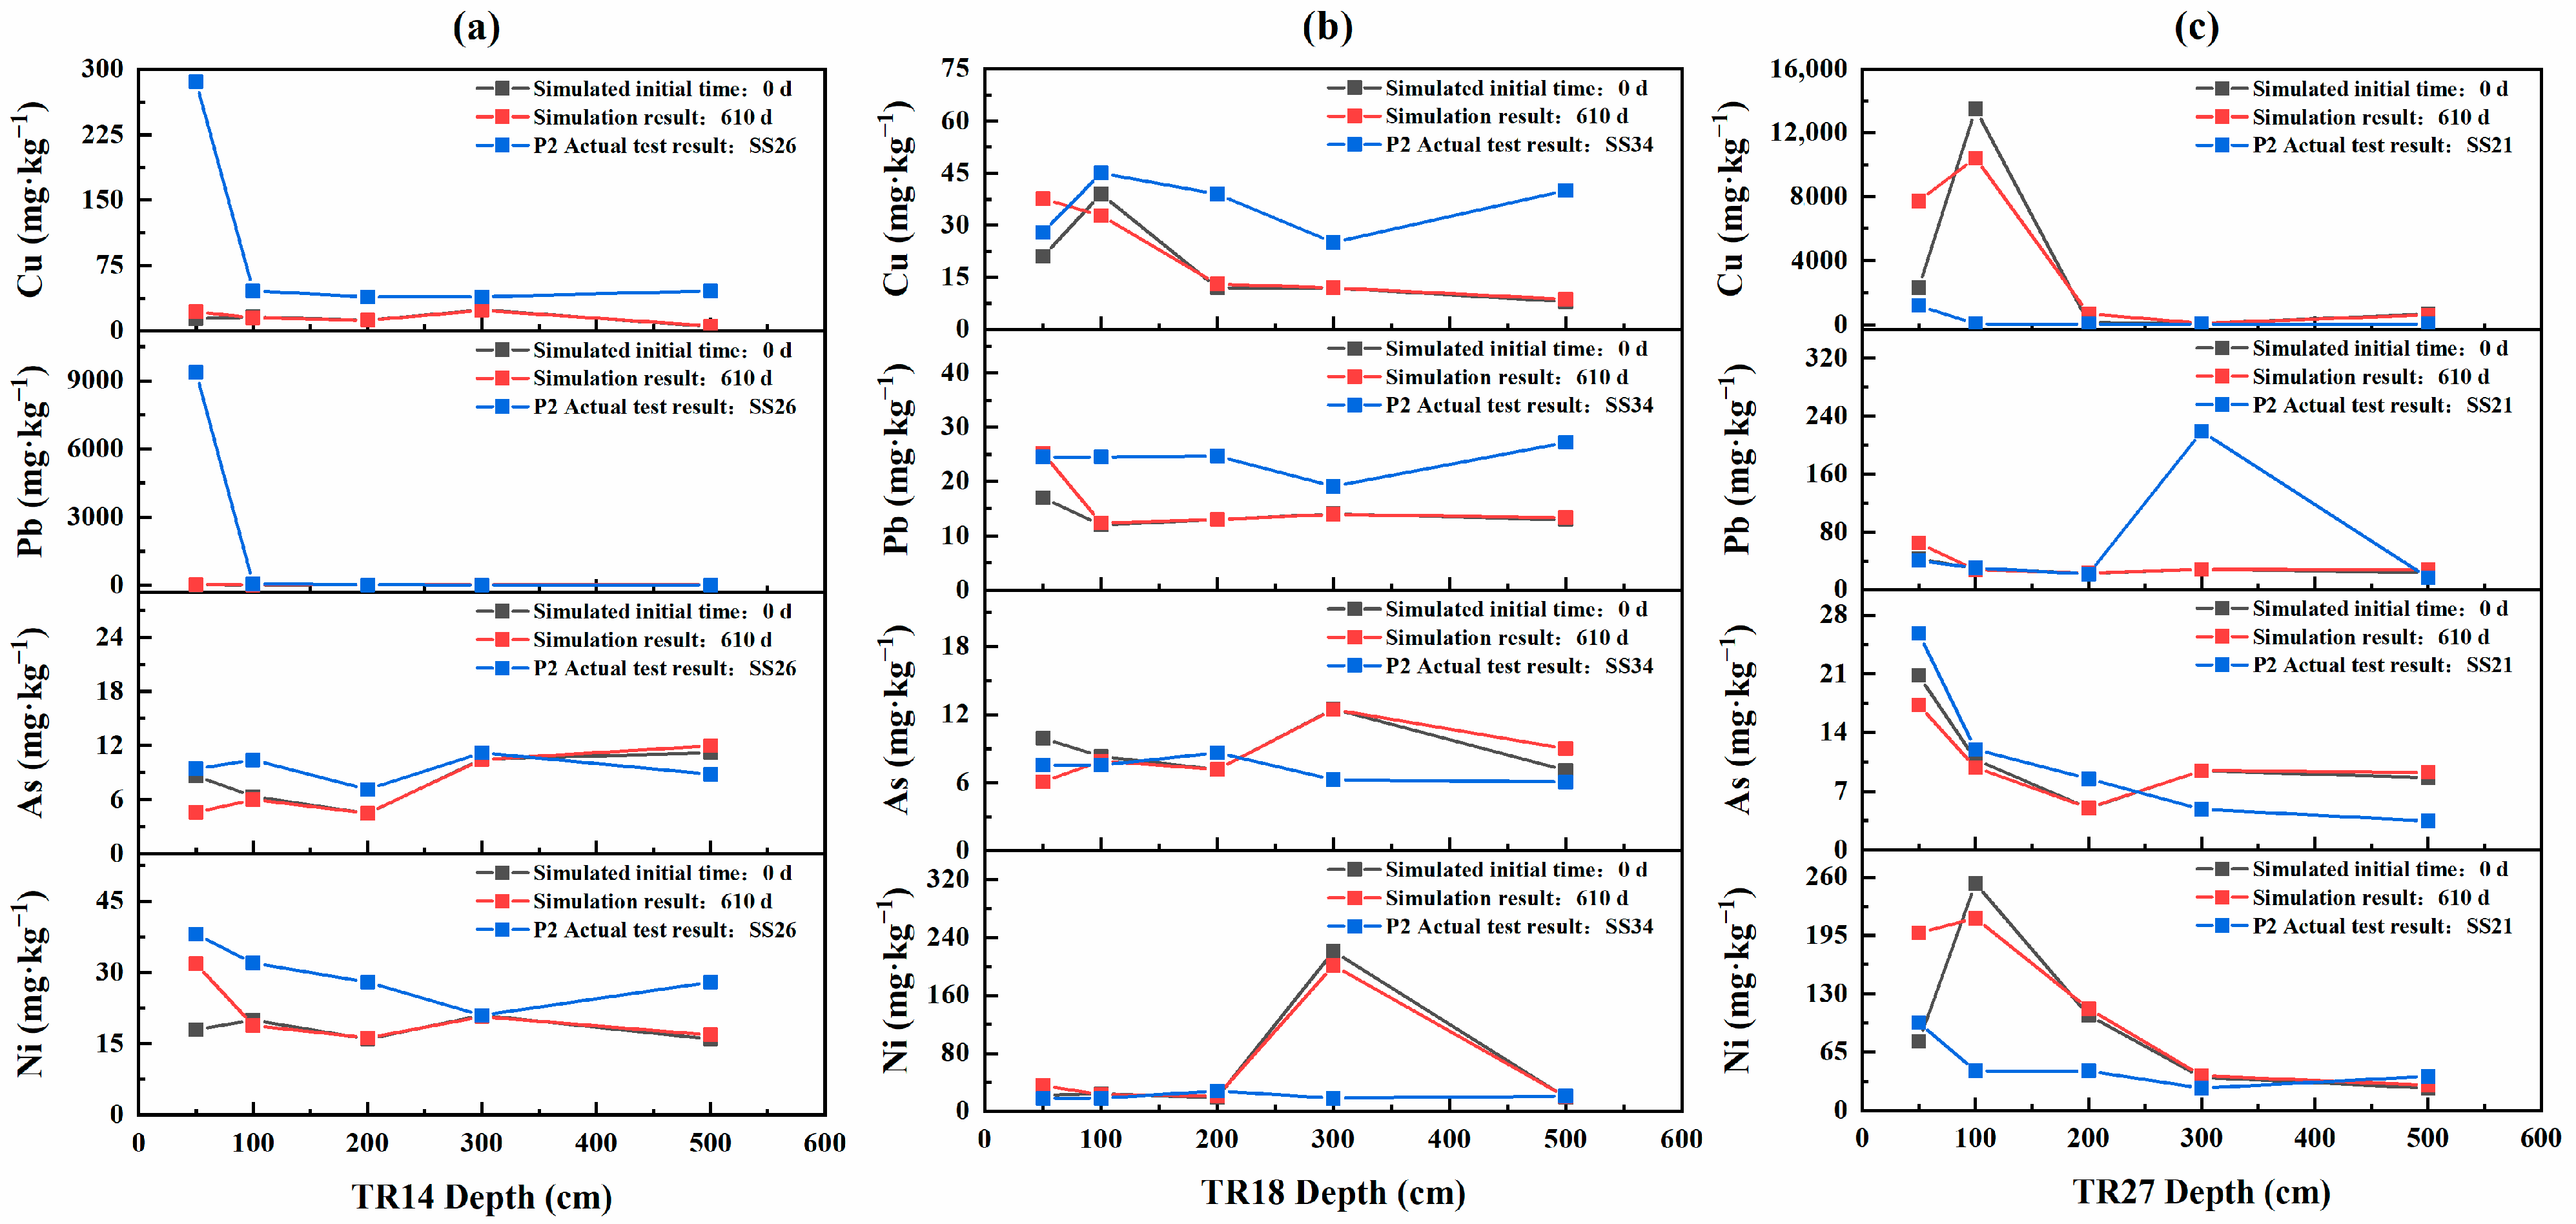
3.4. Migration of Heavy Metals in Soil

The sampling results of the two batches in December 2020 and August 2022 showed differences in the distribution and depth of pollution. Industrial wastewater discharge and raw material leakage are the main factors leading to soil pollution. However, this is not the main reason for the differences between P1 and P2. On the one hand, this difference can be attributed to the existence of landfill waste in the study area. The types and contents of heavy metals in the waste residues were heterogeneous. The dissolution and diffusion of heavy metals in the waste residues led to different distributions and depths of the contaminated areas. On the other hand, the migration of pollutants under the action of rainfall infiltration is also a factor that is not negligible. In addition, the migration process may also be affected by many factors such as soil texture, topography, rainfall, and rainfall intensity, increasing the complexity and uncertainty of pollution. To examine the influence of migration and analyze the risk of pollution diffusion, TR14, TR18, and TR27 were chosen to simulate the migration and diffusion of Cu, Pb, As, and Ni in soil using Hydrus-2D software. The simulation lasted for 610 days. The simulation adopted the worst-case assumption and ignored the adsorption and transformation processes of heavy metals in soil. The permeability of the soil in the study area was limited by its high content of silty clay and silt. Therefore, the migration of heavy metals was very slow, even when disregarding the adsorption and transformation processes in the soil [28,29]. Figure 10 illustrates that the concentration distribution of the four heavy metals at the three simulated points did not change significantly over a 610-day period. To verify the accuracy of the simulation, the simulation results were compared with the results of P2. The results showed that, after 610d, the vertical distribution characteristics of the heavy metals in the soil at the three simulated points were basically consistent with P2 (Figure 11 and Table S4). These results indicate that the heavy metals in the soil of the study area migrated very slowly under the action of rainfall infiltration, which was not the main reason for the difference between P1 and P2.
Hydrus-2D simulated the migration of the dissolved heavy metal ions through the soil. The simulation results indicate that the heavy metals migrated slowly in the soil within the study area, suggesting a relatively low risk of pollution diffusion. The main areas where dissolved heavy metals were concentrated included the drainage ditch, the electrolysis workshop, and the raw material warehouse, which were more seriously polluted and experienced continuous heavy metal contamination. Therefore, it is reasonable to speculate that the soil pollution in these areas was mainly caused by wastewater discharge and raw material leakage in the production stage. There was not much spreading of pollution after the plant stopped production. The landfill waste has resulted in the emergence of dispersed exceedance points, where pollutant concentrations are non-continuous vertically. Parts of the heavy metal ions in the waste residues dissolved and were released under the action of precipitation leaching [30]. They can also chelate with microorganisms (e.g., proteobacteria, actinomycetes, and acidobacteria [31]) and organic matter (e.g., fulvic acid/humic acid, organic acids, and particulate organic matter (POM) [32,33]) in soil, resulting in the transformation of some bound heavy metals into free states and increasing their migration in soil [34,35]. Additionally, during soil drying, the capillary force of pore water can cause the deformation of porous media (such as rupture, contraction, parallel, etc.), which leads to the crushing of waste slag and produces a large number of fine particles [36,37]. During leaching, these fine particles can be captured by the surface of the soil medium under the action of the gas–liquid interface and disperse with the movement of the gas–liquid interface [38]. The release of heavy metals from landfills is a long-term process. However, whether dissolved, free, or with the migration of fine particles, the diffusion of heavy metals in soil can be accelerated under the action of rainfall infiltration and surface runoff, resulting in soil pollution at different depths. Although the geological conditions of the study area are not conducive to the migration and diffusion of heavy metals, in the long run, there is still a risk of pollution diffusion in the underground environment.

4. Conclusions

The pollution characteristics and environmental risks of Cu, Pb, As, and Ni in the soil of a shut-down electroplating plant were studied from the perspectives of time and space. Two batch samples were tested in December 2020 (P1) and August 2022 (P2), obtained from different sampling positions and depths. The results show that Cu, Pb, As, and Ni all exceeded the screening values of Class I land use in the GB36600-2018 standard. The spatial distribution characteristics of the four pollutants in the soil were similar between P1 and P2. The pollution depths were primarily concentrated within 1.0 m from the surface. In terms of horizontal distribution, the four kinds of pollutants showed some relatively concentrated pollution areas and numerous dispersed pollution points. SEM mapping and EDS analyses revealed that the dispersed pollution sites were predominantly attributed to the landfilling of production waste. In P1, the pollution points were mainly concentrated around the drainage ditch, with Cu exhibiting heavy pollution. In P2, the pollution points primarily converged around the drainage ditch and dormitory area, with Cu exhibiting heavy pollution and Pb exhibiting moderate pollution. In both P1 and P2, As and Ni had carcinogenic risks, and Cu, Pb, and As had non-carcinogenic risks. However, the comprehensive ecological risk assessment revealed that P1 exhibited slight pollution, whereas P2 showed more widespread and moderate pollution levels. The Hydrus-2D simulation results indicated that the migration of heavy metals in the soil of the study area was relatively slow under rainfall infiltration conditions, which was not the primary cause of the discrepancy between the two batches of sampling results. Wastewater discharges and leakage of raw materials during the production phase were identified as the primary culprits for soil pollution in key areas of the study area.

Supplementary Materials

The following supporting information can be downloaded at: https://www.mdpi.com/article/10.3390/su17072931/s1, Table S1: Soil pollution risk screening values and control values for construction land in China; Table S2: Corresponding reference dose (RfD) and slope factor (SF) values of soil heavy metals by different exposure pathways; Table S3: Spectrum analysis for different samples; Table S4: Total Cu, Pb, As, and Ni concentrations in soil layers of study area; Figure S1: EDS analysis of SS15; Figure S2: EDS analysis of SS21 [39,40,41,42].

Author Contributions

Conceptualization, Y.W. and H.L.; methodology, Y.W. and K.H.; data curation, Y.W. and J.Z.; writing—original draft, Y.W.; writing—review and editing, T.D., R.X. and H.L.; validation, R.X., H.L. and Y.L.; supervision, Y.L. All authors have read and agreed to the published version of the manuscript.

Funding

This work was financially supported by the National Key Research and Development Program of China (No. 2023YFC3705902) and the National Natural Science Foundation of China (No. 42407129).

Institutional Review Board Statement

Not applicable.

Informed Consent Statement

Not applicable.

Data Availability Statement

The original contributions presented in this study are included in the article and Supplementary Materials.

Conflicts of Interest

Ruiyang Xu was employed by Tianjin Geological Engineering Survey and Design Institute Co., Ltd. The remaining authors declare that the research was conducted in the absence of any commercial or financial relationships that could be construed as a potential conflict of interest.

References

  1. Gan, T.; Zhao, H.; Ai, Y.; Zhang, S.; Wen, Y.; Tian, L.; Mipam, T.D. Spatial Distribution and Ecological Risk Assessment of Heavy Metals in Alpine Grasslands of the Zoige Basin, China. Front. Ecol. Evol. 2023, 11, 1093823. [Google Scholar] [CrossRef]
  2. Zhou, H.; Chen, Y.; Yue, X.; Ren, D.; Liu, Y.; Yang, K. Identification and Hazard Analysis of Heavy Metal Sources in Agricultural Soils in Ancient Mining Areas: A Quantitative Method Based on the Receptor Model and Risk Assessment. J. Hazard. Mater. 2023, 445, 130528. [Google Scholar] [CrossRef] [PubMed]
  3. Wu, Y.; Li, X.; Yu, L.; Wang, T.; Wang, J.; Liu, T. Review of Soil Heavy Metal Pollution in China: Spatial Distribution, Primary Sources, and Remediation Alternatives. Resour. Conserv. Recycl. 2022, 181, 106261. [Google Scholar] [CrossRef]
  4. Guan, Y.; Chu, C.; Shao, C.; Ju, M.; Dai, E. Study of Integrated Risk Regionalisation Method for Soil Contamination in Industrial and Mining Area. Ecol. Indic. 2017, 83, 260–270. [Google Scholar] [CrossRef]
  5. Theocharopoulos, S.P.; Wagner, G.; Sprengart, J.; Mohr, M.-E.; Desaules, A.; Muntau, H.; Christou, M.; Quevauviller, P. European Soil Sampling Guidelines for Soil Pollution Studies. Sci. Total Environ. 2001, 264, 51–62. [Google Scholar] [CrossRef]
  6. Rocco, C.; Duro, I.; Di Rosa, S.; Fagnano, M.; Fiorentino, N.; Vetromile, A.; Adamo, P. Composite vs. Discrete Soil Sampling in Assessing Soil Pollution of Agricultural Sites Affected by Solid Waste Disposal. J. Geochem. Explor. 2016, 170, 30–38. [Google Scholar] [CrossRef]
  7. Qiao, P.; Dong, N.; Lei, M.; Yang, S.; Gou, Y. An Effective Method for Determining the Optimal Sampling Scale Based on the Purposes of Soil Pollution Investigations and the Factors Influencing the Pollutants. J. Hazard. Mater. 2021, 418, 126296. [Google Scholar] [CrossRef]
  8. Wang, M.; Han, Q.; Gui, C.; Cao, J.; Liu, Y.; He, X.; He, Y. Differences in the Risk Assessment of Soil Heavy Metals between Newly Built and Original Parks in Jiaozuo, Henan Province, China. Sci. Total Environ. 2019, 676, 1–10. [Google Scholar] [CrossRef]
  9. GB36600-2018; Soil Environmental Quality Risk Control Standard for Soil Contamination of Development Lland. Ministry of Ecology and Environment of the People’s Republic of China: Beijing, China, 2018.
  10. Chai, L.; Wang, Y.; Wang, X.; Ma, L.; Cheng, Z.; Su, L. Pollution Characteristics, Spatial Distributions, and Source Apportionment of Heavy Metals in Cultivated Soil in Lanzhou, China. Ecol. Indic. 2021, 125, 107507. [Google Scholar] [CrossRef]
  11. Fu, K.; An, M.; Song, Y.; Fu, G.; Ruan, W.; Wu, D.; Li, X.; Yuan, K.; Wan, X.; Chen, Z.; et al. Soil Heavy Metals in Tropical Coastal Interface of Eastern Hainan Island in China: Distribution, Sources and Ecological Risks. Ecol. Indic. 2023, 154, 110659. [Google Scholar] [CrossRef]
  12. Chen, W.; Zhu, K.; Cai, Y.; Wang, Y.; Liu, Y. Distribution and Ecological Risk Assessment of Arsenic and Some Trace Elements in Soil of Different Land Use Types, Tianba Town, China. Environ. Technol. Innov. 2021, 24, 102041. [Google Scholar] [CrossRef]
  13. Hakanson, L. An Ecological Risk Index for Aquatic Pollution Control.a Sedimentological Approach. Water Res. 1980, 14, 975–1001. [Google Scholar] [CrossRef]
  14. Sheng, Y.; Wang, Z.; Feng, X. Potential Ecological Risk and Zoning Control Strategies for Heavy Metals in Soils Surrounding Core Water Sources: A Case Study from Danjiangkou Reservoir, China. Ecotoxicol. Environ. Saf. 2023, 252, 114610. [Google Scholar] [CrossRef] [PubMed]
  15. Guo, S.; Chen, X.; Wei, W.; Li, T.; Yin, F.; Xu, L. Risk Assessment and Source Analysis of Heavy Metal Contamination in the Soil of the Juanshui River Mouth. Environ. Pollut. Bioavailab. 2023, 35, 2212127. [Google Scholar] [CrossRef]
  16. Li, T.; Li, Y.; Liu, H.; Wang, J.; Li, K.; Huang, Y.; Wang, Z.; Xing, H.; Wei, M. Spatial Distribution and Ecological Risk Assessment of Heavy Metal Elements in Rock-Soil in the Mountainous Areas of Southwest China: A Case Study of Xichang. Geol. J. 2023, 58, 3866–3878. [Google Scholar] [CrossRef]
  17. Gao, J.; Gong, J.; Yang, J.; Wang, Z.; Fu, Y.; Tang, S.; Ma, S. Spatial Distribution and Ecological Risk Assessment of Soil Heavy Metals in a Typical Volcanic Area: Influence of Parent Materials. Heliyon 2023, 9, e12993. [Google Scholar] [CrossRef]
  18. Li, Q.; Chen, M.; Zheng, X.; Chen, W. Determination of Tungsten’s Toxicity Coefficient for Potential Ecological Risk Assessment. Environ. Res. Commun. 2023, 5, 025003. [Google Scholar] [CrossRef]
  19. Khan, S.; Naushad, M.; Lima, E.C.; Zhang, S.; Shaheen, S.M.; Rinklebe, J. Global Soil Pollution by Toxic Elements: Current Status and Future Perspectives on the Risk Assessment and Remediation Strategies—A Review. J. Hazard. Mater. 2021, 417, 126039. [Google Scholar] [CrossRef]
  20. HJ 25.3-2019; Technical Guidelines for Risk Assessment of Soil Contamination of Land for Construction. Ministry of Ecology and Environment of the People’s Republic of China: Beijing, China, 2019.
  21. Mallants, D.; Šimůnek, J.; van Genuchten, M.T.; Jacques, D. Simulating the Fate and Transport of Coal Seam Gas Chemicals in Variably-Saturated Soils Using HYDRUS. Water 2017, 9, 385. [Google Scholar] [CrossRef]
  22. Nielsen, D.R.; Van Genuchten, M.T.; Biggar, J.W. Water Flow and Solute Transport Processes in the Unsaturated Zone. Water Resour. Res. 1986, 22, 89S–108S. [Google Scholar] [CrossRef]
  23. Šimůnek, J.; van Genuchten, M.T. Modeling Nonequilibrium Flow and Transport Processes Using HYDRUS. Vadose Zone J. 2008, 7, 782–797. [Google Scholar] [CrossRef]
  24. Yang, T.; Šimůnek, J.; Mo, M.; Mccullough-Sanden, B.; Shahrokhnia, H.; Cherchian, S.; Wu, L. Assessing Salinity Leaching Efficiency in Three Soils by the HYDRUS-1D and -2D Simulations. Soil Tillage Res. 2019, 194, 104342. [Google Scholar] [CrossRef]
  25. Selim, T.; Elkefafy, S.M.; Berndtsson, R.; Elkiki, M.; El-kharbotly, A.A. Heavy Metal Transport in Different Drip-Irrigated Soil Types with Potato Crop. Sustainability 2023, 15, 10542. [Google Scholar] [CrossRef]
  26. Grecco, K.L.; de Miranda, J.H.; Silveira, L.K.; van Genuchten, M.T. HYDRUS-2D Simulations of Water and Potassium Movement in Drip Irrigated Tropical Soil Container Cultivated with Sugarcane. Agric. Water Manag. 2019, 221, 334–347. [Google Scholar] [CrossRef]
  27. Huang, S.; Tu, J.; Jin, Y.; Hua, M.; Wu, X.; Xu, W.; Yang, Y.; Wang, H.; Su, Y.; Cai, L. Contamination Assessment and Source Identification of Heavy Metals in River Sediments in Nantong, Eastern China. Int. J. Environ. Res. 2018, 12, 373–389. [Google Scholar] [CrossRef]
  28. Zeng, J.; Tabelin, C.B.; Gao, W.; Tang, L.; Luo, X.; Ke, W.; Jiang, J.; Xue, S. Heterogeneous Distributions of Heavy Metals in the Soil-Groundwater System Empowers the Knowledge of the Pollution Migration at a Smelting Site. Chem. Eng. J. 2023, 454, 140307. [Google Scholar] [CrossRef]
  29. Zhang, Y.; Zhang, Q.; Chen, W.; Shi, W.; Cui, Y.; Chen, L.; Shao, J. Source Apportionment and Migration Characteristics of Heavy Metal(Loid)s in Soil and Groundwater of Contaminated Site. Environ. Pollut. 2023, 338, 122584. [Google Scholar] [CrossRef]
  30. Huang, Z.; Jiang, L.; Wu, P.; Dang, Z.; Zhu, N.; Liu, Z.; Luo, H. Leaching Characteristics of Heavy Metals in Tailings and Their Simultaneous Immobilization with Triethylenetetramine Functioned Montmorillonite (TETA-Mt) against Simulated Acid Rain. Environ. Pollut. 2020, 266, 115236. [Google Scholar] [CrossRef]
  31. Luo, Y.; Wu, Y.; Shu, J.; Wu, Z. Effect of Particulate Organic Matter Fractions on the Distribution of Heavy Metals with Aided Phytostabilization at a Zinc Smelting Waste Slag Site. Environ. Pollut. 2019, 253, 330–341. [Google Scholar] [CrossRef]
  32. Fei, Y.; Zhang, B.; He, J.; Chen, C.; Liu, H. Dynamics of Vertical Vanadium Migration in Soil and Interactions with Indigenous Microorganisms Adjacent to Tailing Reservoir. J. Hazard. Mater. 2022, 424, 127608. [Google Scholar] [CrossRef]
  33. Liu, T.; Li, F.; Jin, Z.; Yang, Y. Acidic Leaching of Potentially Toxic Metals Cadmium, Cobalt, Chromium, Copper, Nickel, Lead, and Zinc from Two Zn Smelting Slag Materials Incubated in an Acidic Soil. Environ. Pollut. 2018, 238, 359–368. [Google Scholar] [CrossRef] [PubMed]
  34. Luo, Y.; Wu, Y.; Wang, H.; Xing, R.; Zheng, Z.; Qiu, J.; Yang, L. Bacterial Community Structure and Diversity Responses to the Direct Revegetation of an Artisanal Zinc Smelting Slag after 5 Years. Environ. Sci. Pollut. Res. 2018, 25, 14773–14788. [Google Scholar] [CrossRef] [PubMed]
  35. Luo, Y.; Wu, Y.; Xing, R.; Yao, C.; Shu, J.; Wu, Z. Effects of Plant Litter Decomposition on Chemical and Microbiological Characteristics of Artisanal Zinc Smelting Slag Using Indigenous Methods. J. Geochem. Explor. 2018, 190, 292–301. [Google Scholar] [CrossRef]
  36. Majdalani, S.; Michel, E.; Di-Pietro, L.; Angulo-Jaramillo, R. Effects of Wetting and Drying Cycles on in Situ Soil Particle Mobilization. Eur. J. Soil Sci. 2008, 59, 147–155. [Google Scholar] [CrossRef]
  37. Mohanty, S.K.; Bulicek, M.C.D.; Metge, D.W.; Harvey, R.W.; Ryan, J.N.; Boehm, A.B. Mobilization of Microspheres from a Fractured Soil during Intermittent Infiltration Events. Vadose Zone J. 2015, 14, 1–10. [Google Scholar] [CrossRef]
  38. Lu, C.; Wu, Y.; Hu, S. Drying–Wetting Cycles Facilitated Mobilization and Transport of Metal-Rich Colloidal Particles from Exposed Mine Tailing into Soil in a Gold Mining Region along the Silk Road. Environ. Earth Sci. 2016, 75, 1031. [Google Scholar] [CrossRef]
  39. Liu, J.; Liu, Y.J.; Liu, Y.; Liu, Z.; Zhang, A.N. Quantitative Contributions of the Major Sources of Heavy Metals in Soils to Ecosystem and Human Health Risks: A Case Study of Yulin, China. Ecotoxicol. Environ. Saf. 2018, 164, 261–269. [Google Scholar] [CrossRef]
  40. Xie, Y.; Hu, C.; Qin, Z.; Chen, J.; Huo, X.; Tao, Y. Ecological-Health Risks Assessment and Characteristic Pollutants Identification of Heavy Metals in the Soils of a Coking Plant in Production in Guangxi, China. Ecol. Indic. 2023, 154, 110830. [Google Scholar] [CrossRef]
  41. Shi, J.; Zhao, D.; Ren, F.; Huang, L. Spatiotemporal Variation of Soil Heavy Metals in China: The Pollution Status and Risk Assessment. Sci. Total Environ. 2023, 871, 161768. [Google Scholar] [CrossRef]
  42. Guo, Z.; Zhou, Y.; Wang, Q.; Wang, C.; Song, Y.; Liu, F.; Yang, Z.; Kong, M. Characteristics of soil heavy metal pollution and health risk in Xiong’an New District. China Environ. Sci. 2021, 41, 431–441. [Google Scholar] [CrossRef]
Figure 1. Layout of the study area.
Sustainability 17 02931 g001
Figure 2. Location of sampling points for P1.
Sustainability 17 02931 g002
Figure 3. Location of sampling points for P2.
Sustainability 17 02931 g003
Figure 4. Vertical distribution characteristics of soil heavy metal content at exceedance points in P1.
Sustainability 17 02931 g004
Figure 5. Vertical distribution characteristics of soil heavy metal content at exceedance points in P2.
Sustainability 17 02931 g005
Figure 6. Spatial distribution of Cu, Pb, As, and Ni in P1 and P2.
Sustainability 17 02931 g006
Figure 7. Geological section of the study area.
Sustainability 17 02931 g007
Figure 8. The SEM results of SS15 (ae) and SS21 (fj).
Sustainability 17 02931 g008
Figure 9. The Nemerow pollution index values of soil in the study area.
Sustainability 17 02931 g009
Figure 10. Migration and diffusion of Cu, Pb, As, and Ni with Hydrus-2D.
Sustainability 17 02931 g010
Figure 11. Distribution characteristics of heavy metals in soil at three simulated points ((a): TR14; (b): TR18; (c): TR27).
Sustainability 17 02931 g011
Table 1. Classification of the Nemerow pollution index.
Single Factor Pollution Index ( P i )Pollution Index ( P N )Class Of Pollution Risk
P i ≤ 0.7 P N ≤ 0.7Clean (safe)
0.7 < P i ≤ 1.00.7 < P N ≤ 1.0Still clean (warning threshold)
1.0 < P i ≤ 2.01.0 < P N ≤ 2.0Low pollution
2.0 < P i ≤ 3.02.0 < P N ≤ 3.0Moderate pollution
P i > 3.0 P N > 3.0Heavy pollution
Table 2. Classification of the potential ecological risk ( E r i and R I ).
E r i Category R I Category
E r i ≤ 40Clean (safe) R I ≤ 150Slight ecological risk
40 < E r i ≤ 80warning threshold150 < R I ≤ 300Moderate ecological risk
80 < E r i ≤ 160Low pollution300 < R I ≤ 600High ecological risk
160 < E r i ≤ 320Moderate pollution R I > 600Very high ecological risk
E r i > 320Severe pollution
Table 3. Carcinogenic and non-carcinogenic risk levels.
CategoryValue RangeRisk Level
Carcinogenic risk10−6 < CR < 10−4Within the acceptable range
CR > 10−4Exceeds human tolerance level
Non-carcinogenic riskHQ < 1 or HI < 1No non-carcinogenic risk
HQ > 1 or HI > 1Non-carcinogenic risk present
Table 4. Parameters for Hydrus-2D.
Water Flow Parameters
LayerQr
(-)
Qs
(-)
Alpha
(1/cm)
n
(-)
Ks
(cm/d)
l
(-)
Mixed layer of silty clay and miscellaneous fill0.070.360.0051.090.480.5
Silt0.0340.460.0161.3760.5
Silty clay0.070.360.0051.090.480.5
Air-entry value of −2 cm
Solute Transport Parameters
LayerBulk. D.
(g/cm3)
Disp. L.
(cm)
Disp. T.
(cm)
Kd
(cm3/g)
μ
(-)
β
Mixed layer of silty clay and miscellaneous fill1.9851.20.2000
Silty1.9373.20.6000
Silty clay2.01.20.2000
Diffus. W (cm2/d): Cu: 0.714, Pb: 0.945 [25], As: 0.34 [26], Ni: 0.89;
Diffus. G (cm2/d): 0
Note: Qr and Qs denote the residual and saturated water contents, respectively; Alpha and n are empirical coefficients affecting the shape of the hydraulic functions; Ks is the saturated hydraulic conductivity, and l is a pore-connectivity parameter. Bulk. D is bulk density; Disp. L and Disp. T are transverse and longitudinal dispersivity, respectively; Kd and β are the adsorption isotherm coefficient and exponent, respectively; Diffus. W is the molecular diffusion coefficient in free water; Diffus. G is the molecular diffusion coefficient in soil air.
Table 5. Statistical results of heavy metal content in soil.
BatchElementsMax.
(mg·kg−1)
Min.
(mg·kg−1)
Mean
(mg·kg−1)
Median
(mg·kg−1)
SD
(mg·kg−1)
CV
P1Cu32,2002.0588.91223128.425.31
Pb81110.030.632257.041.86
As28.52.579.519.0754.090.43
Ni4459.040.312556.711.41
P2Cu26,50011.0780.2541.52784.483.57
Pb938013.097.6019.65708.717.26
As64.42.839.128.665.810.64
Ni56611.056.5540.558.901.04
Note: Max., maximum; Min., minimum; Mean, mean value; Median, median value; SD, standard deviation; CV, coefficient of variance.
Table 6. Ecological risk coefficients for heavy metals in soil.
ElementRegional Soil Background Value
(mg·kg−1)
P1P2
Range
(mg·kg−1)
Mean
(mg·kg−1)
Risk LevelRange
(mg·kg−1)
Mean
(mg·kg−1)
Risk
Level
E r i Cu28.91.80–1515.27103.79Low4.05–1627.4142.73Low
Pb27.92.41–25.555.49Clean2.87–284.817.04Clean
As10.06.68–12.609.51Clean5.32–17.279.10Clean
Ni32.02.92–20.186.30Clean3.33–29.948.93Clean
R I /16.83–1550.82125.09Low20.78–1662.76177.80Moderate
Table 7. Health risk values for different exposure routes.
BatchElementCarcinogenic RiskNon-Carcinogenic Risk
CRoisCRdcsCRpisCRnHQoisHQdcsHQpisHIn
P1Cu----16.084.580 × 10−23.902 × 10−216.17
Pb----4.6298.706 × 10−24.788 × 10−15.195
As5.466 × 10−55.244 × 10−63.401 × 10−66.330 × 10−51.8981.622 × 10−13.925 × 10−12.452
Ni--1.739 × 10−61.739 × 10−62.407 × 10−11.714 × 10−25.537 × 10−18.115 × 10−1
P2Cu----4.9941.422 × 10−21.212 × 10−25.021
Pb----53.541.0075.53860.08
As1.235 × 10−41.185 × 10−57.684 × 10−61.430 × 10−44.2883.664 × 10−18.869 × 10−15.542
Ni--1.688 × 10−61.688 × 10−62.337 × 10−11.664 × 10−25.376 × 10−17.880 × 10−1
Note: “-” indicates no corresponding value of health risk under this exposure pathway. In previous studies, there have been no corresponding carcinogenic factor parameters for Cu and Pb in the three exposure pathways of oral ingestion, skin contact, and inhalation of soil particles. Therefore, the health risk values of Cu and Pb in these three exposure pathways have no corresponding value. There is no corresponding health risk value of Ni under oral ingestion and dermal contact because corresponding carcinogenic factor parameters are lacking. CRois, CRdcs, and CRpis represent the carcinogenic risk of a single heavy metal(loid) pollution under the three routes of oral ingestion, dermal contact, and particulate inhalation, respectively; HQois, HQdcs, HQpis represent the hazard quotient of a single heavy metal(loid) pollutant under the same three routes, respectively.
Disclaimer/Publisher’s Note: The statements, opinions and data contained in all publications are solely those of the individual author(s) and contributor(s) and not of MDPI and/or the editor(s). MDPI and/or the editor(s) disclaim responsibility for any injury to people or property resulting from any ideas, methods, instructions or products referred to in the content.

