
A New Framework for Evaluating City–Industry Integration in New Urban Districts: The Case of Xixian New Area, China


Abstract
1. Introduction
2. Theoretical Framework
2.1. “I–C–P” Interaction Theory
2.2. Evaluation System of City–Industry Integration
3. Materials and Methods
3.1. Research Area
3.2. Data Sources
3.3. Data Processing and Indicator Calculation
3.4. Evaluation Model Based on Improved CRITIC Method
4. Results
4.1. City–Industry Integration Level in Xixian New Area
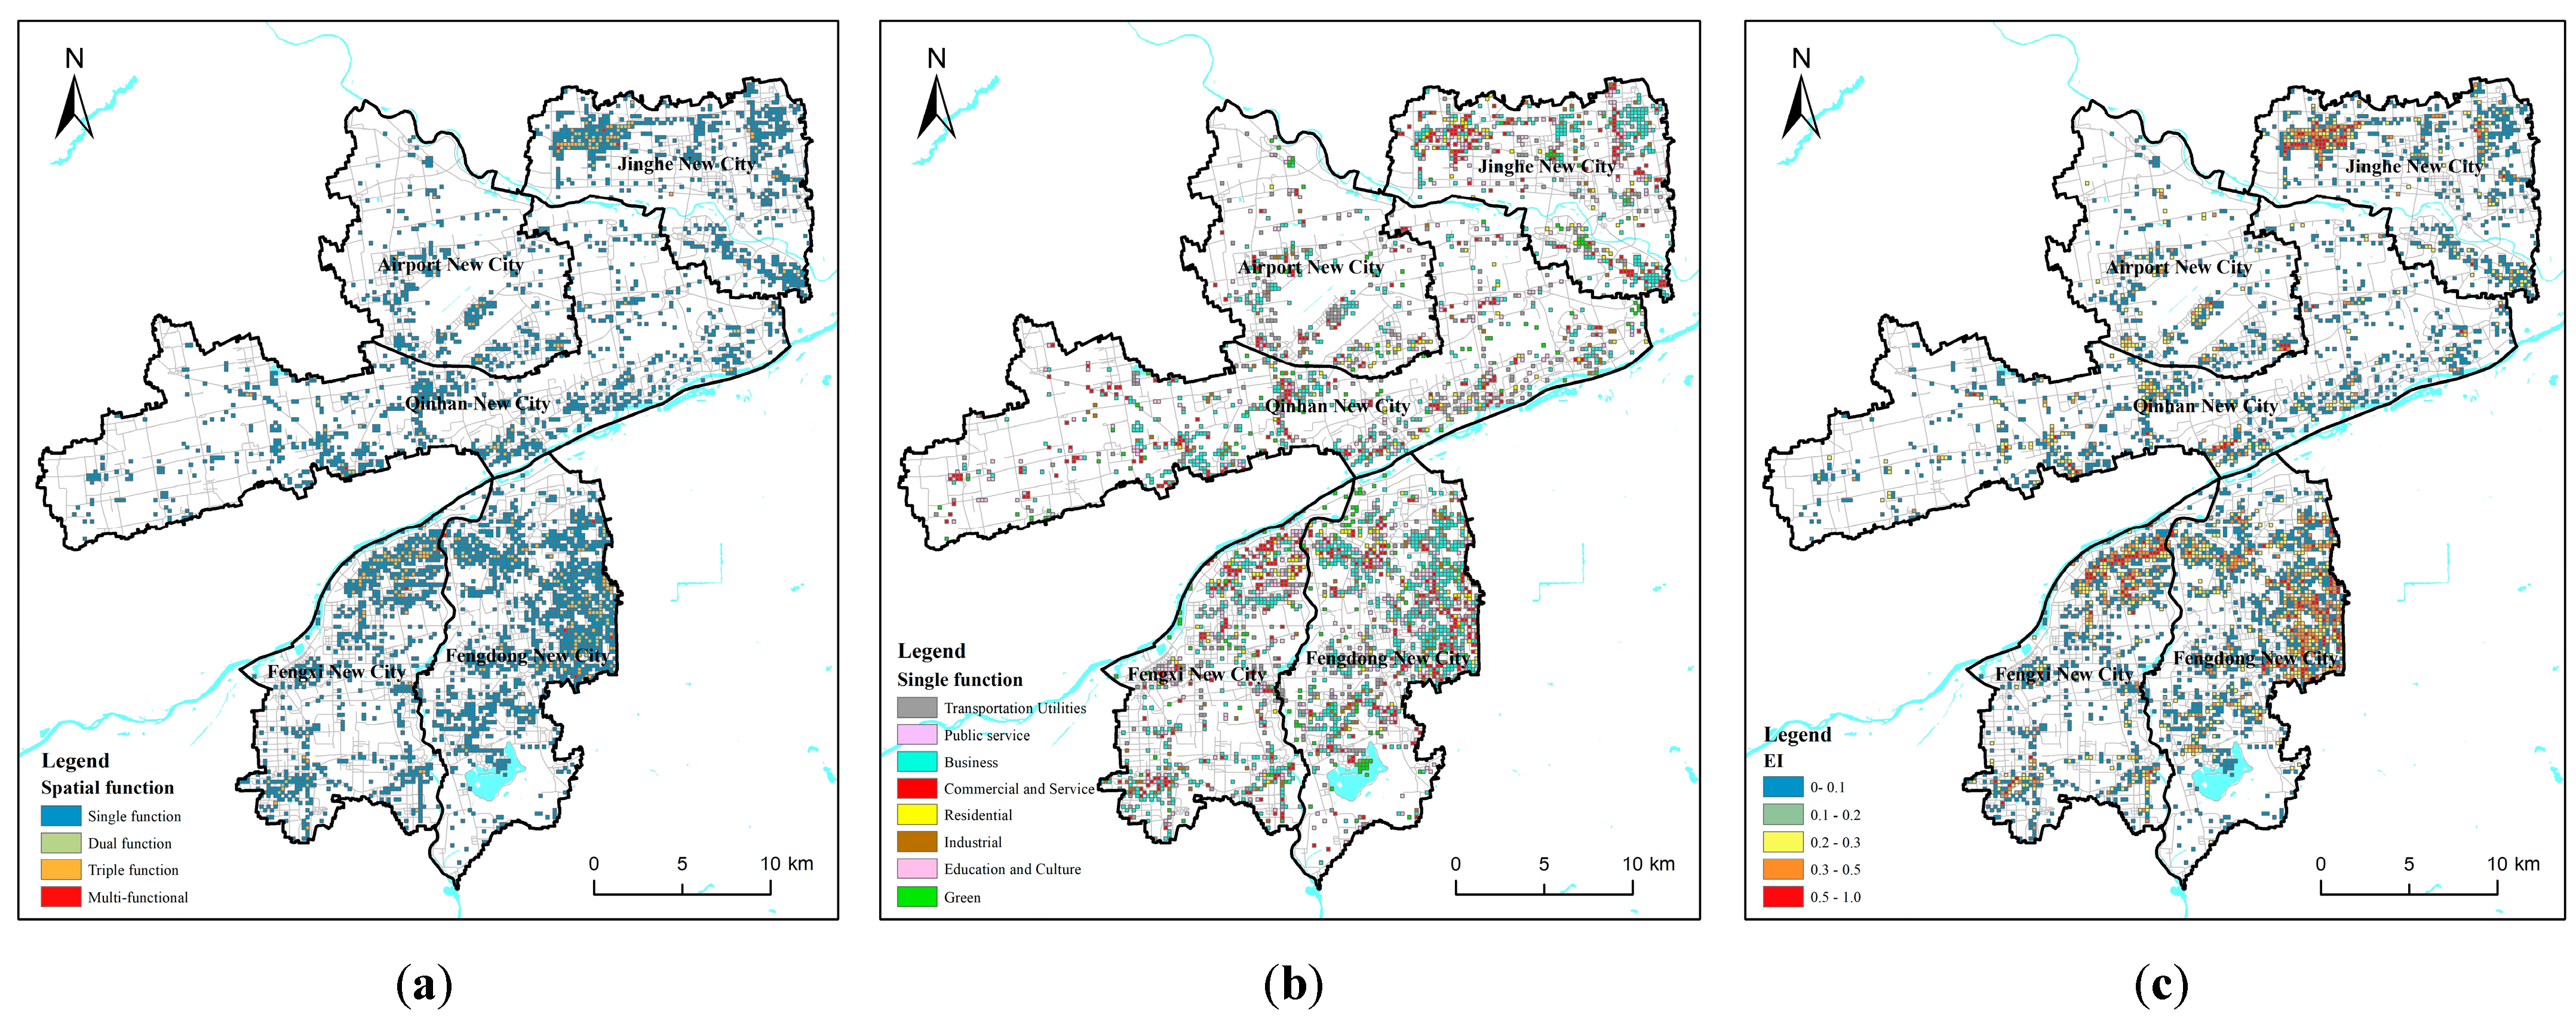
4.2. Spatial Differentiation of Each Dimension Level
4.3. Evaluation Verification Based on Entropy Weight Method
5. Discussion
5.1. Reasons for the Low Level of City–Industry Integration
5.2. Analysis of the Spatial Differentiation in Interaction Levels of Dimensions and the Rationality of the Evaluation Indicators
5.3. Limitations
5.4. Policy Recommendations
6. Conclusions
Author Contributions
Funding
Institutional Review Board Statement
Informed Consent Statement
Data Availability Statement
Conflicts of Interest
Abbreviations
| I–C–P | Industry–City–Population |
| EM | Entropy Method |
| POI | Points of interest |
| JHB | Job–housing balance |
| FPMI | Facility-Population Matching Index |
Appendix A

| Primary | Secondary | Tertiary | Quantity | Weight |
|---|---|---|---|---|
| Residential | Residence communities | Community, villa, etc. | 534 | 15 |
| Commercial and Service | Shopping, Catering, Hotel, Places of interest, Finance | department stores, theme emporiums, supermarkets, Convenience stores, restaurants, etc. | 8556 | 30 |
| Industrial | Factory, Industrial Park | Factory, Industrial Building, Industrial Park, etc. | 312 | 80 |
| Public Service | Pension, sports, medical | Nursing homes, Apartments for the elderly, Nursing centers, Comprehensive gymnasiums, General hospitals, Specialized hospitals, etc. | 605 | 50 |
| Green | Urban parks, Scenic spots | Parks, Squares | 310 | 90 |
| Transportation hubs | Public transport, External traffic | Bus stops, Subway stations, Parking lots, Airports, Bus stations, Train stations, etc. | 2120 | 20 |
| Business | Business, Office | Companies, Office | 3066 | 40 |
| Education and Culture | School, Cultural venues | Universities, Secondary schools, Primary schools, Kindergartens, Vocational colleges, Museums, Libraries, etc. | 560 | 60 |
| Kolmogorov–Smirnova a | Shapiro-Wilk | |||||
|---|---|---|---|---|---|---|
| Statistic | df | Sig. | Statistic | df | Sig. | |
| Total number of facilities | 0.164 | 699 | <0.01 | 0.852 | 699 | <0.01 |
| Intensity of population activity | 0.132 | 718 | <0.01 | 0.884 | 718 | <0.01 |
| Total Number of Facilities | Intensity of Population Activity | ||
|---|---|---|---|
| Total number of facilities | Correlation Coefficient | 1.000 | 0.787 ** |
| Sig. (2-tailed) | <0.001 | ||
| N | 699 | 698 | |
| Intensity of population activity | Correlation Coefficient | 0.787 ** | 1.000 |
| Sig. (2-tailed) | <0.001 | ||
| N | 698 | 718 |
| Equation | Model | Collinearity Statistics | Parameter Evaluation | ||||
|---|---|---|---|---|---|---|---|
| R2 | F | Sig. | Tolerance | VIF | Constant | b1 | |
| Linear | 0.548 | 843.734 | <0.001 | 1.000 | 1.000 | 11.600 | 0.608 |
References
- Biles, R. New towns for the Great Society: A case study in politics and planning. Plan. Perspect. 1998, 13, 113–132. [Google Scholar] [CrossRef]
- Kheyroddin, R.; Ghaderi, M. New towns as deconcentration or another concentration in the metropolis: Evidence from Parand New Town in the Tehran Metropolitan Area. Int. J. Urban Sci. 2020, 24, 69–87. [Google Scholar] [CrossRef]
- He, S.; Tao, S.; Ng, M.; Tieben, H. Evaluating Hong Kong’s spatial planning in new towns from the perspectives of job accessibility, travel mobility, and work-life balance. J. Am. Plan. Assoc. 2020, 86, 324–338. [Google Scholar] [CrossRef]
- Sun, B.; Han, S.; Li, W. Effects of the polycentric spatial structures of Chinese city regions on CO2 concentrations. Transp. Res. Part D Transp. Environ. 2020, 82, 102333. [Google Scholar] [CrossRef]
- Guo, L. Causes and Solutions of Job-housing Separation in China ’s Large Cities-A case of Zhengzhou City. Urban Probl. 2016, 2016, 70–74. [Google Scholar]
- Jin, X.; Long, Y.; Sun, W.; Lu, Y.; Yang, X.; Tang, J. Evaluating cities’ vitality and identifying ghost cities in China with emerging geographical data. Cities 2017, 63, 98–109. [Google Scholar] [CrossRef]
- Liu, R.; Wang, S. The integration of industry and city in the Urban New Development Zone. Urban Probl. 2013, 2013, 18–22. (In Chinese) [Google Scholar] [CrossRef]
- Cong, H.; Duan, W.; Wu, F. City-industry Integration and Its Welfare Effects during the New-type Urbanization. China Ind. Econ. 2017, 11, 62–80. (In Chinese) [Google Scholar] [CrossRef]
- Fang, C. Basic rules and key paths for high-quality development of the new urbanization in China. Geogr. Res. 2019, 38, 13–22. [Google Scholar] [CrossRef]
- Zhang, D. The new concept of “Industry-City Integration”. Decis. Mak. 2011, 2011, 1. (In Chinese) [Google Scholar]
- Michaels, G.; Rauch, F.; Redding, S.J. Urbanization and Structural Transformation. Q. J. Econ. 2012, 127, 535–586. [Google Scholar] [CrossRef]
- Wang, X.; Su, L.; Guo, B.; Li, X. Evaluation of industry-city integration of high-tech district based on factor analysis and cluster analysis. Sci. Technol. Prog. Policy 2013, 30, 26–29. [Google Scholar] [CrossRef]
- Lin, H. Discussion on the “Urban and Industrial Integration” in the Suburb of Shanghai-Taking Qingpu New City for Example. Shanghai Urban Plan. Rev. 2011, 2011, 30–36. (In Chinese) [Google Scholar]
- Sun, H.; Li, H.; Zhao, J. Studies on evaluation system of industry-city integration. Sci. Technol. Innov. Her. 2014, 2014, 248–249. (In Chinese) [Google Scholar] [CrossRef]
- Li, Y.; Zhang, Z. Study on the Measurement and Threshold Effect of Industry-City Integration in Western Region. Stat. Decis. 2021, 37, 86–90. (In Chinese) [Google Scholar] [CrossRef]
- Zhu, M.; Xie, Y. Analysis on the spatio-temporal evolution of the city-industry integration of Yangtze river delta under the guidance of humanism. Hubei Agric. Sci. 2021, 60, 190–195. [Google Scholar] [CrossRef]
- Deng, B.; Wan, Y. The Level and Features of Industry-City Integration Level in the YangtzeRiver Delta: Based on the Modified Coupled Coordination Model. Urban Dev. Stud. 2023, 30, 18–24. (In Chinese) [Google Scholar]
- Zou, D.; Cong, H. Spatio-temporal diversity pattern of city-industry integration and its influencing factors in China. Econ. Geogr 2019, 39, 66–74. [Google Scholar] [CrossRef]
- Shi, Y.; Wang, Q.; Zheng, J.; Li, J. Multi-dimensional and multi-scale observation and enlightenment on the city-industry integrated development in Tokyo. Shanghai Land Resour. 2023, 44, 131–167. [Google Scholar]
- Yan, B. Realistic Consideration and Path Enhancement of Industry-City Integration Development-Taking Shandong Province’s Industry-City Integration Development as an Example. Shandong Soc. Sci. 2017, 184–188. (In Chinese) [Google Scholar] [CrossRef]
- Zhu, L.; Lei, Y. An Analysis of the Spatiotemporal Evolution Trace and Influential Factors of the Industry-City Integrated Development of the Yangtze River Economic Belt. J. China Exec. Leadersh. Acad. Jinggangshan 2019, 12, 120–129. (In Chinese) [Google Scholar]
- Tang, S. Measurement and Path Optimization of Industry-City Integration Development-Taking Guangxi as an Example. J. Commer. Econ. 2020, 2020, 158–161. (In Chinese) [Google Scholar]
- Gu, Z.; Kong, X. A Study for “Integration of Industry and City” Evaluation Model of Development Zones Based on Entropy Method. J. Qufu Norm. Univ. (Nat. Sci.) 2017, 43, 89–93. (In Chinese) [Google Scholar]
- An, J.; Wang, R. The Coupling and Coordination Evaluation of Industry—City Integration in State-level New Areas-Taking Zhoushan Islands New Area and Qingdao West Coast New Area as Examples. Resour. Dev. Mark. 2021, 37, 287–293. (In Chinese) [Google Scholar] [CrossRef]
- Gan, L.; Shi, H.; Hu, Y.; Lev, B.; Lan, H. Coupling coordination degree for urbanization city-industry integration level: Sichuan case. Sustain. Cities Soc. 2020, 58, 102136. [Google Scholar] [CrossRef]
- Cong, H.; Zou, D.; Liu, C. Analysis of spatial-temporal pattern of city-industry integration against the perspective of a new kind of urbanization. Econ. Geogr. 2017, 7, 46–55. [Google Scholar] [CrossRef]
- Wang, Y.; Jing, Y. A Study on the City-industry Integration Measurement and Synergetic Strategies of Urban Agglomerations in Guangdong-Hong Kong-Macao Greater Bay Area. J. Eng. Manag./Gongcheng Guanli Xuebao 2019, 33, 47–52. [Google Scholar] [CrossRef]
- Zhang, J.; Shen, Z. Evaluation of city-industry integration in the middle reaches of the Yangtze River. Shanghai J. Econ. 2017, 3, 109–114. [Google Scholar] [CrossRef]
- Su, L.; Jia, J. Coupling Coordination Degree of City-Industry Integration in Shanghai Based on Entropy Evaluation Method. Math. Probl. Eng. 2022, 2022, 7985899. [Google Scholar] [CrossRef]
- He, Y.; Xia, Y. Research on Evaluation and Countermeasures of Industry-City Integration in Jiangsu Province. Mod. Econ. Res. 2017, 2017, 72–76. (In Chinese) [Google Scholar] [CrossRef]
- Len, B.; Cao, C.; Yi, Z.; Zhang, Z.; Zhang, H. Evaluation and Planning Strategies on Industry-city Integration inChongging Main Area. Planners 2019, 35, 61–68. (In Chinese) [Google Scholar]
- Shi, Y.; Li, J.; Li, B.; Hang, T. A New Approach to Evaluate the Integrated Development of City and Industry: The Cases of Shanghai and the Kangqiao Industrial Park. Buildings 2022, 12, 1851. [Google Scholar] [CrossRef]
- Pan, Q.; Jiao, H.; Liu, X.; Zheng, Z.; He, H.; Wang, W. Optimization of City-Industry Integration Evaluation in Conjunction with Plan Formulation: The Practice in Wuhan. Urban Plan. Forum 2024, 2024, 110–118. (In Chinese) [Google Scholar]
- Li, Y.; Cao, X.; Cui, C. System Dynamics Theory Applied to Differentiated Levels of City-Industry Integration in China. Sustainability 2023, 15, 3987. [Google Scholar] [CrossRef]
- Tang, Z.; Bi, H.; Sun, J.; Xu, Y.; Wang, Z. Research on the coopetition relationship and the development of city-industry integration of urban agglomeration under the effect of HSR. Front. Environ. Sci. 2023, 11, 1082664. [Google Scholar] [CrossRef]
- Peng, Y.; Zhu, Y.; He, H.; Guo, S.; Zhang, S. Measuring the level of city-industry integration in new industrial zones of large cities from the perspective of spatial connection: Taking Wuhan as an example. J. Hum. Settl. West China 2024, 39, 106–114. [Google Scholar] [CrossRef]
- Xu, M.; Luo, Y.; Li, D. Research on Evaluation of City-Industry Integration in Industrial Parks. Sustainability 2024, 16, 6906. [Google Scholar] [CrossRef]
- Ren, Y.; Li, H.; Shen, L.; Zhang, Y.; Chen, Y.; Wang, J. What Is the Efficiency of Fast Urbanization? A China Study. Sustainability 2018, 10, 3180. [Google Scholar] [CrossRef]
- Su, L.; Guo, B.; Li, X. Fuzzy AHP Evaluation on Production-city Integration of Shanghai Zhangjiang High-tech Zone. J. Ind. Technol. Econ. 2013, 32, 12–16. [Google Scholar] [CrossRef]
- Tang, X. A study for city-industry integration evaluation model of development zone based on grey correlation analysis. Shanghai J. Econ. 2014, 2014, 85–92. [Google Scholar] [CrossRef]
- Wang, F. On the evaluation of industry and city fusion in industrial agglomeration area based on combined weight and four quadrant method. Ecol. Econ. 2014, 30, 36–41. [Google Scholar]
- Zhang, X.; Chen, H.; Hu, J. Evaluation of industry city integration based on entropy method and coupling model ——Take F city as an example. J. Fuyang Norm. Univ. (Nat. Sci.) 2021, 38, 102–108. (In Chinese) [Google Scholar] [CrossRef]
- Wei, J.; Shao, J. The Assessment of Industry and City Fusion Based on AHP Method. Henan Sci. 2014, 32, 2173–2177. (In Chinese) [Google Scholar] [CrossRef]
- Ou, X.; Zhen, F.; Qin, Y.; Zhu, L.; Wu, H. Study on compression level and ideal impetus of regional urbanization: The case of Jiangsu Province. Geogr. Res. 2008, 27, 993–1002. [Google Scholar]
- Hao, H.; Ruan, L.; Yin, J.; Zhang, L.; Long, Y. Evaluation of urban industrial service facilities support based on industrial land survey data—Jiangsu Changzhou City as an example. Areal Res. Dev. 2021, 40, 88–93. [Google Scholar]
- Diakoulaki, D.; Mavrotas, G.; Papayannakis, L. Determining objective weights in multiple criteria problems: The critic method. Comput. Oper. Res. 1995, 22, 763–770. [Google Scholar] [CrossRef]
- Long, Y. Urban Spatial Development, Quality and Vibrancy of New Areas. Urban Plan. Int. 2017, 32, 6–9. [Google Scholar] [CrossRef]
- Ji, W. Comprehensive Transportation System Planning: Port Area, Shanghai. Planners 2014, 30, 40–45. (In Chinese) [Google Scholar]
- Li, W.; Chen, H. Analysis of City-Industry Integration and Planning Strategies. Urban Plan. Forum 2012, 56, 99–103. (In Chinese) [Google Scholar]
- Shi, Y. A Research on Industry-City Integration: Review and New Exploration. Urban Plan. Forum 2016, 60, 73–78. (In Chinese) [Google Scholar]
- Zou, W.; Huang, Y.; Ma, X.; Dai, M. Dynamic Planning For National Development Zones With The View Of City-Industry Inte Gration. Planners 2014, 30, 32–39. [Google Scholar]
- Li, Y.; Guo, Z.; Wang, X.; Hu, Y.; Rong, L. Measurement of mixed use of spatial functions in urban built-up areas and analysis of multi-scale influencing factors: A case of Hohhot. J. Arid Land Resour. Environ. 2024, 38, 106–116. [Google Scholar]
- Nazarnia, N.; Harding, C.; Jaeger, J. How suitable is entropy as a measure of urban sprawl? Landsc. Urban Plan. 2019, 184, 32–43. [Google Scholar] [CrossRef]
- Cervero, R. Jobs-Housing Balancing and Regional Mobility. J. Am. Plan. Assoc. 1989, 55, 136–150. [Google Scholar] [CrossRef]
- Len, B.; Yu, Y.; Huang, D.; Yi, Z. Big data based job-residence relation in Chongqing Metropolitan Area. Planners 2015, 31, 92–96. [Google Scholar]
- Zhang, J.; Bai, J.; Wang, L. The Impact of Industry-City Integration on the Innovation Performance of National High-Tech Zones-An Empirical Study from the Yangtze River Economic Belt. Macroeconomics 2017, 2017, 108–117. [Google Scholar] [CrossRef]
- Jacobs, J. The Death and Life of Great American Cities; Random House: New York, NY, USA, 1961; Volume 1961. [Google Scholar]
- Yue, W.; Chen, Y.; Thy, P.; Fan, P.; Liu, Y.; Zhang, W. Identifying urban vitality in metropolitan areas of developing countries from a comparative perspective: Ho Chi Minh City versus Shanghai. Sustain. Cities Soc. 2021, 65, 102609. [Google Scholar] [CrossRef]
- Liu, D.; Shi, Y. The Influence Mechanism of Urban Spatial Structure on Urban Vitality Based on Geographic Big Data: A Case Study in Downtown Shanghai. Buildings 2022, 12, 569. [Google Scholar] [CrossRef]
- Song, X.; Chen, C.; Zhou, J.; Zhai, Y.; Li, S. Exploration and improvement of planning methods for the distribution of primary and secondary schools. City Plan. Rev. 2014, 38, 101–107. [Google Scholar]
- Zhong, L.; Xu, L. Research on the Matching Relationship between Service Facilities and Populations in Community Living Circle Based on Multi-source Data: A Case Study of Ningbo Downtown. Shanghai Urban Plan. Rev. 2022, 2022, 101–107. (In Chinese) [Google Scholar]
- Ye, Y.; Richards, D.; Lu, Y.; Song, X.; Zhuang, Y.; Zeng, W.; Zhong, T. Measuring daily accessed street greenery: A human-scale approach for informing better urban planning practices. Landsc. Urban Plan. 2019, 191, 103434. [Google Scholar] [CrossRef]
- Liu, Y.; Dang, C.; Yue, H.; Lyu, C.; Qian, J.; Zhu, R. Comparison between modified remote sensing ecological index and RSEI. Natl. Remote Sens. Bull. 2022, 26, 683–697. [Google Scholar] [CrossRef]
- Zhao, W.; Li, Q.; Li, B. Extracting hierarchical landmarks from urban POI data. J. Remote Sens. 2011, 15, 973–988. [Google Scholar] [CrossRef]
- Zhao, F.; Fu, Y.; Luan, G.; Zhang, S.; Cai, J.; Ding, J.; Qian, J.; Xie, Z. Spatial-Temporal Characteristic Analysis of Ethnic Toponyms Based on Spatial Information Entropy at the Rural Level in Northeast China. Entropy 2020, 22, 393. [Google Scholar] [CrossRef] [PubMed]
- Ma, T.; Zhou, C.H.; Pei, T.; Haynie, S.; Fan, J.F. Quantitative estimation of urbanization dynamics using time series of DMSP/OLS nighttime light data: A comparative case study from China’s cities. Remote Sens. Environ. 2012, 124, 99–107. [Google Scholar] [CrossRef]
- Xu, H.; Hu, S.; Li, X. Urban Distribution and Evolution of the Yangtze River Economic Belt from the Perspectives of Urban Area and Night-Time Light. Land 2023, 12, 321. [Google Scholar] [CrossRef]
- Cao, W.; Wang, Y. The Improved CRITIC-CPM Evaluation Model in Science and Technological Awards. Sci. Sci. Manag. S. T. 2012, 33, 17–21. (In Chinese) [Google Scholar]
- Yin, W. Research on the Evaluation of Science and Technological Awards Based on Improved CRITIC Method and Cloud Model. J. Hunan Univ. 2014, 41, 118–124. [Google Scholar]
- Zhang, F.; Wang, P.; Mu, P.; Wang, M.; Han, L.; Sun, J. A Comprehensive Evaluation Method for the Service Status of Groins in Waterways Based on an AHP-Improved CRITIC Combination Weighting Optimization Model. Sustainability 2022, 14, 10709. [Google Scholar] [CrossRef]
- Zhang, X.; Tang, Q. Research on the Evaluation of National Hi-Tech Industrial Development Zone. World Reg. Stud. 2013, 22, 114–120. [Google Scholar]
- Du, B. Multiple Analysis of Industry-city Integration. Planners 2014, 30, 5–9. [Google Scholar]
- Zhang, N.; Zhang, Z.; Guo, Q.; Ma, X.; Zhao, N.; Li, H. Spatial pattern of urban vitality of national new districts in inland northwest China. J. Arid Land Resour. Environ. 2024, 38, 38–49. (In Chinese) [Google Scholar] [CrossRef]
- Zhang, W.; Liu, T.; Tang, Q.; Wang, Q. Analysis of Influencing Factors of Production-city Integration in New Town. Constr. Econ. 2018, 39, 86–92. [Google Scholar] [CrossRef]
- Bo, W.; Huang, N. Innovation Path of Industry-City Integration Development in Xiong ’an New Area. J. Hebei Univ. Econ. Bus. 2024, 45, 49–56. (In Chinese) [Google Scholar] [CrossRef]
- Li, X.; Huo, Y.; Fan, J. Study on Occupational and Residential Spatial Characteristics of Xixian New Area Based on Baidu Wise Eye Big Data. Future City Des. Manag. 2023, 2023, 29–32. (In Chinese) [Google Scholar]
- Feng, F. Industry-City Integration and High-Quality Development of the State-Level New Districts: Mechanism Interpretation and Promotion Strategy. Economist 2021, 9, 50–57. [Google Scholar] [CrossRef]
- Feng, F. The Dilemma and Countermeasures of the State-Level New Districts Achieving High-Quality Development. Contemp. Econ. Manag. 2021, 43, 65–72. [Google Scholar]
- Zhang, N. Analysis of Population Inflow in State-Level New Areas- A Case of Xixian New Area, Shaanxi Province. Res. Dev. 2016, 2016, 26–31. (In Chinese) [Google Scholar] [CrossRef]
- Zhang, W.; Qiu, S.; Lin, Z.; Chen, Z.; Yang, Y.; Lin, J.; Li, S. Assessing the influence of green space morphological spatial pattern on urban waterlogging: A case study of a highly-urbanized city. Environ. Res. 2025, 266, 120561. [Google Scholar] [CrossRef]
- Su, W.; Zhang, W.; Chang, Q. Tailored green and blue infrastructure for heat mitigation under renewal planning of urban blocks in Beijing. Sci. Total Environ. 2025, 967, 178759. [Google Scholar] [CrossRef]


| Dimension | Primary Indicator | Secondary Indicator |
|---|---|---|
| I–C | Spatial connection between new district and central cities (I–C-1) | X1_Spatial distance from new district to central cities |
| X2_Bus routes from new district to central cities | ||
| Spatial connection within the new district (I–C-2) | X3_Bus station coverage ratio | |
| X4_Subway station coverage ratio | ||
| X5_Road network density | ||
| Functional integration (I–C-3) | X6_Functional mixing degree | |
| Economic benefit (I–C-4) | X7_Regional output value per unit area | |
| X8_Space economic vitality | ||
| P–I | Job–housing balance (P–I-1) | X9_JHB index |
| Income and consumption (P–I-2) | X10_Total Retail Sales of Consumer Goods growth rate/Regional GDP growth rate | |
| Innovation and development (P–I-3) | X11_Higher education population/Total employed population | |
| X12_Annual increment of high-tech enterprises | ||
| C–P | Population vitality (C–P-1) | X13_Population density |
| Facilities supply and demand (C–P-2) | X14_Facility-Population Matching Index (FPMI) | |
| Environment construction (C–P-3) | X15_Green coverage | |
| X16_PM2.5 |
| Type | Data | Source |
|---|---|---|
| Basic Geography | Administrative boundaries | National Catalogue Service For Geographic Information (https://www.webmap.cn/, accessed on 7 March 2024) |
| Network | OSM website (https://www.openstreetmap.org/, accessed on 8 March 2024) | |
| Bus routes | 91weitu (https://www.91weitu.com/default.htm, accessed on 25 November 2024) | |
| Statistics | Population | Seventh National Population Census |
| Economy | Xixian New Area Construction Administrative Committee of Shaanxi province (http://www.xixianxinqu.gov.cn/, accessed on 10 April 2024) Xixian New Area Statistical Survey Center | |
| High technology expertise | Science and Technology Bureau of Xixian New Area | |
| LBS data | POI | Amap (https://lbs.amap.com/, accessed on 25 February 2024) Baidu Maps (https://lbsyun.baidu.com/, accessed on 25 February 2024) |
| Heatmap (200 m × 200 m) | Baidu Maps (https://lbsyun.baidu.com/, accessed on 12 March 2024) | |
| Remote Sensing Image | NPP—VIIRS nighttime lights (1 km) | National Oceanic and Atmospheric Administration (https://www.noaa.gov/, accessed on 5 June 2024) |
| NDVI (30 m) | National Science & Technology Infrastructure (http://www.nesdc.org.cn/, accessed on 5 June 2024) | |
| PM2.5 (1 km) | National Tibetan Plateau Data Center (https://data.tpdc.ac.cn/home, accessed on 5 June 2024) |
| Indicator | Calculation Method |
|---|---|
| X1_Spatial distance from new district to central cities | The average distance from the center of mass of each New City to the center of mass of Xi’an and Xianyang City |
| X2_Bus routes from new district to central cities | Total number of bus routes from each New City to Xi’an and Xianyang City |
| X3_Bus station coverage ratio | Make 500 m buffers centered on the bus stations and calculate: The area of buffers/The total area of New City |
| X4_Subway station coverage ratio | Make 800 m buffers centered on the subway stations and calculate: The area of buffers/The total area of New City |
| X5_Road network density | The total length of road network at all levels/Total area of New City |
| X6_Functional mixing degree | 1. The 18,339 POI data points for Xixian New Area obtained from screening and reclassification were categorized into eight types and assigned weights according to public awareness [64]. The classification and weighting are shown in Table A1. 2. Based on the ArcGIS 10.7 platform, according to the administrative division boundaries of Xixian New Area, 200 m × 200 m grids were created by using the tool “Create Fishnet” as the base units for analysis and calculation of the spatial evaluation values [52]: 2. Calculate the spatial functional information entropy index based on the spatial evaluation values to reflect the functional mixing degree [53,65]: |
| X7_Regional output value per unit area | Calculate the GDP/Total area and apply dimensionless processing. |
| X8_Space economic vitality | Based on the ArcGIS platform, the “Zonal Statistics” tool was utilized to count the average value of nighttime light [66,67], and the data were dimensionless. |
| X9_JHB index | 1. According to the eight-hour working system, 09:00–12:00 and 14:00–17:00 were selected as the rest periods, and 23:00–05:00 was selected as the working period. Based on the ArcGIS platform, the POIs of companies, factories, scientific research institutions, and residential areas were selected as the places of work and residence respectively, and 300 m buffer zones were established by using the “buffer zone” tool. The population intensity point elements of each time were extracted according to the buffer zones. 2. Calculating the JHB index: Ratio of the mean value of the share of the population activity intensity at the workplaces during working period to the share at the places of residence during rest period: |
| X10_Total Retail Sales of Consumer Goods growth rate/Regional GDP growth rate | Dimensionless processing of the data |
| X11_Higher education population/Total employed population | Dimensionless processing of the data |
| X12_Annual increment of high-tech enterprises | Dimensionless processing of the data |
| X13_Population density | Calculate the Number of permanent population/Total area of New City, and perform dimensionless processing of the data. |
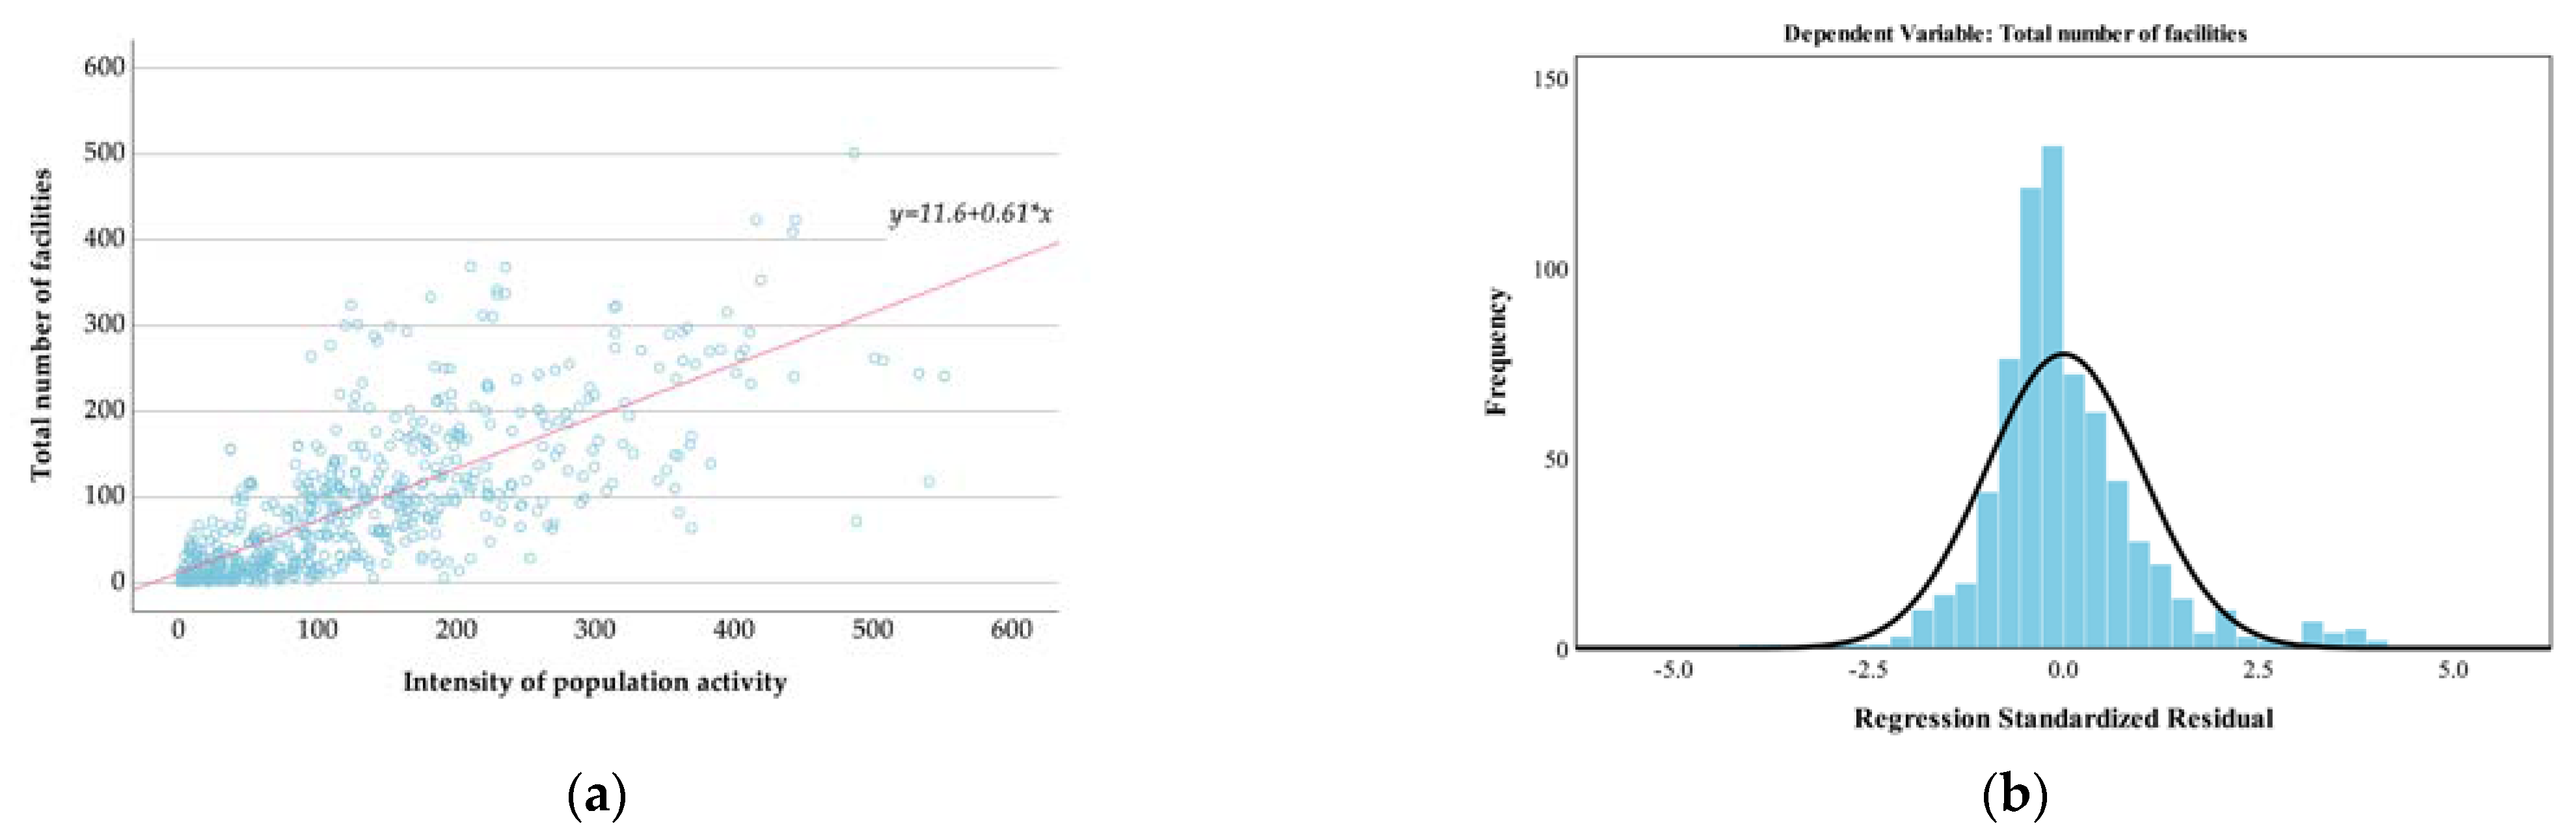
| X14_Facility-Population Matching Index (FPMI) | 1. Network analysis based on GIS: The GIS network analysis method was used to calculate the maximum walking range of each residential area for 15 min based on the actual vector road network with 723 residential areas in the study area as the center. The spatial connectivity tool was used to count the number of facilities and the intensity of population activity in each 15 min life circle separately. 2. Correlation analysis: First, based on SPSS27.0 software, a normal distribution test was conducted; the results are shown in Table A2, with p < 0.001 indicating that the data do not meet the criteria for normality. Second, a monotonicity test was performed where the number of facilities served as the dependent variable (Y) and population activity intensity as the independent variable (X). The findings revealed a monotonic relationship between X and Y (Figure A1a). Finally, Spearman correlation analysis was carried out, with results detailed in Table A3. 3. Linear regression model: The linear regression model was solved by ordinary least squares (OLS), and the results of the model were tested. The parameters of the model are presented in Table A4, while the standardized residual plots are shown in Figure A1b. 4. Calculate FPMI by substituting the number of facilities in the life circle of the neighborhood fitted by the regression equation in step 3 into the following equation: |
| X15_Green coverage | Based on the ArcGIS10.7 platform, the “Zonal Statistics” tool was utilized to count the average NDVI of each New City, and the data were dimensionless. |
| X16_PM2.5 | Based on the ArcGIS platform, the “Zonal Statistics” tool was utilized to count the annual average PM2.5 concentration in each New City, and the data were dimensionless. |
| Area | Fengdong New City | Fengxi New City | Jinghe New City | Airport New City | Qinhan New City | Xixian New Area |
|---|---|---|---|---|---|---|
| City–Industry Integration | 0.7693 | 0.6762 | 0.3308 | 0.3343 | 0.2789 | 0.4779 |
| Area | Fengdong | Fengxi | Jinghe | Airport | Qinhan | Xixian New Area |
|---|---|---|---|---|---|---|
| JHB index | 0.87 | 0.85 | 1.18 | 1.11 | 2.01 | 1.21 |
| Balance type | Relatively balanced | Relatively balanced | Relatively balanced | Relatively balanced | Employment-oriented | Employment-oriented |
| New City | Fengdong | Fengxi | Jinghe | Airport | Qinhan |
|---|---|---|---|---|---|
| Total Retail Sales of Consumer Goods | −7.20% | 5.90% | −0.30% | 2.00% | 1.30% |
| Regional GDP Growth Rate | −1.10% | 9.20% | 9.20% | 4.40% | 5.40% |
| Indicator | X1 | X2 | X3 | X4 | X5 | X6 | X7 | X8 |
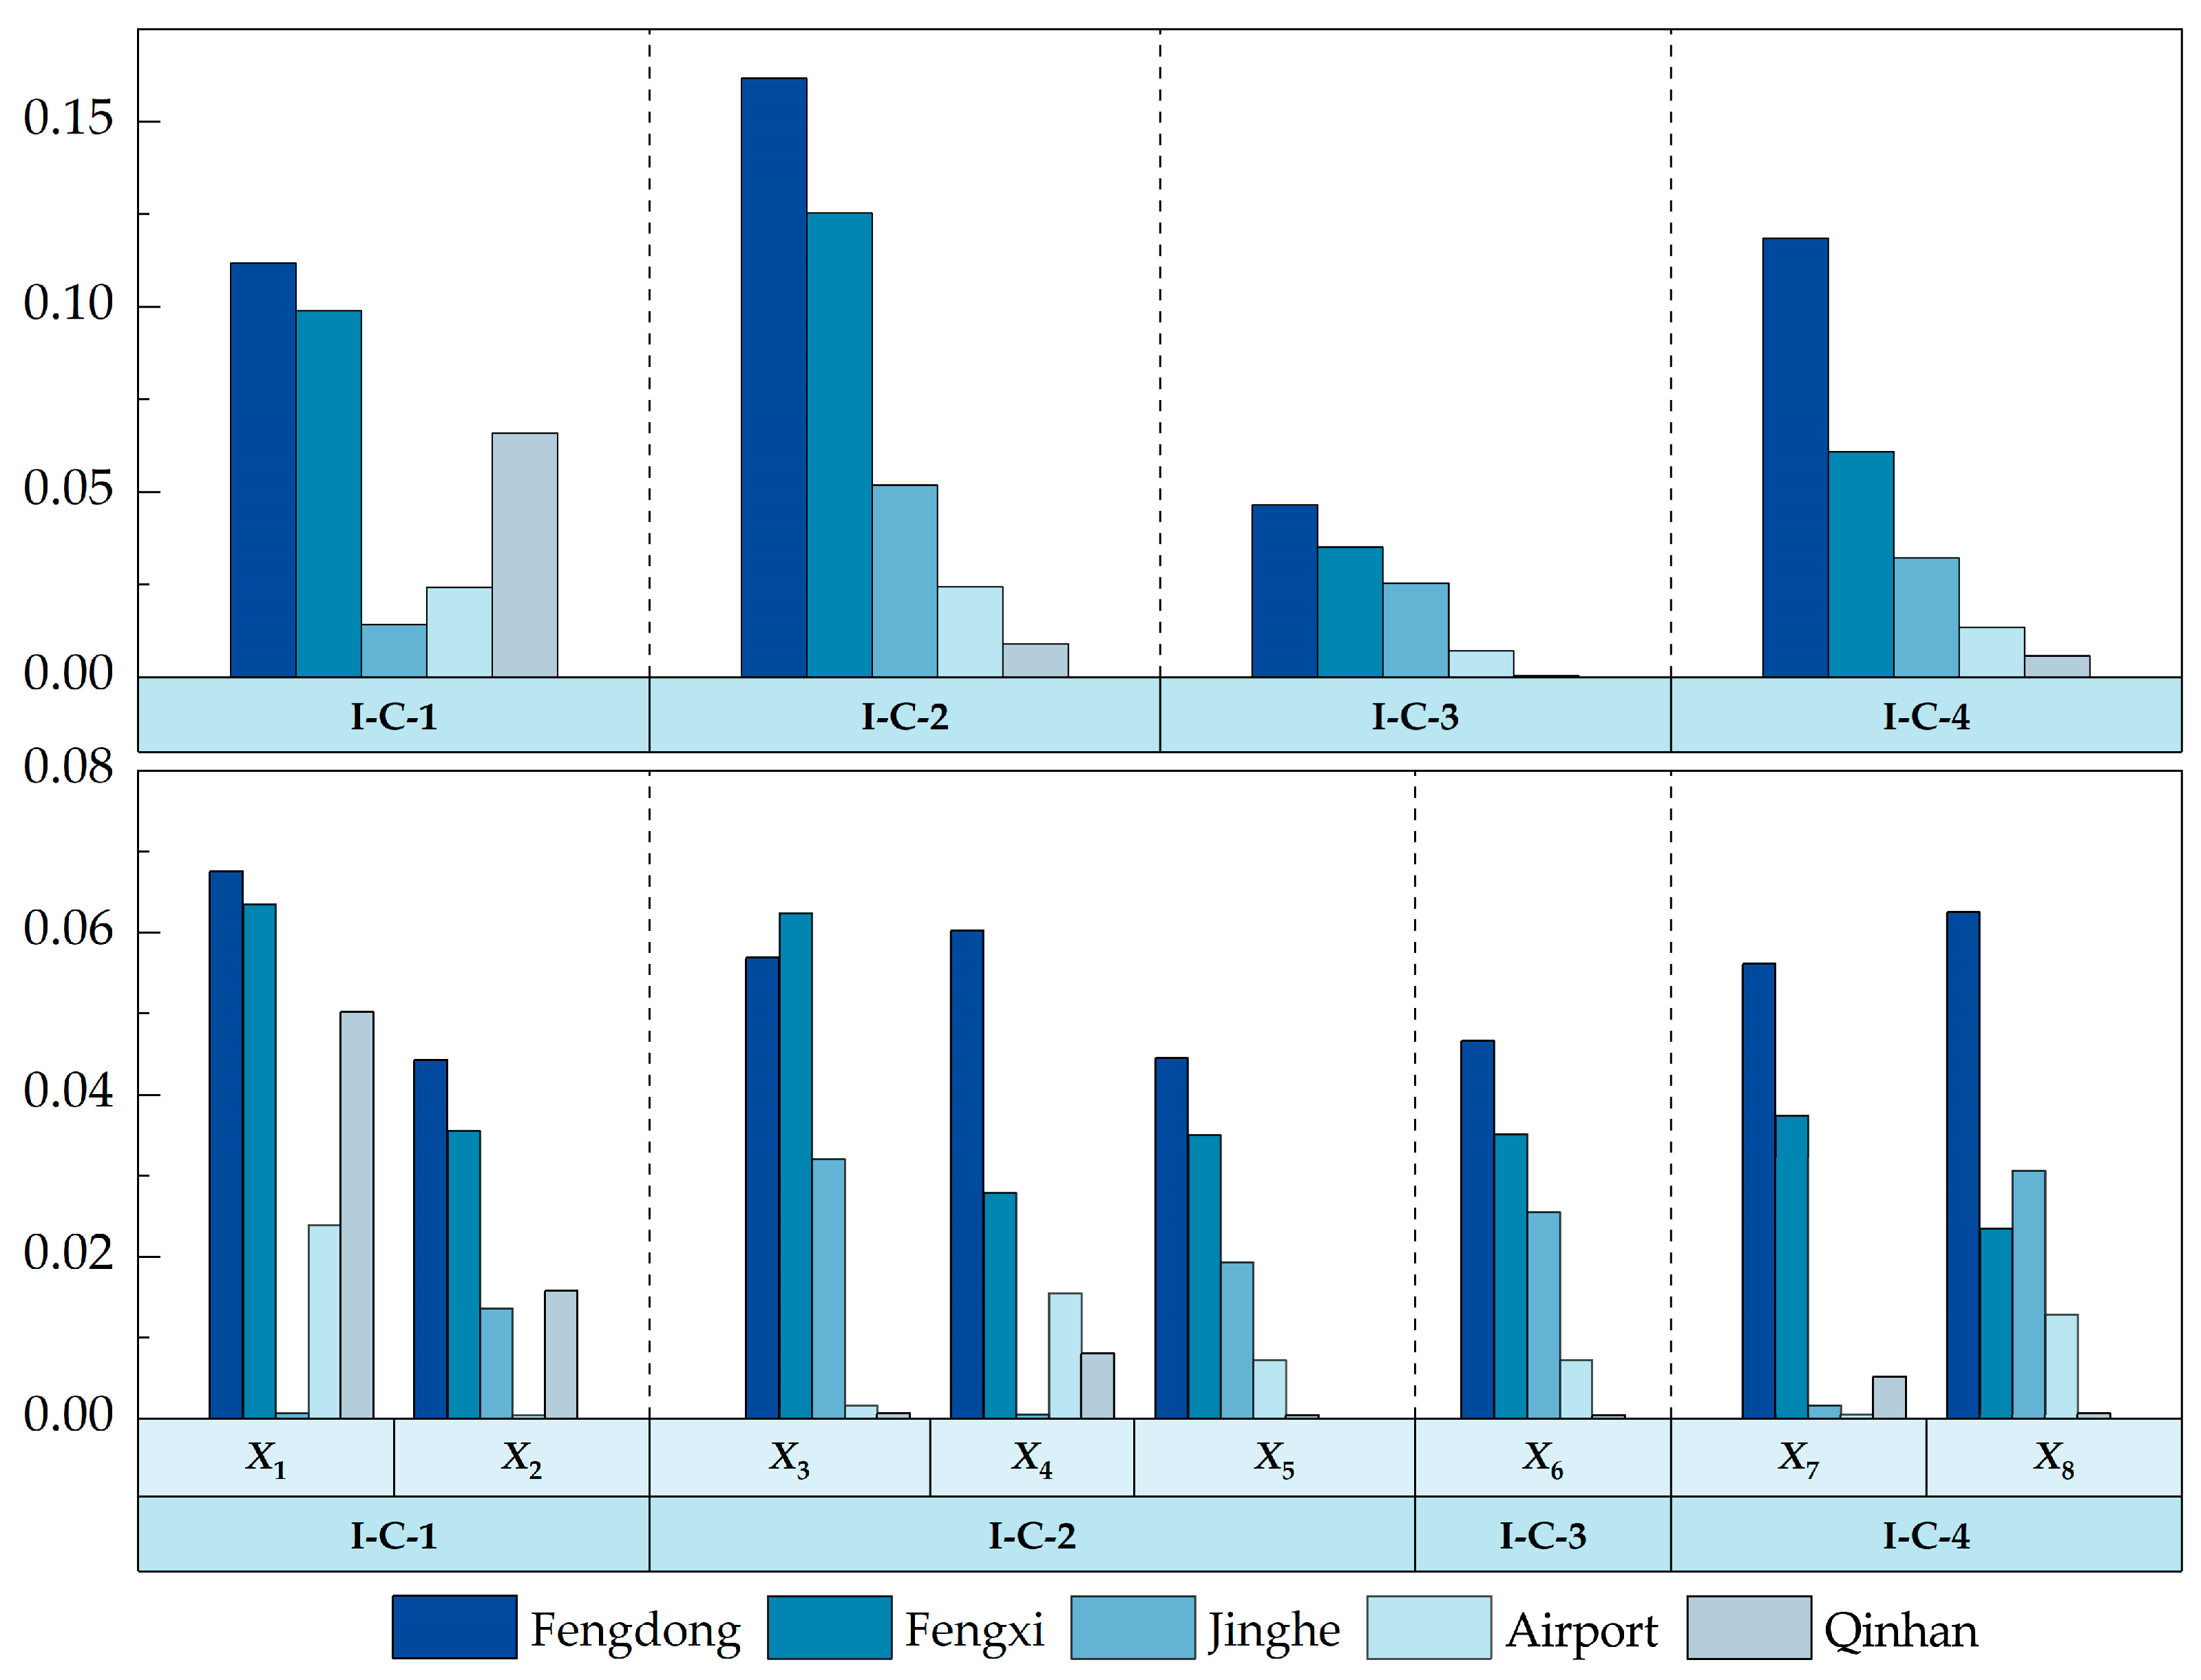
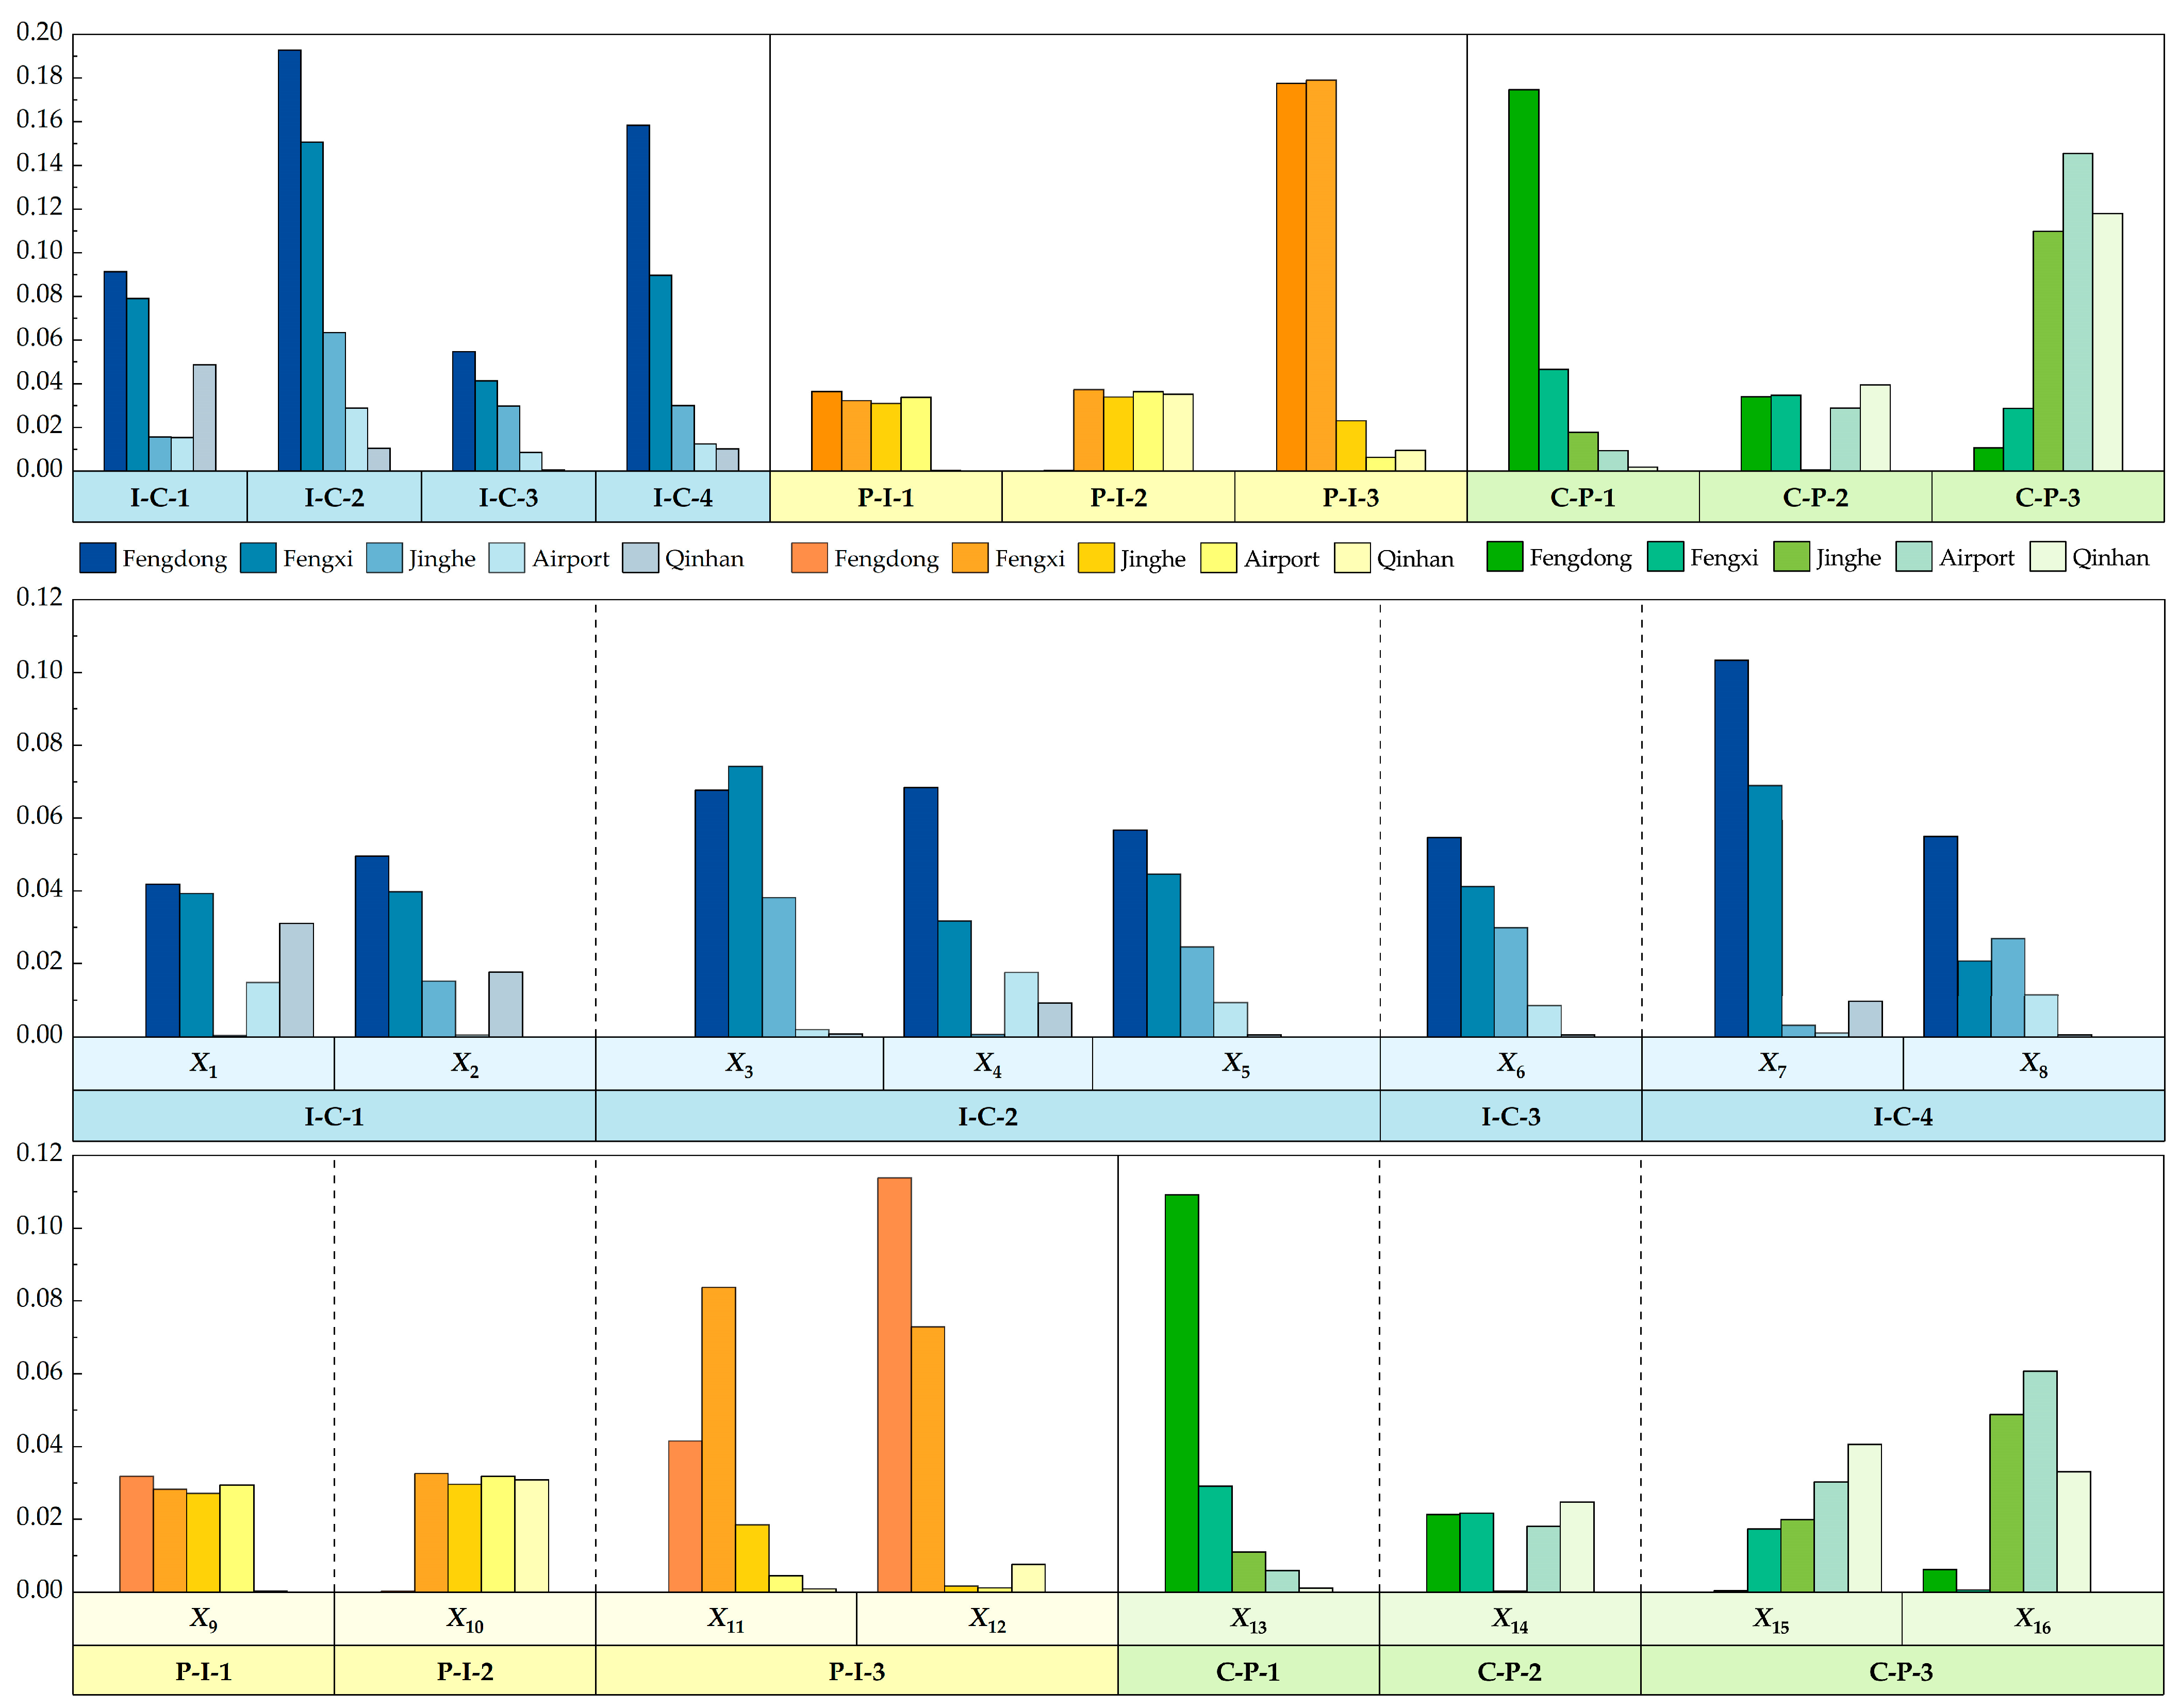
| Entropy | 0.0414 | 0.0491 | 0.0735 | 0.0677 | 0.0561 | 0.0541 | 0.1024 | 0.0544 |
| CRITIC | 0.0669 | 0.0439 | 0.0618 | 0.0597 | 0.0441 | 0.0462 | 0.0555 | 0.0619 |
| Indicator | X9 | X10 | X11 | X12 | X13 | X14 | X15 | X16 |
| Entropy | 0.0327 | 0.0323 | 0.0829 | 0.1127 | 0.1081 | 0.0323 | 0.0402 | 0.0601 |
| CRITIC | 0.0685 | 0.0487 | 0.1074 | 0.0578 | 0.0841 | 0.0901 | 0.0408 | 0.0626 |
| Dimension | I–C–P | I–C | P–I | C–P | ||||
|---|---|---|---|---|---|---|---|---|
| Method | CRITIC | Entropy | CRITIC | Entropy | CRITIC | Entropy | CRITIC | Entropy |
| CRITIC | 1 (0.019 **) | 0.738 (0.077 *) | 1 (0.017 **) | 1 (0.017 **) | 1 (0.017 **) | 1 (0.017 **) | 1 (0.017 **) | 0.8 (0.083 *) |
| Entropy | 0.738 (0.077 *) | 1 (0.019 **) | 1 (0.017 **) | 1 (0.017 **) | 1 (0.017 **) | 1 (0.017 **) | 0.8 (0.083 *) | 1 (0.017 **) |
| Area | Fengdong New City | Fengxi New City | Jinghe New City | Airport New City | Qinhan New City | Xixian New Area |
|---|---|---|---|---|---|---|
| City–Industry Integration | 0.8217 | 0.6467 | 0.2959 | 0.2468 | 0.2088 | 0.4440 |
Disclaimer/Publisher’s Note: The statements, opinions and data contained in all publications are solely those of the individual author(s) and contributor(s) and not of MDPI and/or the editor(s). MDPI and/or the editor(s) disclaim responsibility for any injury to people or property resulting from any ideas, methods, instructions or products referred to in the content. |
© 2025 by the authors. Licensee MDPI, Basel, Switzerland. This article is an open access article distributed under the terms and conditions of the Creative Commons Attribution (CC BY) license (https://creativecommons.org/licenses/by/4.0/).
Share and Cite
Ma, X.; Wu, X.; Cui, P.; Zhao, D.; Liu, K.; Ni, Q.; Wang, T. A New Framework for Evaluating City–Industry Integration in New Urban Districts: The Case of Xixian New Area, China. Sustainability 2025, 17, 2882. https://doi.org/10.3390/su17072882
Ma X, Wu X, Cui P, Zhao D, Liu K, Ni Q, Wang T. A New Framework for Evaluating City–Industry Integration in New Urban Districts: The Case of Xixian New Area, China. Sustainability. 2025; 17(7):2882. https://doi.org/10.3390/su17072882
Chicago/Turabian StyleMa, Xue, Xin Wu, Peng Cui, Dan Zhao, Kewei Liu, Qingsong Ni, and Tingting Wang. 2025. "A New Framework for Evaluating City–Industry Integration in New Urban Districts: The Case of Xixian New Area, China" Sustainability 17, no. 7: 2882. https://doi.org/10.3390/su17072882
APA StyleMa, X., Wu, X., Cui, P., Zhao, D., Liu, K., Ni, Q., & Wang, T. (2025). A New Framework for Evaluating City–Industry Integration in New Urban Districts: The Case of Xixian New Area, China. Sustainability, 17(7), 2882. https://doi.org/10.3390/su17072882