Abstract
Risk-taking is a critical driver of sustainable development and financial performance for firms, especially under environmental degradation constraints. Despite the increasing implementation of green credit policies, their impact on corporate risk-taking remains underexplored in the existing literature. This study investigates the effects and underlying mechanisms of green credit policies on risk-taking behaviors among Chinese listed companies from 2009 to 2019. Utilizing econometric methodologies, including Difference-in-Differences, mediation analysis, and moderation analysis, the findings reveal that green credit policies significantly enhance the risk-taking activities of polluting enterprises. These results are robust across various sensitivity tests. Additionally, the relationship between green credit policies and corporate risk-taking is mediated by debt maturity mismatch and moderated by ESG and executive compensation. Subgroup analyses indicate that large and state-owned polluting enterprises experience greater increases in risk-taking compared to their small, medium-sized, and private counterparts. Furthermore, executive remuneration notably amplifies risk-taking in private firms. This research provides essential micro-level insights to optimize the effectiveness of green credit policies in promoting corporate risk-taking and advancing sustainable development.
1. Introduction
China’s rapid economic development during the initial phase of reform and opening up has led to significant environmental challenges [1]. In response, the Chinese government is now focused on curbing high pollution levels and promoting green, low-carbon production methods [2,3]. Finance, as the lifeblood of the real economy, plays a vital role in modern economic development. The green transformation and sustainable growth of an economy are inherently linked to the strength of its financial system. By the end of 2023, China’s green loan balance reached CNY 30.08 trillion, with loans for projects that directly or indirectly reduce emissions totaling CNY 10.43 trillion and CNY 9.81 trillion, respectively. These figures represent 67.3% of total green loans, highlighting their importance in advancing China’s green transformation and societal progress.
The rapid expansion of green credit businesses and products not only enhances the overall quality of green finance in China but also meaningfully impacts the direction of its real economy [4], garnering considerable academic interest. Research shows that green credit plays a vital role in reducing carbon emissions [5,6] and significantly affects corporate behaviors, including innovation [7,8], debt financing [9,10], and productivity [11,12]. However, despite the increasing research on the relationship between green credit and firm behavior, there remains a gap in understanding how corporate decision-making attitudes adapt in response to uncertain business environments.
Corporate risk-taking, defined as the tendency of companies to pursue high profits while accepting potential losses in uncertain business environments [13], is reflected in investment decisions that often involve selecting high-risk, high-return projects [14]. Numerous studies show that corporate operations largely depend on risk-return assessments based on assumptions about future uncertainties. In the context of green development, increased risk-taking can promote technological advancement, accelerate the accumulation of social capital, maintain high levels of economic productivity, and underpin sustainable long-term economic growth [15,16]. Therefore, examining enterprises’ willingness to make investment decisions in ambiguous business scenarios has significant economic and practical implications.
Green credit is designed to conserve resources and mitigate pollution [17]. This mechanism encourages polluting enterprises to reduce energy consumption, thereby delivering both economic and ecological benefits [18,19]. To promote the robust and systematic growth of green credit and enhance the positive role of credit resources in economic restructuring, China has implemented various green credit policies. Notable among these are the “Green Credit Guidelines”, issued by the original China Banking Regulatory Commission in 2012, which mandate banking financial institutions to adopt nuanced and adaptive credit management strategies for sectors with significant environmental vulnerabilities [20]. This includes reallocating credit assets across industries, strictly limiting credit investments in polluting sectors, and guiding the sustainable development of these industries.
As a cornerstone in advancing the green economy, green credit policies perform intrinsic financial functions such as resource allocation, risk management, and market pricing, while also aligning with market-driven environmental regulatory directives. Consequently, they significantly influence micro-organizational behavior [7,9]. Green credit policies inevitably affect corporate investment, production, and innovation by reallocating resources from high-pollution, outdated production capacities to new, sustainable energy sources. They guide firms toward Pareto-optimal decisions, encourage sustainability, and facilitate the green transformation of economic growth [11,12]. These policies have led to increasingly stringent credit access requirements for polluting enterprises, compelling them to reduce emissions and control pollution [5,21]. The necessity for pollution control and emission reduction pressures these firms to transform, altering their development costs and expected profits. As a result, they must reformulate investment decisions [22], leading to changes in their risk-taking behaviors. Thus, green credit policy likely influences corporate risk-taking.
While existing studies have extensively examined the factors influencing corporate risk-taking and the economic effects of green credit policy separately, few have explored the impact of green credit policy on corporate risk-taking. This paper investigates how green credit policies affect the risk-taking behavior of polluting companies. Specifically, it examines whether these policies influence risk-taking through debt maturity allocation and whether executive compensation and ESG incentives modulate this relationship. Additionally, the study assesses whether the effects of green credit policies on corporate risk-taking vary across different ownership structures and enterprise sizes. Using the “Green Credit Guidelines” issued in 2012 as a quasi-natural experiment, this research analyzes Chinese listed firms in the A-share market from 2009 to 2019. Our study reveals that green credit policies significantly increase the risk-taking behavior of polluting companies, with the findings remaining robust across various tests. Mechanism analysis confirms that these policies amplify risk-bearing by exacerbating discrepancies in corporate debt maturity. In addition, we find that ESG positively moderates the relationship between green credit policy and corporate risk-taking, while executive compensation incentives negatively moderate the relationship. Furthermore, we find that the effect of green credit policies on risk-taking is more pronounced in larger and state-owned companies. Notably, executive compensation incentives substantially enhance risk-taking in non-state-owned companies.
The contributions of this paper are threefold. Firstly, this research deepens the understanding of how green credit policies influence micro-organizational behavior. It not only clarifies how these policies incentivize or regulate corporate environmental practices but also elucidates the mechanisms through which green credit policies impact micro-enterprises. Additionally, it provides empirical evidence demonstrating the effective linkage between macro-level policies and micro-entities. Secondly, this paper constructs a framework that links executives, corporate behavior, and green finance, and studies the mechanisms by which green credit policies affect corporate risk-taking from the perspectives of investment and financing terms, executive incentives, and corporate heterogeneity. Thirdly, the study identifies two distinct outcomes of the principal–agent problem in the context of environmental regulation: promotion and inhibition. In large and state-owned enterprises, higher executive compensation incentives may not yield the anticipated positive effects due to moral hazard and information asymmetry. Executives in these enterprises are more likely to choose low-risk options, thereby mitigating the positive effect of green credit policies on corporate risk-taking. Conversely, in non-state-owned enterprises, the strong competitive motivation provided by tournament incentive mechanisms can enhance the positive effect of green credit policies on corporate risk-taking, as executives seek future promotion opportunities and salary remuneration. Based on this analysis, the study advocates for precise adjustments in policy implementation, the enhancement of the regulatory framework for environmental policies, and provides empirical evidence to assist relevant departments in further refining green credit policies.
2. Literature Review
To date, limited research has examined the impact of green credit policy on corporate risk-taking, with more studies focusing on the factors influencing corporate risk-taking and the economic effects of green credit policy. The existing literature explores these factors from both internal and external perspectives. Internal factors primarily involve managers’ incentives, characteristics, and experiences [23,24,25]. Appropriate incentives can mitigate managers’ risk aversion driven by personal interests. Scholars have investigated how different incentives—such as equity, promotion, and salary—affect corporate risk-taking. Changes in ownership structure also play a role; evidence suggests that when executive shareholding surpasses a critical threshold, it negatively impacts corporate risk-taking [26]. Promotion incentives are positively correlated with corporate risk-taking, with tournament incentive mechanisms having a more pronounced effect [27]. However, compensation incentives present mixed outcomes. Some argue that they align management interests with shareholders, thereby enhancing managers’ willingness to take risks [28]. Others contend that compensation incentives do not reduce risk aversion, leading managers to prefer less risky projects and avoid those with high risks and long cycles [29]. Additionally, managerial characteristics such as age and gender influence corporate risk-taking. Serfling [30] found that managers’ willingness to take risks decreases with age, while Faccio et al. [31] demonstrated that female managers tend to be more conservative than their male counterparts. Individual decision-making is also shaped by psychological factors and personal preferences, which can be altered by managers’ experiences [24]. For instance, Roussanov and Savor [32] and Bernile et al. [33] argue that CEOs with diverse career experiences, including varied marital and life experiences, are more likely to promote corporate risk-taking. External factors encompass economic development, policy initiatives, and the institutional environment. A strong macroeconomy, characterized by sufficient production factors, high expected returns, and manageable risks, encourages firms to increase their risk-taking [34]. Additionally, monetary policy and government subsidies are critical external determinants of corporate risk-taking [35,36]. Institutional factors such as investor protection, property rights, and contract systems also promote corporate risk-taking [37,38].
Second, the existing literature provides an in-depth analysis of the economic effects of green credit policy, including its influence on corporate innovation, financing investment, and environmental pollution. Green credit policy can promote green technology innovation in firms [8]. However, its impact on enhancing the quality of green technology innovation is not clear [39]. From a constraint and cost-effect perspective, green credit policy may inhibit enterprise innovation [40]. Additionally, it affects financing investment and financing decisions [6,10], leading to significant reductions in investment levels, interest-bearing debt, and long-term debt of polluting enterprises. This has promoted the social effects of environmental protection and decreased energy emissions from polluting enterprises [6,22]. In addition, the implementation level of green credit policy needs to pay special attention to the potential impact of the phenomenon of corporate greenwashing. While green credit policy promotes green transformation of firms through the dual mechanism of incentives and constraints, it may also induce some enterprises to make symbolic environmental commitments through strategies such as manipulation of environmental information disclosure and speculation on environmental certification [41,42]. The phenomenon of corporate greenwashing essentially constitutes a deviation between environmental commitments and actual actions, which not only deflates the effect of the policy, but may also distort corporate risk-taking, leading to the lack of substantive environmental inputs by the enterprises that obtain credit resources, and ultimately facing greater risks of technological substitution and regulatory compliance risks [43].
The existing literature examining the linkage between green credit policy and risk-taking has produced significant findings but also displays some limitations. Firstly, the extant literature on corporate risk-taking has predominantly focused on macroeconomic conditions, institutional frameworks, and managerial incentive structures, while devoting comparatively less attention to environmental regulatory influences. Furthermore, the mechanisms through which green credit policies affect corporate risk-taking remain underexplored, particularly regarding heterogeneous effects across industrial sectors. Existing studies have predominantly identified policy-driven enhancements in risk-taking among environmentally sustainable enterprises through mechanisms such as financial constraint mitigation and green innovation incentivization. However, systematic investigations into the risk-tanking of heavily polluting firms—especially those navigating regulatory compliance pressures and technological transition dilemmas—remain conspicuously limited in empirical validation. Secondly, while existing studies have evaluated the micro-level impacts of green credit policies—such as their effects on enterprise research and development innovation, investment, financing, and total factor productivity—these studies have not fully explored the impact of green credit policies on corporate investment decision-making behavior. By investigating the influence and micro-channels of green credit policies on corporate risk-taking, this study broadens the scope of existing research and enriches the literature on how these policies shape corporate behavior.
3. Theoretical Analysis and Research Hypothesis
3.1. Green Credit Policy and Corporate Risk-Taking
The greater the risk an organization takes, the higher its drive for innovation and its commitment to strategic transformation [44,45]. An organization’s decision-making ability is crucial for adjusting its risk-taking behavior. Investment decisions reflect a company’s willingness to assume risk, with rational choices made based on prevailing circumstances [46]. However, the introduction of environmental regulations can reduce the anticipated returns of certain investment projects, directly influencing corporate investment decisions and altering the level of risk-taking within enterprises. For example, let Ra represent the anticipated return of business decision A. When environmental regulations are introduced, the projected return of decision A may change due to factors such as altered investment levels, financing conditions, and increased financing costs. Even if the firm still aims to achieve the benefits Ra before the implementation of environmental regulations, it might be compelled to choose option B, which entails a higher level of risk, thereby increasing the company’s willingness to engage in risk-taking. In summary, green credit policy requires banking and financial institutions to extend green credit based on an enterprise’s pollution emissions. Enterprises that have not secured green credit may need to reduce their pollution emissions by raising the credit access threshold and tightening credit financing channels. Those that fail to obtain green credit will face persistent credit constraints, including higher market interest rates and reduced money supply. These limitations will influence their investment decisions and modify their propensity for risk-taking.
Unlike command-based environmental regulation, green credit policies guide the allocation of funds to fulfil ecological and environmental governance roles through resource allocation, risk management, and market pricing, while also aligning with market-driven environmental regulatory directives. As capital is allocated from highly polluting and energy-intensive areas to green and sustainable areas, corporate investment, production, and innovation will inevitably suffer. This suffering reduces the funds available for production, investment, and other corporate activities [47], consequently diminishing enterprise performance. While the primary aim of the Guidelines is to internalize environmental costs and curb the unregulated expansion of high-polluting and energy-intensive industries and projects, they do not seek to eliminate polluting enterprises entirely [48]. Long and Wan [49] developed the Cournot model and found that environmental regulations increase the exit risk for polluting companies. Green credit policy, as a regulatory measure that leverages market mechanisms to address environmental issues, has significantly altered the behavioral decisions of polluting enterprises within the credit market by making previously externalized environmental costs explicit and internalizing them [47]. According to Kahneman and Tversky’s [50] prospect theory, the implementation of green credit policies often prompts polluting enterprises to actively pursue green transformation to meet the green credit requirements set by banking and financial institutions, rather than remaining passive. Consequently, companies must increase their investments in green technology innovation to fundamentally achieve pollution and emission reduction. The initial investment in green technology innovation is typically substantial and carries significant risks, especially under financing constraints. These enterprises are required to endure heightened financial pressure to achieve technological breakthroughs [7], thereby escalating corporate risk-taking. Furthermore, drawing on the cost burden effect inherent in neoclassical economics, environmental regulations directly influence corporate production costs, distribution expenses, and profits. This, in turn, guides enterprises toward green transformation in their production and operational methods. Specifically, policies such as green credit that limit corporate pollution emissions or impose pollution standards necessitate companies to either upgrade or shut down heavily polluting production equipment. This could potentially result in companies experiencing a temporary or permanent loss of production capacity [40]. To avoid potential environmental regulatory penalties, enterprises often adopt production processes and techniques that promote cleaner and more energy-efficient methods, thereby increasing their risk exposure. While environmental regulations may initially raise operational costs, the long-term benefits of green technology, improved production processes, and sustainable procedures are manifold. These benefits include reduced pollution emissions and enhanced economic efficiency, providing substantial incentives for businesses to transition toward sustainability [48,51]. Consequently, policies promoting green credit can enhance corporate risk-taking. Polluting firms may find it challenging to reduce emissions and regulate pollution if they opt for initiatives with minimal risks and expected rewards. Over time, the difficulties associated with obtaining credit funds for polluting businesses worsen, leading to a gradual decline in their operating funds. As returns steadily decline, the risks and expenses associated with projects increase. When polluting firms adopt emission reduction and pollution management strategies, they often pursue high profits at the expense of higher risks, necessitating greater expenditures of time and money and thereby increasing corporate risk-taking in the long run.
Green credit internalizes the negative externalities generated by enterprise pollution emissions, dynamically adjusts the cost of pollution through the establishment of environmental access thresholds and the double constraint mechanism of credit quota control [52], and achieves the initial and full-cycle management of pollution mainly through two channels of incentive and constraint effects. Following the introduction of green credit policies, polluting companies may re-allocate funds from other investment projects to enhance their investments in emission reduction and pollution control. This reallocation aims to meet the credit access requirements set by banks, resulting in a phenomenon known as crowding out [53]. In response to this crowding out effect, companies typically do not proportionally reduce the scale of their project investments. Instead, they make counter-adjustments based on adjustment costs, ensuring that the net returns of various investment projects remain marginally positive [54]. Companies often shift funds from low-risk projects to environmental protection investments, thereby increasing their risk-taking. These environmental projects include research and development (R&D) costs, procurement expenses, and other management-related expenditures. Notably, the management costs associated with environmental protection projects are generally higher than those of standard investment projects [55]. However, Porter’s hypothesis suggests that the compensatory benefits from environmental protection investments often outweigh the cost implications of environmental regulations [56]. The R&D of energy-saving and emission reduction technologies, clean production methods, and environmental protection equipment can not only reduce production and compliance costs imposed by environmental regulations but also improve the input–output ratio, thereby maximizing corporate value. Consequently, companies are inclined to increase their financial investments in environmental protection projects, which in turn amplifies corporate risk-taking.
Hypothesis 1:
The promulgation of the Guidelines will increase the risk-taking of polluting enterprises.
3.2. The Influence Path of Green Credit Policy and Corporate Risk-Taking
China’s bank-led financial system determines that the effect of green credit policy depends not only on the stringency of the policy itself, but also on multiple factors such as the implementation of the bank and the response strategy of micro-enterprises, and directly affects the allocation of credit resources of green credit policy, which in turn plays a role in enterprise risk-taking. Following the introduction of the Green Credit Policy, banks have tended to decrease the credit supply to polluting enterprises. To secure credit resources, enterprises may underreport or omit pollution emission data, thereby increasing information asymmetry between banks and these companies [57]. According to the information asymmetry theory of debt maturity structure, borrowers with obscure information are more likely to pose significant moral hazard challenges to lenders [58,59]. However, to mitigate the exit risk of these enterprises and promote their environmental transformation, banks have also been observed to shorten the debt maturity for polluting enterprises [60,61,62]. Short-term debt can constrain opportunistic management behavior by forcing borrowers to repeatedly renew and negotiate with lenders, thereby reducing supervision costs and enhancing lenders’ informational advantages [57]. Consequently, banks may choose to shorten the debt maturity of polluting enterprises to manage their own risks. However, this shortening of debt maturity increases the credit burden on these enterprises, requiring higher capital return rates for projects and thereby escalating corporate risk-taking. Specifically, during the green transformation process, mismatched debt maturities resulting from shortened terms introduce two significant financial risks: debt repayment pressure and rollover costs. Enterprises must repay debts within shorter periods, potentially leading to insufficient cash inflows to cover outflows, which exacerbates production and operational risks [63,64,65] and increases the risk-taking of polluting enterprises. Companies that use short-term debt for long-term investments face the payback periods of their projects, and the continuous renewal of short-term debt can intensify both operational and liquidity risks, prompting inefficient investments and escalating risk tolerance. Consequently, following the introduction of the Green Credit Guidelines, banks may increase the short-term debt of polluting companies while reducing their long-term debt. This results in a mismatch of debt maturities within these companies, thereby heightening their risk tolerance.
Hypothesis 2:
The Guidelines may cause the mismatch of debt maturity of polluting enterprises and affect risk-taking.
In the context of green development, financial institutions take into account the ESG responsibility performance of firms when assessing their credit risk and allocating credit funds [66]. The influence of green credit policies has been demonstrated to result in heavily polluting firms facing harsher financing constraints, while firms with higher ESG ratings have been shown to pay more attention to environmental issues and demonstrate greater potential for green innovation, and are more likely to receive credit funds [67]. Specifically, for enterprises with high ESG ratings, their high governance transparency, perfect fulfilment of social responsibility, and sound corporate governance structure can effectively reduce the information barriers between financial institutions and companies [68], and enhance the trust of financial institutions in their green transformation prospects. Such companies are more likely to obtain sustainable credit support, and then enhance their core competitiveness through substantial green innovation paths [69], such as low-carbon technology development, cleaner production process modification, etc., thus forming a positive cycle of “policy incentives–green innovation activities–innovation success” and “improvement of innovation success” [68]. This, in turn, gives rise to a positive cycle of “policy incentives–green innovation activities–increased innovation success”. In addition, ESG ratings can play the role of informal regulation through external market incentives and supervision and management mechanisms to reshape the business philosophy of firms. The concept of green development will be implemented into the enterprise strategic planning and business behavior, driving firms to take the initiative to carry out the green transformation [70]. In addition, enterprises with high ESG ratings demonstrate enhanced cash flow robustness and more rational long-term debt structures in comparison to those with low ratings [71]. Their superior financial stability offers a buffer against short-term debt fluctuations triggered by innovative activities, thereby amplifying their propensity to assume risk.
Hypothesis 3:
ESG ratings has a moderating effect between green credit policy and corporate risk-taking.
According to the homo economicus hypothesis, senior executives are less inclined to abandon high-risk initiatives with substantial estimated net present values, even when the assumed risk is elevated. Unlike shareholders, who can mitigate risk through diversified investment portfolios, executives must bear the full responsibility for the company’s risk-related decisions. The presence of moral hazard and adverse selection often leads executives to misuse company resources for personal gain, to the detriment of shareholders [15,72]. This issue is particularly pronounced in the context of environmental regulations, which can intensify the agency conflict between shareholders and executives, thereby influencing corporate risk-taking behavior.
Executive pay incentives, a crucial element of compensation contracts, significantly affect the self-interest and risk appetite of company executives [73]. These incentives play a pivotal role in addressing the principal–agent problem between management and shareholders [74]. However, under environmental regulations, executives often exhibit inherent risk-averse tendencies in decision-making [75], further exacerbating the agency conflict. The financial characteristics of environmental technology research and development, such as large capital investments, long cycles, and uncertain returns, along with the upgrading of environmental protection equipment, can diminish executives’ willingness to engage in environmental governance. This is especially true when the costs of environmental protection investments exceed their benefits, leading executives to prefer transferable investments over substantive environmental initiatives [76], and even generates greenwash. According to the constant income theory, executives’ spending patterns change as their compensation increases. Executives typically minimize decision-making risks to preserve their high incomes, particularly when environmental legislation imposes constraints on polluting companies, making executives more cautious [77]. Consequently, when faced with environmental regulations, executives may reassess the potential negative outcomes of environmental protection initiatives due to their increased salaries. This reassessment could result in a pessimistic outlook towards such projects, leading executives to disengage from high-risk yet high-return environmental protection endeavors [29]. Such a shift would reduce corporate risk-taking.
Hypothesis 4:
Executive compensation incentive has a moderating effect between green credit policy and corporate risk-taking.
The overall logical structure of this study is presented in Figure 1.
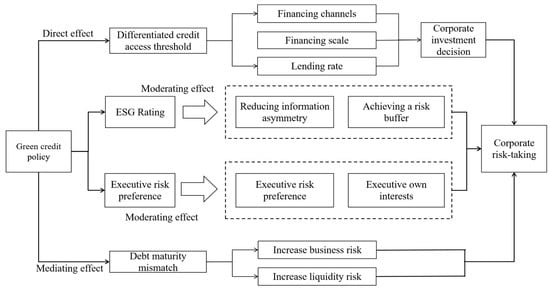
Figure 1.
Detailed logical structure of this study.
4. Research Design
4.1. Sample and Data
This paper establishes a quasi-natural experiment centered on China’s 2012 Green Credit Guidelines implementation. In response to significant changes in the economic environment, firms adjust their willingness to take risks according to their risk perception and preferences. To eliminate external disturbances, this study excludes the impact of the 2008 international financial crisis and the 2020 COVID-19 pandemic. Consequently, the data sample comprises A-share listed firms from 2009 to 2019. The research sample is selected as follows. Firstly, companies classified as ST, ST*, and PT, indicating financial distress, are excluded [78]. Secondly, financial companies are omitted from the analysis. Thirdly, firms with abnormal Return on Assets (ROA) are excluded to ensure data reliability. Finally, the study includes 6456 observations. Data were obtained from the CSMAR database and the China Statistical Yearbook. All continuous variables are winsorized at the 1% and 99% levels to mitigate the effect of extreme values.
Since corporate emission data are based on voluntary disclosures and are not readily accessible, this paper calculates pollutant emission intensity to establish experimental and control groups through linear standardization and aggregation of various pollutant emission data. Specifically, data on industrial sulfur dioxide emissions, industrial smoke (powder) dust emissions, industrial nitrogen oxide emissions, industrial wastewater emissions, and industrial solid waste emissions from the year preceding the policy implementation (2011) are selected, linearly standardized, and summed to compute the industrial pollution emission intensity. This approach ensures objective group classification. The specific calculation steps are as follows.
Firstly, according to the method of Formula (1), the unit output value of industrial pollutants is calculated. represents the unit output value of pollutant in industry , is the emission of pollutant in industry , and is the total output value of industry .
Secondly, according to the calculation method of Formula (2), the unit output value emissions of industrial pollutants are standardized, and is the standardized value of .
Finally, according to the calculation method of Formula (3), the data of unit output value of various pollutants are summed up; is the maximum value of main pollutant in all industries, is the minimum value of main pollutant in all industries, and is the pollution emission intensity of industry ; .
According to the above Formula of accounting, select the median industry pollutant emission intensity of the following groups: industries for polluting industries, divided into the experimental group; industry for non-polluting industries, divided into the control group. Table 1 shows the division results of industrial pollutant emission intensity.

Table 1.
Results of industry pollution intensity division.
4.2. Models and Variables
This paper uses the DID method to explore the effect of green credit policy on corporate risk-taking. The following regression model is constructed to prove the hypothesis.
where represents the level of corporate risk-taking, the subscript represents the enterprise, and represents the year. is a difference-in-differences variable. is a series of control variables. is the fixed effect of individual. is time fixed effect. is a random perturbation term.
4.2.1. Explained Variable: Corporate Risk-Taking Level
By combing the existing literature, the indicators to measure corporate risk-taking mainly include earnings volatility [15,45], volatility of stock returns [79,80], and asset–liability ratio [46]. The higher the risk-taking level of the corporate, the higher the uncertainty of the earnings value of the operating assets or the income generated by the investment opportunities in the future. Considering the volatility of the Chinese stock market, the risk-taking level of Chinese enterprises is widely used to measure earnings volatility. Therefore, this research uses the volatility of corporate earnings (ROA) to measure corporate risk-taking. where is the ratio of earnings before interest and tax (EBIT) of firm in year to the firm’s total assets at the end of the year (ASSET). Referring to the research of John et al. [15] and Yu et al. [45], this study subtracts the annual average of the industry from according to the calculation method of Equation (5) to obtain to mitigate the effect of the industry and the cycle.
This paper follows the practice of Faccio et al. [46] and He et al. [81]. The standard deviation (Risk1) and range (Risk2) of the adjusted are calculated using a three-year ( to years) rolling calculation. The specific calculation methods are Formulas (6) and (7); we multiply the results by 100, and take the logarithm.
4.2.2. Explanatory Variable: Green Credit Policy
The interaction term between the group dummy variable and the time dummy variable () is used as the explanatory variable of this paper, denoted as , which represents the policy effect of green credit policy on corporate risk-taking. is a time dummy variable, defined as 0 in the years before policy implementation (2009–2011) and 1 in other years (2012–2019). is the group dummy variable. According to the previous industry pollutant emission intensity grouping, the experimental group enterprise value is 1, and the control group enterprise value is 0.
4.2.3. Control Variables
Reference to the relevant literature on influencing factors of corporate risk-taking [45,82,83,84]. The control variables in Model (4) include variables that may affect corporate risk-taking at the enterprise level and the city level. Enterprise level: Enterprise age (Age); Enterprise size (Size); Debt ratio (Debt); Corporate profitability (Roe); Ownership concentration (Top); Enterprise growth (Growth); Capital expenditure (CAP). City level: Urban industrial structure (Secgdp); Urban per capita GDP (Lpgdp); Urban employed population structure (Secpop).
4.3. Descriptive Statistics and Parallel Trend Test
Table 2 shows the descriptive statistical consequences of the main variables. The mean value of enterprise risk-taking level is 1.3127, and the maximum and minimum values are 3.5808 and 0.1993, respectively, consistent with the existing research results [45,81]. The control variables at the corporate level and the control variables at the city level are consistent with the existing research results [81,83].
Table 2.
Descriptive statistics of main variables.
5. Empirical Results
5.1. Baseline Regression
Table 3 shows the baseline regression findings. Individual and time fixed effects are controlled in Columns (I)–(III). In Column (I), we do not add any control variables. The estimated coefficients for green credit policy (DID) are 0.122 and 0.138, respectively, both significant at the 1% level. In Column (II), we added control variables at the enterprise level, and the coefficients were 0.116 and 0.132, respectively, at the 1% level. This means that for each standard deviation increment in the green credit policy, there is a corresponding increase of approximately 4.31% and 3.57% in the risk-taking behavior of polluting enterprises. These findings align with the previously posited notion that the green credit policy will compel polluting companies to undertake green transformations, thereby escalating their risk-taking propensities. In Column (III), this paper adds control variables at the city level, and the estimated coefficients change little and are significant at the 1% level. Results from Table 3 display that the green credit policy significantly promotes corporate risk-taking, which is consistent with Hypothesis 1. After promulgating the green credit policy, polluting enterprises may face pressure to control emissions and eliminate pollution projects. Enterprises must choose between maintaining the status quo and green transformation. To pass the risk assessment, polluting enterprises need to raise investment in environmental protection and green development. Therefore, the risk-taking level of polluting enterprises increases significantly.
Table 3.
Baseline results.
5.2. Endogenous Issues
As a government policy, green credit policy is less affected by a single firm. The promulgation and implementation of the policy cannot serve a single firm. Hence, there is unlikely to be a reverse causality. This study tries to control the factors that may influence green credit policy and corporate risk-taking in Model (4), but it may still cause endogenous problems due to the bias of the results caused by missing variables. This study further uses the instrumental variable method to reduce this endogenous problem. The execution of policies is a multifaceted process, with the crux lying in the analysis and differentiation of factors that influence their successful implementation. Among these factors, the directive preference of local government officials plays a pivotal role, profoundly impacting both the execution and influence of policies [85,86]. Consequently, this paper focuses on local government officials as the omitted variables. Their measurement and observation are facilitated by examining the degree of government competition.
This paper uses provincial government competition as an instrumental variable (IV). Formula (8) reports its calculation method.
where IV is provincial government competition, is the per capita GDP of the province, is the highest per capita GDP of neighboring provinces, and is the highest per capita GDP of provinces in China.
The instrumental variable must satisfy both correlation and exogeneity criteria. Regarding correlation, the evaluation mechanism for Chinese government officials employs a relative performance standard based on local economic development. Local governments may prioritize short-term economic gains over green credit policies, especially when regional economic growth is sluggish. In such cases, they may emphasize economic growth at the expense of environmental protection. Conversely, in regions with higher economic growth, local governments are more likely to balance economic development with environmental protection, thereby promoting green credit policies. Chinese-style decentralization intensifies local economic competition and the drive for economic catch-up. Local governments tend to focus on areas with faster economic development to narrow regional economic disparities. According to the pollution haven hypothesis, the relocation and entry of enterprises directly impact regional output levels, leading to changes in regional economic growth. Therefore, government competition is inherently related to the green credit policies.
Regarding exogeneity, the core of local government competition lies in the political advancement of officials. While the prospects for political promotion do not directly influence corporate risk-taking, they can indirectly affect it through rent-seeking activities between local government officials and businesses. Local officials may pressure entrepreneurs to hire excessive staff and bear greater tax burdens to better meet political assessments. This bidirectional rent-seeking aims to maximize the interests of both officials and businesses through collusion. Green credit policies require banking financial institutions to allocate more credit resources to the green sector, which not only tightens financing constraints for polluting companies but also increases credit availability for green enterprises. Consequently, the implementation of green credit policies has reduced bidirectional rent-seeking activities between local government officials and businesses, indicating that the extent of government competition does not influence corporate risk-taking. Although the economic development direction of provincial governments may affect the decisions of municipal governments within the region, this paper controls for the per capita GDP of prefecture-level cities and finds no significant correlation between the per capita GDP of these cities and corporate risk-taking. Thus, the instrumental variables selected in this paper satisfy the assumptions of correlation and exogeneity.
Table 4 reports the two-stage regression results of instrumental variables. The results of the one-stage regression indicate that the estimated coefficients of the instrumental variables are significantly negative at the 1% level, validating the hypothesis that the instrumental variables are correlated. Results show that the coefficient of green credit policy is significantly positive at the level of 10%, which is consistent with the above-mentioned results. It is proved that the conclusion of this article is still valid after considering the endogenous problems. This study undertakes a weak instrument test and an identifiability test on the instrumental variables employed. The findings indicate that while there is no identifiability issue, there exists a problem with weak instruments. Consequently, this paper utilizes Limited Information Maximum Likelihood estimation (LIML), which exhibits less sensitivity to weak instruments. As demonstrated in the table, the coefficients of the IV estimation remain significantly positive.
Table 4.
Two-stage regression results of instrumental variables.
5.3. Robustness Test
Table 5 and Table 6 are the results of the robustness test, including the methods of the propensity score matching (PSM), the replacement of the explanatory variable, the replacement of the time window, the replacement of grouping criteria, and the Placebo test. The first is the PSM-DID. The DID method needs the choice of the experimental and control groups to be random when distinguishing groups. This article uses PSM to solve the self-selection problem between groups. Based on the research of Rosenbaum and Rubin, the absolute value of the deviation of each variable after matching is less than 20%, indicating that matching is better. All variables in this paper are less than 20%. Columns (1) and (2) in Table 5 display that the regression coefficients of the green credit policy are 0.213 and 0.239, respectively. They are notable at the 1% level. After further solving the self-selection problem of grouping, the consequences are consistent with the results in Table 3.
Table 5.
Robustness test results—part I.
Table 6.
Robustness test results—part II.
The second is the replacement of the explanatory variable. According to the measure of Faccio et al. [31], this paper chose every five years as a new observation period for rolling calculation. Columns (3) and (4) from Table 5 display that the regression coefficients of the green credit policy are 0.0559 and 0.0813, respectively. They pass the significance test, and the results agree with the consequences in Table 3.
The third is to change the time window. Although this study excludes the effect of the financial crisis and the new coronavirus epidemic on corporate risk-taking, other events may affect green credit policy and corporate risk-taking. This paper shortens the time window of the sample to 2010–2014. Columns (5) and (6) of Table 5 show that the regression coefficient of green credit policy (DID) is significantly positive at the level of 1%, which is in line with Table 3.
The fourth is to change the replacement of grouping criteria. Based on the six high energy-consuming industries published by the National Bureau of Statistics, the six high energy-consuming industries are classified as the experimental group, and others are classified as the control group. Columns (1) and (2) of Table 6 report that the regression coefficients of green credit policy are 0.135 and 0.152, respectively, which overtake the significance test. In addition, we refer to the study of Fan et al. [47], which uses firms’ records of environmental penalties for constructing green credit access criteria. In this paper, firms with environmental administrative penalties are defined as the experimental group and other firms are defined as the control group. Table 6 Columns (3) and (4) show that the regression coefficients of green credit policy are significantly positive at the 1% level. They support the results in Table 3.
The fifth is the Placebo test. Although industry characteristics and year characteristics as well as firm-level and city-level control variables have been controlled for in the benchmark regression, firm risk-taking may still be affected by unobservable factors. For this reason, industries are randomly assigned to sample firms, and the paper constructs a sham experimental group to repeat the benchmark regression model 500 times. Since this sham experimental group is all randomly generated, green credit policy does not have a significant impact on corporate risk-taking. If the estimated coefficients of the dummy treatment variables are around the zero point, some unobservable random factors are not the real cause of the decline in corporate risk-taking; otherwise, there is a bias in the model setting of this paper. The consequences are revealed in Table 7 and Figure 2, and the proportion of regression coefficients that are significantly positive or significantly negative is small, which means that the virtual processing effect constructed by this test does not exist. This paper argues that other random factors and noise do not affect the promotion of corporate risk-taking by green credit policies
Table 7.
Statistical distribution of regression results of virtual processing effect.
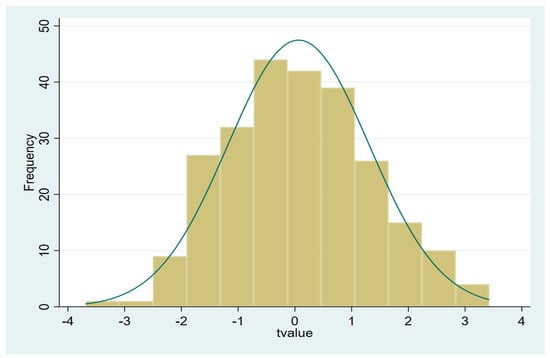
Figure 2.
Results of 500 Placebo tests.
The sixth is to eliminate policy effects. According to Green Finance Reform and Innovation Pilot Zone, five provinces, including Guangdong and Xinjiang, have become pilot areas for green financial reform and innovation. This paper excludes the sample enterprises in these five provinces to eliminate this policy effect. Columns (5) and (6) of Table 6 show that the estimated coefficient of green credit policy is significantly positive, which is also consistent with Table 3.
To ensure the robustness of our findings against potential sample selection bias, we extend the sample period to 2023. Table 6 Columns (7) and (8) present the estimation results with only firm-level control variables and both firm- and city-level control variables included, respectively. The findings indicate that all coefficients of the core explanatory variable DID are positive, and there is no significant alteration in the regression results upon extending the sample period. Consequently, the conclusion that the green credit policy significantly escalates the risk-taking of polluting enterprises remains unchanged.
To make the results more robust, this paper further uses whether firms issue green bonds as the third difference variable and constructs a triple difference model to strengthen the identification of causality and identify the impact of green bonds on corporate risk-taking [87]. In this paper, DDD is defined as the cross-multiplier of whether a firm issues a green bond and DID. The results in Table 8 show that the regression coefficients of DDD are significantly negative at the 1% level, indicating that the issuance of green bonds by enterprises does not positively affect corporate risk-taking, which further supports Hypothesis 1.
Table 8.
Robustness test results—part III.
Finally, the impact of external shocks is considered. Given that the Chinese market is gradually converging with the international market, the effect of green credit policy on corporate risk-taking may be affected by various aspects. Therefore, we refer to the studies of Filardo et al. [88], Wang et al. [89], and Jiang et al. [90] and add control variables such as the global financial cycle, policy uncertainty, and firms’ environmental uncertainty. Columns (3) and (4) of Table 8 show that the regression coefficients of green credit policy are 0.140 and 0.158, respectively. They both pass the significance test, and the results agree with the consequences in Table 3.
To validate the parallel trend posited in this study, we utilized both inter-group difference tests and event study methodologies. Initially, an inter-group difference test was conducted on the sample variables pre-policy implementation to ascertain any disparities between the two groups. The findings from this test indicated no significant differences prior to the policy’s enactment. Subsequently, another inter-group difference test was performed post-policy implementation, revealing significant differences between the groups. Furthermore, this study employed the event study method, designating a window period of (−3, 3) for the parallel trend test. By analyzing the variations in mean differences between the experimental and control groups before and after the policy intervention, we discerned the dynamic effects of the policy. Figure 3 illustrates the parallel trend test. Prior to the introduction of the green credit policy, there was no notable difference in corporate risk-taking between the two groups, thereby fulfilling the parallel trend assumption. However, following the implementation of the green credit policy, the risk-taking of the experimental group significantly escalated compared to the control group. This suggests that the green credit policy has a pronounced effect in promoting risk-taking among polluting enterprises.
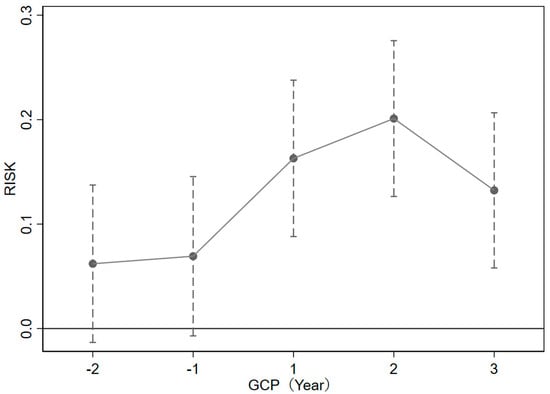
Figure 3.
Parallel trend test.
5.4. Mediation Effect Test
This research constructs the following mediating impact models to inspect whether green credit policy affects the risk-taking level of polluting companies through debt maturity mismatch.
This paper constructs Models (9)–(11) to examination the mediating effect of debt maturity mismatch. If in Equation (9) is not significant, the study of mediating effect is meaningless. Secondly, test whether the green credit policy affects corporate debt maturity structure, that is, to observe whether is significant. Finally, we test the effect of green credit policy and debt maturity structure on corporate risk-taking, that is, to observe whether and are significant. If , and are significant, there is partial mediating effect; if is not significant, and are significant, then there is a complete mediating effect.
Referring to the practice of Liu and Liu [61], this paper selects the difference between the proportion of short-term liabilities and the proportion of short-term assets to reflect the enterprise debt maturity mismatch (Dem). This index measures the maturity mismatch of debt, which can consider the situation of debt and assets, and explain the essence of maturity mismatch of debt to the greatest extent.
Table 9 displays the results of the path of green credit policy–debt maturity mismatch–corporate risk-taking. Column (I) is the test result of Model (9). The estimated coefficient of green credit policy (DID) is 0.1276, which is significantly positive. Column (II) is the test result of Model (10). A positive correlation exists between green credit policy and debt maturity mismatch (Dem), indicating that Guidance makes the debt maturity structure of polluting enterprises mismatch. Column (III) is the test result of Model (11). The estimated coefficient between green credit policy and corporate risk-taking is 0.1262, and the estimated coefficient between debt maturity mismatch (Dem) and corporate risk-taking is 0.1216, which is notable at least at the level of 5%. The regression results for Columns (IV) to (VI) are similar to those for Columns (I) to (III).
Table 9.
Test results of mediating effect.
The results display that green credit policy will lead to corporate debt maturity mismatch, thereby enhancing corporate risk-taking, supporting Hypothesis 2. Specifically, enterprises need to take risks to invest in improving their value. However, after implementing the policy, banks strengthen the credit risk management of polluting enterprises and paid more attention to the negative externalities of environmental risks on banks. Therefore, the debt maturity structure of polluting enterprises has changed after the promulgation of the Guidelines, and the short-term debt of polluting companies has risen, forcing the level of corporate risk-taking to rise.
5.5. Adjustment Variables and Grouping Test
5.5.1. ESG Regulating Effect Test
ESG is a company evaluation standard that focuses on a corporate’s environmental, social, and governance performance, helping investors to assess corporate investment behavior by observing ESG performance, and thus judging a corporate’s contribution to promoting sustainable economic development and fulfilling social responsibility. In this paper, we refer to the study of Li et al. [91], which measures ESG ratings using the CSI ESG composite score.
In this paper, in order to further test the mechanism hypothesis, the role of ESG in the relationship between green credit policy and corporate risk-taking is examined by constructing moderating effect models, Models (12) and (13):
where ESG stands for the firm’s ESG rating; DID ∗ ESG stands for the interaction term between green credit policy effect and ESG rating. First, after adding ESG in Model (12), observe whether Z is significant. If it is significant, it indicates that green credit policy still enhances corporate risk-taking. Second, Z′ in Model (13) represents the coefficient of the interaction term between green credit policy and ESG.
Table 10 shows the results of the moderating impact of executive compensation. In Column (I) and (II) of Table 10, the regression coefficients of DID are 0.119 and 0.133, respectively, which are all significant at the minimum at the 1% level. After adding ESG, green credit policy is still able to influence corporate risk-taking. The regression coefficients of DIDESG in Columns (VII) and (IX) in Table 10 are 0.162 and 0.182, respectively, and both are significant at the 1% level. It shows that ESG has a significant positive moderating effect and ESG can increase the positive impact of green credit policy on corporate risk-taking. Hypothesis 3 is verified.
Table 10.
Results of ESG adjustment effect test.
5.5.2. Executive Compensation Regulating Effect Test
China’s executive compensation incentive system is mainly based on monetary compensation incentives, supplemented by stock option incentives [92]. Monetary compensation incentive is one of the essential means to solve the inconsistency between the interests of executives and shareholders. This paper uses the logarithm of the total monetary compensation of corporate executives to measure executive compensation indicators.
To verify Hypothesis 4, this paper introduces the moderating variable executive compensation based on Model (4) and tests the moderating impact of executive compensation between green credit policy and corporate risk-taking, that is, whether in observation (14) is significant. If is significant, it shows that executive compensation plays a regulatory role. In Model (14), and are significant, which proves that executive compensation is a semi-regulated variable. If is not significant, executive compensation is a pure moderating variable.
Table 11 displays the results of the moderating effect of executive compensation. In Column (I) of Table 11, the estimated coefficient of green credit policy (DID) is 0.896, the estimated coefficient of executive compensation (Lnpay) is 0.0680, and the regression coefficient of the interaction term of executive compensation and green credit policy (Lnpay*DID) is −0.051, which are all significant at the minimum at the 5% level. The regression coefficient of DID in Column (II) is 1.090, the regression coefficient of executive compensation (Lnpay) is 0.080, and the regression coefficient of the interaction between executive compensation and green credit policy (Lnpay*DID) is −0.063, and all of them are significant at least at the level of 5%. The results above show a notable positive effect between executive compensation and corporate risk-taking. However, executive compensation plays a significant inhibitory role between green credit policy and corporate risk-taking level. The higher the executive compensation, the more green credit policy will inhibit the risk-taking level of polluting enterprise. Therefore, executive compensation directly affects the role of green credit policy on corporate risk-taking, which supports Hypothesis 4.
Table 11.
Results of executive compensation adjustment effect test.
Specifically, Table 11 columns (III) to (X) report the moderating effect of executive compensation under different corporate nature samples. Columns (III) to (VI) report the moderating effect of executive compensation under different firm sizes; Columns (VII) to (X) report the moderating effect of executive compensation under different corporate ownership. The estimated coefficient of Lnpay*DID in Column (III) in Table 11 is −0.117, and it is significant at the level of 1%. The regression coefficient of Column (V) in Table 11 is not significant. Compared with the total sample, the inhibitory effect of executive compensation on the risk-taking of polluting companies is more obvious under the sample of large enterprises. The estimated coefficients of Lnpay*DID in Columns (VII) and (IX) in Table 11 are −0.1368 and 0.0906, respectively, and both are significant at the 5% level. The above consequences show that in the face of the environmental regulation pressure brought by the Guidance, the executive compensation of state-owned polluting companies will inhibit the level of corporate risk-taking, and the executive compensation of private polluting enterprises will promote the level of corporate risk-taking. The reason for the reduced promotion effect of green credit policy on corporate risk-taking by state-owned enterprise executives may be due to: The “Guidance on Further Standardizing the Salary Management of Central Enterprise Leaders” issued by six departments including China’s Ministry of Human Resources and Social Security requires that the annual salary of state-owned enterprise executives must not exceed six hundred thousand, resulting in a significant discount in the incentive effect of executive compensation. Even if state-owned enterprise executives have dual identities as professional agents and government officials, their willingness to take risks is still not high when facing stringent environmental regulations. Based on the tournament mechanism, executives in non-state-owned enterprises, in order to secure future promotion prospects and high salaries, will still have the motivation to actively assume risks even under strict environmental regulations.
5.5.3. Heterogeneity Test
From the content of the Guidance, the policy gives commercial banks the power to issue credit. Under the same conditions, commercial banks may consider their profits and risks, and treat enterprises of different sizes and ownership differently, resulting in differences in the effects of green credit policies. That is to say, the impact of green credit policy may be different for enterprises of different sizes and ownership.
Enterprise size. Large enterprises pay attention to reputation and brand, especially when environmental regulation, social market, and environmental law enforcement departments will pay more attention to the pollution of large companies. As an intangible asset, reputation is the capital for enterprises to achieve sustainable development. Therefore, to keep their reputation, companies will actively respond to the requirements of protecting the environment and reducing emissions to maintain their corporate image. In addition, small and medium-sized companies have financing difficulties and expensive financing problems. Compared with large companies, small and medium-sized companies have fewer funds for R&D investment than large enterprises. Table 12 displays the results of the firm grouping test, and Columns (I) to (IV) report the impact of green credit policies on firm risk-taking under different firm sizes. We use the logarithm of total assets as the standard to measure the size of the enterprise. According to the average corporate size, the samples are divided into large, small, and medium-sized companies. The regression coefficients of green credit policy in Column (I) and (III) in Table 12 are 0.209 and 0.008, respectively. The estimated coefficient of the large enterprise sample is significant at 1%, while that of the small and medium-sized enterprise sample is not notable. Column (II) and (IV) results are similar. It shows that after promulgating the Guidelines, large polluting enterprises are more willing and more advantageous to improve their risk-taking level. However, the Guidance does not significantly affect SMEs’ risk-taking level. The possible explanation is that SMEs have weak capital and financing difficulties, and their comprehensive ability does not support their green transformation.
Table 12.
Results of group inspection.
Enterprise ownership. The political relationship between state-owned enterprise and the government may receive more subsidies in some aspects, such as government subsidies and tax incentives, to meet the investment needs of green transformation of companies [2]. At the same time, it may also become the primary tool for the government to solve the performance, employment, consumption, and investment of officials, which will make corporate activities deviate from the goal of maximizing corporate value. In 2005, the central government incorporated environmental protection indicators into the performance appraisal of government officials. The promulgation of the green credit policy may aggravate the pressure on the performance appraisal of officials. State-owned companies may make excessive green investments to complete the performance appraisal of government officials during their tenure, increasing the risk-taking level of related companies. In Table 12, Columns (V) to (VIII) report the impact of green credit policies on corporate risk-taking under different corporate ownership. The estimated coefficients of green credit policy in Columns (V) and (VII) of Table 12 are 0.191 and 0.022, respectively. The sample of state-owned companies is significant at 1%, and the sample of private enterprises is not notable. The above results display that compared with private polluting companies. Guidance has a more obvious impact on the risk-taking level of state-owned polluting enterprises. In contrast, under the sample of private companies, the regression coefficient is not significant because private enterprises may suffer credit discrimination from banking financial institutions and thus cannot obtain loans for investment.
6. Discussion and Implications
6.1. Discussion
In this study, we examine the effect of green credit policies on a key behavior of micro-organizations: risk-taking. While the existing literature has established that green credit policies significantly influence the actions of micro-organizations—most notably by boosting corporate green innovation, augmenting green investment and financing, and facilitating green transformation—it often overlooks the tendency of enterprises to prioritize high profits when faced with these policies, even at additional costs. The introduction of green credit policies has increased the uncertainty surrounding future corporate operations, which are inherently linked to risk and return assessments based on various assumptions about future uncertainties [93,94]. Consequently, when making investment decisions, companies may face risks such as fluctuating interest rates and financing constraints imposed by environmental regulations. Effectively selecting and managing these risks has substantial practical and economic implications. Green credit policies are designed to address the pollution emissions of industries or individuals by revealing hidden environmental costs and internalizing external environmental expenses [95]. This approach encourages enterprises to proactively control pollution and reduce emissions. Our research suggests that the implementation of green credit policies has significantly encouraged risk-taking behavior among polluting enterprises, leading them to pursue projects with higher risks and greater returns. This outcome is a natural result of the decision-making process for businesses striving for survival and profit, as taking risks to secure growth and profitability is fundamental to business operations. This finding confirms and extends previous research on the micro effects of green credit policies [7,96,97].
Our findings further indicate that green credit policies exacerbate the corporate debt maturity mismatch, thereby increasing risk-taking. For polluting firms, environmental credibility issues arising from information asymmetry can be mitigated through short-term debt, as short-term borrowing subject firms to more frequent lender supervision due to recurring rollovers [98]. This observation aligns with research on CSR activities and debt maturity structures. Benlemlih [60] finds that U.S. companies with higher CSR engagement tend to utilize more long-term debt due to lower loan costs. Similarly, Nguyen et al. [62], analyzing Australian firms, discover that companies with higher CSR secure more long-term debt.
At the heart of ESG is the desire to explore a path to sustainable development and strike a balance between corporate value and social responsibility. Unlike traditional financial indicators, ESG looks at a firm’s ability to cope with risk and long-term development from an environmental, social, and corporate governance perspective. Our findings suggest that higher ESG ratings significantly enhance the contribution of green credit policies to corporate risk-taking. He et al. [99] find that ESG performance significantly reduces risk-taking by Chinese enterprise, a finding that is further supported by Wu et al. [100]. Compared with their pioneering study, this paper obtains a different conclusion that firms with higher ESG ratings positively moderates the facilitating effect of green credit policy on corporate risk-taking [101]. This is because good ESG performance releases positive signals of social responsibility to banks and other financial institutions, which is conducive to breaking down information barriers, reducing transaction costs and information search costs for both parties, and obtaining more credit resources for enterprises, thus enhancing their willingness to take risks.
Senior executives, as the primary decision-makers and executors of company operations, are significantly influenced by the externalities introduced by environmental regulations stemming from green credit policies. These influences can alter their risk preferences and self-interests, potentially leading to principal–agent problems. The existing literature suggests that executive incentives can effectively address the principal–agent problem, though results under environmental regulation are mixed. Generally, the private benefits derived from executive incentives exceed the private costs associated with risk-taking, thereby mitigating the underinvestment phenomenon [102].
Our research findings indicate that executive compensation incentives significantly diminish the promotional effect of green credit policies on corporate risk-taking. Baysinger et al. [103] argue that executives prioritize short-term business performance, personal reputation, and wealth accumulation. In contrast, pollution control and emission reduction can affect a company’s immediate profits and losses, potentially hastening the depreciation of executives’ human capital. Hao et al. [104] highlight that over-incentivization in executive compensation can lead executives to prioritize their own interests and engage in speculative behavior. The crowding-out effect of enterprise environmental investment on production investment may adversely affect the company’s short-term performance. Additionally, the innovation required for environmental technology research and development, as well as the upgrading of environmental equipment, necessitates substantial investments. This significantly increases uncertainty risks and the risk of executive investment failure [105], thereby reducing executives’ willingness to take risks.
Our research reveals that in state-owned companies, executive compensation incentives significantly diminish the promotional effect of green credit policies on corporate risk-taking. Conversely, in private enterprises, these incentives amplify this effect. Unlike their Western counterparts, Chinese state-owned enterprise executives hold dual roles as professional managers and government officials, with interests extending beyond mere economic performance to include environmental outcomes. Consequently, executive compensation incentives in state-owned companies should substantially enhance the promotional influence of green credit policies on corporate risk-taking. However, China’s implementation of a “salary cap” directive for executives in all industry state-owned enterprises in 2009 has significantly reduced these executives’ willingness to assume risks.
Green credit policies play a central role in incentivizing corporate risk-taking and promoting a low-carbon transition, but their effectiveness is constrained by factors such as corporate heterogeneity, executive characteristics, and the institutional environment. Therefore, we believe that the impact of green credit policy not only depends on the degree of policy stringency, but is also affected by multiple factors such as banks’ implementation efforts, managers’ risk preferences, and micro-firms’ response measures. Therefore, by accurately identifying policy targets and improving the risk prevention and control system, we can achieve a dynamic balance between green transformation and economic growth [106].
6.2. Implications
6.2.1. Theoretical Implications
This study contributes to the existing literature on green credit policy and corporate risk-taking by examining how green credit policies influence corporate risk-taking, thereby supporting and updating relevant theories. Initially, we explore corporate risk-taking within the framework of green credit policy. While excessive risk-taking can lead to bankruptcy, taking risks is essential for company success [107]. Green credit policy, as a stringent environmental regulation, significantly increases the risk-taking behavior of polluting enterprises, providing empirical support for the “Porter Hypothesis” [56] from the perspective of corporate risk-taking. Additionally, our theoretical analysis reveals that the reflection effect in prospect theory explains why green credit policies heighten risk-taking behavior in polluting enterprises, thereby illuminating the previously unclear mechanisms through which environmental regulation policies affect micro-enterprise behavior.
Secondly, we study the moderating role of executive compensation incentives on the relationship between green credit policy and corporate risk-taking. While the existing literature generally suggests that executive incentives can mitigate the principal–agent problem arising from environmental regulation, our findings indicate that executive compensation incentives significantly reduce the promotional influence of green credit policies on the risk-taking behavior of polluting enterprises, particularly in state-owned enterprises. Unlike executive stock incentives, which align executive and shareholder interests [108,109] and encourage executives to prioritize maximizing company value, executive compensation incentives may lead to over-incentivization or ineffectiveness, exacerbate agency risks between executives and shareholders, and negatively impact corporate performance, especially under environmental regulation. This article examines the economic implications of environmental regulation and executive compensation incentives through the lens of corporate risk-taking, further substantiating and enriching principal–agent theory.
6.2.2. Managerial Implications
First, corporate Environmental, Social, and Governance (ESG) information disclosure systems should be developed and enhanced to reduce information asymmetry between financial institutions and firms. ESG is a crucial metric for assessing corporate development capabilities and has increasingly become a key indicator for attracting investors. Information asymmetry can lead to issues such as adverse selection and moral hazard between banks, financial institutions, and enterprises, thereby decreasing market efficiency and the effectiveness of green credit policy implementation. Upgrading the ESG disclosure system can improve the quality of green credit extended by banks and financial institutions, strengthen their credit risk management, and reduce non-performing loan balances. Moreover, enhanced ESG disclosure lowers financing barriers between financial institutions and small and medium-sized businesses by increasing the transparency of corporate information. In the capital market, robust ESG disclosure can help businesses strengthen their credit profiles, invest in and finance green initiatives through instruments like green bonds, and improve financing effectiveness, all of which mitigate risks associated with business decisions and risk-taking.
Second, companies should design executive compensation incentive mechanisms to address principal–agent conflicts. Effective executive compensation contracts can mitigate conflicts of interest between executives and directors and reduce the principal–agent problem within enterprises. These contracts can balance risk and incentive needs and efficiently maximize corporate value, as a single incentive system may not adequately resolve the dynamics between executives and shareholders or optimize their benefits. By reducing agency costs between senior executives and shareholders and developing appropriate incentive structures, organizations can lower the risks associated with decision-making and risk-taking.
Third, financial institutions should focus on developing green financial instruments to mitigate corporate risks caused by debt maturity mismatches. The specific characteristics of green credit may entail inherent risks, and mismatched debt maturities can hinder stable enterprise growth. A surge in green credit without adequate risk management could lead to systemic financial risks. Therefore, China’s banking, financial, and business sectors should promote the creation of diverse green financial products, including green funds and bonds. Green insurance, which integrates investment, financing, and risk protection functions, is an example of such a tool. Focusing on the coordinated development of various green financial instruments can maximize enterprise value and reduce decision-making risks.
7. Conclusions
This paper examines Chinese A-share listed companies from 2009 to 2019, utilizing the “Green Credit Guidelines” introduced in 2012 as a quasi-natural experiment to empirically assess the effect of green credit policy on corporate risk-taking. The findings indicate that the implementation of green credit policy significantly increases the risk-taking behavior of polluting enterprises. This conclusion remains robust after conducting various tests, including changes to the dependent variables, modifications to the time window, and endogeneity checks. Furthermore, this paper investigates the mediating role of debt maturity mismatch between green credit policy and corporate risk-taking, finding that debt maturity mismatch partially mediates this relationship. The paper also finds that higher ESG ratings play a positive moderating role. Firms with good ESG performance are able to obtain more credit resources, thus increasing their risk-taking. Additionally, the study examines the moderating impact of executive compensation and discovers that executive compensation increases corporate risk-taking in the absence of environmental regulation. Under green credit policy, however, executive compensation is significantly negatively correlated with the risk-taking of polluting enterprise. Through grouping tests, this paper further finds that green credit policy notably increases corporate risk-taking in large or state-owned polluting enterprises. Executive compensation has varying moderating effects across different groups, particularly between ownership types. Specifically, the moderating effect of executive compensation in private enterprises is opposite to that in state-owned companies. Overall, this paper provides a possible explanation for how polluting enterprises respond to environmental regulation, offers a new research perspective on corporate risk-taking, and supplies crucial empirical evidence for further improving green credit policy.
Nevertheless, this study has several limitations that should be acknowledged. Firstly, the scope of this study is limited to Chinese listed companies, which may restrict the generalizability of the findings. While China is a prominent emerging economy, differences in political, cultural, and economic environments across countries could yield divergent conclusions. Future research might incorporate data from various nations to investigate the influence of green credit policies on corporate risk-taking, thereby validating the findings of this paper and examining similarities and disparities between China and other countries. Secondly, elucidating the precise mechanisms through which green credit policies impact micro-corporate behavior remains challenging due to their complexity. This paper primarily examines two aspects: debt maturity mismatch and executive compensation incentives, neglecting potential alternative mechanisms. Subsequent studies can explore additional transmission channels. Lastly, while this paper emphasizes the relationship between green credit policies and corporate risk-taking, it does not address potential non-linear associations or policy timing issues. Future investigations can use listed company samples to explore these nuances, further enriching the field.
Author Contributions
Conceptualization, Z.W. and B.B.; methodology, Z.W., B.B. and J.W.; validation, Z.W., B.B. and J.W.; formal analysis, Z.W. and B.B.; data curation, Z.W. and B.B.; writing—original draft preparation, Z.W. and B.B.; writing—review and editing, J.W.; visualization, Z.W., B.B. and J.W.; supervision, Z.W., B.B. and J.W. All authors have read and agreed to the published version of the manuscript.
Funding
This research is supported by the Shandong Provincial Social Science Planning General Project (Grant Nos. 22CJJJ01) and the Humanities and Social Sciences Research Project of the Ministry of Education (Grant Nos. 21YJAZH068).
Institutional Review Board Statement
Not applicable.
Informed Consent Statement
Not applicable.
Data Availability Statement
The data presented in this study are available on request from the corresponding author.
Conflicts of Interest
The authors declare no conflicts of interest.
References
- Yang, S.; Jahanger, A.; Hossain, M.R. How effective has the low-carbon city pilot policy been as an environmental intervention in curbing pollution? Evidence from Chinese industrial enterprises. Energy Econ. 2023, 118, 106523. [Google Scholar] [CrossRef]
- Lee, C.; He, Z. Natural resources and green economic growth: An analysis based on heterogeneous growth paths. Resour. Policy 2022, 79, 103006. [Google Scholar] [CrossRef]
- Wang, F.; Wu, M.; Wang, J. Can increasing economic complexity improve China’s green development efficiency? Energy Econ. 2023, 117, 106443. [Google Scholar] [CrossRef]
- He, F.; Duan, L.; Cao, Y.; Wen, S.Y. Green credit policy and corporate climate risk exposure. Energy Econ. 2024, 113, 107509. [Google Scholar] [CrossRef]
- Sun, C.; Zeng, Y. Does the green credit policy affect the carbon emissions of heavily polluting enterprises? Energy Policy 2023, 180, 113679. [Google Scholar] [CrossRef]
- Su, T.; Li, M.; Wang, K.; Wu, J. The role of green credit in carbon neutrality: Evidence from the breakthrough technological innovation of renewable energy firms. Environ. Impact Assess. Rev. 2023, 101, 107135. [Google Scholar] [CrossRef]
- Hu, G.Q.; Wang, X.Q.; Wang, Y. Can the green credit policy stimulate green innovation in heavily polluting enterprises? Evidence from a quasi-natural experiment in China. Energy Econ. 2021, 98, 105134. [Google Scholar] [CrossRef]
- Chen, Z.; Zhang, Y.; Wang, H.; Ouyang, X.; Xie, Y. Can green credit policy promote low-carbon technology innovation? J. Clean. Prod. 2022, 359, 132061. [Google Scholar] [CrossRef]
- Xu, X.; Li, J. Asymmetric impacts of the policy and development of green credit on the debt financing cost and maturity of different types of enterprises in China. J. Clean. Prod. 2020, 264, 121574. [Google Scholar] [CrossRef]
- Huang, Z.; Gao, N.; Jia, M. Green credit and its obstacles: Evidence from China’s green credit guidelines. J. Corp. Financ. 2023, 82, 102441. [Google Scholar] [CrossRef]
- Cui, X.; Wang, P.; Sensoy, A.; Nguyen, D.K.; Pan, Y. Green Credit Policy and Corporate Productivity: Evidence from a Quasi-natural Experiment in China. Technol. Forecast. Soc. Change 2022, 177, 121516. [Google Scholar] [CrossRef]
- Guo, S.; Zhang, Z. Green credit policy and total factor productivity: Evidence from Chinese listed companies. Energy Econ. 2023, 128, 107115. [Google Scholar] [CrossRef]
- Lumpkin, G.; Dess, G.G. Clarifying the Entrepreneurial Orientation Construct and Linking It to Performance. Acad. Manag. Rev. 1996, 21, 135–172. [Google Scholar] [CrossRef]
- Boubakri, N.; Cosset, J.C.; Saffar, W. The role of state and foreign owners in corporate risk-taking: Evidence from privatization. J. Financ. Econ. 2013, 108, 641–658. [Google Scholar] [CrossRef]
- John, K.; Litov, L.; Yeung, B. Corporate Governance and Risk-taking. J. Financ. 2008, 63, 1679–1728. [Google Scholar] [CrossRef]
- Lien, G.; Kumbhakar, S.C.; Mishra, A.K.; Hardaker, J.B. Does risk management affect productivity of organic rice farmers in India? Evidence from a semiparametric production model. Eur. J. Oper. Res. 2022, 303, 1392–1402. [Google Scholar] [CrossRef]
- Chai, S.; Zhang, K.; Wei, W.; Ma, W.; Abedin, M.Z. The impact of green credit policy on enterprises’ financing behavior: Evidence from Chinese heavily-polluting listed companies. J. Clean. Prod. 2022, 363, 132458. [Google Scholar] [CrossRef]
- Scholtens, B.; Dam, L. Banking on the Equator. Are Banks that Adopted the Equator Principles Different from Non-Adopters? World Dev. 2007, 35, 1307–1328. [Google Scholar] [CrossRef]
- Zhang, S.; Wu, Z.; Wang, Y.; Hao, Y. Fostering green development with green finance: An empirical study on the environmental effect of green credit policy in China. J. Environ. Manag. 2021, 296, 113159. [Google Scholar] [CrossRef]
- Wang, J.; Li, X.; Memari, A.; Skitmore, M.; Zhong, Y.; Ashuri, B.; Chen, J.; Cao, J. Assessing the implementation and effectiveness of China’s social credit system of the construction industry: A case study of Nanjing. Int. J. Constr. Manag. 2024, 10, 1–10. [Google Scholar] [CrossRef]
- Wang, J.; Li, X.; Memari, A.; Skitmore, M.; Zhong, Y.; Ashuri, B. Data-driven assessment on the corporate credit scoring mechanism for Chinese construction supervision companies. Constr. Manag. Econ. 2023, 41, 961–975. [Google Scholar] [CrossRef]
- Ma, Y.; Lu, L.; Cui, J.; Shi, X. Can green credit policy stimulate firms’ green investments? Int. Rev. Econ. Financ. 2024, 91, 123–137. [Google Scholar] [CrossRef]
- Ding, S.; Jia, C.; Qu, B.; Wu, Z. Corporate risk-taking: Exploring the effects of government affiliation and executives’ incentives. J. Bus. Res. 2015, 68, 1196–1204. [Google Scholar] [CrossRef]
- Song, C.; Nahm, A.Y.; Song, Z. Entrepreneurs’ hobbies and corporate risk taking: Evidence from China. Int. Rev. Financ. Anal. 2021, 77, 101856. [Google Scholar] [CrossRef]
- Ingersoll, A.R.; Cook, A.; Glass, C. A free solo in heels: Corporate risk taking among women executives and directors. J. Bus. Res. 2023, 157, 113651. [Google Scholar] [CrossRef]
- Chen, Y.; Hasan, I.; Saffar, W.; Zolotoy, L. Executive Equity Risk-Taking Incentives and Firms’ Choice of Debt Structure. J. Bank. Financ. 2021, 133, 106274. [Google Scholar] [CrossRef]
- Kini, O.; Williams, R. Tournament incentives, firm risk, and corporate policies. J. Financ. Econ. 2012, 103, 350–376. [Google Scholar] [CrossRef]
- Abascal, R.; González, F. What drives risk-taking incentives embedded in bank executive compensation? Some international evidence. J. Corp. Financ. 2023, 79, 102357. [Google Scholar] [CrossRef]
- Gao, L.; Sudarsanam, P.S. Executive Compensation, Hubris, Corporate Governance: Impact on Managerial Risk Taking and Value Creation in UK High-tech and Low-tech Acquisitions. SSRN Electron. J. 2005, 1–63. [Google Scholar] [CrossRef]
- Serfling, M.A. CEO age and the riskiness of corporate policies. J. Corp. Financ. 2014, 25, 251–273. [Google Scholar] [CrossRef]
- Faccio, M.; Marchica, M.T.; Mura, R. CEO gender, corporate risk-taking, and the efficiency of capital allocation. J. Corp. Financ. 2016, 39, 193–209. [Google Scholar] [CrossRef]
- Roussanov, N.; Savor, P. Marriage and managers’ attitudes to risk. Manag. Sci. 2014, 60, 2496–2508. [Google Scholar] [CrossRef]
- Bernile, G.; Bhagwat, V.; Rau, P.R. What Doesn’t Kill You Will Only Make You More Risk-Loving: Early-Life Disasters and CEO Behavior. J. Financ. 2017, 72, 167–206. [Google Scholar] [CrossRef]
- Klasing, M.J. Cultural change, risk-taking behavior and implications for economic development. J. Dev. Econ. 2014, 110, 158–169. [Google Scholar] [CrossRef]
- Mclean, R.D.; Zhao, M. The business cycle, investor sentiment, and costly external finance. J. Financ. 2014, 69, 1377–1409. [Google Scholar] [CrossRef]
- Lou, Z.; Chen, S.; Yin, W.; Zhang, C.; Yu, X. Economic policy uncertainty and firm innovation: Evidence from a risk-taking perspective. Int. Rev. Econ. Financ. 2022, 77, 78–96. [Google Scholar] [CrossRef]
- Teixeira, J.C.A.; Matos, T.F.A.; da Costa, G.L.P.; Fortuna, M.J.A. Investor protection, regulation and bank risk-taking behavior. N. Am. J. Econ. Finance. 2020, 51, 101051. [Google Scholar] [CrossRef]
- Jiang, J.; Chen, Y. How does labor protection influence corporate risk-taking? Evidence from China. Pac. Basin Financ. J. 2021, 68, 101572. [Google Scholar] [CrossRef]
- Wang, X.; Wang, Y. Research on the Green Innovation Promoted by Green Credit Policies. J. Manag. World 2021, 6, 173–188. (In Chinese) [Google Scholar] [CrossRef]
- Wen, H.W.; Lee, C.C.; Zhou, F.X. Green credit policy, credit allocation efficiency and upgrade of energy-intensive enterprises. Energy Econ. 2021, 94, 105099. [Google Scholar] [CrossRef]
- Yu, P.-Y.; Luu, B.; Chen, C. Greenwashing in environmental, social and governance disclosures. Res. Int. Bus. Financ. 2020, 52, 101192. [Google Scholar] [CrossRef]
- Zhang, D. Does green finance really inhibit extreme hypocritical ESG risk? A greenwashing perspective exploration. Energy Econ. 2023, 121, 106688. [Google Scholar] [CrossRef]
- Lyon, T.; Montgomery, A. The Means and End of Greenwash. Organ. Environ. 2015, 28, 223–249. [Google Scholar] [CrossRef]
- Hilary, G.; Hui, K.W. Does Religion Matter in Corporate Decision Making in American. J. Financ. Econ. 2009, 93, 455–473. [Google Scholar] [CrossRef]
- Yu, M.G.; Li, W.G.; Pan, H.B. Managerial Overconfidence and Corporate Risk Taking. J. Financ. Res. 2013, 1, 149–163. (In Chinese) [Google Scholar]
- Faccio, M.; Marchica, M.T.; Mura, R. Large shareholder diversification and corporate risk-taking. Rev. Financ. Stud. 2011, 24, 3601–3641. [Google Scholar] [CrossRef]
- Fan, H.; Peng, Y.; Wang, H.; Xu, Z. Greening through finance? J. Dev. Econ. 2021, 152, 102683. [Google Scholar] [CrossRef]
- Lin, B.; Pan, T. The impact of green credit on green transformation of heavily polluting enterprises: Reverse forcing or forward pushing? Energy Policy 2024, 184, 113901. [Google Scholar] [CrossRef]
- Long, X.N.; Wan, W. Environmental Regulation, Corporate Profit Margins and Compliance Cost Heterogeneity of Different Scale Enterprises. China Ind. Econ. 2017, 6, 155–174. (In Chinese) [Google Scholar] [CrossRef]
- Kahneman, D.; Tversky, A. Prospect Theory: An Analysis of Decision under Risk. Econometrica 1979, 47, 263–292. [Google Scholar]
- Liu, H.; Liu, Z.; Zhang, C.; Li, T. Transformational insurance and green credit incentive policies as financial mechanisms for green energy transitions and low-carbon economic development. Energy Econ. 2023, 126, 107016. [Google Scholar] [CrossRef]
- Yuan, N.; Gao, Y. Does green credit policy impact corporate cash holdings? Pac.-Basin Financ. J. 2022, 75, 101850. [Google Scholar] [CrossRef]
- Li, X.P.; Lv, X.X.; Tao, X.Q. Does Environmental Regulation Intensity Affect China’s Industrial Trade Comparative Advantage. J. World Econ. 2012, 35, 62–78. (In Chinese) [Google Scholar] [CrossRef]
- Fazzari, S.; Petersen, B. Working Capital and Fixed Investment: New Evidence on Financing Constraints. RAND J. Econ. 1993, 24, 328–342. [Google Scholar] [CrossRef]
- Xu, L.; Yang, L.; Li, D.; Shao, S. Asymmetric effects of heterogeneous environmental standards on green technology innovation: Evidence from China. Energy Econ. 2023, 117, 106479. [Google Scholar] [CrossRef]
- Porter, M. America’ s green strategy. Sci. Am. 1991, 264, 168. [Google Scholar] [CrossRef]
- Wu, J.Y.; Opare, S.; Bhuiyan, M.; Habib, A. Determinants and consequences of debt maturity structure: A systematic review of the international literature. Int. Rev. Financ. Anal. 2022, 84, 102423. [Google Scholar] [CrossRef]
- Berger, A.N.; Espinosa-Vega, M.A.; Frame, W.S.; Miller, N.H. Debt maturity, risk, and asymmetric information. J. Financ. 2005, 60, 2895–2923. [Google Scholar] [CrossRef]
- Custódio, C.; Ferreira, M.A.; Laureano, L. Why are US firms using more short-term debt? J. Financ. Econ. 2013, 108, 182–212. [Google Scholar] [CrossRef]
- Benlemlih, M. Corporate social responsibility and firm debt maturity. J. Bus. Ethics 2017, 144, 491–517. [Google Scholar] [CrossRef]
- Liu, X.G.; Liu, Y.C. Leverage, Short-term Debt for Long-term Use and Firm Performance. Econ. Res. J. 2019, 54, 127–141. (In Chinese) [Google Scholar]
- Nguyen, V.H.; Choi, B.; Agbola, F.W. Corporate social responsibility and debt maturity: Australian evidence. Pac. -Basin Financ. J. 2020, 62, 101374. [Google Scholar] [CrossRef]
- Diamond, D. Debt Maturity Structure and Liquidity Risk. Q. J. Econ. 1991, 106, 709–737. [Google Scholar] [CrossRef]
- Acharya, V.; Gale, D.; Yorulmazer, T. Rollover risk and market freezes. J. Financ. 2011, 66, 1177–1209. [Google Scholar] [CrossRef]
- Liu, X.; Wang, E.; Cai, D. Green credit policy, property rights and debt financing: Quasi-natural experimental evidence from China. Financ. Res. Lett. 2019, 29, 129–135. [Google Scholar] [CrossRef]
- Li, W.; Hu, H.; Hong, Z. Green finance policy, ESG rating, and cost of debt—Evidence from China. Int. Rev. Financ. Anal. 2024, 92, 103051. [Google Scholar] [CrossRef]
- Ratajczak, P.; Mikołajewicz, G. The impact of environmental, social and corporate governance responsibility on the cost of short-and long-term debt. Econ. Bus. Rev. 2021, 7, 74–96. [Google Scholar] [CrossRef]
- Yang, T.; Zhou, B. Does transition finance policies persistently fuel green innovation in brown firms? Investigating the roles of ESG rating and bank connection. Pac. -Basin Financ. J. 2025, 90, 102674. [Google Scholar] [CrossRef]
- Zhan, H.; Shen, H.; Guo, H. Research on the impact of ESG scores on corporate substantive and strategic green innovation. Innov. Green Dev. 2025, 4, 100194. [Google Scholar] [CrossRef]
- Zhang, Z.; Hou, Y.; Li, Z.; Li, M. From symbolic to substantive green innovation: How does ESG ratings optimize corporate green innovation structure. Financ. Res. Lett. 2024, 63, 105401. [Google Scholar] [CrossRef]
- Naseer, M.; Guo, Y.; Bagh, T.; Zhu, X. Sustainable investments in volatile times: Nexus of climate change risk, ESG practices, and market volatility. Int. Rev. Financ. Anal. 2024, 95, 103492. [Google Scholar] [CrossRef]
- Mao, C.; Zhang, C. Managerial Risk-Taking Incentive and Firm Innovation: Evidence from FAS 123R. J. Financ. Quant. Anal. 2018, 53, 867–898. [Google Scholar] [CrossRef]
- Tsang, A.; Wang, K.T.; Liu, S.; Yu, L. Integrating corporate social responsibility criteria into executive compensation and firm innovation: International evidence. J. Corp. Financ. 2021, 70, 102070. [Google Scholar] [CrossRef]
- Jensen, M.; Meckling, W. Theory of the firm: Managerial behavior, agency costs and ownership structure. J. Financ. Econ. 1976, 3, 305–360. [Google Scholar] [CrossRef]
- Holt, C.A.; Laury, S.K. Risk Aversion and Incentive Effects. Am. Econ. Rev. 2002, 92, 1644–1655. [Google Scholar] [CrossRef]
- Cheng, S. R&D expenditures and CEO compensation. Account. Rev. 2004, 79, 305–328. [Google Scholar] [CrossRef]
- Calza, F.; Profumo, G.; Tutore, L. Corporate ownership and environmental proactivity. Bus. Strategy Environ. 2016, 26, 369–389. [Google Scholar] [CrossRef]
- Wang, J.; Li, M.; Moorhead, M.; Skitmore, M. Forecasting financial distress in listed Chinese construction firms: Leveraging ensemble learning and non-financial variables. Constr. Manag. Econ. 2025, 43, 175–195. [Google Scholar] [CrossRef]
- Bargeron, L.L.; Lehn, K.; Zutter, C. Sarbanes-Oxley and Corporate Risk-taking. J. Account. Econ. 2010, 49, 34–52. [Google Scholar] [CrossRef]
- Zhang, M.; Tong, L.J.; Xu, H.R. Social network and corporate risk-taking—Empirical evidence based on Chinese listed companies. J. Manag. World 2015, 11, 161–175. (In Chinese) [Google Scholar] [CrossRef]
- He, Y.; Yu, W.L.; Yang, M.Z. CEOs with Rich Career Experience, Corporate Risk-taking and the Value of Enterprises. China Ind. Econ. 2019, 9, 155–173. (In Chinese) [Google Scholar] [CrossRef]
- Arif, S.; Lee, C.M.C. Aggregate investment and investor sentiment. Rev. Financ. Stud. 2014, 27, 3241–3279. [Google Scholar] [CrossRef]
- Huang, L.X.; Ma, M.H.; Wang, X.B. Does Economic Growth Target Affect Enterprise Risk-taking? Based on the Dual Perspectives of Market and Government. J. Financ. Econ. 2021, 47, 62–93. (In Chinese) [Google Scholar]
- Wang, J.; Li, M.; Skitmore, M.; Chen, J. Predicting Construction Company Insolvent Failure: A Scientometric Analysis and Qualitative Review of Research Trends. Sustainability 2024, 16, 2290. [Google Scholar] [CrossRef]
- Rooij, B. Implementation of Chinese Environmental Law: Regular Enforcement and Political Campaigns. Dev. Change 2006, 37, 57–74. [Google Scholar] [CrossRef]
- Wang, J.; Lei, P. The tournament of Chinese environmental protection: Strong or weak competition? Ecol. Econ. 2021, 181, 106888. [Google Scholar] [CrossRef]
- Wooldridge, J. Econometric Analysis of Cross Section and Panel Data; MIT Press: Cambridge, MA, USA, 2010. [Google Scholar]
- Filardo, A.; Genberg, H.; Hofmann, B. Monetary analysis and the global financial cycle: An Asian central bank perspective. J. Asian Econ. 2016, 46, 1–16. [Google Scholar] [CrossRef]
- Wang, L.; Qu, X.; Wang, Y.; Lu, J.; Wang, Q. Economic policy uncertainty, related-party transactions and corporate liquidity. Financ. Res. Lett. 2025, 76, 107010. [Google Scholar] [CrossRef]
- Jiang, L.; Zhou, W.; Hualiang, W.; Deng, W. Impact of business environment uncertainty on ESG performance from the perspective of resource supply and demand based on ESG performance. Econ. Anal. Policy 2025, 85, 1012–1030. [Google Scholar] [CrossRef]
- Li, C.; Wu, M.; Chen, X.; Huang, W. Environmental, social and governance performance, corporate transparency, and credit rating: Some evidence from Chinese A-share listed companies. Pac. -Basin Financ. J. 2022, 74, 101806. [Google Scholar] [CrossRef]
- Zhang, R.J.; Li, X.R.; Xu, N.X. DO Cash Compensation Encourage Managers Taking Risk? Econ. Theory Bus. Manag. 2013, 8, 84–100. (In Chinese) [Google Scholar]
- Yang, L. From Economic Policy Uncertainty to Implied Market Volatility: Nothing to Fear? J. Futures Mark. 2025, 45, 143–157. [Google Scholar] [CrossRef]
- Yang, L.; Cui, X.; Yang, L.; Hamori, S.; Cai, X. Risk spillover from international financial markets and China’s macro-economy: A MIDAS-CoVaR-QR model. Int. Rev. Econ. Financ. 2023, 84, 55–69. [Google Scholar] [CrossRef]
- Esily, R.; Ibrahiem, D.; Sameh, R.; Houssam, N. Assessing environmental concern and its association with carbon trade balances in N11 Do financial development and urban growth matter? J. Environ. Manag. 2022, 320, 115869. [Google Scholar] [CrossRef]
- Feng, D. The Impact of Green Credit Policy on Corporate Risk Taking. Theor. Econ. Lett. 2023, 13, 1131–1151. [Google Scholar] [CrossRef]
- Su, D.; Xu, S.; Tong, Z. Credit availability and corporate risk-taking: Evidence from China’s green credit policy. Post-Communist Econ. 2023, 35, 236–270. [Google Scholar] [CrossRef]
- Stulz, R.M. Financial Structure, Corporate Finance and Economic Growth. Int. Rev. Financ. 2000, 1, 11–38. [Google Scholar] [CrossRef]
- He, F.; Ding, C.; Yue, W.; Liu, G. ESG performance and corporate risk-taking: Evidence from China. Int. Rev. Financ. Anal. 2023, 87, 102550. [Google Scholar] [CrossRef]
- Wu, S.; Zhou, F.-Y.; Si, D.-K.; Hao, J. Does ESG rating policy reduce corporate risk-taking? Evidence from China. Pac.-Basin Financ. J. 2025, 90, 102654. [Google Scholar] [CrossRef]
- Guo, X.; Yang, C.; Ban, Q.; Xie, Y. The Impact of Mandatory Corporate Social Responsibility Disclosure on Enterprise Risk-Taking: Facilitative or Constraining? Sustainability 2024, 16, 5160. [Google Scholar] [CrossRef]
- Aggarwal, R.K.; Samwick, A.A. Empire-Builders and shirkers: Investment, firm performance, and managerial incentives. J. Corp. Financ. 2006, 12, 489–515. [Google Scholar] [CrossRef]
- Baysinger, B.D.; Kosnik, R.D.; Turk, T.A. Effects of board and ownership structure on corporate R&D strategy. Acad. Manag. J. 1991, 34, 205–214. [Google Scholar] [CrossRef]
- Hao, X.; Wen, S.; Li, K.; Wu, J.; Wu, H.; Hao, Y. Environmental governance, executive incentive, and enterprise performance: Evidence from Chinese mineral enterprises. Resour. Policy 2023, 85, 103858. [Google Scholar] [CrossRef]
- Kachelmeier, S.J.; Reichert, M.G. Measuring and motivating quantity, creativity, or both. J. Account. Res. 2008, 46, 341–373. [Google Scholar] [CrossRef]
- Ibrahiem, D.; Esily, R.; Sameh, R. Climate change and green finance: The role of central Banks. In Reference Module in Social Sciences; Elsevier: Amsterdam, The Netherlands, 2023. [Google Scholar] [CrossRef]
- Nakano, M.; Nguyen, P. Board size and corporate risk taking: Further evidence from Japan. Corp. Gov. Int. Rev. 2012, 20, 369–387. [Google Scholar] [CrossRef]
- Von Lilienfeld-Toal, U.; Stefan, R. CEO Ownership, Stock Market Performance, and Managerial Discretion. J. Financ. 2014, 69, 1013–1050. [Google Scholar] [CrossRef]
- Collins, D.; Blair, B.M.; Xu, N. Equity—Based incentives and shareholder say-on-pay. J. Bus. Financ. Account. 2019, 46, 739–761. [Google Scholar] [CrossRef]
Disclaimer/Publisher’s Note: The statements, opinions and data contained in all publications are solely those of the individual author(s) and contributor(s) and not of MDPI and/or the editor(s). MDPI and/or the editor(s) disclaim responsibility for any injury to people or property resulting from any ideas, methods, instructions or products referred to in the content. |
© 2025 by the authors. Licensee MDPI, Basel, Switzerland. This article is an open access article distributed under the terms and conditions of the Creative Commons Attribution (CC BY) license (https://creativecommons.org/licenses/by/4.0/).