Sustainable Transport Between Reality and Legislative Provisions—The Source for the Climate Neutrality of the European Union


Abstract
1. Introduction
2. Theoretical Background and Research Questions
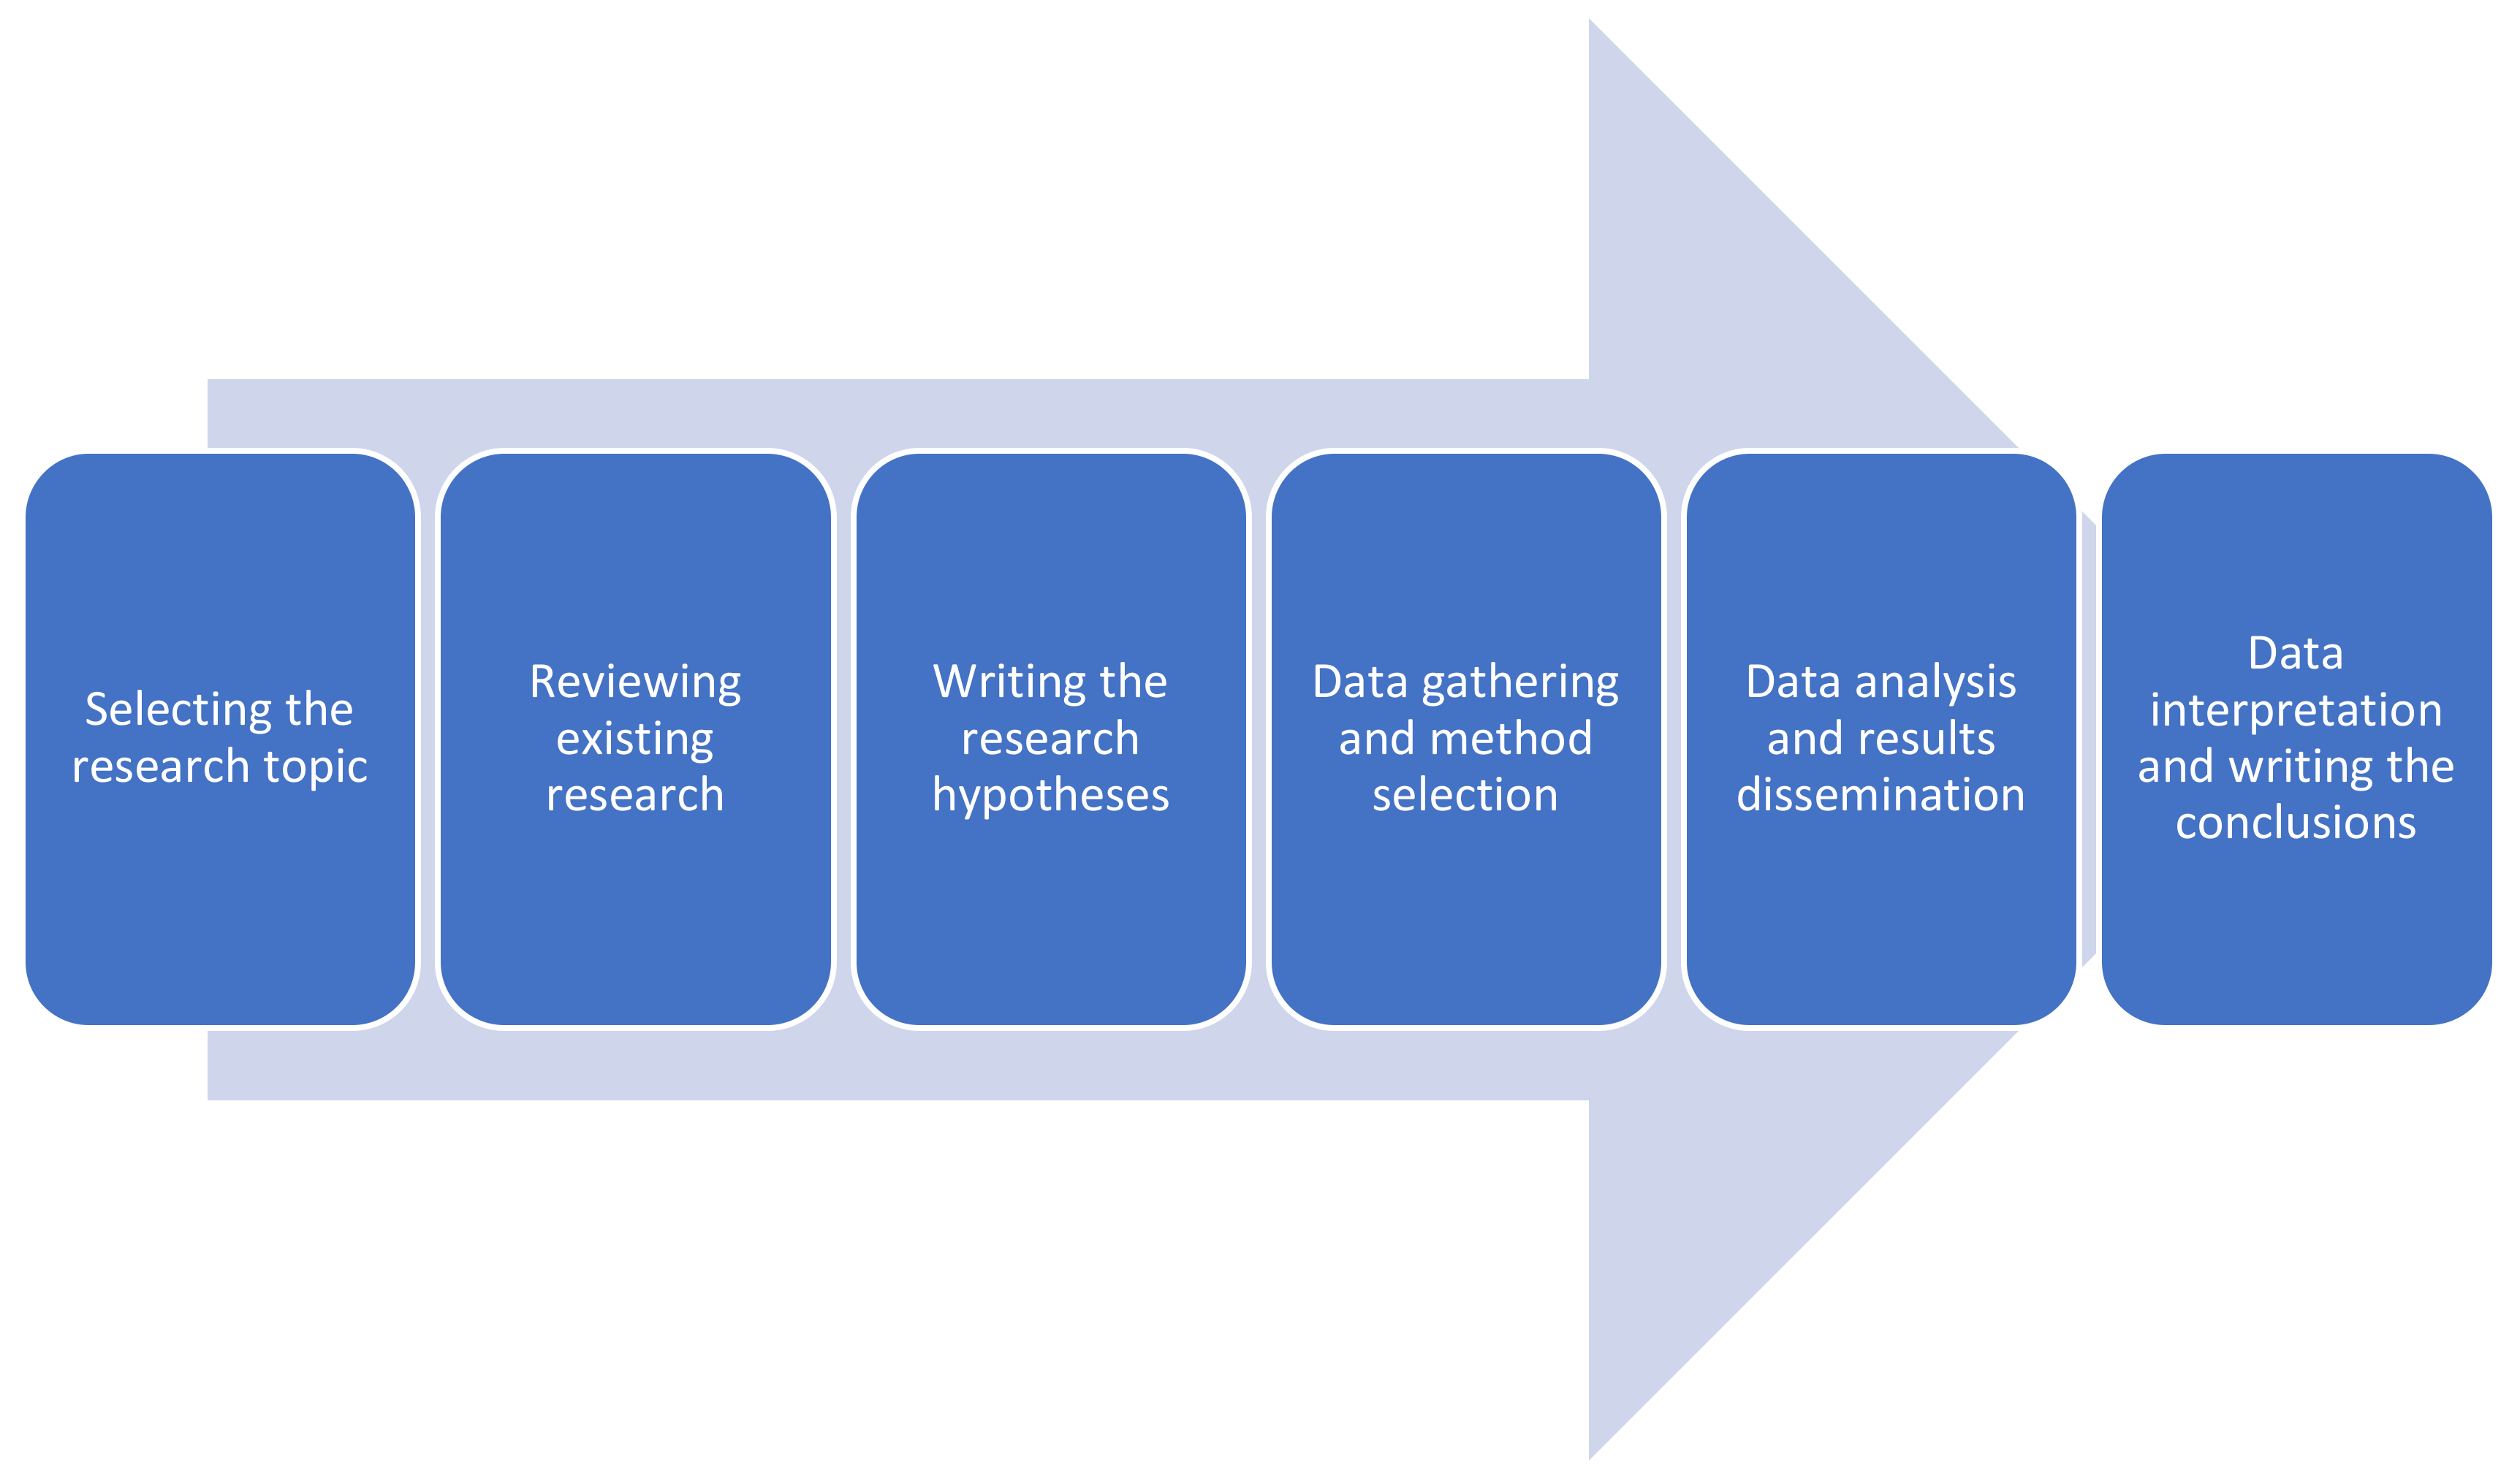
3. Research Methodology—Materials and Methods
3.1. Data Selection
- Economic Factors—GDP
- Social Factors—the share of the urban population in the total population
- Environmental Factors—Final energy consumption in transport by type of fuel (oil equivalent)
3.2. Using Pearson Correlation
- r: Pearson correlation coefficient
- Xi, Yi: Individual values of the two variables
- : Means of the two variables
- ∑: Sum
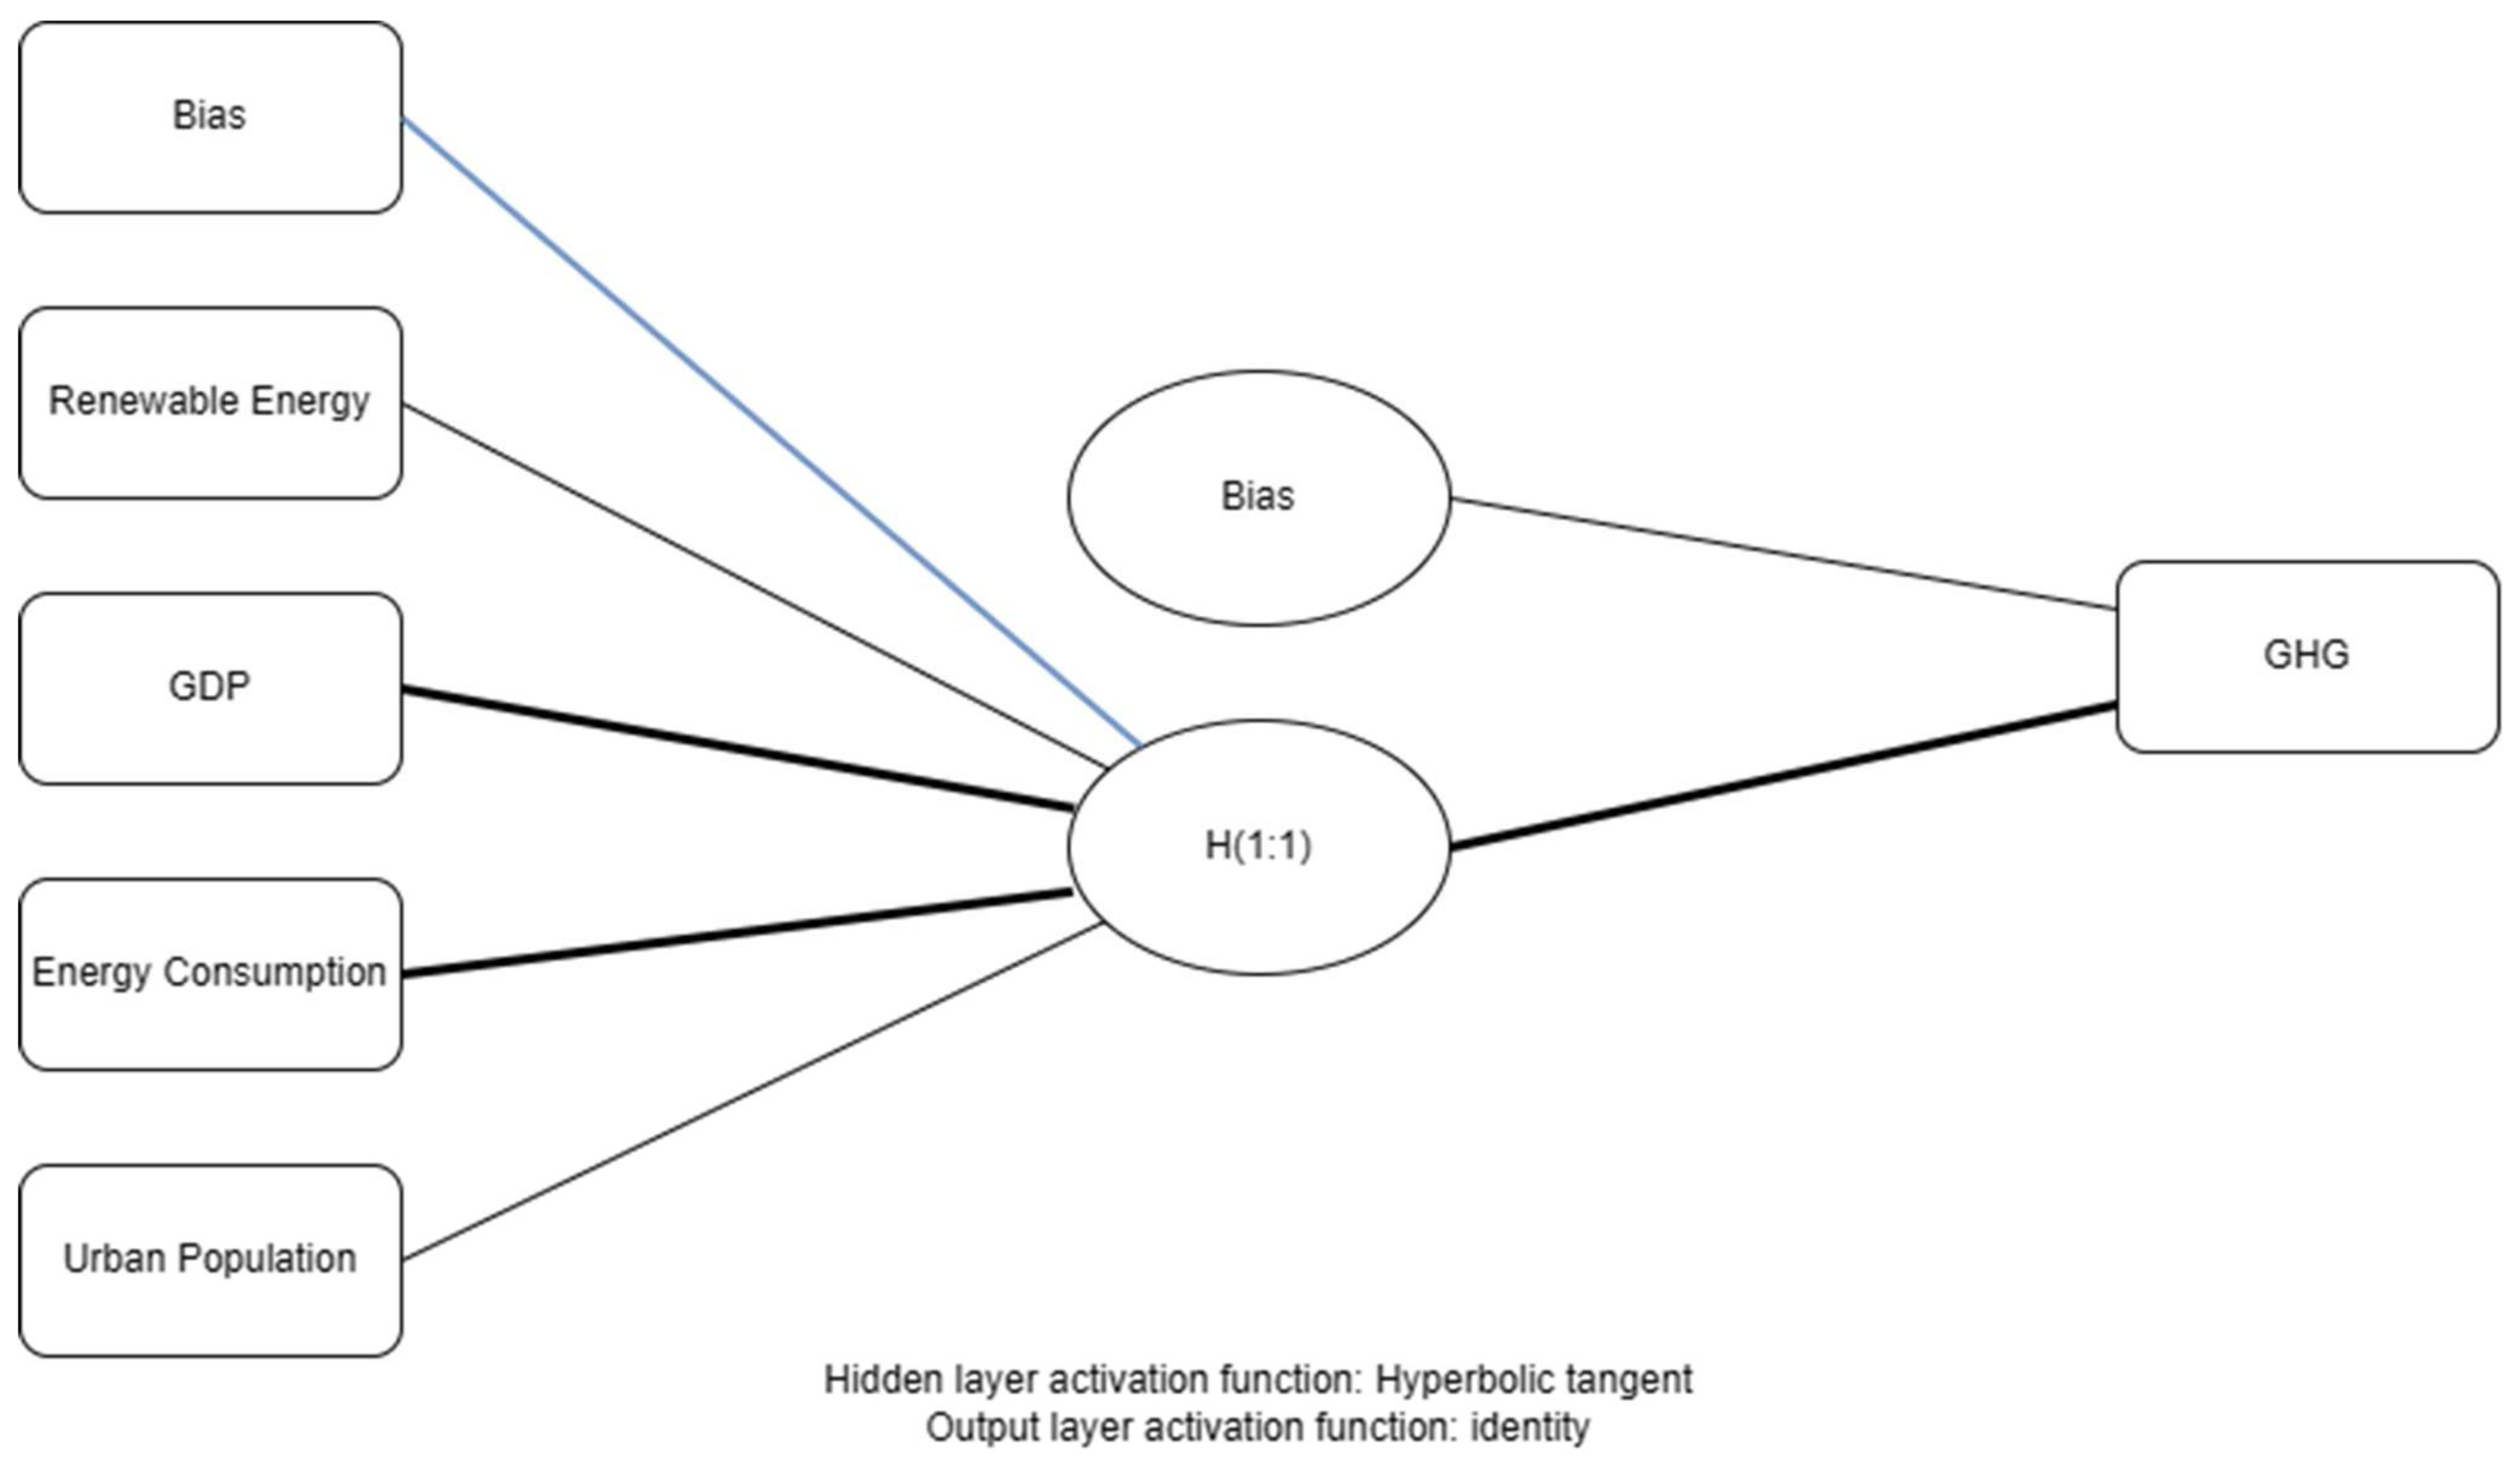
3.3. To Investigate Hypothesis Number 2, We Used the SPSS Program, with the Neural Networks Function
3.4. To Verify the Research Hypotheses with Numbers Between 3 and 7, We Used the Prophet Forecasting Model and the SPSS Program’s Hierarchical Clusters Function
3.4.1. The Prophet Model: A Detailed Analysis
- Trend Component (g(t)): Captures the general direction of the time series, whether it is increasing, decreasing, or remaining relatively constant.
- Seasonal Component (s(t)): Models periodic patterns such as daily, weekly, monthly, or annual cycles.
- Holiday Component (h(t)): Takes into account the impact of holidays on the time series.
- Error Component (e(t)): Represents the residual noise or unexplained variation.
- y(t): Observed value of the time series at time t.
- g(t): Trend component at time t.
- s(t): Seasonal component at time t.
- h(t): Holiday component at time t.
- e(t): Error term at time t.
- Flexibility: Easily handles various time series patterns, including linear and nonlinear trends; the program handles seasonality and holiday effects.
- Accuracy: Provides accurate forecasts, even for complex time series data.
- Scalability: Efficiently handles large data sets and complex models.
- By leveraging these strengths, Prophet has become a valuable tool for businesses and researchers alike, enabling them to make data-driven decisions and optimize their strategies based on precise forecasts.
3.4.2. Using the Hierarchical Clusters Function in SPSS
- |C1| and |C2| represent the number of points in each cluster.
- dij represents the Euclidean distance (or other distance metric) between point i in C1 and point j in C2.
- ∑ represents the sum of all distances dij.
4. Results and Discussions
4.1. Validation of Hypothesis Number 1
- Hypothesis Number 1
4.2. Validation of Hypothesis Number 2
- Hypothesis Number 2
4.3. Investigating Research Hypotheses with Numbers Between 3 and 7
4.3.1. Estimates of GHG Emissions from the Transport Sector Using the Prophet Model
A Temporary Decline, Followed by a Rapid Recovery
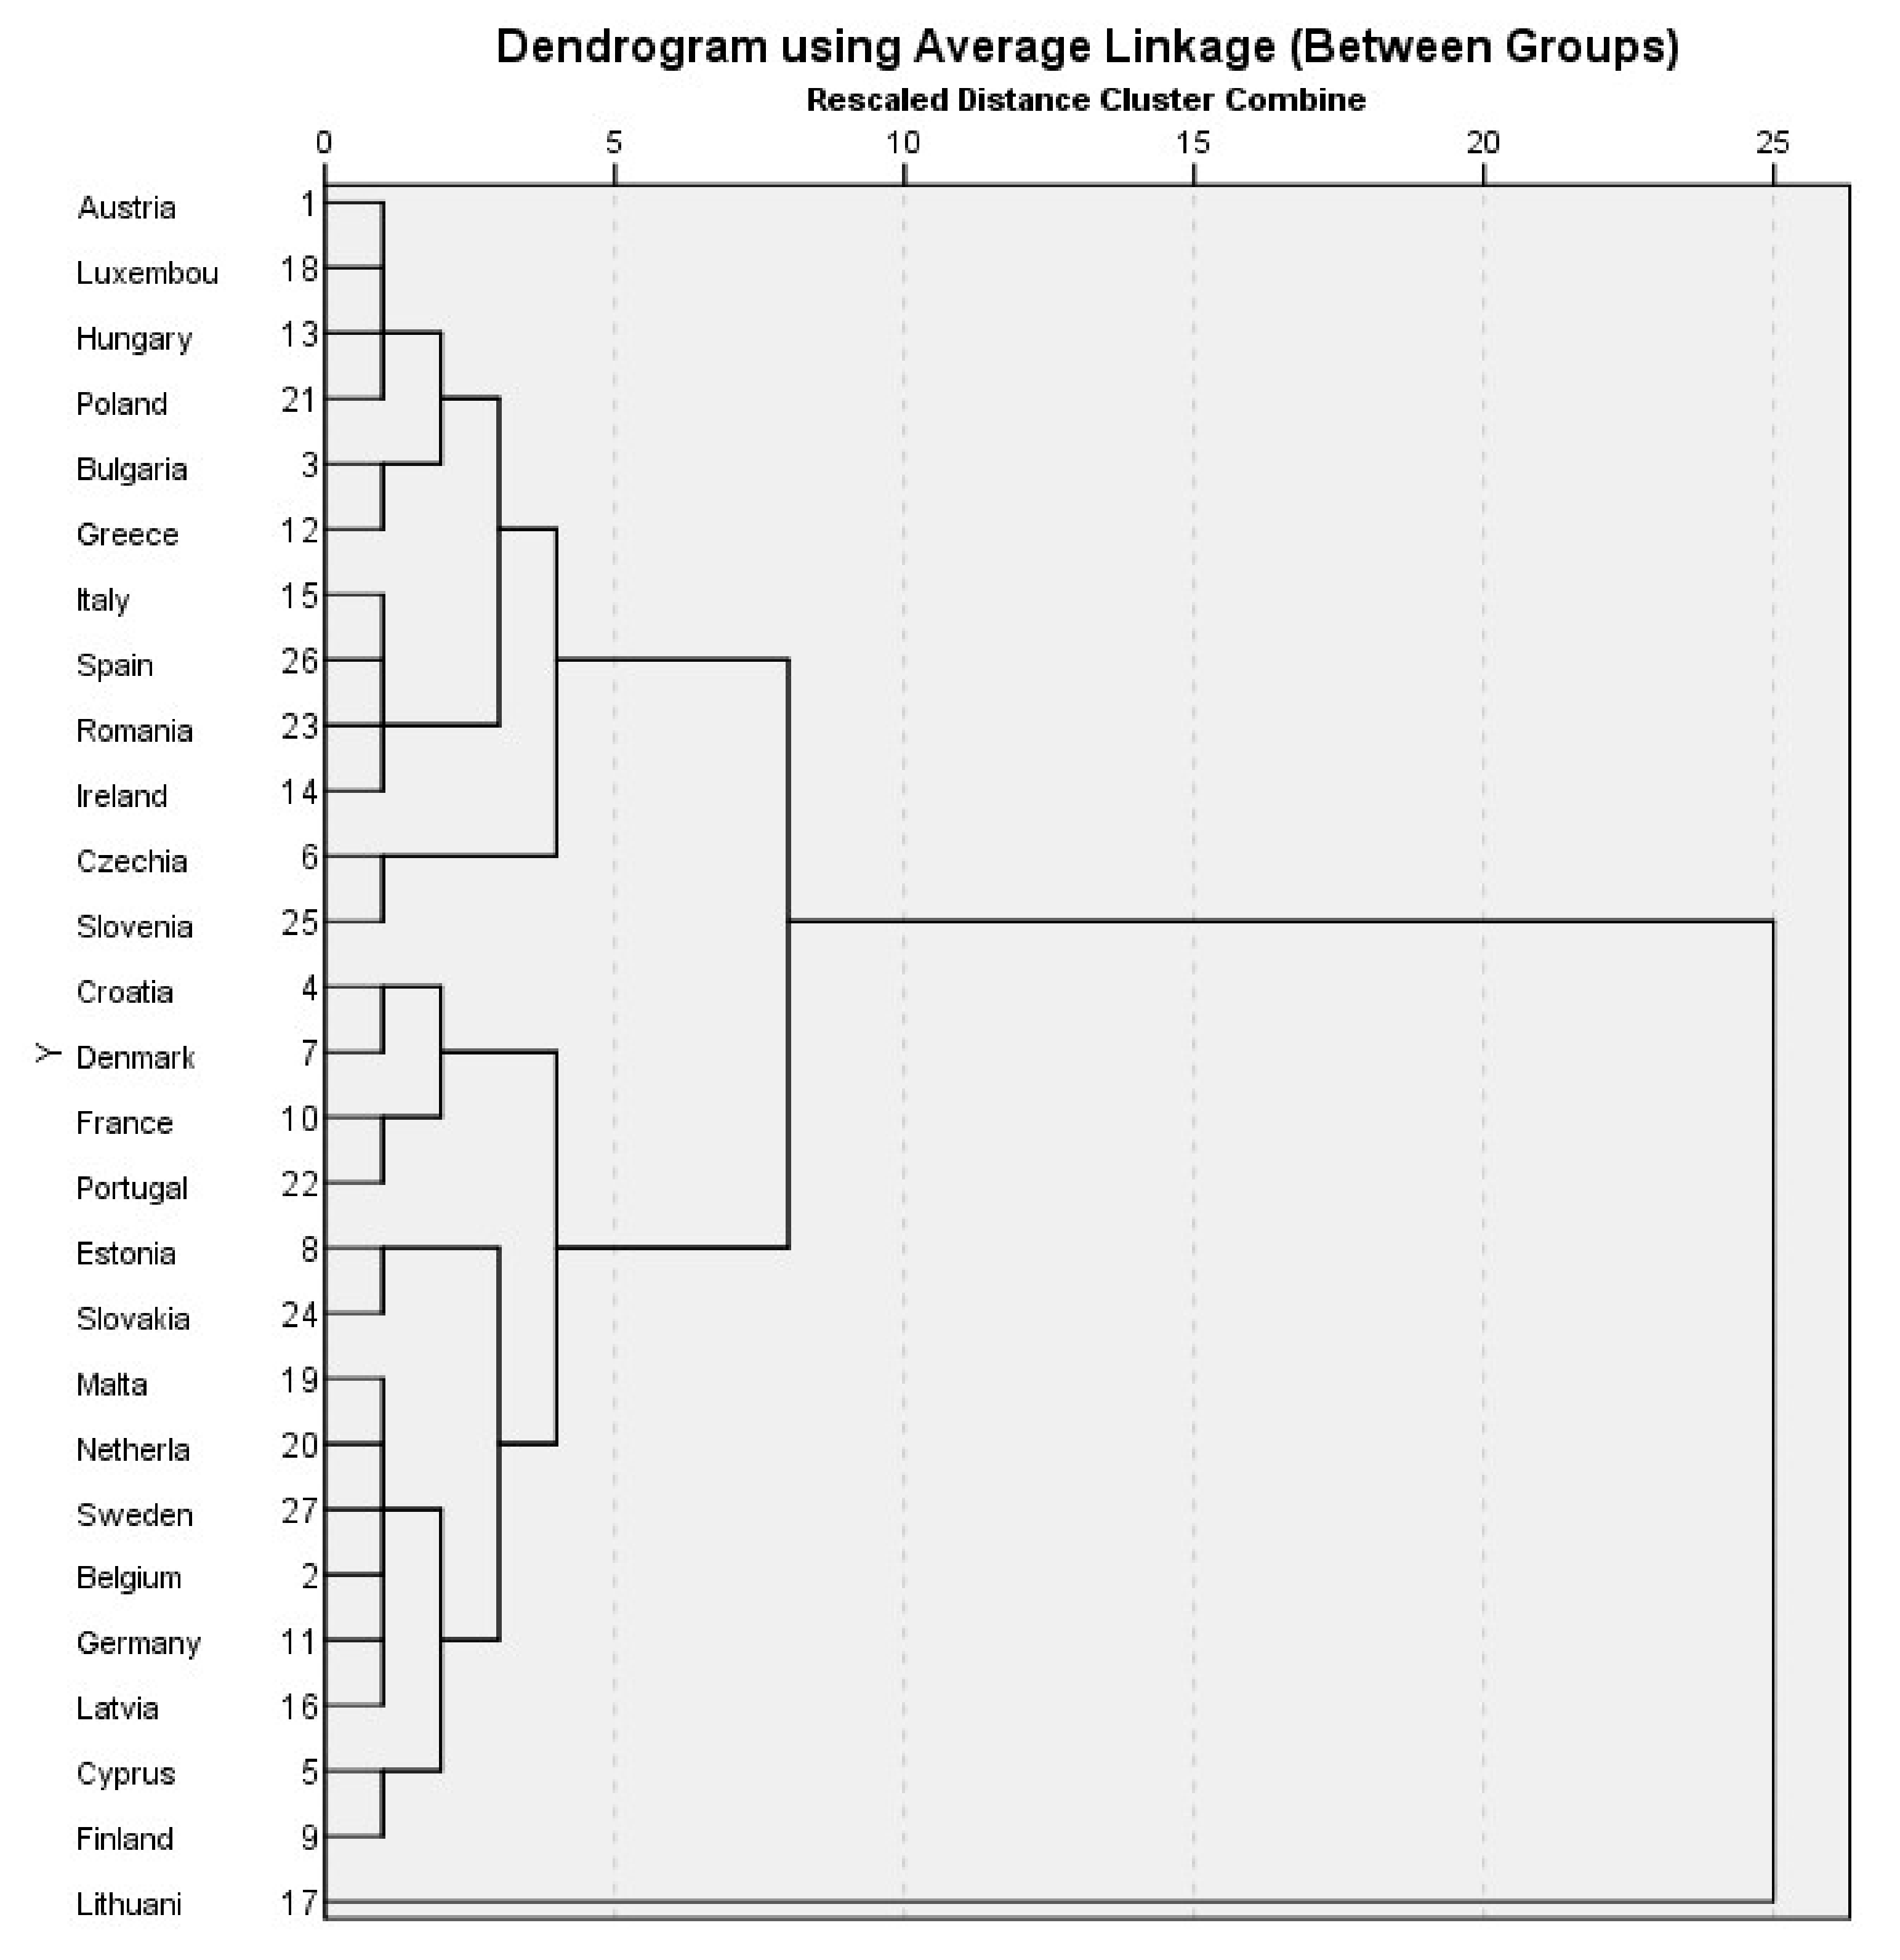
4.3.2. Analysis Clusters
- CLUSTER Number 1—Countries that record a reduction in GHG emissions from transport
- Subcluster 1A—Countries that record a reduction in GHG emissions (76–79% decrease)
- Subcluster 2A—Countries that record a reduction in GHG emissions (54–60% decrease)
- Subcluster 3A—Countries that record a reduction in GHG emissions (decrease 42–49%)
- Subcluster 4A—Countries that record a reduction in GHG emissions (decrease −6% to −25%)
- CLUSTER Number 2—Countries registering an increase in GHG emissions from transport
- Subcluster S1B—Countries registering an increase in GHG emissions (3–11% increase)
- Subcluster S2B—Countries registering an increase in GHG emissions (over 18% increase)
- Subcluster S3B—Countries registering an increase in GHG emissions (48–51% increase)
5. Conclusions and Future Developments
- -
- Energy transition;
- -
- Implementation of specific climate policies for the transport sector;
- -
- International cooperation;
- -
- Call for behavioral changes among populations with the support of education systems.
Critique of FIT for 55
Author Contributions
Funding
Institutional Review Board Statement
Informed Consent Statement
Data Availability Statement
Conflicts of Interest
References
- European Commission. Pactul Ecologic European. 2019. Available online: https://commission.europa.eu/strategy-and-policy/priorities-2019-2024/european-green-deal_ro (accessed on 23 November 2024).
- European Commission. Legea Europeana a Climei. 2021. Available online: https://eur-lex.europa.eu/legal-content/RO/TXT/?uri=LEGISSUM:4536626 (accessed on 24 November 2024).
- European Commission. Delivering the European Green Deal, 2019–2024. Available online: https://commission.europa.eu/strategy-and-policy/priorities-2019-2024/european-green-deal_en (accessed on 23 November 2024).
- Shah, K.J.; Pan, S.-Y.; Lee, I.; Kim, H.; You, Z.; Zheng, J.-M.; Chiang, P.-C. Green transportation for sustainability: Review of current barriers, strategies, and innovative technologies. J. Clean. Prod. 2021, 326, 129392. [Google Scholar] [CrossRef]
- Foltýnová, H.B.; Vejchodská, E.; Rybová, K.; Květoň, V. Sustainable urban mobility: One definition, different stakeholders’ opinions. Transp. Res. Part D Transp. Environ. 2020, 87, 102465. Available online: https://www.sciencedirect.com/science/article/abs/pii/S1361920920306520?via%3Dihub (accessed on 6 December 2024). [CrossRef]
- European Commission. Transporturile și Pactul Verde European. 2019. Available online: https://commission.europa.eu/strategy-and-policy/priorities-2019-2024/european-green-deal/transport-and-green-deal_ro (accessed on 9 November 2024).
- European Environment Agency. Climate, 10 October 2024. Available online: https://www.eea.europa.eu/en/analysis/publications/sustainability-of-europes-mobility-systems/climate (accessed on 9 November 2024).
- Consiliul Uniunii Europene. Mobilitate Curata si Durabila. 2021. Available online: https://www.consilium.europa.eu/ro/policies/clean-and-sustainable-mobility/#goals (accessed on 7 November 2024).
- Consiliul Uniunii Europene. Strategia Pentru o Mobilitate Sustenabilă și Inteligentă—Consiliul Adoptă Concluzii. 2021. Available online: https://www.consilium.europa.eu/ro/press/press-releases/2021/06/03/sustainable-and-smart-mobility-strategy-council-adopts-conclusions/ (accessed on 7 November 2024).
- European Parliament. Directive (EU) 2018/2001 of the European Parliament and of the Council of 11 December 2018 on the Promotion of the Use of Energy from Renewable Sources. 2018. Available online: https://eur-lex.europa.eu/legal-content/EN/TXT/?uri=uriserv:OJ.L_.2018.328.01.0082.01.ENG&toc=OJ:L:2018:328:TOC (accessed on 20 November 2024).
- European Parliament. Directive (EU) 2023/2413 of the European Parliament and of the Council of 18 October 2023 Amending Directive (EU) 2018/2001, Regulation (EU) 2018/1999 and Directive 98/70/EC as Regards the Promotion of Energy from Renewable Sources, and Repealing Council Directive (EU) 2015/652. 2023. Available online: https://eur-lex.europa.eu/legal-content/EN/TXT/?uri=CELEX%3A32023L2413&qid=1699364355105 (accessed on 21 November 2024).
- Directive 2009/28/EC of the European Parliament and of the Council of 23 April 2009 on the promotion of the use of energy from renewable sources. Off. J. Eur. Union 2009, L140, 16–62. Available online: https://eur-lex.europa.eu/legal-content/RO/ALL/?uri=celex:32009L0028 (accessed on 20 November 2024).
- European Commission. Renewable Energy Targets. 2022. Available online: https://energy.ec.europa.eu/topics/renewable-energy/renewable-energy-directive-targets-and-rules/renewable-energy-targets_en (accessed on 20 November 2024).
- Kazancoglu, Y.; Ozbiltekin-Pala, M.; Ozkan-Ozen, Y.D. Prediction and Evaluation of Greenhouse Gas Emissions for Sustainable Road Transport within Europe. Sustain. Cities Soc. 2021, 70, 102924. [Google Scholar] [CrossRef]
- Alhindawi, R.; Abu Nahleh, Y.; Kumar, A.; Shiwakoti, N. Projection of Greenhouse Gas Emissions for the Road Transport Sector Based on Multivariate Regression and the Double Exponential Smoothing Model. Sustainability 2020, 12, 9152. [Google Scholar] [CrossRef]
- Al-lami, A.; Török, Á. Regional Forecasting of Driving Forces of CO2 Emissions of Transportation in Central Europe: An ARIMA-Based Approach. Energy Rep. 2025, 13, 1215–1224. [Google Scholar] [CrossRef]
- Veselík, P.; Sejkorová, M.; Nieoczym, A.; Caban, J. Outlier Identification of Concentrations of Pollutants in Environmental Data Using Modern Statistical Methods. Pol. J. Environ. Stud. 2019, 29, 853–860. [Google Scholar]
- Fan, Y.V.; Perry, S.; Klemeš, J.J.; Lee, C.T. A Review on Air Emissions Assessment: Transportation. J. Clean. Prod. 2018, 194, 673–684. [Google Scholar] [CrossRef]
- Kwilinski, A.; Lyulyov, O.; Pimonenko, T. Reducing Transport Sector CO2 Emissions Patterns: Environmental Technologies and Renewable Energy. J. Open Innov. Technol. Mark. Complex. 2024, 10, 100217. [Google Scholar] [CrossRef]
- Mikulski, M.; Droździel, P.; Tarkowski, S. Reduction of Transport-Related Air Pollution. A Case Study Based on the Impact of the COVID-19 Pandemic on the Level of NOx Emissions in the City of Krakow. Open Eng. 2021, 11, 790–796. [Google Scholar] [CrossRef]
- United Nations Climate Change. The Paris Agreement. 2015. Available online: https://unfccc.int/process-and-meetings/the-paris-agreement (accessed on 20 November 2024).
- United Nations. Transforming Our World: The 2030 Agenda for Sustainable Development. 2015. Available online: https://sdgs.un.org/2030agenda (accessed on 20 November 2024).
- Eurostat. Sustainable Development in the European Union- Monitoring Report on Progress Towards the SDGs in an EU Context, 2024 Edition. Available online: https://ec.europa.eu/eurostat/web/products-flagship-publications/w/ks-05-24-071 (accessed on 21 November 2024).
- Du, J.; Rakha, H.A.; Filali, F.; Eldardiry, H. COVID-19 pandemic impacts on traffic system delay, fuel consumption and emissions. Int. J. Transp. Sci. Technol. 2020, 10, 184–196. [Google Scholar] [CrossRef]
- Ventura, L.M.B.; Ramos, M.B.; D’Agosto, M.D.A.; Gioda, A. Evaluation of the impact of the national strike of the road freight transport sector on the air quality of the metropolitan region of Rio de Janeiro, Brazil. Sustain. Cities Soc. 2020, 65, 102588. [Google Scholar] [CrossRef]
- Dillman, K.J.; Heinonen, J.; Davíðsdottir, B. A Development of Intergenerational Sustainability Indicators and Thresholds for Mobility System Provisioning: A Socio-Ecological Framework in the Context of Strong Sustainability. Environ. Sustain. Indic. 2023, 18, 100240. [Google Scholar] [CrossRef]
- Heidari, I.; Eshlaghy, A.T.; Hoseini, S.M.S. Sustainable transportation: Definitions, dimensions, and indicators—Case study of importance-performance analysis for the city of Tehran. Heliyon 2023, 9, e20457. [Google Scholar] [CrossRef]
- Khurshid, A.; Khan, K.; Cifuentes-Faura, J. 2030 Agenda of Sustainable Transport: Can Current Progress Lead Towards Carbon Neutrality? Transp. Res. Part D Transp. Environ. 2023, 122, 103869. [Google Scholar] [CrossRef]
- Khurshid, A.; Khan, K.; Saleem, S.F.; Cifuentes-Faura, J.; Calin, A.C. Driving Towards a Sustainable Future: Transport Sector Innovation, Climate Change and Social Welfare. J. Clean. Prod. 2023, 427, 139250. [Google Scholar] [CrossRef]
- Solaymani, S. CO2 emissions and the transport sector in Malaysia. Front. Environ. Sci. 2022, 9, 774164. Available online: https://www.frontiersin.org/journals/environmental-science/articles/10.3389/fenvs.2021.774164/full (accessed on 20 November 2024). [CrossRef]
- Alataş, S. Do Environmental Technologies Help to Reduce Transport Sector CO2 Emissions? Evidence from the EU15 Countries. Res. Transp. Econ. 2022, 91, 101047. [Google Scholar] [CrossRef]
- Churchill, S.A.; Inekwe, J.; Ivanovski, K.; Smyth, R. Transport Infrastructure and CO2 Emissions in the OECD over the Long Run. Transp. Res. Part D Transp. Environ. 2021, 95, 102857. [Google Scholar] [CrossRef]
- Liu, Y.; Yuan, Y.; Guan, H.; Sun, X.; Huang, C. Technology and Threshold: An Empirical Study of Road Passenger Transport Emissions. Res. Transp. Bus. Manag. 2021, 38, 100487. [Google Scholar] [CrossRef]
- Wang, Y.; Hayashi, Y.; Chen, J.; Li, Q. Changing Urban Form and Transport CO2 Emissions: An Empirical Analysis of Beijing, China. Sustainability 2014, 6, 4558–4579. [Google Scholar] [CrossRef]
- Vichova, K.; Veselik, P.; Heinzova, R.; Dvoracek, R. Road Transport and Its Impact on Air Pollution during the COVID-19 Pandemic. Sustainability 2021, 13, 11803. [Google Scholar] [CrossRef]
- Acheampong, R.A.; Cugurullo, F.; Gueriau, M.; Dusparic, I. Can Autonomous Vehicles Enable Sustainable Mobility in Future Cities? Insights and Policy Challenges from User Preferences over Different Urban Transport Options. Cities 2021, 112, 103134. [Google Scholar] [CrossRef]
- Suproń, B.; Łącka, I. Research on the Relationship between CO2 Emissions, Road Transport, Economic Growth and Energy Consumption on the Example of the Visegrad Group Countries. Energies 2023, 16, 1340. [Google Scholar] [CrossRef]
- Shafique, M.; Azam, A.; Rafiq, M.; Luo, X. Evaluating the Relationship between Freight Transport, Economic Prosperity, Urbanization, and CO2 Emissions: Evidence from Hong Kong, Singapore, and South Korea. Sustainability 2020, 12, 10664. [Google Scholar] [CrossRef]
- Zhu, L.; Li, Z.; Yang, X.; Zhang, Y.; Li, H. Forecast of Transportation CO2 Emissions in Shanghai under Multiple Scenarios. Sustainability 2022, 14, 13650. [Google Scholar] [CrossRef]
- Xiong, J.; Bai, Y.; Zhao, T.; Zhou, Y.; Sun, X.; Xu, J.; Zhang, W.; Leng, L.; Xu, G. Synergistic Effect of Atmospheric Boundary Layer and Regional Transport on Aggravating Air Pollution in the Twain-Hu Basin: A Case Study. Remote Sens. 2022, 14, 5166. [Google Scholar] [CrossRef]
- Vasiliki, V. Georgatzi, Yeoryios Stamboulis, Apostolos Vetsikas, Examining the determinants of CO2 emissions caused by the transport sector: Empirical evidence from 12 European countries. Econ. Anal. Policy 2020, 65, 11–20. [Google Scholar] [CrossRef]
- Stojanović, Đ.; Ivetić, J.; Veličković, M. Assessment of International Trade-Related Transport CO2 Emissions—A Logistics Responsibility Perspective. Sustainability 2021, 13, 1138. [Google Scholar] [CrossRef]
- Zacharof, N.; Bitsanis, E.; Broekaert, S.; Fontaras, G. Reducing CO2 Emissions of Hybrid Heavy-Duty Trucks and Buses: Paving the Transition to Low-Carbon Transport. Energies 2024, 17, 286. [Google Scholar] [CrossRef]
- Worek, J.; Badura, X.; Białas, A.; Chwiej, J.; Kawoń, K.; Styszko, K. Pollution from Transport: Detection of Tyre Particles in Environmental Samples. Energies 2022, 15, 2816. [Google Scholar] [CrossRef]
- Liu, M.; Chen, Z.; Sowah, J.K.; Ahmed, Z.; Kirikkaleli, D. The Dynamic Impact of Energy Productivity and Economic Growth on Environmental Sustainability in South European Countries. Gondwana Res. 2023, 115, 116–127. [Google Scholar] [CrossRef]
- Arefieva, O.; Polous, O.; Arefiev, S.; Tytykalo, V.; Kwilinski, A. Managing Sustainable Development by Human Capital Reproduction in the System of Company’s Organizational Behavior. IOP Conf. Ser. Earth Environ. Sci. 2021, 628, 012039. [Google Scholar] [CrossRef]
- Li, F.; Zhang, J.; Li, X. Research on Supporting Developing Countries to Achieve Green Development Transition: Based on the Perspective of Renewable Energy and Foreign Direct Investment. J. Clean. Prod. 2022, 372, 133726. [Google Scholar] [CrossRef]
- Shan, S.; Genç, S.Y.; Kamran, H.W.; Dinca, G. Role of Green Technology Innovation and Renewable Energy in Carbon Neutrality: A Sustainable Investigation from Turkey. J. Environ. Manag. 2021, 294, 113004. [Google Scholar] [CrossRef]
- Habiba, U.; Xinbang, C.; Anwar, A. Do Green Technology Innovations, Financial Development, and Renewable Energy Use Help to Curb Carbon Emissions? Renew. Energy 2022, 193, 1082–1093. [Google Scholar] [CrossRef]
- Godil, D.I.; Yu, Z.; Sharif, A.; Usman, R. Syed Abdul Rehman Khan, Investigate the role of technology innovation and renewable energy in reducing transport sector CO2 emission in China: A path toward sustainable development. Sustain. Dev. 2021, 29, 694–707. [Google Scholar] [CrossRef]
- Wen, J.; Okolo, C.V.; Ugwuoke, I.C.; Kolani, K. Research on Influencing Factors of Renewable Energy, Energy Efficiency, on Technological Innovation. Does Trade, Investment and Human Capital Development Matter? Energy Policy 2022, 160, 112718. [Google Scholar] [CrossRef]
- Jurnalul Oficial al Uniunii Europene. Directiva 2009/28/CE a Parlamentului European și a Consiliului din 23 Aprilie 2009 Privind Promovarea Utilizării Energiei din Surse Regenerabile, de Modificare și Ulterior de Abrogare a Directivelor 2001/77/CE și 2003/30/CE. Available online: https://eur-lex.europa.eu/legal-content/RO/TXT/PDF/?uri=CELEX:32009L0028 (accessed on 20 November 2024).
- Jurnalul Oficial al Uniunii Europene. Directiva (UE) 2018/2001 a Parlamentului European și a Consiliului din 11 decembrie 2018 privind promovarea utilizării energiei din surse regenerabile. Available online: https://eur-lex.europa.eu/legal-content/RO/TXT/?uri=celex%3A32018L2001 (accessed on 21 November 2024).
- Jurnalul Oficial al Uniunii Europene. Directiva 2012/27/UE a Parlamentului European și a Consiliului Din 25 Octombrie 2012 Privind Eficiența Energetică, de Modificare a Directivelor 2009/125/CE și 2010/30/UE și de Abrogare a Directivelor 2004/8/CE și 2006/32/CE. Available online: https://eur-lex.europa.eu/legal-content/RO/TXT/PDF/?uri=CELEX:32012L0027 (accessed on 21 November 2024).
- Jurnalul Oficial al Uniunii Europene. Directiva (UE) 2018/2002 a Parlamentului European și a Consiliului din 11 Decembrie 2018 de Modificare a Directivei 2012/27/UE Privind Eficiența Energetică. Available online: https://eur-lex.europa.eu/legal-content/RO/TXT/PDF/?uri=CELEX:32018L2002&from=EN (accessed on 21 November 2024).
- Jurnalul Oficial al Uniunii Europene. Directiva 2009/33/CE a Parlamentului European și a Consiliului din 23 Aprilie 2009 Privind Promovarea Vehiculelor de Transport Rutier Nepoluante și Eficiente din Punct de Vedere Energetic. Available online: https://eur-lex.europa.eu/legal-content/RO/TXT/PDF/?uri=CELEX:02009L0033-20240520 (accessed on 21 November 2024).
- European Union. Sistemul UE de comercializare a certificatelor de emisii Sinteză privind: Directiva 2003/87/CE de stabilire a unui sistem de comercializare a cotelor de emisie de gaze cu efect de seră în cadrul Uniunii Europene. Available online: https://eur-lex.europa.eu/RO/legal-content/summary/eu-emissions-trading-system.html (accessed on 21 November 2024).
- Mwasilu, F.; Justo, J.J.; Kim, E.-K.; Do, T.D.; Jung, J.-W. Electric Vehicles and Smart Grid Interaction: A Review on Vehicle to Grid and Renewable Energy Sources Integration. Renew. Sustain. Energy Rev. 2014, 34, 501–516. [Google Scholar] [CrossRef]
- Yuksel, I.; Kaygusuz, K. Renewable Energy Sources for Clean and Sustainable Energy Policies in Turkey. Renew. Sustain. Energy Rev. 2011, 15, 4132–4144. [Google Scholar] [CrossRef]
- Barman, P.; Dutta, L.; Bordoloi, S.; Kalita, A.; Buragohain, P.; Bharali, S.; Azzopardi, B. Renewable Energy Integration with Electric Vehicle Technology: A Review of the Existing Smart Charging Approaches. Renew. Sustain. Energy Rev. 2023, 183, 113518. [Google Scholar] [CrossRef]
- Raihan, A.; Rashid, M.; Voumik, L.C.; Akter, S.; Esquivias, M.A. The Dynamic Impacts of Economic Growth, Financial Globalization, Fossil Fuel, Renewable Energy, and Urbanization on Load Capacity Factor in Mexico. Sustainability 2023, 15, 13462. [Google Scholar] [CrossRef]
- Almeida, D.; Carvalho, L.; Ferreira, P.; Dionísio, A.; Haq, I.U. Global Dynamics of Environmental Kuznets Curve: A Cross-Correlation Analysis of Income and CO2 Emissions. Sustainability 2024, 16, 9089. [Google Scholar] [CrossRef]
- Mosconi, E.M.; Colantoni, A.; Gambella, F.; Cudlinová, E.; Salvati, L.; Rodrigo-Comino, J. Revisiting the Environmental Kuznets Curve: The Spatial Interaction between Economy and Territory. Economies 2020, 8, 74. [Google Scholar] [CrossRef]
- Wang, H.; Jin, Y.; Hong, X.; Tian, F.; Wu, J.; Nie, X. Integrating IPAT and CLUMondo Models to Assess the Impact of Carbon Peak on Land Use. Land 2022, 11, 573. [Google Scholar] [CrossRef]
- Gómez-Elvira, J.; González-Gil, J.; García-Rodríguez, J.M.; González-Gil, J.M.; García-Rodríguez, J.M. New Perspectives and Challenges in Traffic and Transportation Engineering Supporting Energy Saving in Smart Cities—A Multidisciplinary Approach to a Global Problem. Energies 2023, 15, 4191. [Google Scholar] [CrossRef]
- Eurostat. Air Emmisions Accounts. Available online: https://ec.europa.eu/eurostat/databrowser/view/env_ac_ainah_r2__custom_13622705/default/table?lang=en (accessed on 20 November 2024).
- Eurostat. Gross Domestic Products—GDP. Available online: https://ec.europa.eu/eurostat/databrowser/view/nama_10_gdp/default/table?lang=en (accessed on 21 November 2024).
- Eurostat. Share of Renewable Energy in Gross Final Energy Consumption by Sector—Renewable Energy Sources in Transport. Available online: https://ec.europa.eu/eurostat/databrowser/view/sdg_07_40/default/table?lang=en&category=sdg.sdg_13 (accessed on 22 November 2024).
- World Bank Group. Urban Population (% of Total Population)—European Union. Available online: https://data.worldbank.org/indicator/SP.URB.TOTL.IN.ZS?locations=EU&name_desc=false (accessed on 20 November 2024).
- Eurostat. Final Energy Consumption in Transport by Type of Fuel. Available online: https://ec.europa.eu/eurostat/databrowser/view/ten00126/default/table?lang=en (accessed on 20 November 2024).
- I.B.M SPSS. Statistical Package for the Social Sciences. Available online: https://www.ibm.com/products/spss-statistics (accessed on 29 November 2024).
- Taylor, S.J.; Letham, B. Forecasting at scale. Am. Stat. 2018, 72, 37–45. [Google Scholar]
- Dudek, G. Pattern similarity-based methods for short-term load forecasting—Part 1: Principles. Appl. Soft Comput. 2015, 37, 277–287. [Google Scholar]
- Franses, P.H.; Dijk, D.V.; Opschoor, A. Time Series Models for Business and Economic Forecasting; Cambridge Books; Cambridge University Press: Cambridge, UK, 2014; Volume 2, pp. 77–131. [Google Scholar]
- Harvey, A.C.; Peters, S. Estimation procedures for structural time series models. J. Forecast. 1990, 9, 89–108. [Google Scholar]
- Borowski, P.F. Efforts of the Transport and Energy Sectors Toward Renewable Energy for Climate Neutrality. Transp. Probl. 2024, 19, 177–190. [Google Scholar] [CrossRef]
- Xu, J.; Akhtar, M.; Haris, M.; Muhammad, S.; Abban, O.J.; Taghizadeh-Hesary, F. Energy crisis, firm profitability, and productivity: An emerging economy perspective. Energy Strategy Rev. 2022, 41, 100849. [Google Scholar] [CrossRef]
- Borowski, P.F. Mitigating climate change and the development of green energy versus a return to fossil fuels due to the energy crisis in 2022. Energies 2022, 15, 9289. [Google Scholar] [CrossRef]

| Variable | Data Sets | Measures | References |
|---|---|---|---|
| Air emissions account by NACE Rev. 2 activity (transportation and storage)—carbon dioxide | EU states air emissions accounts by NACE Rev. 2 activity (transportation and storage)—Air pollutants and greenhouse gases:Greenhouse gases—carbon dioxide, nitrous oxide (CO2, N2O in CO2 equivalent) | Tonne | Eurostat [66] |
| Gross Domestic Product (GDP) | EU states GDP 2009–2021 | Current prices, million Euro | Eurostat [67] |
| Share of renewable energy in gross final energy consumption by sector—Renewable energy sources in transport | EU states—Share of renewable energy in gross final energy consumption by sector—Renewable energy sources in transport | Percentage | Eurostat [68] |
| Urban population | EU states—Urban population | Percentage | Data Worldbank [69] |
| Final energy consumption in transport by type of fuel—of oil equivalent | EU states—Final energy consumption in transport by type of fuel | Thousand tons of oil equivalent | Eurostat [70] |
| Correlations | ||||||
|---|---|---|---|---|---|---|
| Renewable Energy | GDP | GHG | Energy Consumption | Urban Population | ||
| Renewable energy | Pearson Correlation | 1 | −0.157 | −0.135 | −0.181 | −0.124 |
| Sig. (2-tailed) | 0.435 | 0.502 | 0.365 | 0.537 | ||
| N | 27 | 27 | 27 | 27 | 27 | |
| GDP | Pearson Correlation | −0.157 | 1 | 0.939 ** | 0.972 ** | 0.171 |
| Sig. (2-tailed) | 0.435 | 0.000 | 0.000 | 0.395 | ||
| N | 27 | 27 | 27 | 27 | 27 | |
| GHG | Pearson Correlation | −0.135 | 0.939 ** | 1 | 0.906 ** | 0.222 |
| Sig. (2-tailed) | 0.502 | 0.000 | 0.000 | 0.267 | ||
| N | 27 | 27 | 27 | 27 | 27 | |
| Energy Consumption | Pearson Correlation | −0.181 | 0.972 ** | 0.906 ** | 1 | 0.118 |
| Sig. (2-tailed) | 0.365 | 0.000 | 0.000 | 0.557 | ||
| N | 27 | 27 | 27 | 27 | 27 | |
| Urban Population | Pearson Correlation | −0.124 | 0.171 | 0.222 | 0.118 | 1 |
| Sig. (2-tailed) | 0.537 | 0.395 | 0.267 | 0.557 | ||
| N | 27 | 27 | 27 | 27 | 27 | |
| Model Summary | ||
|---|---|---|
| Training | Sum of Squares Error | 2.587 |
| Relative Error | 0.323 | |
| Stopping Rule Used | 1 consecutive step(s) with no decrease in error a | |
| Training Time | 0:00:00.00 | |
| Testing | Sum of Squares Error | 0.107 |
| Relative Error | 0.035 | |
| Dependent Variable: GHG | ||
| Parameter Estimates | |||
|---|---|---|---|
| Predictor | Predicted | ||
| Hidden Layer 1 | Output Layer | ||
| H(1:1) | GHG | ||
| Input Layer | (Bias) | −0.515 | |
| Renewable energy | 0.002 | ||
| GDP | 0.583 | ||
| Energy Consumption | 0.650 | ||
| Urban Population | 0.089 | ||
| Hidden Layer 1 | (Bias) | 0.485 | |
| H(1:1) | 1.348 | ||
| Country | 2025 | 2030 | 2035 | 2040 | 2045 | 2050 |
|---|---|---|---|---|---|---|
| Austria | 7392.92 | 8259.07 | 9226.09 | 8597.44 | 9604.79 | 10,730.05 |
| Belgium | 4961.78 | 3797.16 | 2913.16 | 1872.67 | 1429.30 | 1093.65 |
| Bulgaria | 7738.76 | 8692.62 | 9760.92 | 10,213.59 | 11,475.87 | 12,890.30 |
| Croatia | 1144.70 | 941.26 | 773.72 | 580.94 | 477.73 | 392.72 |
| Cyprus | 259.65 | 215.65 | 179.07 | 159.46 | 132.38 | 109.86 |
| Czechia | 9966.01 | 11,091.78 | 12,342.64 | 12,911.58 | 14,372.19 | 15,995.63 |
| Denmark | 36,592.07 | 32,270.54 | 28,450.53 | 22,497.02 | 19,845.58 | 17,501.76 |
| Estonia | 910.98 | 549.97 | 331.75 | 159.36 | 95.91 | 57.55 |
| Finland | 6415.76 | 4836.21 | 3645.61 | 2545.20 | 1918.32 | 1445.86 |
| France | 59,232.11 | 65,809.14 | 72,700.98 | 59,846.37 | 66,865.56 | 74,290.19 |
| Germany | 57,720.84 | 44,810.13 | 34,772.82 | 21,376.56 | 16,600.69 | 12,887.37 |
| Greece | 20,310.47 | 20,609.88 | 20,970.84 | 18,400.71 | 18,620.27 | 18,894.77 |
| Hungary | 6380.24 | 7060.78 | 7812.29 | 6772.98 | 7496.41 | 8295.99 |
| Ireland | 12,749.32 | 13,053.05 | 13,362.90 | 10,208.10 | 10,451.23 | 10,700.21 |
| Italy | 40,779.52 | 46,141.67 | 52,143.54 | 44,327.98 | 50,215.19 | 56,818.01 |
| Latvia | 1781.91 | 1376.89 | 1063.82 | 639.99 | 494.36 | 381.83 |
| Lithuania | 8626.49 | 9588.78 | 10,661.17 | 13,775.68 | 15,309.03 | 17,016.68 |
| Luxembourg | 4388.78 | 4002.81 | 3665.31 | 3005.69 | 2730.37 | 2490.22 |
| Malta | 287.94 | 228.40 | 181.11 | 106.16 | 84.07 | 66.54 |
| Netherlands | 18,857.18 | 15,894.20 | 13,424.74 | 8614.45 | 7245.06 | 6106.56 |
| Poland | 13,767.49 | 18,878.11 | 25,880.42 | 21,110.00 | 28,947.36 | 39,692.49 |
| Portugal | 7131.72 | 7157.62 | 7182.57 | 5460.54 | 5480.70 | 5500.60 |
| Romania | 5944.07 | 5617.89 | 5308.13 | 4803.11 | 4540.73 | 4291.54 |
| Slovakia | 1488.18 | 834.46 | 467.70 | 220.03 | 123.00 | 68.57 |
| Slovenia | 1126.29 | 1338.56 | 1590.62 | 1546.18 | 1837.60 | 2183.80 |
| Spain | 38,147.10 | 39,142.98 | 40,159.26 | 35,596.94 | 36,529.72 | 37,483.38 |
| Sweden | 5409.02 | 4319.62 | 3449.31 | 2425.88 | 1937.26 | 1546.96 |
| Subclusters | Country | 2012 | 2030 | Percentage Change (%) | Region in Europe |
|---|---|---|---|---|---|
| Subcluster 1A | Estonia | 2620.75 | 549.97 | −79.01 | Northern Europe |
| Slovakia | 3515.00 | 834.46 | −76.26 | Central and Eastern Europe | |
| Subcluster 2A | Cyprus | 548.20 | 215.65 | −60.66 | Southern Europe |
| Finland | 10,602.02 | 4836.21 | −54.38 | Northern Europe | |
| Subcluster 3A | Germany | 89,054.37 | 44,810.13 | −49.68 | Western Europe |
| Belgium | 7477.20 | 3797.16 | −49.21 | Western Europe | |
| Latvia | 2569.45 | 1376.89 | −46.41 | Northern Europe | |
| Malta | 407.34 | 228.40 | −43.92 | Southern Europe | |
| Netherlands | 28,232.16 | 15,894.20 | −43.70 | Western Europe | |
| Sweden | 7481.73 | 4319.62 | −42.26 | Northern Europe | |
| Subcluster 4A | Croatia | 1259.61 | 941.26 | −25.27 | Southern Europe |
| Denmark | 42,113.57 | 32,270.54 | −23.37 | Northern Europe | |
| Portugal | 8243.28 | 7157.62 | −13.17 | Southern Europe | |
| France | 70,354.22 | 65,809.14 | −6.46 | Western Europe |
| Subclustere | Country | 2012 | 2030 | Percentage Change (%) | Region in Europe |
|---|---|---|---|---|---|
| Subcluster 1B | Ireland | 12,577.77 | 13,053.05 | 3.77 | Western Europe |
| Italy | 42,712.44 | 46,141.67 | 8.02 | Southern Europe | |
| Spain | 35,648.51 | 39,142.98 | 9.80 | Southern Europe | |
| Romania | 5027.23 | 5617.89 | 11.74 | Central and Eastern Europe | |
| Subcluster 2B | Poland | 15,944.10 | 18,878.11 | 18.40 | Central and Eastern Europe |
| Austria | 6591.28 | 8259.07 | 25.30 | Central Europe | |
| Luxembourg | 3193.08 | 4002.81 | 25.35 | Western Europe | |
| Hungary | 5477.78 | 7060.78 | 28.89 | Central and Eastern Europe | |
| Greece | 15,312.32 | 20,609.88 | 34.59 | Central and Eastern Europe | |
| Bulgaria | 6287.09 | 8692.62 | 38.26 | Central and Eastern Europe | |
| Subcluster 3B | Czechia | 7463.32 | 11,091.78 | 48.61 | Central and Eastern Europe |
| Slovenia | 882.52 | 1338.56 | 51.67 | Central and Eastern Europe |
Disclaimer/Publisher’s Note: The statements, opinions and data contained in all publications are solely those of the individual author(s) and contributor(s) and not of MDPI and/or the editor(s). MDPI and/or the editor(s) disclaim responsibility for any injury to people or property resulting from any ideas, methods, instructions or products referred to in the content. |
© 2025 by the authors. Licensee MDPI, Basel, Switzerland. This article is an open access article distributed under the terms and conditions of the Creative Commons Attribution (CC BY) license (https://creativecommons.org/licenses/by/4.0/).
Share and Cite
Scrioșteanu, A.; Criveanu, M.M. Sustainable Transport Between Reality and Legislative Provisions—The Source for the Climate Neutrality of the European Union. Sustainability 2025, 17, 2814. https://doi.org/10.3390/su17072814
Scrioșteanu A, Criveanu MM. Sustainable Transport Between Reality and Legislative Provisions—The Source for the Climate Neutrality of the European Union. Sustainability. 2025; 17(7):2814. https://doi.org/10.3390/su17072814
Chicago/Turabian StyleScrioșteanu, Adriana, and Maria Magdalena Criveanu. 2025. "Sustainable Transport Between Reality and Legislative Provisions—The Source for the Climate Neutrality of the European Union" Sustainability 17, no. 7: 2814. https://doi.org/10.3390/su17072814
APA StyleScrioșteanu, A., & Criveanu, M. M. (2025). Sustainable Transport Between Reality and Legislative Provisions—The Source for the Climate Neutrality of the European Union. Sustainability, 17(7), 2814. https://doi.org/10.3390/su17072814