Article

Simulation and Optimization of New Energy Vehicles Promotion Policy Strategies Considering Energy Saving, Carbon Reduction, and Consumers’ Willingness Based on System Dynamics

1
College of Economics and Management, Nanjing University of Aeronautics and Astronautics, Nanjing 211106, China
2
College of Information and Management Science, Henan Agricultural University, Zhengzhou 450046, China
*
Author to whom correspondence should be addressed.
Sustainability 2025, 17(7), 2811; https://doi.org/10.3390/su17072811
Submission received: 20 February 2025 / Revised: 14 March 2025 / Accepted: 18 March 2025 / Published: 21 March 2025

Abstract

:
New energy vehicles are an important tool for the transition to clean energy and sustainable development. The Nudge Theory is introduced to construct a management model for energy conservation and carbon reduction in new energy vehicles. The model takes into account the strategy of reducing or exempting charging fees for new energy vehicles. Through dynamic simulation, we analyze the impact of considering the Nudge Theory and not considering the Nudge Theory on the energy-saving and carbon reduction effect of new energy vehicles. Through the analysis, it is found that (1) the energy-saving and carbon reduction management model is constructed by introducing the consumer reference effect to optimize the effect of the strategy of charging fee reduction for new energy vehicles, which further enhances the effect of energy saving and carbon reduction. (2) The consideration of the boosting strategy can increase the consumers’ willingness to purchase new energy vehicles, and the growth of new energy vehicles is more significant under the combined strategy compared with the baseline scenario. In the combined strategy, from the beginning of the simulation of Scenario 6 to the end of the simulation, new energy vehicles increased by 131.74%. (3) In terms of energy-saving and carbon reduction effects, Scenario 3 in the single strategy has the best effect, and Scenario 9 in the combined strategy has the best effect. Compared with the baseline scenario, the number of new energy vehicles increased by 253.03%, and carbon dioxide emissions decreased by 38.85%. Scenario 9 of the combined strategy can reach the peak of carbon emissions by 2030, and carbon dioxide emissions will decrease year by year.

1. Introduction

In recent years, with the rapid development of the automobile industry, the large amount of automobile exhaust emissions has caused serious pollution to the environment [1], and the energy crisis and climate change have put great pressure on the sustainable development of the world. The large amount of carbon dioxide emissions affects the ecosystem and leads to climate change, such as global warming, melting of glaciers, and frequent occurrence of extreme weather [2]. Therefore, we must pay attention to the issue of energy saving and carbon reduction and take effective measures. The transportation sector accounts for about 24% of global carbon emissions [3] and is the second largest source of carbon emissions globally, after the power sector [4]. Passenger cars and buses are the main sources of total CO2 emissions [5]. And the development of electric vehicles has been recognized globally as one of the most effective ways to mitigate climate change, reduce dependence on fossil energy, and transition to clean energy [6].
Currently, scholars hold different views on whether new energy vehicles can achieve energy savings and carbon reduction. (1) In the use stage, compared with traditional fuel vehicles, new energy vehicles can significantly reduce the emission of pollutants, such as sulfur dioxide, nitrogen dioxide, particulate matter, etc. [7], and improve the hazy weather in cities and the quality of the environment [8,9]. In addition, new energy vehicles can reduce carbon dioxide emissions, mitigate climate change [10], and help promote sustainable urban development [11,12]. (2) However, there are also scholars who believe that new energy vehicles will increase greenhouse gas emissions. This is because a large amount of steel is needed in the production process of new energy vehicles, and the production of steel requires a large amount of raw materials such as ore [13]; therefore, a large amount of CO2 will be generated in the process of steel [14]. In addition, new energy vehicles are completely dependent on electricity, most of which is provided through coal combustion [15], and CO2 and particulate matter are also generated during the power generation process.
In order to promote new energy vehicles to cope with the energy crisis and climate change, promote the green transformation of the industry, and make it a new economic growth point, many countries have introduced various support policies. (1) In the early stage of the development of new energy vehicles, the high cost of research and development is a constraint to the development of new energy vehicles, while the subsidy policy can effectively enhance their sales. For example, the subsidy policies implemented by the Chinese government have increased the sales of new energy vehicles (NEVs) by 62%; however, the environmental quality has not improved [16]; some U.S. states provide subsidies for the sales of new energy vehicles [17], and the subsidy for a new energy vehicle reaches 12,500 U.S. dollars after 2021; the German subsidy for new energy vehicles has increased by 20% from 2021 onwards. In Germany, subsidies for new energy vehicles have been increased by 20% since 2021. China has implemented a subsidy policy since 2009, which has played a key role in the promotion of new energy vehicles, with sales of new energy vehicles increasing by 860,000 units from 2016 to 2020 [18]. The new energy vehicle subsidy policy can reduce carbon emissions by promoting a green transition in consumers’ vehicle purchase structure [19]. Scholars have also conducted in-depth studies on various policies related to new energy vehicles. For example, in terms of the impact of driving restriction policies on air pollution, studies have found that intermittent driving restriction policies are more effective in improving air quality [20]. In addition, the double points policy implemented in China can effectively promote the development of new energy vehicles and achieve emission reduction targets. However, the policy also has the potential risk of failure. To address this issue, scholars have introduced a hedging mechanism that reduces the probability of policy failure by five percent [21].
Studies on different aspects of new energy vehicles are as follows: some scholars have optimized the prediction methods for charging pile occupancy, charging volume, and the charging market, thereby enhancing the accuracy of forecasts [22]. Other scholars have proposed a bi-level coordination scheme that optimizes the economic operation of multi-energy building microgrids (MEBM). The scheme effectively solves uncertainty problems such as power demand and environmental conditions and achieves high computational efficiency and strong interference resistance [23]. Research on the safety of new energy vehicles includes analyzing the safety status quo and causes of spontaneous combustion in new energy vehicles and proposing methods for early diagnosis of battery anomalies [24,25]. In addition, some research focuses on the recycling of batteries in new energy vehicles, e.g., investigating the impact of the introduction of recycling of used batteries from the supply chain of new energy vehicles and the impact of blockchain technology on the prevention of information leakage [26]. To further improve the energy efficiency of new energy vehicles, some scholars have developed deep reinforcement learning algorithms that have improved battery life by 3.79% and reduced operating costs by 2.71% [27]. Learning-based model predictive control (L-MPC) energy management strategies can also extend battery life and reduce operating costs [28].
Regarding the influencing factors on the willingness to purchase new energy vehicles, they can be roughly categorized into three groups: one part is the performance of new energy vehicles, such as range, price, cost, charging infrastructure, etc.; the other part is the psychology of the consumers, including consumers’ demographics, income, education, gender, green attitudes, and perceived value; and lastly, external influencing factors include promotion policies, oil prices, and so on. The purchase cost of new energy vehicles and the improvement of infrastructure are the determining factors of residents’ willingness to purchase [29]. In addition, the convenience of charging, the length of charging time, and charging infrastructure also affect the willingness to purchase new energy vehicles [30]. Age and education level also affect the willingness to purchase new energy vehicles, and studies show that the older the age or the higher the education level, the greater the likelihood of consumers purchasing new energy vehicles. Green advertisements affect consumers’ purchase intention through green perceived value and green product attitude [31], which suggests that consumers’ environmental awareness also affects their choice behavior. With events such as economic changes, political unrest, military actions, and terrorist attacks, which lead to sharp increases in oil prices, consumers may lower their expectations of mileage, etc., and thus favor new energy vehicles [32,33].
The above research results provide value for China to enhance consumers’ willingness to purchase new energy vehicles and achieve the goal of carbon neutrality. However, the existing research mainly focuses on the impact of new energy vehicle-related policies on consumers’ willingness to purchase and the effect of energy saving and carbon reduction in new energy vehicles, but fewer studies have focused on how policies can enhance consumers’ willingness to purchase by influencing their psychological factors so as to achieve the goal of energy saving and carbon reduction. To this end, this paper constructs an optimization model of energy-saving and carbon-reducing strategies for new energy vehicles considering the Nudge Theory, conducts dynamic simulations of the main variables under the scenario of implementing the charging fee reduction policy and considering the Nudge Theory, and analyzes the optimization effect of energy-saving and carbon-reducing effects of new energy vehicles under the combined scenario, so as to provide theoretical references and policy suggestions for the protection of the environment to achieve sustainable development and the ‘dual-carbon’ goal. The academic tributes of this paper are as follows:
(1)
Innovation 1: Algorithm Incorporating Consumer Reference Effect
This study constructs a novel algorithm for predicting the growth rate of new energy vehicles (NEVs) by incorporating the consumer reference effect, a factor often overlooked in existing research. This algorithm uniquely analyzes how charging fee reduction policies influence consumer purchasing behavior and, consequently, the sales of NEVs. By integrating the consumer reference effect, the model provides a more accurate and realistic assessment of policy impacts, offering valuable insights for policymakers to design effective incentives.
(2)
Innovation 2: System Dynamics Model for Energy Saving and Carbon Reduction
Building on this algorithm, the study establishes a comprehensive system dynamics model to evaluate the energy-saving and carbon-reducing potential of NEVs. This model simulates and analyzes energy consumption and carbon dioxide emissions under various policy combinations, employing both quantitative and qualitative approaches. The results not only validate the environmental benefits of NEVs but also provide a robust framework for optimizing policy strategies to maximize their ecological and economic impacts. The structure of this paper is organized as follows: Section 2 primarily explains the data sources, methods, and models; Section 3 focuses on the construction of the algorithm; Section 4 presents the simulation results; and Section 5 discusses and summarizes the conclusions.

2. Method and Model

2.1. Method

System dynamics (SD) was founded by Jay Wright Forrester of the Massachusetts Institute of Technology in 1956. It is a discipline that uses system theory, feedback theory, etc., to conduct qualitative and quantitative analysis of complex dynamic systems to study the laws of their structure, function, and behavior changes. It is widely used in production and supply management, urban planning and management, waste battery recycling, pollution reduction, carbon reduction, and other fields as follows:
(1)
The five-step modeling approach of system dynamics is as follows: First, the system boundaries are defined, a causal loop diagram is constructed, and causality analysis is conducted. Next, the SD model is established, and validation is performed. Then, the dynamic simulations of key variables are conducted under different scenarios. After that, the solutions are optimized based on the simulation results. Finally, the countermeasures are proposed to enhance the energy-saving and carbon reduction effects of new energy vehicles.
(2)
Nudge Theory is a behavioral science theory proposed by behavioral economists Richard Thaler and Cass Sunstein. Its core idea is to guide people toward making better decisions in a non-coercive manner by designing choice architecture without restricting their freedom of choice. The basic principles include influencing people’s behavior through small, low-cost design changes and designing interventions based on principles from psychology and behavioral economics (e.g., loss aversion, herd mentality). The implementation of Nudge Theory typically involves the following steps: first, clarifying the behavior or decision that needs to be changed; second, analyzing the behavioral patterns and psychological motivations of the target group and identifying key factors influencing behavior; and finally, developing nudge strategies, such as default options, framing effects, social norms, and so on.

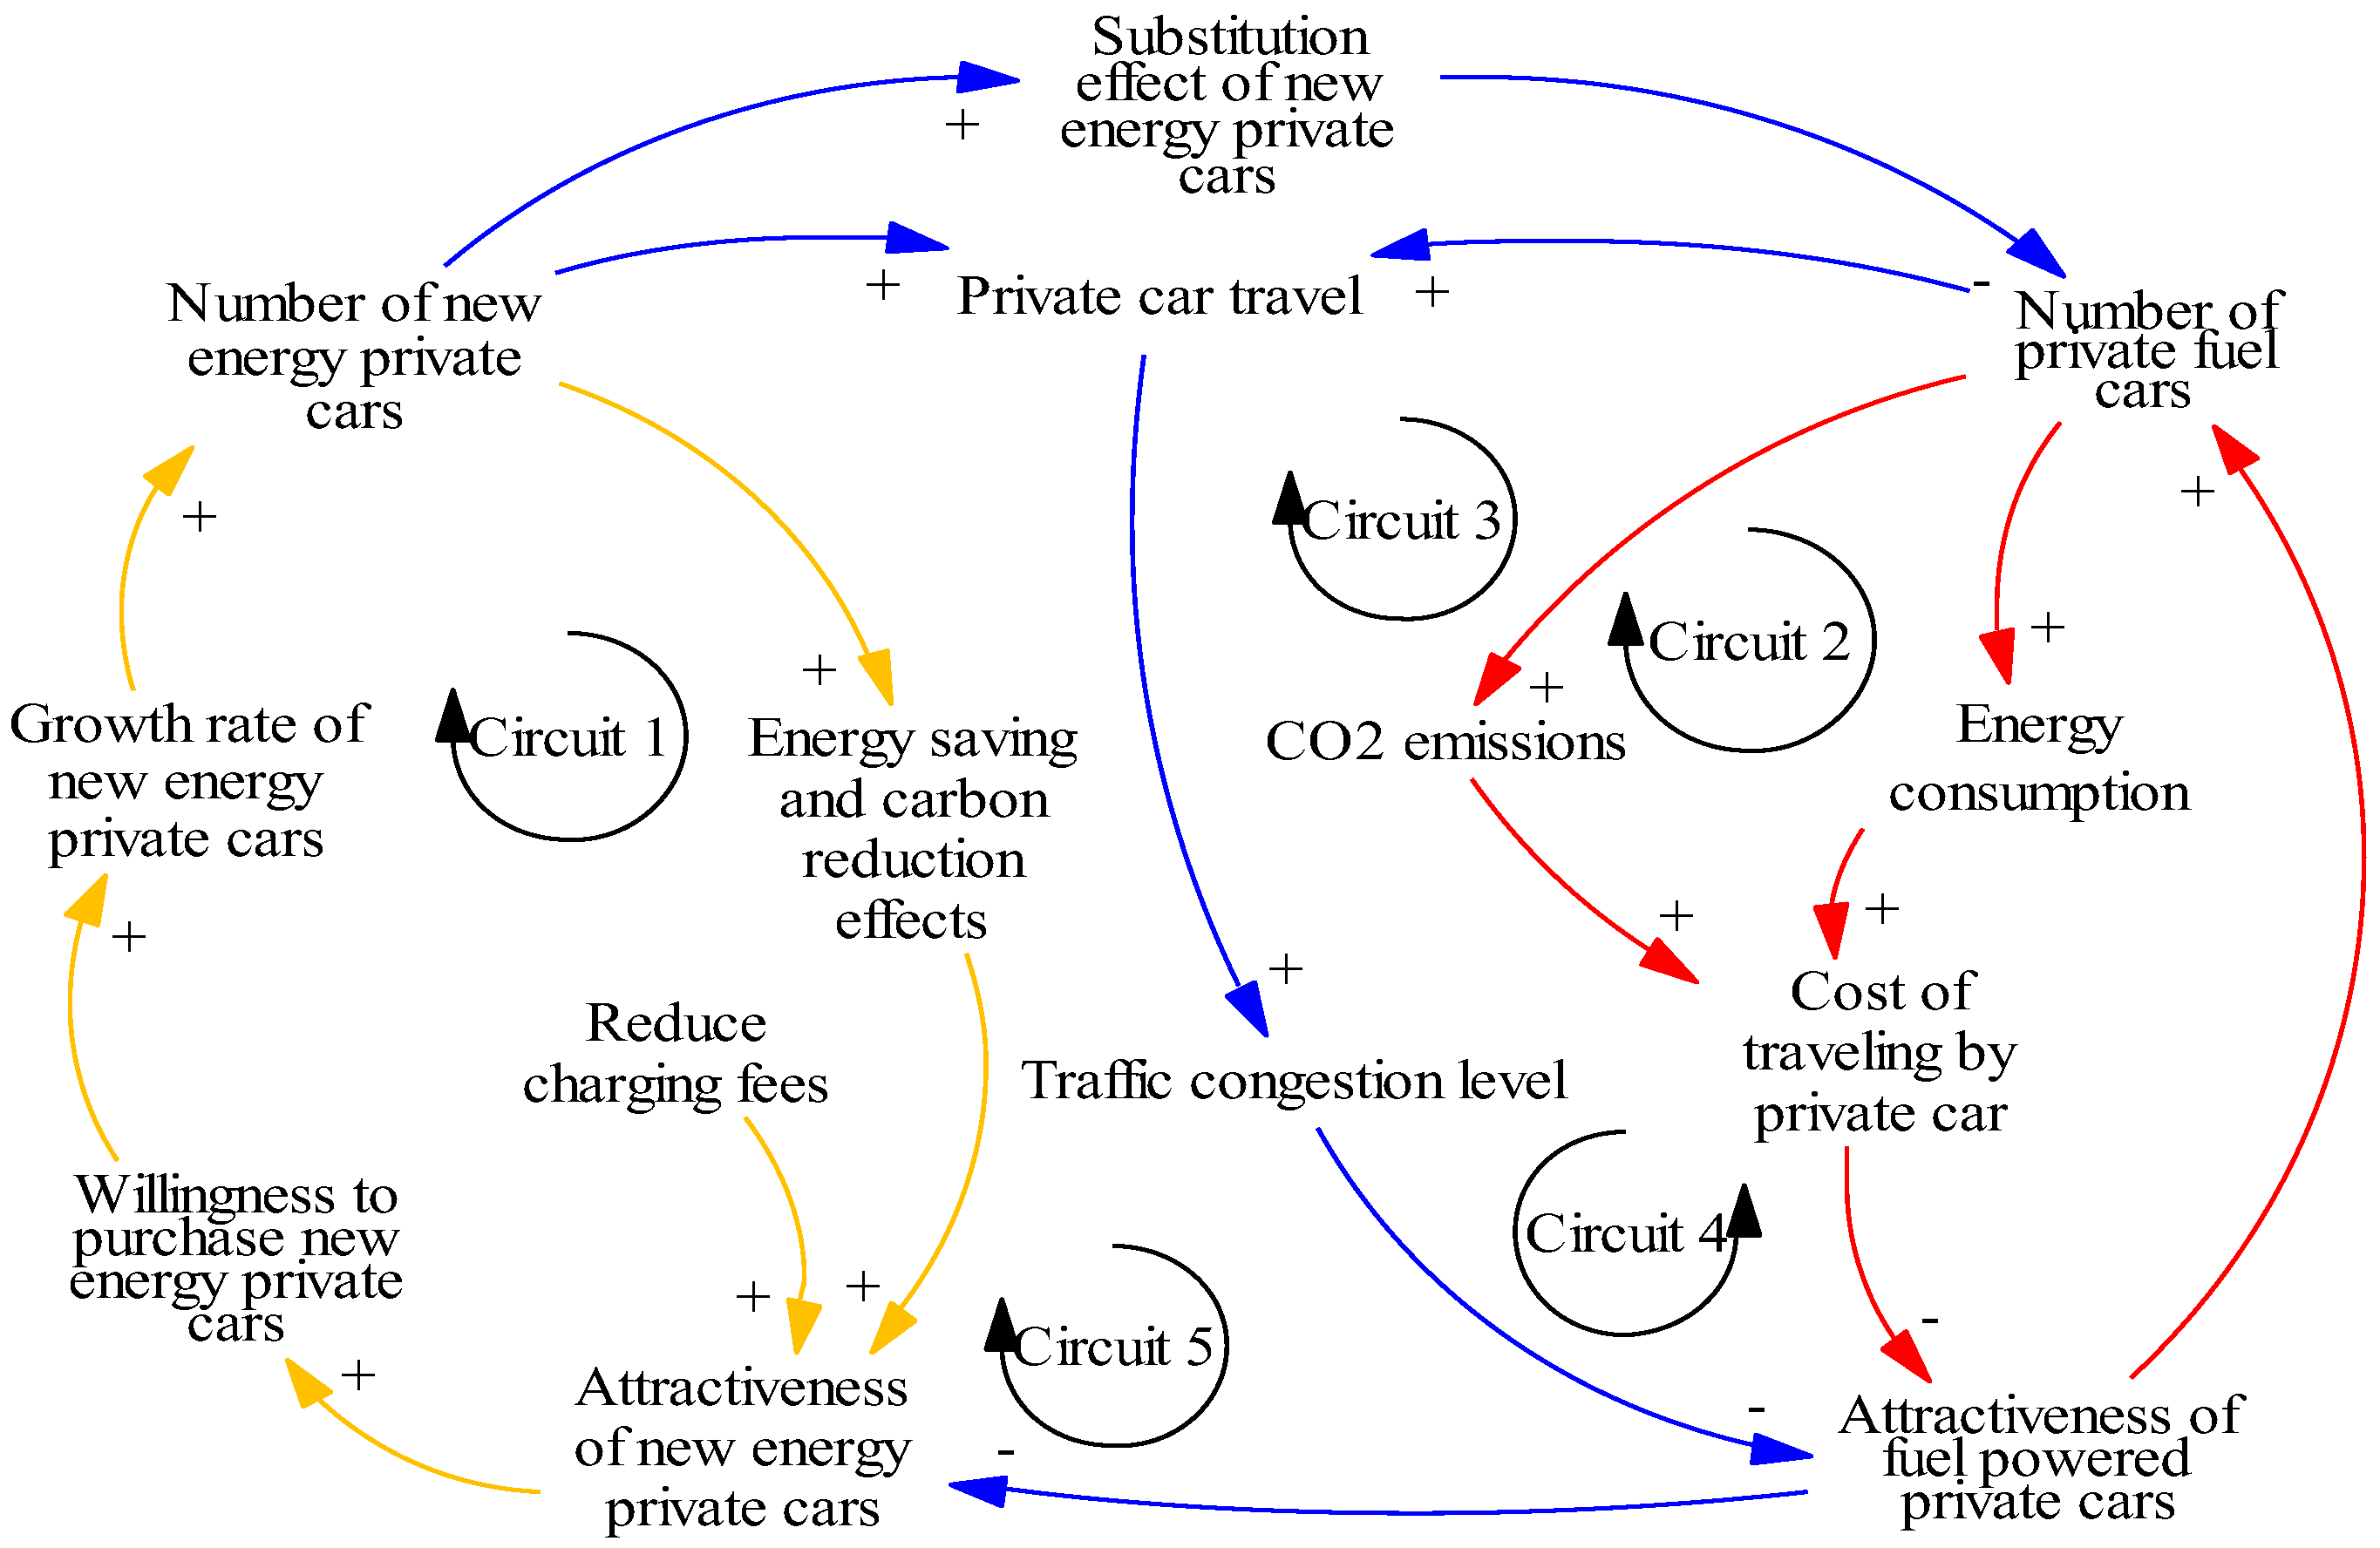
2.2. New Energy Vehicle Energy-Saving and Carbon Reduction System Circuit

The energy-saving and carbon reduction effects of new energy vehicles are affected by many factors, including residents’ consumption capacity, the travel costs of new energy vehicles and fuel private cars, policies, etc. Therefore, this paper combines the actual situation of Zhengzhou City and determines the system scope, where “+” and “−” represent positive and negative impacts, respectively (Figure 1).

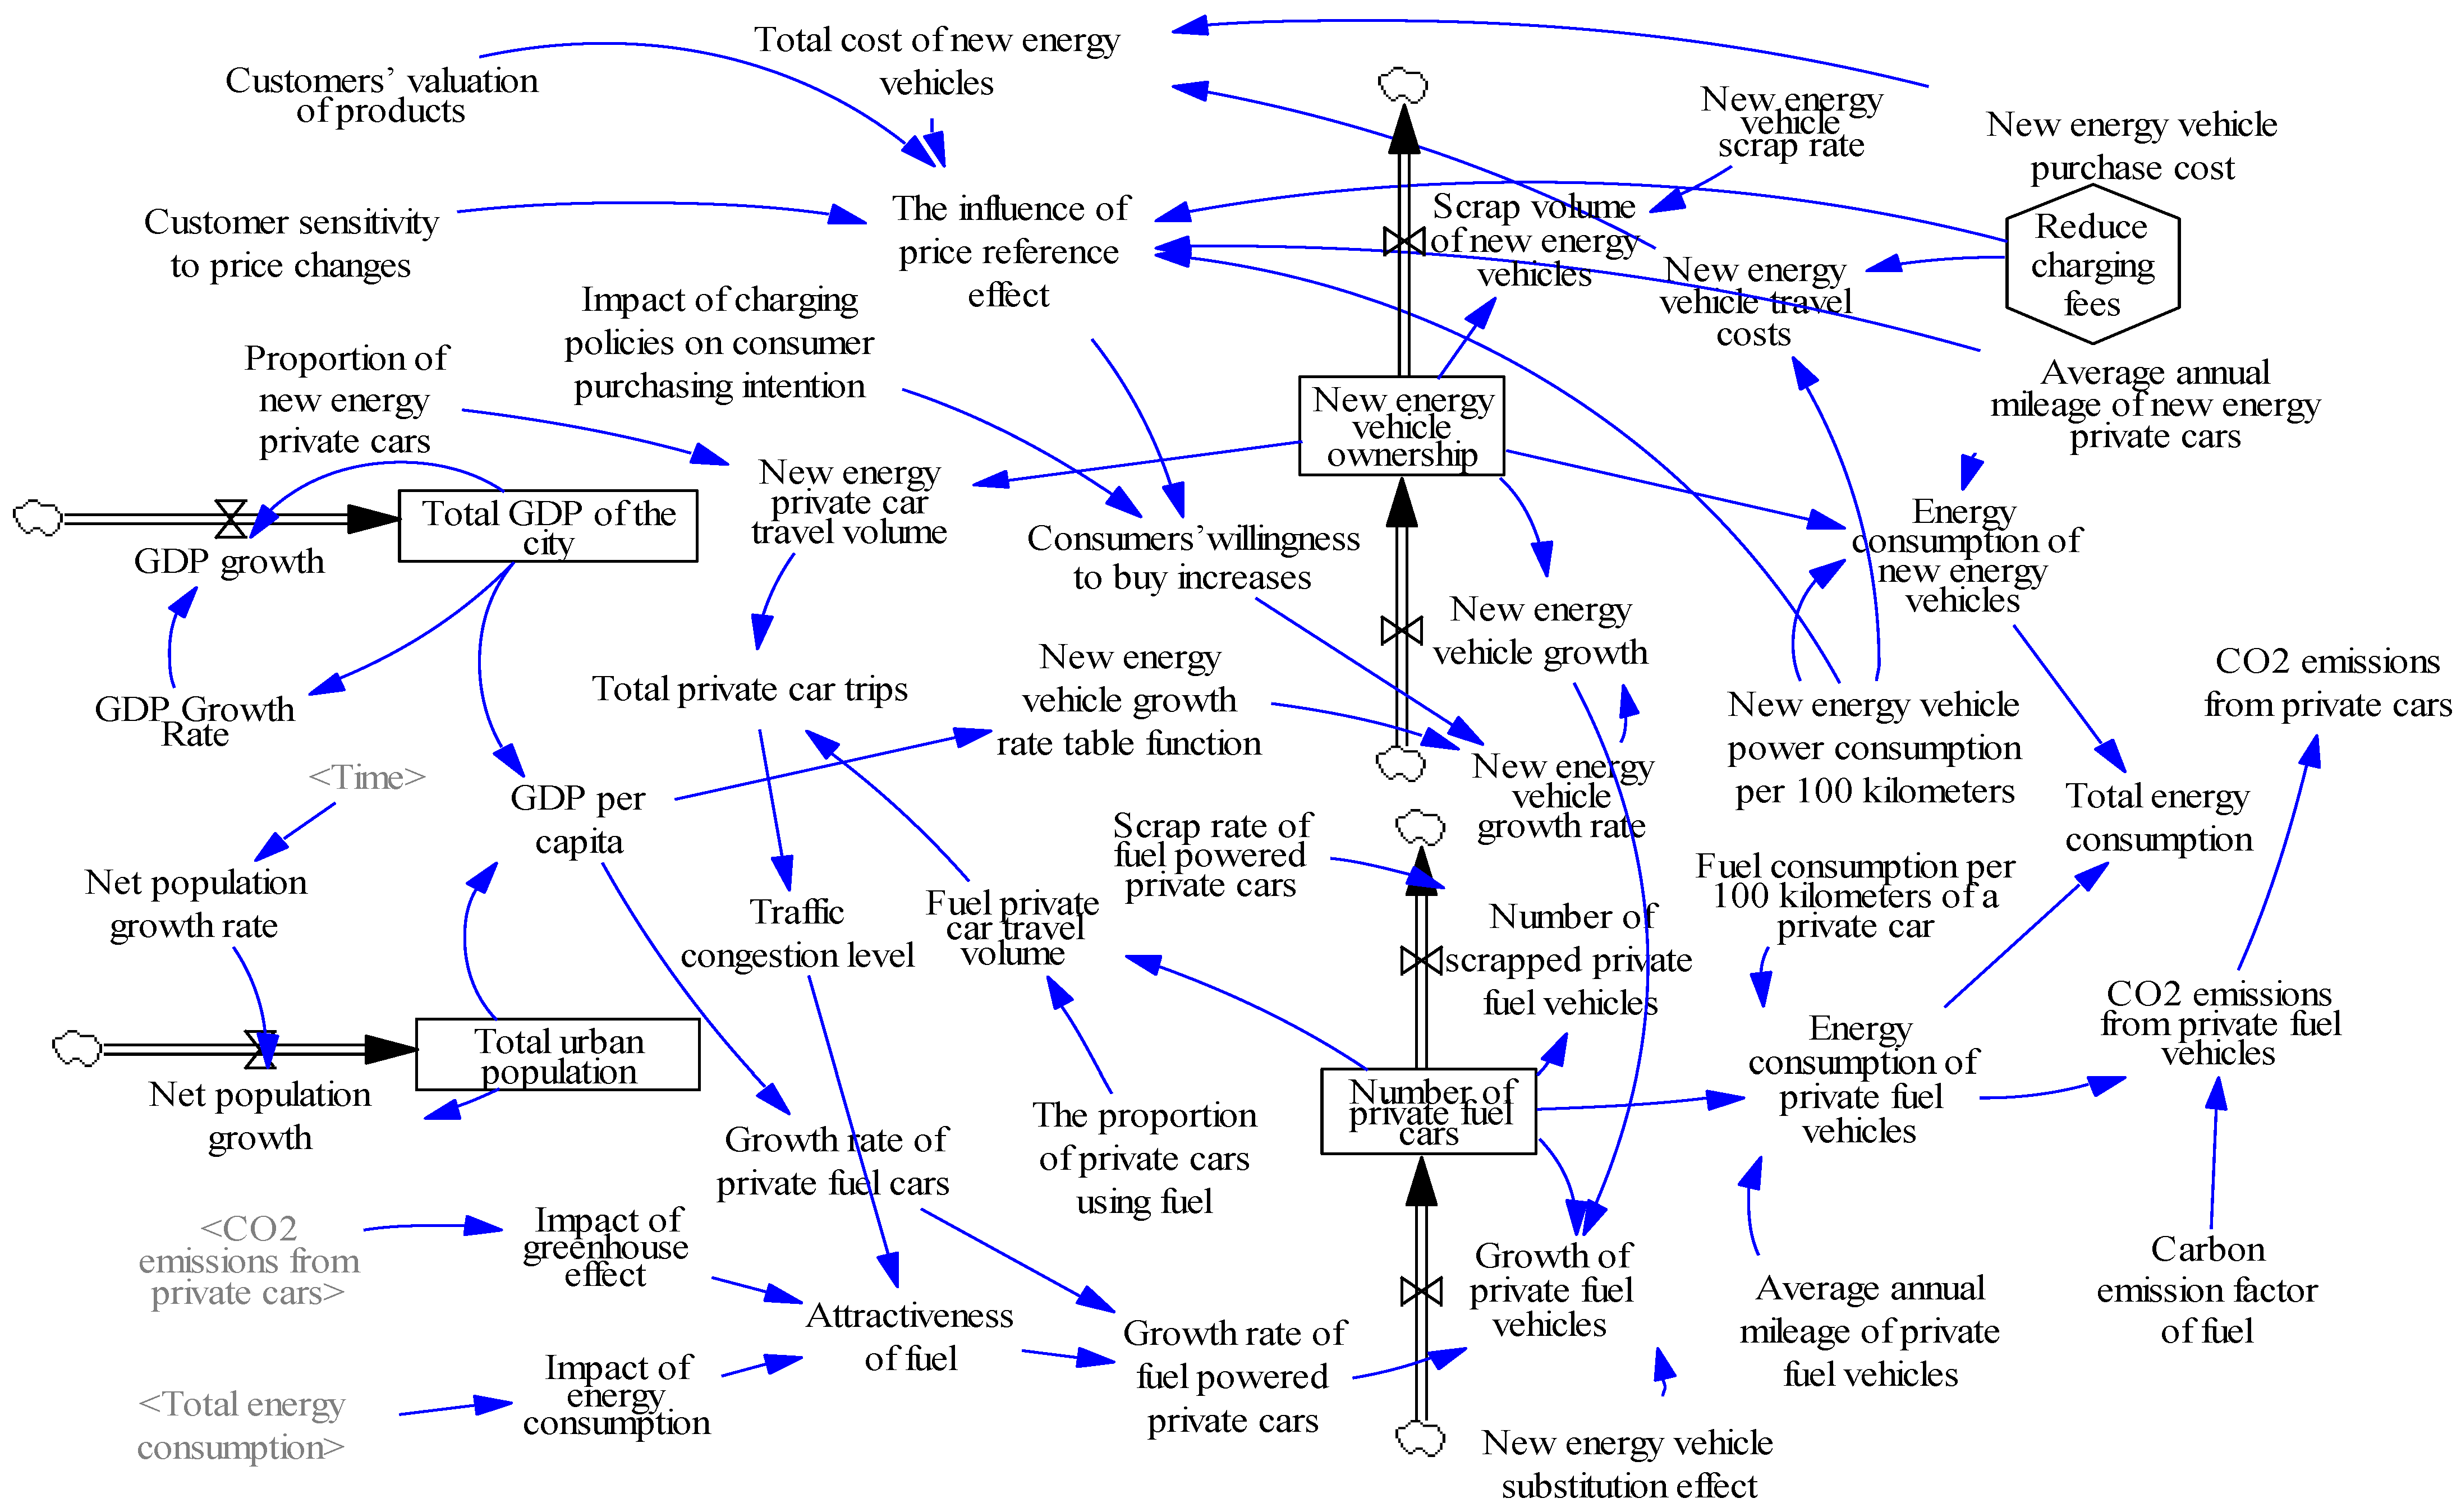
2.3. Stock Flow Charts

According to the specific realities of Zhengzhou City and Figure 1, Vensim PLE software is used to draw the stock flow diagram of the energy-saving and carbon reduction management model for new energy private cars, as shown in Figure 2.
In order to promote new energy vehicles to achieve the goal of energy saving and carbon reduction, Zhengzhou City has introduced a series of policies to enhance the willingness to purchase new energy vehicles, such as charging fee reduction, purchase tax reduction, right-of-way priority policy, and so on. The implementation of these policies will have a certain impact on the ownership of new energy vehicles, the growth of private fuel cars, carbon emissions and energy consumption, and traffic congestion. Because of the many variables involved, this paper selects carbon dioxide emissions as an indicator to evaluate the carbon reduction effect of new energy vehicles and energy consumption as an indicator to evaluate the energy-saving effect of new energy vehicles. Settings: initial time = 2017, final time = 2030, time step = 1, unit of time: year.

2.4. Determine Model Parameters

There are many methods for determining model parameters. The methods used in this paper are mainly divided into the following three categories:
(1)
Zhengzhou Statistical Yearbook: initial value of urban Gross Domestic Product (GDP), initial value of urban population, initial value of new energy vehicle ownership, initial value of fuel private car ownership, etc.
(2)
Reference to existing literature: automobile scrapping rate, private car travel ratio, new energy vehicle substitution effect, influence of charging policy on consumers’ purchase intention, etc.
(3)
SD-RA forecast: GDP growth rate, population growth rate, etc.

3. SD-RA-RE Algorithm and Main Equations

3.1. SD-RA-RE Algorithm

Since there are nonlinear variables in the model, such as GDP growth rate, population economic growth rate, new energy private car growth rate, etc., table functions are constructed through system dynamics to describe such variables. For some variables with missing data or unclear trends, regression analysis is used to predict the data, thereby ensuring the high accuracy of the predicted values during the simulation period. This paper takes the growth rate of new energy private cars as an example, and the algorithm is shown in Figure 3. Detailed steps of the algorithm are as follows:
  • Step 1: Searching for the influencing factors
In the model of this article, the main influencing factor of new energy vehicles and private fuel cars is the city’s per capita GDP, so historical data on the city’s total GDP, total urban population, and number of new energy vehicles and private fuel cars are needed. The data used in this study are primarily sourced from the China Statistical Yearbook, Henan Province Statistical Yearbook, and Zhengzhou City Statistical Yearbook. The raw data were collected from the aforementioned yearbooks. We utilized the SD-RA Model, which combines linear regression for data prediction and system dynamics (SD) to represent the nonlinear relationships between variables. According to the data from the Statistical Yearbook released by the Henan Provincial Bureau of Statistics from 2015 to 2022, we can know the total GDP and total population of the city. As new energy vehicles are in the early stages of development, some data are missing, as follows: (1) some of the data are presented in Table 1.
  • Step 2: Predicting the impact factors
The influencing factor prediction formula is as follows:
Y = a × X + b ,
where
Y is the dependent variable;
X is the independent variable, a is the intercept, and b is the slope.
(1)
Calculating the average of X and Y, denoted as X, Y.
(2)
Calculating the covariance of X and Y as follows:
C O V X , Y = 1 n 1 X i X ¯ Y i Y ¯ ,
where
n represents the number of variables.
(3)
Calculating the slope b as follows:
b = ( X i X ¯ ) ( Y i Y ¯ ) ( X i X ¯ ) 2 .
(4)
Calculating the intercept as follows:
a : a = Y ¯ b X ¯ .
(5)
Using the formula to predict the total GDP and total population of a city.
  • Step 3: Establishing the regression analysis equation
(1)
Determining the independent variable as GDP per capita and the dependent variable as the number of new energy private cars.
(2)
Regression analysis equation=
2943.82 × (GDP per capita)3 – 33,189.55 × (GDP per capita)2 + 627,075.466.
(3)
Calculating R2, significance, and testing.
  • Step 4: Constructing the SD-RA model
(1)
The regression prediction equation is as follows: number of new energy vehicles=
(2)
Calculating and predicting the number of new energy private cars: calculating the number of new energy private cars in 2016, 2019, and 2021 based on the predicted per capita GDP and predicting the number of new energy private cars from 2023 to 2030.
(3)
Calculating the growth rate of new energy private cars.
(4)
Using Vensim software to characterize the nonlinear relationship between variables. Based on the growth rate of new energy private cars obtained in the above steps, the table function of Vensim software is used to characterize the nonlinear relationship between variables as follows:
ꞷ = WITHLOOKUP(GDP Per capita, ([(8, 0)(40,000, 10)], (8.853, 0.3836), (9.841, 0.5621), (10.08, 0.1714), (10.47, 0.4844), (11.104, 0.4874), (11.6, 0.3377), (12.117, 0.3114), (12.658, 0.2905), (13.222, 0.2736), (13.813, 0.2596), (14.429, 0.2474))),
where
ꞷ: new energy private car growth rate.
  • Step 5: Calculating the impact of price reference effect
(1)
Calculating the total cost of new energy vehicles, recorded as t,
t = NEVPC + NEVTC,
where
NEVPC represents the purchase cost of new energy vehicles;
NEVTC represents the travel cost of new energy vehicles.
(2)
Calculating the consumer’s valuation of new energy vehicles, recorded as v.
(3)
The customer’s price sensitivity coefficient, recorded as θ.
(4)
The cost savings after implementing the policy of reducing charging fees, recorded as s,
s = (1 − d) × 1.2 × m × age,
where
d: charging fee discount;
m: average annual mileage;
age: service life.
(5)
The impact of the price reference effect is as follows:
ƍ = (v – t + θ × s)/(v − t).
  • Step 6: Calculating the growth rate of new energy vehicles
(1)
Consumers’ willingness to buy increases as follows:
£ = Ɛ × (ƍ − 1).
(2)
The new energy vehicle growth rate is as follows:
ꞵ = ꞷ × (1 + £),
where
Ɛ: the impact of charging policies on consumers’ willingness to buy.

3.2. Main Equations

The main equations of the model (Appendix A) are as follows:
(1)
Total urban GDP = INTEG (GDP growth, 9.3 × 10¹²), unit: CNY;
(2)
Total urban population = INTEG (net population growth, 1.1643 × 10⁸), unit: person;
(3)
GDP per capita = total urban GDP/total urban population, unit: CNY/person;
(4)
Growth rate of new energy vehicles = function of growth rate of new energy private cars × (1 + increase in consumer purchasing willingness);
(5)
Fuel consumption per 100 km of fuel private cars = 7.76, unit: liters/100 km;
(6)
Carbon emission factor of fuel private cars = 0.002056, unit: tons/vehicle (Table 2).

4. Dynamic Simulation Analysis

4.1. Model Verification and Testing

In order to ensure the rationality and accuracy of the constructed model, Vensim software was used to test the model, and extreme condition tests and validity tests were carried out to verify the availability and validity of the model.

4.2. Model Verification

Model testing in Vensim software is used to verify whether the logic of the model is consistent with reality. The model passed the model testing of Vensim software, indicating that the variable relationship, causal feedback loop, etc., in the model are consistent with the logic of reality.

4.2.1. Extreme Conditions Testing

Extreme condition testing simulates the behavior of the system under extreme conditions by taking extreme values of variables to verify the stability and reliability of the model. As shown in Figure 4, when the exemption of charging fees takes the two extreme cases of plan one and plan three, respectively, the number of new energy vehicles corresponds to the minimum and maximum values, respectively, and the number of private fuel cars takes the maximum and minimum values, respectively, which conforms to the actual situation, and the model is reasonable.

4.2.2. Validity Test

Validity testing can check whether the data used is true, accurate, and complete, thereby determining the applicability of the model. This paper uses the relative error test method to test the effectiveness of the model. Data from 2015 to 2022 are selected to simulate the private car system in Zhengzhou. The actual data and simulated data of per capita GDP (unit: 10,000 CNY/person) and total urban population (unit: 10 million people) are selected to calculate the relative error. The detailed results are shown in Table 3 and Table 4.
According to the results, the relative error of GDP per capita is within 2%, and the average relative error is 0.931% (Table 5). The relative error of urban population is within 2%, and the average relative error is 0.819% (Table 6). The average relative error of each variable is within 1%. Therefore, the model has the accuracy of teaching. Through the model validity test, the model can be used to perform dynamic simulation analysis on the private car system in Zhengzhou.

4.3. Dynamic Simulation Analysis

The system dynamics software Vensim is used to dynamically simulate the energy-saving and carbon reduction model of new energy vehicles, and analyze the impact of changes in policy variables in the model on variables such as the number of new energy vehicles and carbon dioxide, energy consumption, etc.

4.3.1. Policy on Reducing or Exempting Charging Fees

This section divides the charging fee reduction policy into three schemes and uses dynamic simulation analysis to reveal a series of impacts of charging fee reduction under different schemes.
In the baseline scenario, the changes in the main variables are shown in Figure 5. Since the number of private fuel cars is still growing, energy consumption and carbon dioxide emissions are still increasing year by year. Starting from 2026, the growth rate of private fuel cars will remain slow and will show a downward trend after 2029. Since new energy private cars are in the early stages of development, the country has introduced various promotion policies such as subsidies, purchase tax reductions and exemptions, and road right priority. In addition, the environmental protection and intelligence of new energy private cars have won the favor of environmentally friendly consumers and innovative consumers. The growth rate and ownership of new energy private cars are generally on an upward trend. However, according to Curve 2 in Figure 5, it can be found that the growth rate of new energy vehicles begins to decline and stabilize after 2024. This may be because as subsidies decline, consumers’ willingness to buy will decrease accordingly. In addition, the implementation of the “double points” policy has raised the technical threshold for new energy vehicles, and some companies are unable to meet the requirements. The negative reputation of new energy vehicles, as well as issues such as range, charging facilities, and battery safety, will breed consumer anxiety and affect the sales of new energy vehicles.
In general, increasing the reduction in charging fees can increase consumers’ willingness to buy new energy vehicles to a certain extent, as shown in Figure 6a, thereby having a certain substitution effect on fuel-powered private cars. The growth of fuel-powered private cars has decreased year by year, as shown in Figure 6b. Observing the growth of new energy vehicles under different policy implementation intensities in Figure 6a, it can be concluded that as policy efforts strengthen, the growth of new energy vehicles increases. This indicates that more and more consumers are purchasing new energy vehicles. With the reduction in the number of fuel-powered private cars, energy consumption and carbon dioxide emissions have been alleviated, as shown in Figure 6c,d.
When the first option of charging fee reduction is selected, the growth of new energy vehicles can be increased, but it is not obvious compared with the baseline scenario (Table 7). The second and third options of charging fee reduction are more conducive to increasing the sales of new energy vehicles. When the third option is adopted, the charging cost of residents using new energy vehicles for travel is almost zero, which will lead to explosive growth in the sales of new energy vehicles.

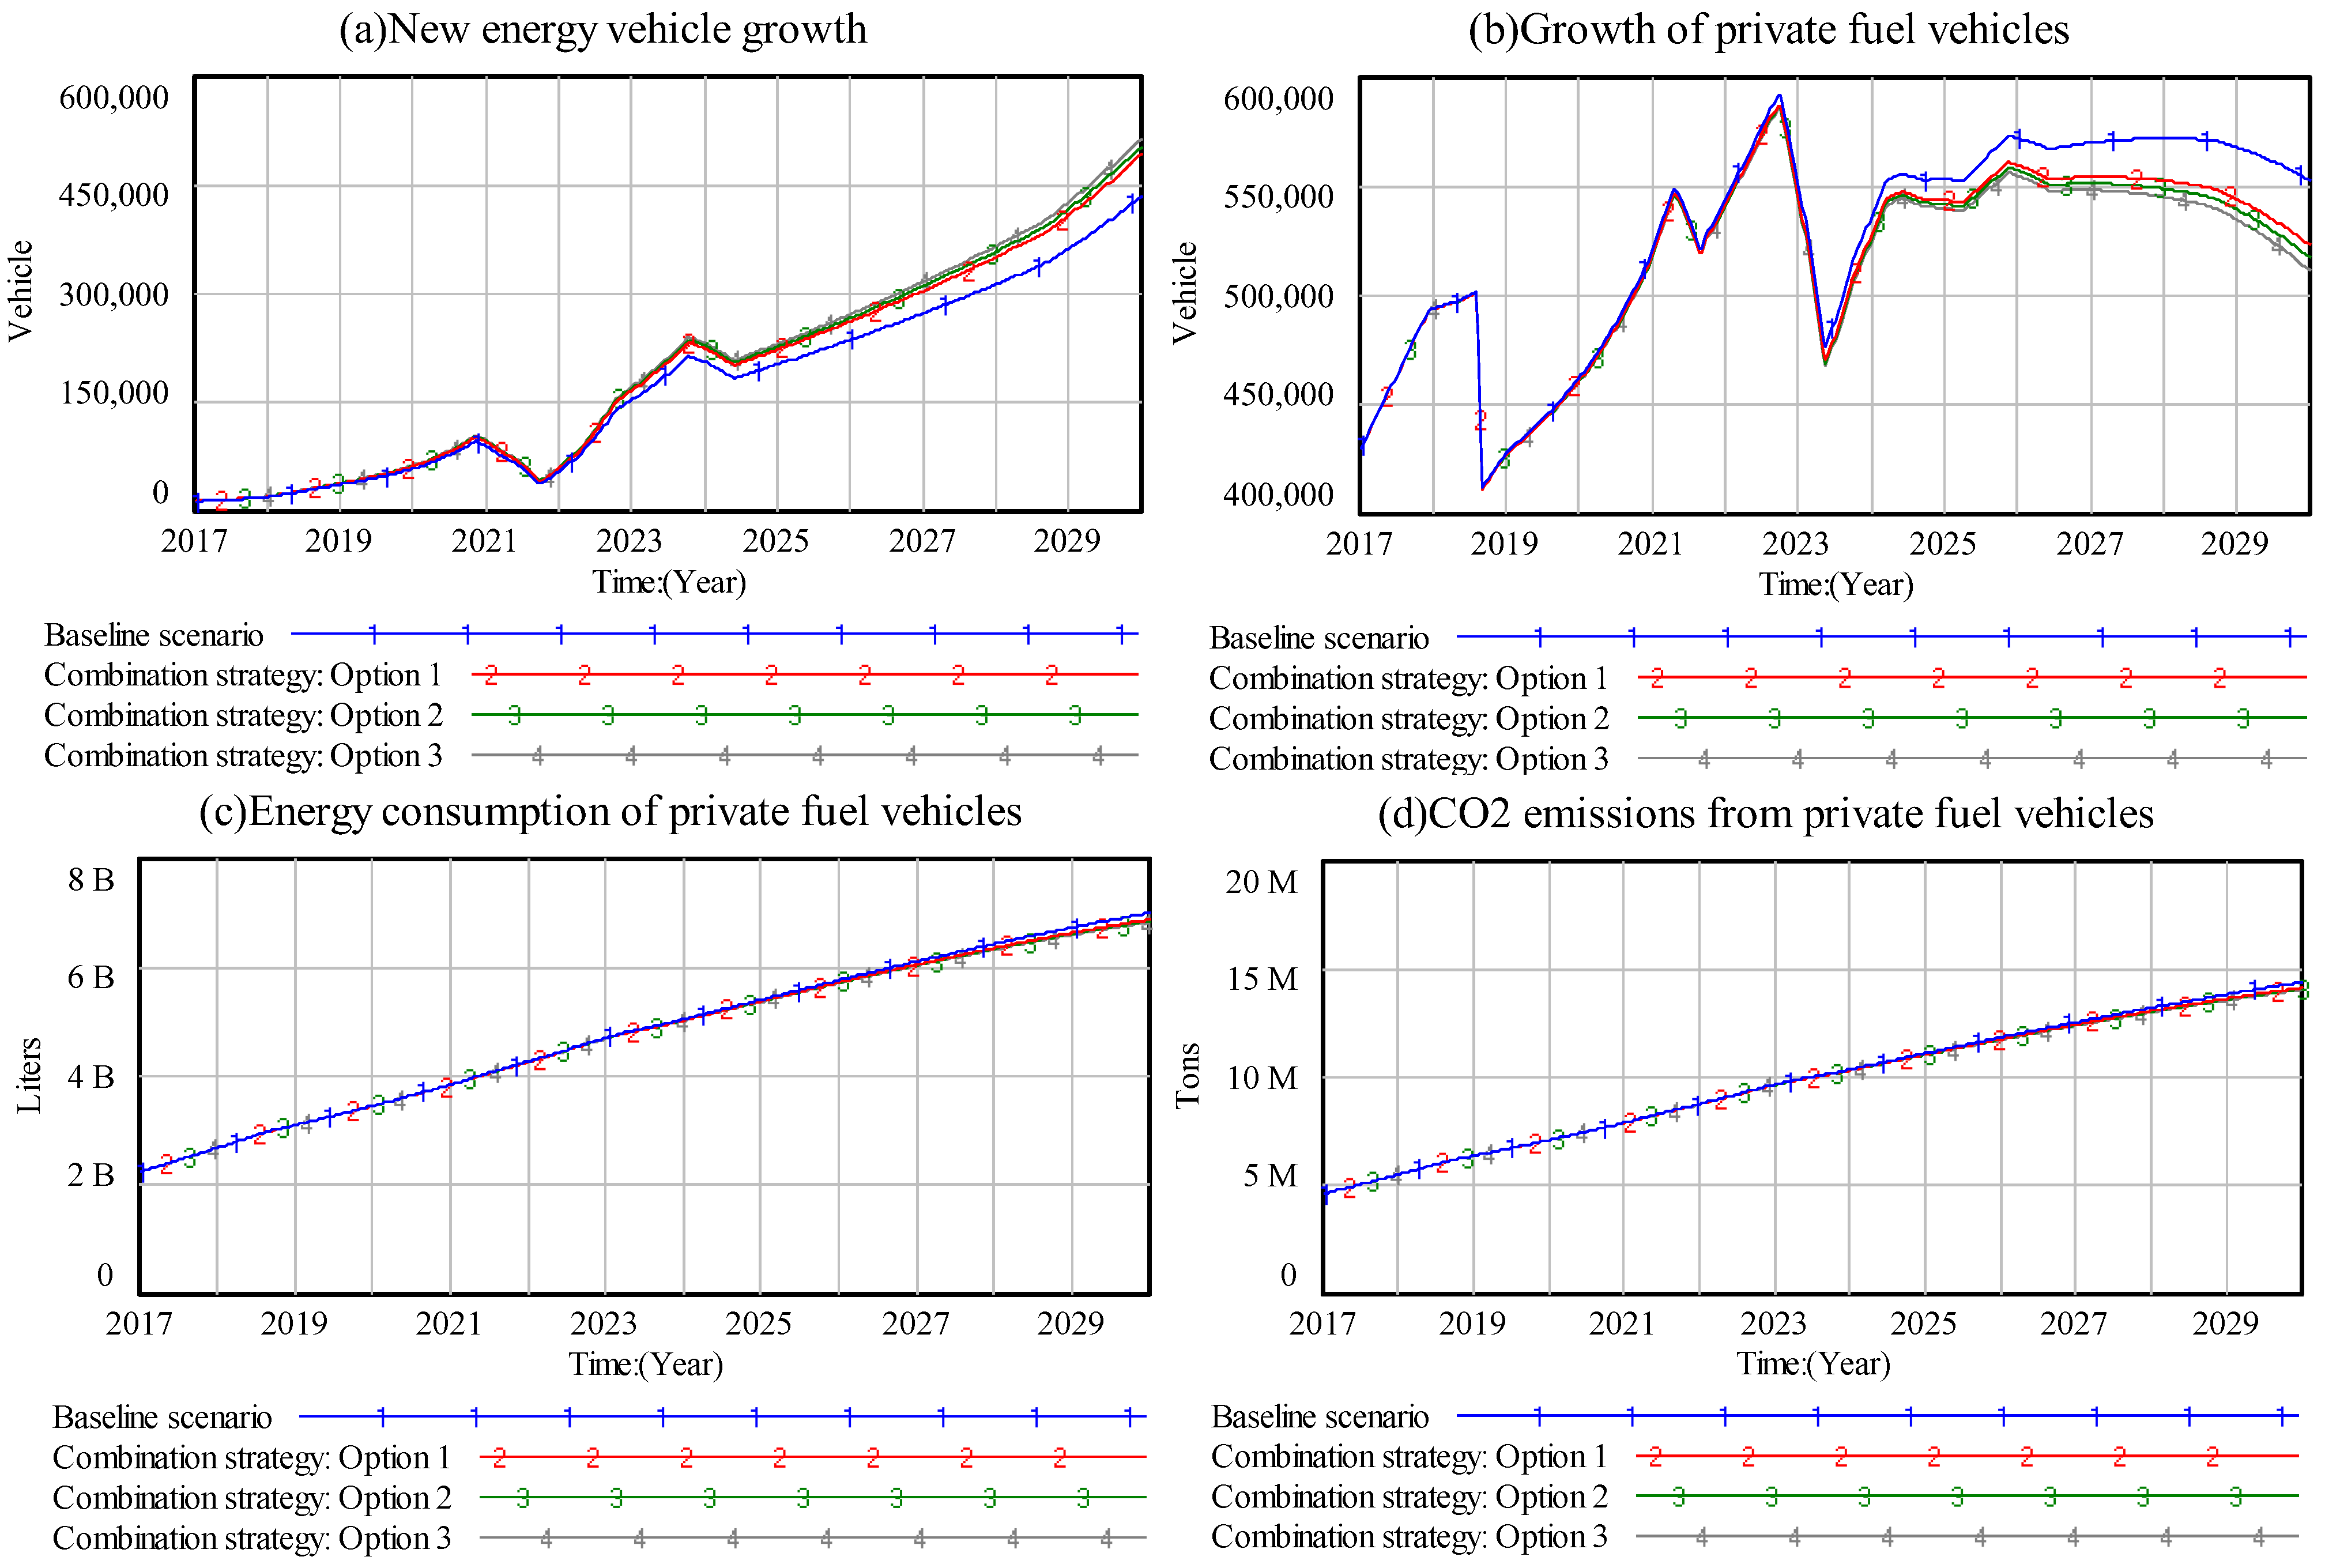
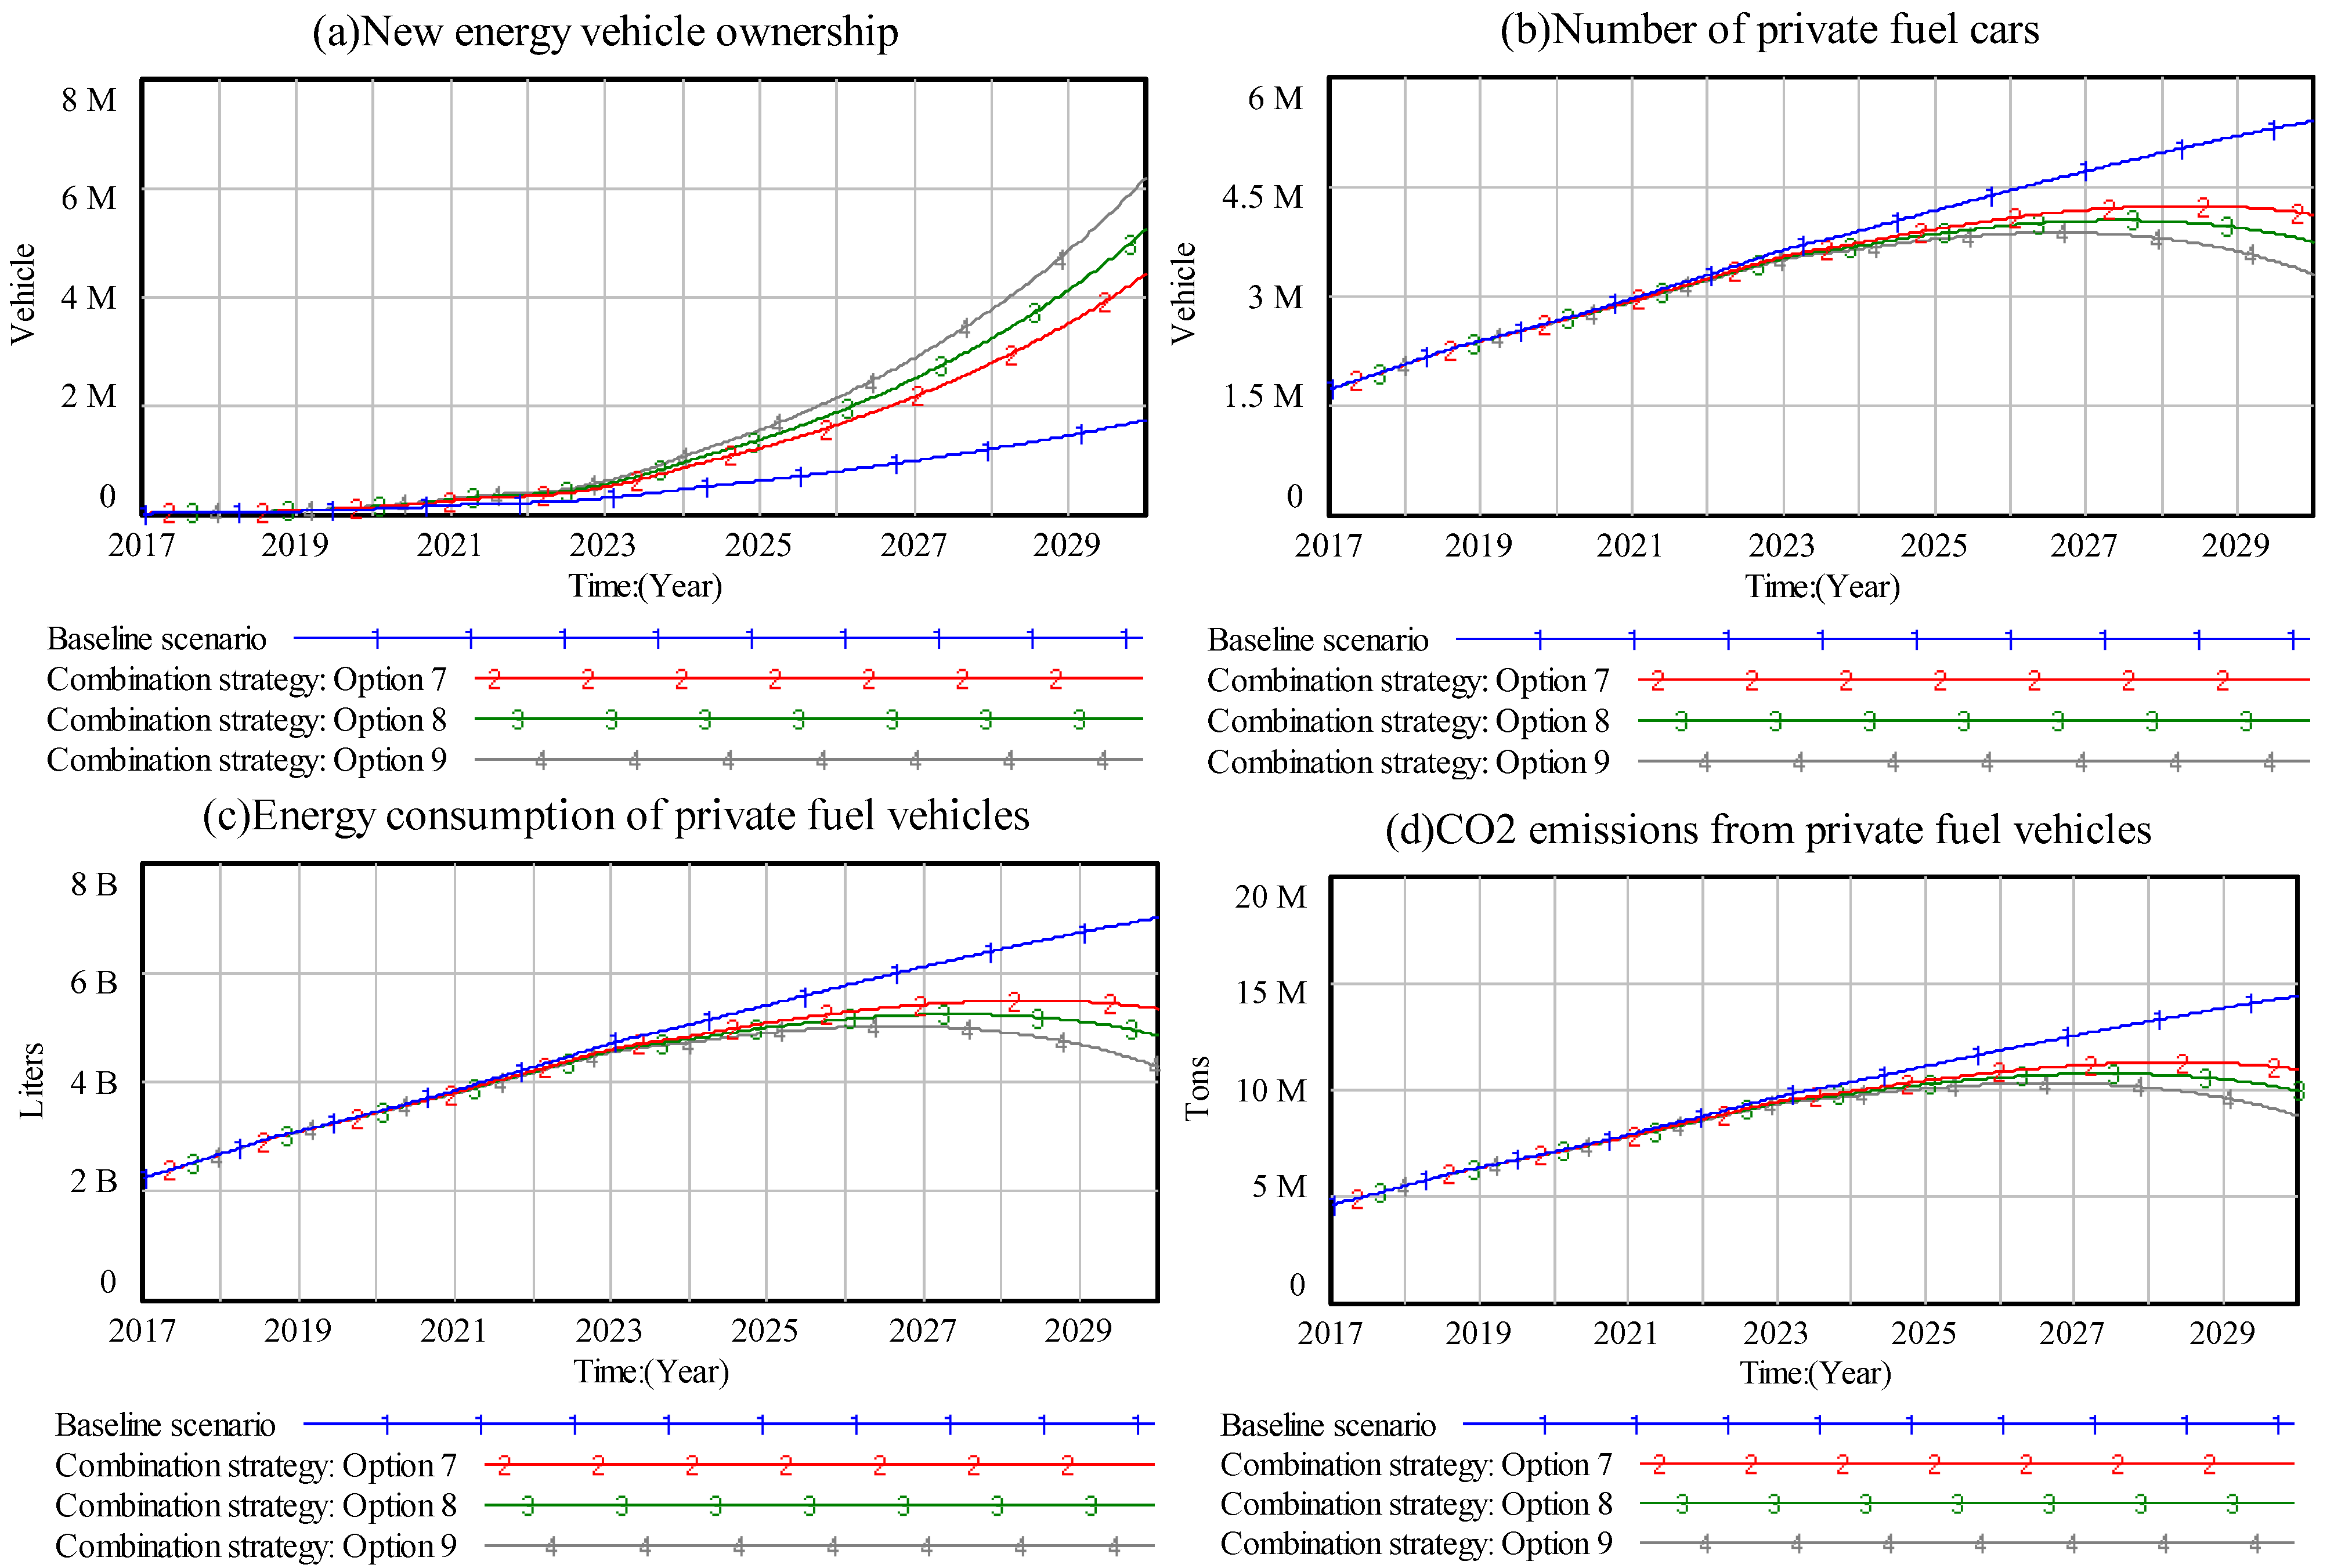
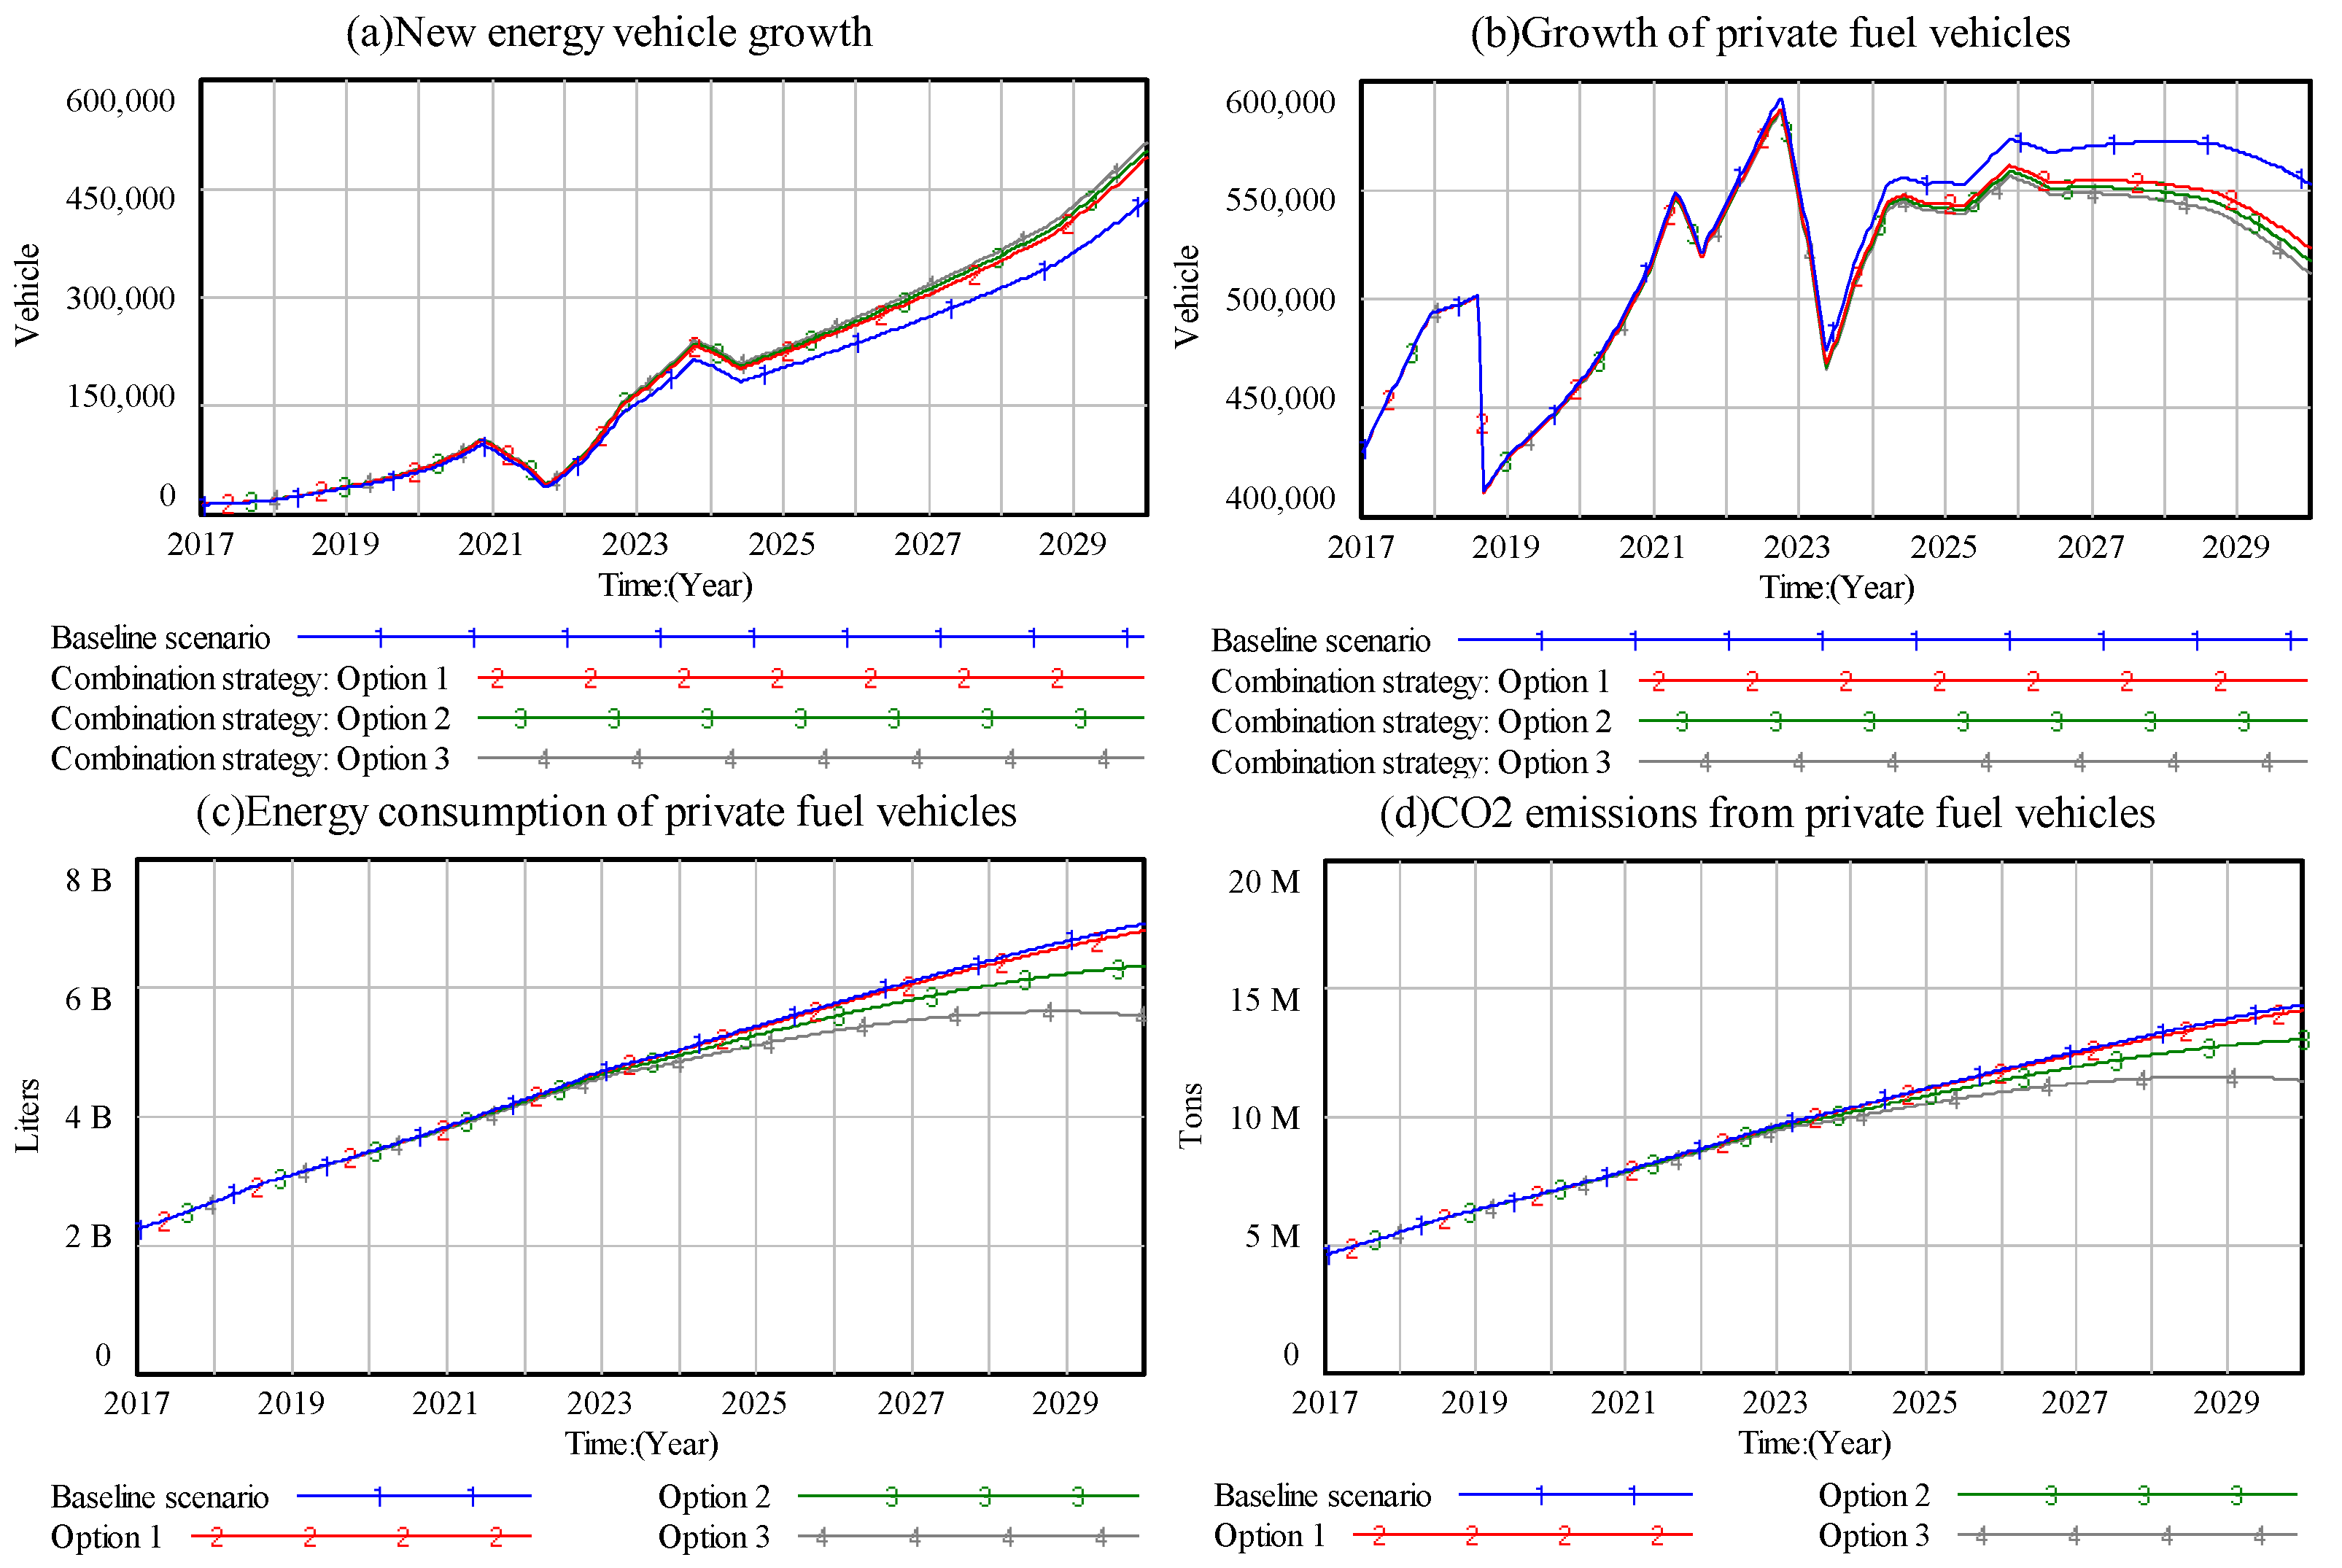
4.3.2. Combination Strategy

As the price sensitivity coefficient increases, it helps the purchase intention of new energy vehicles, that is, the increase in the growth of new energy vehicles, and slows down the growth rate of fuel private cars, as shown in Figure 7a,b. As a result, energy consumption and carbon dioxide emissions are reduced, as shown in Figure 7c,d, but the gap between curves 1 and 4 is not obvious, which shows that customers’ sensitivity to price has a certain positive effect on the energy-saving and carbon reduction effect of new energy vehicles, but the effect is not obvious. According to Table 2, when the combination strategy plan 3 is adopted, the energy consumption and carbon dioxide emissions of private fuel cars are reduced by about 2.417% compared with the baseline scenario.
When the second scheme is adopted to reduce or exempt charging fees, increasing the price sensitivity of customers can increase consumers’ willingness to purchase new energy vehicles and reduce the sales of fuel private cars, as shown in Figure 8a,b. This is because the use cost is one of the main factors considered by consumers in car purchase decisions. With the reduction in charging costs, the increase in customer price sensitivity, the increase in oil prices, and other factors, the cost of new energy vehicles will be reduced throughout the entire use cycle. Lower charging costs will reduce consumers’ anxiety about the journey, thereby increasing customers’ preference for new energy vehicles and choosing new energy vehicles in purchase decisions. On the one hand, the reduction in the purchase of fuel for private cars reduces energy use and pollutant emissions. On the other hand, the reduction in charging costs will encourage residents who own private fuel cars and new energy vehicles to choose new energy vehicles for daily commuting, reduce the frequency of use of private fuel cars, and thus reduce energy consumption and greenhouse gas emissions. According to Table 2, by the end of 2030, energy consumption and carbon dioxide gas emissions will be reduced by about 15.96% compared with the baseline scenario.
When the third option is adopted to reduce or reduce charging fees, as price sensitivity increases, the rapid development of new energy vehicles will be promoted, and the number of new energy vehicles will be significantly increased, as shown in Figure 9a. The reason may be that when plan 3 is adopted to reduce charging fees, the energy cost of new energy vehicles is almost zero. The increase in consumer price sensitivity will pay more attention to the gap between the use cost of fuel vehicles and new energy vehicles, which will increase consumer purchases. The probability of new energy vehicles leading to a decline in the number of fuel-powered private cars is shown in Figure 9b. As the number of private fuel-powered cars decreases, driving new energy vehicles is becoming more popular among residents, and the energy consumption and carbon dioxide emissions of private fuel-powered vehicles will also decrease accordingly. The energy consumption and carbon dioxide emissions of new energy vehicles will peak around 2027 and then show a downward trend. According to Table 8, by the end of 2030, compared with the baseline scenario, the number of fuel-powered private cars, energy consumption, and carbon dioxide emissions will be reduced by approximately 38.85%. However, the combined strategy adopts Plan 9, which will increase the government’s financial pressure on charging subsidies and investment in charging facilities (Table 9). New energy vehicle companies will ignore technological innovation, which will affect the competitiveness of my country’s new energy vehicles in the world. In addition, due to reduced travel costs, residents will increase the number of unnecessary trips, wasting our country’s power resources.

4.4. Discussion

Optimizing strategies to increase willingness to buy new energy vehicles is crucial to achieving energy conservation and carbon reduction goals. Our research shows the impact of single and combined policies on willingness to buy new energy vehicles.

4.4.1. Effect of Reducing Charging Fees

The results of scenario analysis show that the implementation of the policy of reducing or exempting charging fees can increase the willingness to purchase new energy vehicles, thereby affecting the sales of private fuel vehicles, reducing the number of trips by private fuel vehicles, and reducing energy consumption from the source, thereby achieving energy conservation and carbon reduction. By the end of 2030, the growth of new energy vehicles in the scenario without the implementation of the policy of reducing or exempting charging fees is 434,159 vehicles, while the growth of new energy vehicles after the implementation of the policy of reducing or exempting charging fees has reached 1,187,490 vehicles, with a growth rate of 173.52%, as shown in Table 10.

4.4.2. Policy Lag Effect

Policy implementation has a “hysteresis effect”. Between 2017 and 2023, there was little difference in the growth of private fuel vehicles, energy consumption of private fuel vehicles, and carbon dioxide emissions. The effect only began to appear after 2023, as shown in Figure 10c,d. This is because it takes time for policies to be formulated and implemented, as well as for consumers to recognize and adopt them. This finding reminds us that we need to consider the hysteresis effect of reducing or exempting charging fees during the subsidy reduction process to reduce the possibility of interruptions during policy implementation.

4.4.3. Strategic Offset

According to the simulation results of the combination strategy, it is interesting to find that the growth of new energy vehicles and the energy-saving and carbon reduction effects under the scenario of the implementation of the combination strategy scheme 6 are less than those of the single strategy scheme 3, which shows that the effect of the combination strategy is not equal to the sum of the effects of the single strategies, and the energy-saving and carbon reduction effects of the combination strategy are not necessarily more prominent than those of the single strategy. In previous studies, some scholars have explored whether the combination policy is more effective and found that the effect of the single strategy is underestimated. The combination of effective policies can produce synergies to make up for the weaknesses of each policy and achieve twice the result with half the effort, but some policy combinations may result in half the result with twice the effort.

5. Conclusions

5.1. Main Conclusions

With the impact of the global energy crisis, frequent extreme weather, and the greenhouse effect, countries around the world are working hard to promote new energy vehicles and gradually transform to clean energy. However, with the decline of subsidies, customers’ willingness to buy has been affected to a certain extent. In order to enhance consumers’ willingness to buy new energy vehicles and improve energy conservation and carbon reduction effects, a new energy vehicle energy conservation and carbon reduction management model considering the Nudge Theory is constructed. The research conclusions are as follows:
(1)
Both the single charging fee reduction strategy and the combination strategy can increase the sales of new energy vehicles. With the rise in oil prices, the travel cost of traditional fuel vehicles increases, while the reduction in charging fees reduces the travel cost of new energy vehicles, which helps to increase the willingness to buy new energy vehicles. Among the single charging fee reduction strategies, scheme 3 has the best effect. The growth of new energy vehicles at the end of 2030 reached 1,187,490 vehicles, an increase of 173.52% compared with not implementing the charging fee reduction. Among the combination strategies, scheme 9 is the best. At the end of 2030, the number of new energy vehicles in use reached about 6.19 million, with a growth rate of 253.03%. The above simulation results show that the reduction in charging fees and the combination strategy can increase the sales of new energy vehicles.
(2)
The combination of strategies scheme 7, scheme 8, and scheme 9 can achieve the “carbon peak” of fuel vehicles before 2030. Schemes 7–9 As the efforts to reduce charging fees increase and consumers become more sensitive to prices, the surge in new energy vehicles will replace fuel vehicles on a large scale, reducing the use of fossil energy from the source, thereby reducing greenhouse gas emissions. According to the simulation results of scheme 9, it can be found that by 2030, carbon dioxide emissions will drop by about 38.85%, and will then decline after reaching a peak in 2027. Compared to the initial scenario, the number of new energy vehicles in Scenario 9 has reached 6,195,240 units, representing an increase of 253.03%. Additionally, carbon dioxide emissions have been reduced, with emissions decreasing to 8,804,370 tons by the end of 2030, a reduction of approximately 38.85%.
On this basis, the following measures can be taken:
(1)
Expanding the scale of charging stations: After the implementation of the reduction in charging fees, the number of new energy vehicles will increase, increasing the demand for charging infrastructure. If the infrastructure cannot meet the charging needs of residents, this may greatly reduce the effectiveness of this strategy. Therefore, while increasing the willingness to buy new energy vehicles, it is also necessary to promote the construction of charging stations and improve the convenience of new energy charging. In addition, the length of charging time will also affect consumers’ willingness to buy new energy vehicles. Improve charging efficiency while improving the infrastructure of new energy vehicles.
(2)
Enhancing the charging efficiency: The level of charging efficiency is also a significant factor influencing consumers’ purchasing decisions. Therefore, to promote the adoption of new energy vehicles, improving charging efficiency is a crucial issue.
(3)
Extending the battery life: Our battery manufacturers need to invest more in technology to prolong the service life of batteries. For consumers, the high cost of battery replacement can be reduced, making new energy vehicles more economically attractive. Additionally, the production and recycling of batteries generate significant amounts of carbon dioxide and pollutants. Therefore, extending battery life can effectively mitigate the negative environmental impact of batteries, contributing to the achievement of dual-carbon goals. Finally, prolonging battery life can significantly enhance the competitiveness of Chinese new energy vehicles in the international market.
Last but most important, new energy vehicles are new products, and their battery technology, cruising range, and other technologies still need to be improved. If new energy vehicles are to develop in a long-term and healthy manner, they cannot rely solely on reducing costs to increase their sales. At the same time, they must also improve the core technology of new energy vehicles to make them world-competitive products.

5.2. Future Outlook

(1)
Since cost is a key factor in purchasing new energy vehicles [29], the cost of using new energy vehicles can be reduced by reducing charging fees and increasing consumers’ sensitivity to them, thereby stimulating customers to choose new energy vehicles instead of traditional fuel vehicles and fundamentally reducing the travel volume, energy consumption, and carbon dioxide emissions of traditional fuel private cars. However, the implementation of the combined policy will stimulate the rapid increase in the number of new energy vehicles, which will increase the number of charging stations and the pressure to improve charging efficiency. When charging facilities cannot meet consumers’ charging needs, negative word of mouth may be generated, aggravating the public’s anxiety about new energy vehicles, which is not conducive to the healthy and long-term development of the new energy vehicle industry. Therefore, while implementing this policy, the number of charging stations and its convenience must also be guaranteed.
(2)
Future research should also expand from the perspective of technological innovation, enhancing the energy-saving and carbon reduction effects of new energy vehicles through technological advancements, thereby contributing to the achievement of the dual-carbon goals.

Author Contributions

Z.C. and M.-T.C., collecting data, model testing, constructing the model and writing the paper; S.-W.J., designing the research outline and revising the paper. All authors have read and agreed to the published version of the manuscript.

Funding

This research was supported by the MOE (Ministry of Education of China) Project of Humanities and Social Sciences Research (Grant No. 24YJA630012).

Institutional Review Board Statement

Not applicable.

Informed Consent Statement

Not applicable.

Data Availability Statement

Data will be made available on request.

Acknowledgments

We are thankful to the anonymous reviewers.

Conflicts of Interest

The authors declare that they have no known competing financial interests or personal relationships that could have appeared to influence the work reported in this paper.

Appendix A. Main Parameters and Equations

VariableTypeFormulaSource
Average annual mileage of new energy private carsConstant157.717[36]
Average annual mileage of fuel private carsConstant167.024[36]
Private car travel
ratio
Constant0.55[35]
New energy
vehicle substitution effect
Constant0.3172[34]
Scrap rate of fuel powered private carsConstant0.0667[37]
Net Population growthAuxiliaryNet Population growth = Total urban population × Net population growth rateComputed according to the facts
GDP per capitaAuxiliaryGDP per capita = total urban GDP/total urban populationComputed according to the facts
Total urban populationLevelINTEG(Net population growth, 1.0692 × 10⁷)SD-RA Model
Population growth rateAuxiliaryWITHLOOKUP(Time, ([(0, 0) − (4000, 10)], (2018, 0.03513), (2019, 0.02514), (2020, 0.02121), (2021, 0.00991), (2022, 0.00675), (2023, 0.01403), (2024, 0.01799), (2025, 0.01435), (2026, 0.01444), (2027, 0.01438), (2028, 0.0144), (2029, 0.01434), (2030, 0.01441)))SD-RA Model
The number of new energy private carsLevel(2015, 5000), (2017, 36,892), (2018, 51,045),
(2020, 139,904), (2022, 256,000), (2023, 380,000)
Official website data
The total GDP of the cityLevel(2015, 7350), (2016, 8130), (2017, 9300),
(2018, 10,670), (2019, 11,590), (2020, 11,850),
(2021, 12,540), (2022, 12,930)
Official website data
Population dataLevel(2015, 1069.2), (2016, 1119.4), (2017, 1164.3),
(2018, 1205.2), (2019, 1235.5), (2020, 1261.7),
(2021, 1274.2), (2022, 1282.8)
Official website data

References

  1. Yao, X.S.; Shao, Z.Q.; Wang, Z.; Zhu, Z.; Chen, Z.X.; Wu, Q.Y. Policy incentives and market mechanisms dual-driven framework for new energy vehicles promotion. Energy Policy 2025, 199, 114530. [Google Scholar] [CrossRef]
  2. Fander, A.; Yaghoubi, S. Dynamic and stochastic modeling for a closed-loop automotive supply chain under fuel issue and government intervention: A case study. Comput. Ind. Eng. 2022, 174, 108765. [Google Scholar] [CrossRef]
  3. Bu, C.J.; Cui, X.Q.; Li, R.Y.; Li, J.; Zhang, Y.X.; Wang, C.; Cai, W.J. Achieving net-zero emissions in China’s passenger transport sector through regionally tailored mitigation strategies. Appl. Energy 2021, 284, 116265. [Google Scholar] [CrossRef]
  4. Chen, Y.; Luo, Q.I.; Chongsen, M.A. Carbon unlocking efficiency study based on super-efficiency SBM-Malmquist. Rairo-Oper. Res. 2024, 58, 457–474. [Google Scholar] [CrossRef]
  5. Zhao, C.Y.; Wang, K.; Dong, X.C.; Dong, K.Y. Is smart transportation associated with reduced carbon emissions? The case of China. Energy Econ. 2025, 105, 105715. [Google Scholar] [CrossRef]
  6. Chen, L.; Ma, R. Clean energy synergy with electric vehicles: Insights into carbon footprint. Energy Strategy Rev. 2024, 53, 101394. [Google Scholar] [CrossRef]
  7. Lin, J. Effects of electric vehicle demonstration and promotion policy on air pollution: Evidence from China. Transp. Policy 2025, 162, 1–19. [Google Scholar] [CrossRef]
  8. Li, P.; Zhang, Z.X. The effects of new energy vehicle subsidies on air quality: Evidence from China. Energy Econ. 2023, 120, 106624. [Google Scholar] [CrossRef]
  9. Xie, D.; Gou, Z.H.; Gui, X.C. How electric vehicles benefit urban air quality improvement: A study in Wuhan. Sci. Total Environ. 2024, 906, 167584. [Google Scholar] [CrossRef] [PubMed]
  10. Cai, J.Y.; Zhu, M.Z.; Wu, J.; Chen, X.L.; Xu, J.J.; Shen, Z.Y. Evaluating the impact of new energy vehicle subsidies on urban carbon emissions: Evidence from 261 Chinese cities. Renew. Energy 2025, 240, 122261. [Google Scholar] [CrossRef]
  11. Yu, Y.M.; Xu, H.; Cheng, J.P.; Wan, F.; Ju, L.; Liu, Q.Z.; Liu, J. Which type of electric vehicle is worth promoting mostly in the context of carbon peaking and carbon neutrality? A case study for a metropolis in China. Sci. Total Environ. 2022, 837, 155626. [Google Scholar] [CrossRef] [PubMed]
  12. Qiao, D.D.; Wei, X.Z.; Fan, W.J.; Jiang, B.; Lai, X.; Zheng, Y.J.; Tang, X.L.; Dai, H.F. Toward safe carbon–neutral transportation: Battery internal short circuit diagnosis based on cloud data for electric vehicles. Appl. Energy 2022, 317, 119168. [Google Scholar] [CrossRef]
  13. Liu, Y.X.; Li, H.J.; An, H.Z.; Guan, J.H.; Shi, J.L.; Han, X.D. Are the environmental impacts, resource flows and economic benefits proportional? Analysis of key global trade routes based on the steel life cycle. Ecol. Indic. 2021, 122, 107306. [Google Scholar] [CrossRef]
  14. Liu, Y.X.; Li, H.J.; Ren, H.J.; Jiang, H.D.; Ren, B.; Ma, N.; Chen, Z.S.; Zhong, W.Q.; Ulgiati, S. Shared responsibility for carbon emission reduction in worldwide “steel-electric vehicle” trade within a sustainable industrial chain perspective. Ecol. Econ. 2025, 227, 108393. [Google Scholar] [CrossRef]
  15. Li, Z.Z.; Zhu, N.G.; Wen, X.; Liu, Y. Assessment the impact of power generation hours on the abatement costs of CCUS on coal-fired power plants in China. Energy Econ. 2025, 144, 108305. [Google Scholar] [CrossRef]
  16. Wang, Q.Z.; Xia, F.; Liu, M.D. Substitution or expansion: Effects of new energy vehicle subsidies on air quality. J. Environ. Manag. 2025, 377, 124538. [Google Scholar] [CrossRef]
  17. Wang, Y.Y.; Fan, R.G.; Lin, J.C.; Chen, F.Z.; Qian, R.R. The effective subsidy policies for new energy vehicles considering both supply and demand sides and their influence mechanisms: An analytical perspective from the network-based evolutionary game. J. Environ. Manag. 2023, 325, 116483. [Google Scholar] [CrossRef]
  18. Wang, Y.D.; Mao, J.Q.; Chen, F.; Wang, D.L. Uncovering the dynamics and uncertainties of substituting coal power with renewable energy resources. Renew. Energy 2022, 193, 669–686. [Google Scholar] [CrossRef]
  19. Li, J.C.; Jiang, M.R.; Li, G. Does the new energy vehicles subsidy policy decrease the carbon emissions of the urban transport industry? Evidence from Chinese cities in Yangtze River Delta. Energy 2024, 298, 131322. [Google Scholar] [CrossRef]
  20. Sun, C.W.; Xu, S.H.; Yang, M.; Gong, X. Urban traffic regulation and air pollution: A case study of urban motor vehicle restriction policy. Energy Policy 2022, 163, 112819. [Google Scholar] [CrossRef]
  21. Chen, J.; Wang, Y.S.; Xu, Y.Y.; Shi, J.Y. Dual-credit policy failure: The emergence principle and hedging mechanisms. Energy Econ. 2025, 141, 108124. [Google Scholar] [CrossRef]
  22. Shang, Y.T.; Li, D.; Li, Y.; Li, S. Explainable spatiotemporal multi-task learning for electric vehicle charging demand prediction. Appl. Energy 2025, 384, 125460. [Google Scholar] [CrossRef]
  23. Li, Z.M.; Wu, L.; Xu, Y.; Zheng, X.D. Stochastic-weighted robust optimization based bilayer operation of a multi-energy building microgrid considering practical thermal loads and battery degradation. IEEE Trans. Sustain. Energy 2022, 13, 668–682. [Google Scholar]
  24. Liang, X.M.; Wang, P.; Cao, X.; Wan, X.M.; Chao, P.P.; Zhang, X.; Yu, A.D.; Liu, C.; Li, J.L. Research on improving the safety of new energy vehicles exploits vehicle operating data. Saf. Sci. 2024, 181, 106681. [Google Scholar] [CrossRef]
  25. Ma, X.Y.; Lu, C.X.; Gao, J.W.; Cao, J.; Wam, Y.H.; Fang, H. Sustainability of new energy vehicles from a battery recycling perspective: A bibliometric analysis. Heliyon 2024, 10, e33800. [Google Scholar] [CrossRef] [PubMed]
  26. Yi, Y.X.; Fu, A.; Li, Y.Q.; Zhang, A.X. Battery recycling and coordination in information leakage prevention under blockchain technology in a new energy vehicles supply chain. Energy Econ. 2024, 139, 107862. [Google Scholar] [CrossRef]
  27. Jia, C.C.; Liu, W.; He, H.W.; Chau, K.T. Deep reinforcement learning-based energy management strategy for fuel cell buses integrating future road information and cabin comfort control. Energy Convers. Manag. 2024, 321, 119032. [Google Scholar] [CrossRef]
  28. Jia, C.C.; He, H.W.; Zhou, J.M.; Li, J.W.; Wei, Z.B.; Li, K.A. Learning-based model predictive energy management for fuel cell hybrid electric bus with health-aware control. Appl. Energy 2024, 355, 122228. [Google Scholar] [CrossRef]
  29. Buhmann, K.M.; Criado, J.R. Consumers’ preferences for electric vehicles: The role of status and reputation. Transp. Res. Part D Transp. Environ. 2023, 114, 103530. [Google Scholar] [CrossRef]
  30. Sahoo, D.; Harichandan, S.; Kar, S.K.; Sreejesh, S. An empirical study on consumer motives and attitude towards adoption of electric vehicles in India: Policy implications for stakeholders. Energy Policy 2022, 165, 112941. [Google Scholar] [CrossRef]
  31. Bi, C.; Jin, S.J.; Li, S.Z.; Li, Y.N. Can green advertising increase consumers’ purchase intention of electric vehicles? An experimental study from China. J. Clean. Prod. 2023, 419, 138260. [Google Scholar] [CrossRef]
  32. Song, Y.; Chen, B.; Hou, N.; Yang, Y. Terrorist attacks and oil prices: A time-varying causal relationship analysis. Energy 2022, 246, 123340. [Google Scholar] [CrossRef]
  33. Sun, H.Q.; Jing, P.; Wang, B.H.; Cai, Y.H.; Ye, J.; Wang, B.C. The effect of record-high gasoline prices on the consumers’ new energy vehicle purchase intention: Evidence from the uniform experimental design. Energy Policy 2023, 175, 113500. [Google Scholar] [CrossRef]
  34. Guo, X.D.; Wang, F. Government Subsidies, Demand Substitution and Emission Reduction Effects under the “Dual Carbon” Target: Evidence from the Chinese Passenger Car Market. Res. Quant. Tech. Econ. 2024, 41, 131–150. [Google Scholar]
  35. Zhu, M.H. Socio-Economic Impact Analysis of Urban Traffic Congestion. Master’s Thesis, Beijing Jiaotong University, Beijing, China, 2013. [Google Scholar]
  36. Liu, N.; Kong, J. Research on Consumer Choice Behavior of New Energy Vehicles with the Introduction of a Carbon Reward Mechanism. Soft Sci. 2024, 38, 49–57. [Google Scholar] [CrossRef]
  37. Jia, S.W. Research on the Double Dividend Effect of Control Strategies for Reducing Motor Vehicle Pollutant Emissions. Manag. Rev. 2022, 34, 53–61+182. [Google Scholar] [CrossRef]
Figure 1. Causal loop diagram of energy saving and carbon reduction in new energy private cars.
Sustainability 17 02811 g001
Figure 2. New energy vehicle energy conservation and carbon reduction management model.
Sustainability 17 02811 g002
Figure 3. Flowchart of the SD-RA-RE model algorithm based on reference effect.
Sustainability 17 02811 g003
Figure 4. Extreme conditions test.
Sustainability 17 02811 g004
Figure 5. Baseline scenario.
Sustainability 17 02811 g005
Figure 6. The impact of charging fee reduction on main variables.
Sustainability 17 02811 g006
Figure 7. The impact of combined strategies on main variables.
Sustainability 17 02811 g007
Figure 8. The impact of combined strategies on main variables.
Sustainability 17 02811 g008
Figure 9. The impact of combined strategies on main variables.
Sustainability 17 02811 g009
Figure 10. The impact of charging fee reduction on main variables.
Sustainability 17 02811 g010
Table 1. Data.
Table 1. Data.
VariableFormula
the number of new energy private cars(2015, 5000), (2017, 36,892), (2018, 51,045), (2020, 139,904), (2022, 256,000), (2023, 380,000)
the total GDP of the city(2015, 7350), (2016, 8130), (2017, 9300), (2018, 10,670), (2019, 11,590), (2020, 11,850), (2021, 12,540), (2022, 12,930)
population data(2015, 1069.2), (2016, 1119.4), (2017, 1164.3), (2018, 1205.2), (2019, 1235.5), (2020, 1261.7), (2021, 1274.2), (2022, 1282.8)
Table 2. Model equations.
VariableTypeFormulaSource
GDP growth rateAuxiliaryWITHLOOKUP (Total GDP of the citym, ([(10,000, 0) − (40,000, 1)], (10,670, 0.1473), (11,590, 0.0862), (11,850, 0.0224), (12,540, 0.0582), (12,930, 0.0311), (13,620, 0.0534), (14,938, 0.0968), (15,921, 0.0658), (16,968, 0.0658), (18,084, 0.0658), (19,274, 0.0658), (20,542, 0.0658), (21,893, 0.0658)))SD-RA Model
Traffic congestion
level
AuxiliaryLN(1 + total number of private car trips/5 × 106)
The influence of
price reference
effect
Auxiliary(Customer valuation of the Product − total cost of new energy vehicles + Customer sensitivity to price changes × (average annual mileage of new energy private cars × 8 × power consumption of new energy vehicles per 100 km × 1.2 × reduced charging fees/10,000))/
(customer valuation of the product—13—average annual mileage of new energy private cars × 1.2 × 8 × 11/10,000)
New energy
vehicle substitution effect
Constant0.3172[34]
Growth of private fuel vehiclesAuxiliaryNumber of private fuel cars × Growth rate of private fuel cars − Substitution effect of new energy vehicles × Growth of new energy vehicles
New energy
vehicle growth rate table function
AuxiliaryWITHLOOKUP (GDP per capita, ([(8, 0) − (40,000, 10)], (8.853, 0.03836), (9.841, 0.5621), (10.08, 0.1714), (10.47, 0.4844), (11.104, 0.4874), (11.6, 0.3377), (12.117, 0.3114), (12.658, 0.2905), (13.222, 0.2736), (13.813, 0.2596), (14.429, 0.2474)))SD-RA Model
Private car travel
ratio
Constant0.55[35]
Population growth rateAuxiliaryWITHLOOKUP (Time, ([(0, 0) − (4000, 10)], (2018, 0.03513), (2019, 0.02514), (2020, 0.02121), (2021, 0.00991), (2022, 0.00675), (2023, 0.01403), (2024, 0.01799), (2025, 0.01435), (2026, 0.01444), (2027, 0.01438), (2028, 0.0144), (2029, 0.01434), (2030, 0.01441)))SD-RA Model
Table 3. Data and formula.
VariableFormula
GDP{(2015, 7350), (2016, 8130), (2017, 9300), (2018, 10,670), (2019, 11,590), (2020, 11,850), (2021, 12,540), (2022, 12,930), (2023, 13,620), (2024, 14,938), (2025, 15,921), (2026, 16,968), (2027, 18,084), (2028, 19,274), (2029, 20,542), (2030, 21,893)}
Population{(2015, 1069.2), (2016, 1119.4), (2017, 1164.3), (2018, 1205.2), (2019, 1235.5), (2020, 1261.7), (2021, 1274.2), (2022, 1282.8), (2023, 1300.8), (2024, 1345.3), (2025, 1372.5), (2026, 1400.3), (2027, 1428.7), (2028, 1457.7), (2029, 1487.2), (2030, 1517.3)}
GDP per capitaGDP/Population
Table 4. Coefficient.
VariableCoefficient
(Per capita GDP)2−33,189.55
(Per capita GDP)32943.82
Constant627,075.466
Table 5. Relative error test of actual and simulated GDP per capita data.
Year2017201820192020202120222023
Real value7.9888.8539.3819.3929.84110.08010.470
Analog value7.9888.9329.5089.5679.88610.16310.588
Relative error00.89%1.36%1.86%0.45%0.83%1.12%
Table 6. Relative error test between actual urban population data and simulated data.
Year2017201820192020202120222023
Real value1164.31205.21235.51261.71274.21282.81300.8
Analog value1164.31205.911242.971272.181292.361303.231316.69
Relative error00.06%0.6%0.83%1.43%1.59%1.22%
Table 7. Comparison of charging fee reduction and baseline scenario.
VariantBaseline ScenarioReduced Charging Costs: Program IIIRate of Change
Growth in new energy vehicles (Units)434,1591,187,490173.52%
Growth in fuel private cars (Units)552,863178,586−67.7%
Energy consumption of fuel private cars (Liters)7.00237 × 1095.55915 × 109−20.61%
CO2 emissions from fuel private cars (Tons)1.43969 × 1071.14296 × 109−20.61%
Table 8. Comparison of combined strategies and baseline scenarios.
VariantBaseline ScenarioPortfolio Strategy: Option 3Rate of ChangePortfolio Strategy: Option 6Rate of Change
Growth in new energy vehicles (Units)434,159514,49818.5%1,006,110131.74%
Growth in fuel private vehicles (Units)552,863511,510−7.48%266,600−51.78%
Fuel private car energy consumption (Liters)7.00237 × 1096.83312 × 109−2.4170%5.8846 × 10⁹−15.9627%
Carbon dioxide emissions from fuel private cars (Tons)1.43969 × 1071.40489 × 107−2.4172%1.20987 × 10⁷−15.9631%
Table 9. Comparison of portfolio strategy and baseline scenario.
VariantBaseline ScenarioProgram 9Rate of Change
New energy vehicle growth ownership (Units)1.75489 × 1066.19524 × 106253.03%
Fuel private car ownership (Units)5.40262 × 1063.30396 × 106−38.85%
Fuel private car energy consumption (Liters)7.00237 × 1094.28228 × 109−38.85%
Carbon dioxide emissions from fuel private cars (Tons)1.43969 × 1078.80437 × 106−38.85%
Table 10. Comparison of charging fee reduction and baseline scenario.
VariantBaseline ScenarioReduced Charging Costs: Program IIIRate of Change
Growth in new energy vehicles (Units)434,1591,187,490173.52%
Growth in fuel private cars (Units)552,863178,586−67.7%
Energy consumption of fuel private cars (Liters)7.00237 × 1095.55915 × 109−20.61%
CO2 emissions from fuel private cars (Tons)1.43969 × 1071.14296 × 107−20.61%
Disclaimer/Publisher’s Note: The statements, opinions and data contained in all publications are solely those of the individual author(s) and contributor(s) and not of MDPI and/or the editor(s). MDPI and/or the editor(s) disclaim responsibility for any injury to people or property resulting from any ideas, methods, instructions or products referred to in the content.

