1. Introduction
Improving energy efficiency in existing buildings is a key strategy for achieving sustainability goals and reducing environmental impact. Operations of buildings account for 30% of global final energy consumption [
1] and 26% of global energy-related carbon emissions [
2]. The challenge of reaching energy-savings in post-primary school buildings from before 1990, without major renovations and investments, while keeping comfort is addressed in this work by focusing on the optimised operation of technical installations, following the interdisciplinary approach of the ENERGE Project.
The EU implemented the Energy Performance of Buildings Directive (EPBD) [
3], aiming to fully decarbonised the building stock by 2050, by setting strict minimum requirements for the energy performance of new and existing buildings. Its latest revisions mandate zero-emission standards for new buildings and emphasise renovations for the least energy-efficient buildings [
4], requiring increasingly embodied energy [
5]. However, a significant gap is observed between the calculated and the real energy demand in buildings [
6].
An important potential for energy savings in relation to the existing building stock also lies in the operation and the mismatch between actual demand and consumption. In general, this is noticed when the user has a limited level of control, and it is more evident in non-residential buildings, which involve many stakeholders [
7]. It can be observed that facility managers tend to have contracts that prioritise maintaining functionality to avoid user complaints, adopting settings to minimise outages, rather than optimising energy efficiency.
The EPBD highlights the importance of energy savings in public buildings, which are expected to set an example for sustainability due to their visibility and potential to influence public behaviour [
3]. Schools, in particular, play a pivotal role in this framework as they shape future citizens who can act as multipliers, propagating energy-saving practices into their homes and communities. Thus, energy optimisation in school buildings can contribute not only to the reduction of energy use in the educational sector, but also to the wider residential sector in the long term.
The issue of mismatched energy consumption—where automatic settings are predefined, but do not align with actual usage periods—has recently been analysed using data-mining techniques to identify instances of energy waste. A study on office buildings in Germany found that, although the lighting system operated continuously, occupancy levels varied by up to 60% during working hours [
8]. Similarly, research on residential buildings revealed discrepancies between occupancy patterns and energy consumption, highlighting the potential for savings through behavioural adjustments [
9]. Zang et al. presented an impact in energy-saving related to the building operation between 10 and 25% for residential buildings, and 5 and 30% for commercial buildings [
10].
The potential impact of optimised monitoring and energy management systems is evident in existing studies. A study on Singaporean non-residential buildings underlines the role of facility managers in the operation and maintenance of technical installations, demonstrating a 36% improvement in energy performance through effective management [
11]. Techem demonstrated that efficiency improvements of up to 15% are achievable in conventional heating systems in residential buildings through enhanced monitoring [
12]. Individual energy measurement and billing have also shown an average reduction of 20% in final energy consumption [
13], highlighting the importance of user engagement in energy management. Furthermore, research by Thewes has shown that electricity consumption for lighting can be reduced by up to 82% through the adoption of high-efficiency lighting devices combined with dimming controls [
14].
The concept of sufficiency refers to restringing the use of resources to achieve an acceptable condition. In the context of energy savings in buildings, a systematic review shows flexibility regarding the operation of areas with heterogeneous occupation has an important potential to reduce energy consumption, while reaching the necessary operational requirements according to each activity [
15]. The Intergovernmental Panel on Climate Change (IPCC) concerning the mitigation of climate change shows a carbon-saving potential of 15% for sufficiency measures in Europe and Eurasia [
16].
Interventions aimed at fostering energy-saving in educational buildings benefit significantly from combining technical approaches with behavioural strategies. The study by De Leeuw et al. shows that interventions targeting perceived control, rather than merely emphasising positive outcomes, appear to be more impactful regarding high school students. Additionally, it pledges that descriptive norms—such as the eco-friendly behaviours demonstrated by parents, family members, and influential figures—carry greater weight than injunctive norms—what others say should be done. Therefore, effective norm-based interventions in schools could leverage these findings by involving families and communities to model sustainable practices [
17]. In addition, Cincera and Krajhanzl also highlight the importance of the perceived participation in decision-making for pupils to effectively engage in pro-environmental behaviours [
18].
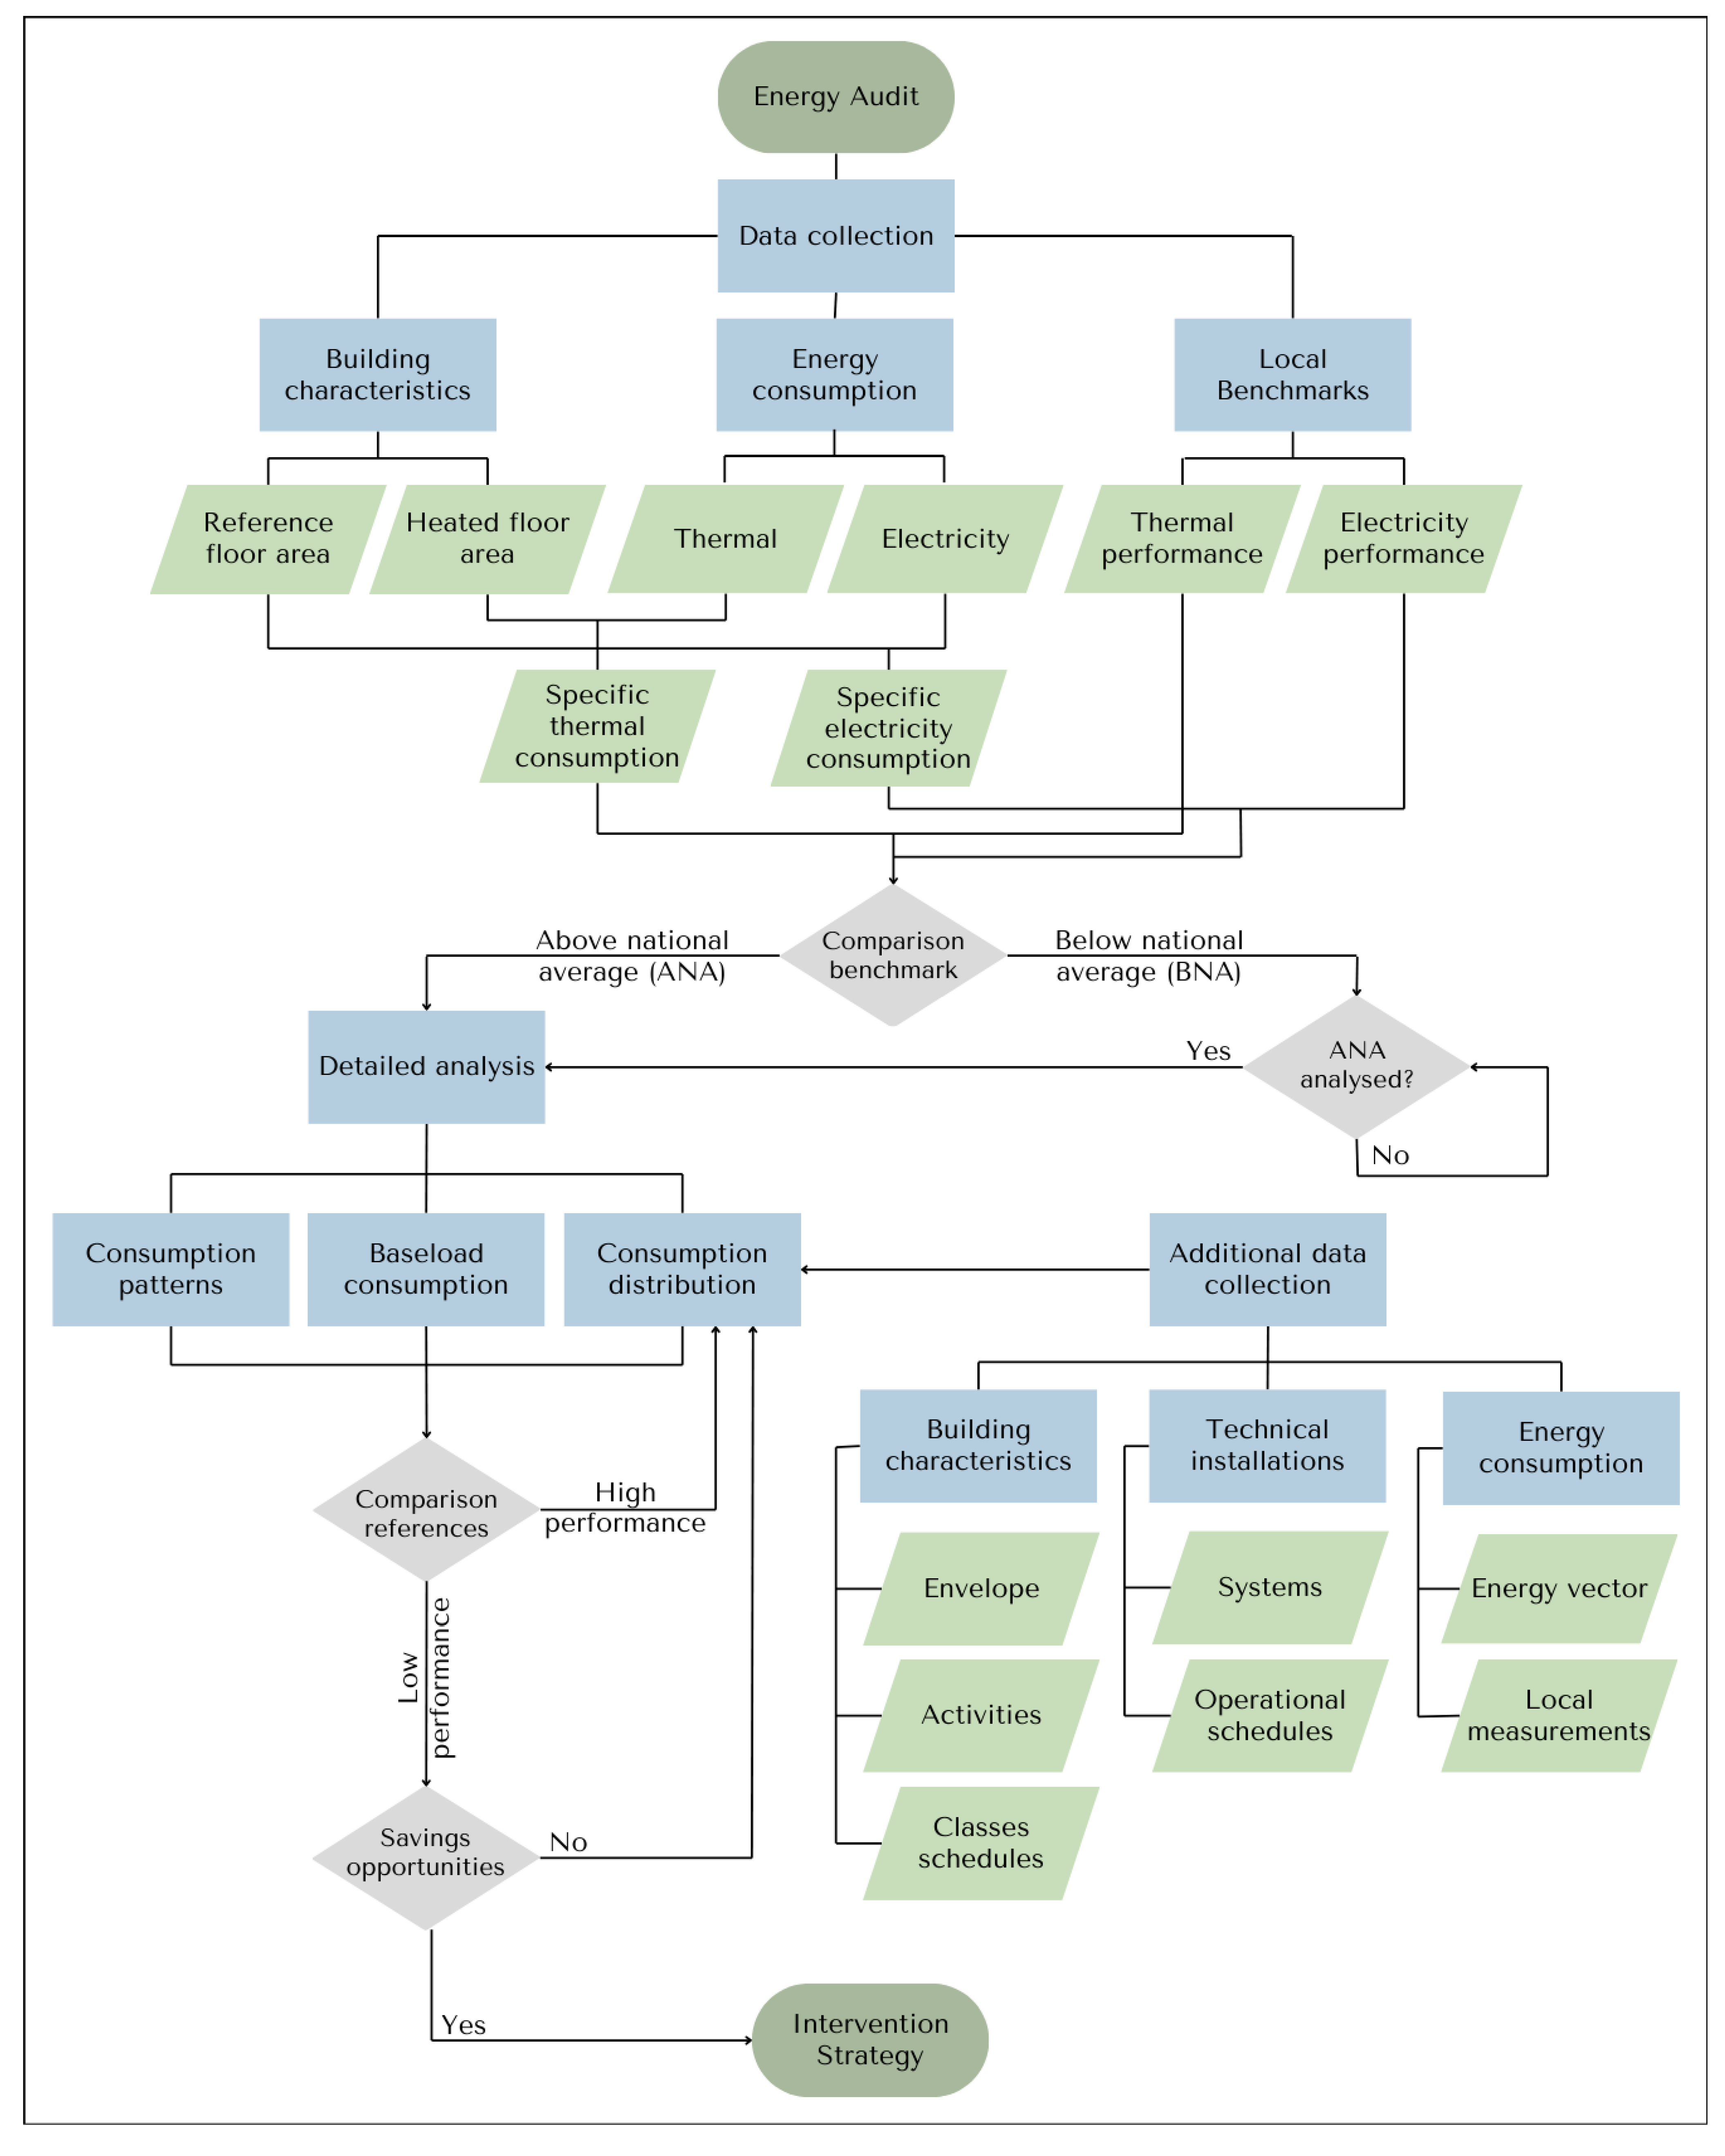
This study follows the five-step methodology for reducing energy consumption in post-primary educational buildings, presented in
Figure 1, which combines technical and behavioural approaches to identify energy-saving opportunities regarding the operational adjustments of the technical installations in school buildings [
19]. It focuses on the energy audit to understand how the building is used and adapting operational settings to the real need while adopting reduced operational modes for empty periods (night-time, weekends, and holidays).
Most conventional energy-saving strategies focus on improving appliance efficiency by replacing existing equipment with more energy-efficient alternatives, or through deep renovation. However, such approaches often face financial constraints and operational challenges. In contrast, our strategy emphasises immediate implementation through operational optimisations, which can be applied regardless of the efficiency level of the installed systems.
When analysing energy consumption in buildings, it is common to associate the age of the building with its energy performance. However, Hoos et al. demonstrated that final heat energy consumption does not directly correlate with the year of construction, as many buildings undergo renovations that significantly alter their energy characteristics [
20]. This insight has led to the suggestion of classifying buildings based on their energy performance, rather than their construction period.
Hoos examined 60% of the school building stock in Luxembourg to calculate the average specific yearly consumptions of heat and electricity [
21]. This analysis provides a valuable benchmark for understanding energy usage patterns in educational facilities, as summarised in
Table 1. Such data can serve as a foundation for targeted energy-saving measures and policy development in the educational sector.
The findings from Roulet indicate that there is no straightforward correlation between energy consumption and user comfort [
22]. However, energy use in building operations is strongly influenced by the technical systems employed to maintain comfortable indoor conditions. Therefore, when developing and implementing energy-saving measures, it is essential to consider the impact on occupant comfort. Effective energy management in buildings requires a balance between reducing consumption and maintaining an acceptable level of comfort.
The objective of this research is to demonstrate practical solutions for reducing energy consumption in post-primary-school buildings constructed prior to 1990, without major renovations, while maintaining comfort standards for users. The proposed approach comprises a comprehensive energy audit, targeted operational adjustments, and reduced settings during unoccupied periods. The definition of high-impact savings measures is based on the evaluation of energy consumption patterns in low-energy-performance operations. The potential of these saving measures is defined through an analysis of two pilot buildings in Luxembourg, which provide a basis for identifying potential savings and for evaluating the effectiveness of different approaches.
2. Methodology
Achieving energy savings in existing buildings is possible through several different approaches. European regulations put an accent in the renovations of older buildings. However, this study proposes the analysis of the energy performance of buildings for identifying high-impact savings measures regarding operational settings, which requires a deep understanding of the real energy demand compared with how energy is being consumed. This work is developed based on the 5-step methodology to reduce energy consumption in post-primary educational buildings, focusing on the analysis of the operational set values of the building [
19]. This methodology is mainly developed based on steps 3, 4, and 5, regarding the energy audit, the intervention strategy, and the evaluation of the related results. In order to fulfil the objectives of this study, two educational edifices, constructed prior to 1990, situated in Luxembourg, were selected as case studies. These have been designated here as buildings B and C.
2.1. Energy Audit
The energy audit begins with the data collection phase, as illustrated in
Figure 2. The data collection is divided in two steps. The initial phase of the process entails the collation of more general information, which will then be analysed in order to evaluate the energy performance of the building in question. This encompasses data regarding reference areas, electricity, and heat consumption. At this stage, the necessary data are obtained from general plans, energy bills, or other available monitoring data. It is essential to identify local benchmarks for the purpose of assessing the energy performance of buildings. This is typically accomplished through a historical data consumption analysis of buildings with similar types of activities, which, in this case, are schools. This work adopts as reference the study of Hoos [
21] regarding the energy performance of the building stock in Luxembourg, and it is presented in
Table 1.
The regulation in Luxembourg concerning energy efficiency [
23] establishes that the energy reference area of a building corresponds to the conditioned part of the net surface inside the envelope. However, since some benchmarks adopted in this study, such as the one presented in
Table 1, refer to the gross floor area, the analyses in this work are performed accordingly. Therefore, to avoid confusion, the adopted reference areas of the educational buildings are always explicitly informed.
Table 2 presents the gross floor area and the heated gross floor area of the pilot educational buildings, obtained from plans and local measurements. The difference is mainly related to technical areas that do not require heating.
The two analysed buildings in this study belong to Administration des Bâtiments Publics (ABP), which operates an energy management system (EMS) that keeps records of the historical consumption of its buildings, as presented in
Table 3, and it is separated between thermal and electrical energy. Depending on the building and the energy supplier, the data are available on a 15 min to monthly basis. The information that is not available in the database requires the analysis of energy bills or similar control performed by the local staff.
A direct comparison of the performance of the two buildings regarding the total consumption is not feasible due to differences in the reference surface areas, which is also reflected in the total consumption figures. Consequently, in order to evaluate the energetic performance of the buildings, it is necessary to calculate the specific energy consumption, as presented in Equation (1). This is achieved by dividing the total thermal consumption, by the total heated gross floor reference area, presented in
Table 2, while the total electricity consumption is divided by the reference gross floor area.
Equation (1). Specific energy consumption
where
and
are the specific heat and electricity consumption,
and
are the total heat and electricity consumed in a period of time, and
is the heated gross floor area, which is the reference area for the heat consumption, while
is the gross floor area of the building.
The thermal and electricity specific energy consumption are evaluated in comparison with the local benchmarks. This comparison furnishes the requisite information for determining the optimal focus for subsequent audit efforts. The approach of identifying high-impact measures that do not involve major renovations and investments is founded upon the premise of identifying and addressing deviations in operation. Accordingly, the methodology suggests that the analysis should be concentrated on the consumption data that are the most divergent from the reference data in order to identify these deviations and consequently the most promising and easiest to leverage saving opportunities.
The specific consumption data that surpass the local references are subjected first to a comprehensive examination. This involves a meticulous analysis of the pertinent information, including the characteristics of the buildings, their envelopes, the patterns of occupancy and distribution of spaces, the technical installations, operational schedule, the adopted energy vectors, and the distribution of energy consumption. This information is gathered through on-site visits, the analysis of architectural and technical plans, and supplementary on-site measurements.
Based on the additional gathered information, the energy consumption data are further examined using trend analysis. The consumption patterns are evaluated through the comparison of the yearly consumption data, where a tendency can be observed. Furthermore, the analysis of the distribution of the measured data over the years provides information on repeating patterns, and regarding the baseload and the peak consumption. This analysis enables the identification of both deviations and improvements in operations, which in addition require further verification of the changes regarding the technical installations and their operational modes. Moreover, the comparison of the consumption in different periods of the year provides information regarding the influence of users and meteorological conditions.
Baseload consumption, defined as the energy consumed by a building when it is not in use, and here identified as the consumption happening below the elbow point of the yearly distribution line of the analysed buildings, represents a significant opportunity for energy savings. This is particularly the case when energy is saved by optimising the operation of the building without major investments while maintaining comfort levels. This is because actions taken during periods of low occupancy may have a substantial impact on energy consumption, yet may not be perceived by building users. To identify the baseload within the dataset, a histogram representation coupled with a duration line was utilised. The histogram provides a visual distribution of the data, revealing patterns and frequency concentrations across different values. Complementing this, the duration line enables a cumulative perspective, facilitating the identification of the baseload threshold. This combined approach allows for a more nuanced understanding of the data structure and aids in pinpointing critical values within the dataset.
The data collection process enables the distribution of energy consumption to be determined between appliances and activities. This is accomplished through the application of technical analysis and local measurements. This information allows for the identification of the locations within the building where the highest energy consumption occurs.
The accurate assessment of energy consumption in different areas and activities within a building typically requires comprehensive measurement and monitoring. By means of an exhaustive examination of the building, its functional activities and technical installations, a variety of usage types are identified and classified in a systematic manner. This enables the identification of representative major consumers, typically characterised by high power demands and/or extended operational periods. Subsequently, the locations of distribution points are identified and measured, thus enabling a detailed assessment of energy consumption across the different building systems. In order to obtain these data, the audit employs a variety of tools and methods, including data from local sub-counters, the installation of electrical meters, and the undertaking of temporary measurements for specific installations, in accordance with the resources available and the accessibility of measuring points. The combination of these resources provides a comprehensive insight into the distribution of energy within the building.
The identification of the highest energy flows also provides guidance as to the areas of the building that require further detailed analysis and where efforts should be concentrated. Moreover, this approach is repeated as often as necessary to enable the comparison of the consumption of a specific activity with that of analogous references, thus facilitating an assessment of its energetic performance. Furthermore, the presence of high energy performance among energy consumers indicates that additional savings opportunities are likely to be scarce. Nevertheless, appliances with low performance may offer potential for savings, which should be evaluated.
Once potential savings are identified, the subsequent step involves developing and implementing an intervention strategy. The proposed approach prioritises actions targeting the most accessible and impactful savings opportunities, initiating measures in these areas before conducting an exhaustive energy assessment of the entire building. However, this approach does not exclude the possibility of identifying savings from the operation of other appliances. When additional resources for auditing are available, further efficiency gains can also be achieved from better-performing areas of the building.
Following the completion of the analysis of consumption below the local benchmarks, it is beneficial to investigate whether additional savings opportunities exist in buildings and appliances with higher efficiency. This is achieved through the same process as previously described, namely a comprehensive examination of the characteristics of the buildings and technical installations in question, coupled with a more detailed analysis of the consumption patterns and distribution. The findings from this assessment should be systematically integrated into the overall intervention strategy to maximise potential savings.
2.2. Intervention Strategy
The intervention strategy combines various energy-saving measures into an integrated framework that defines clear steps toward achieving targeted energy reductions. This strategy outlines the necessary actions, allocates essential resources for effective implementation, and provides procedural guidelines for executing each measure. During this phase, simulations are carried out to estimate the potential impact of each intervention on projected energy savings, aiding in data-driven decision-making regarding resource allocation and implementation priorities. By offering a structured pathway, this approach aims to optimise energy efficiency outcomes systematically.
Energy simulations assess the power requirements of various appliances and factor in their operating hours. Adjustments to usage schedules can be easily quantified by multiplying the appliance power by its operating hours, with estimated savings derived from the difference between baseline and adjusted values. This enables the forecasting of energy savings linked to specific interventions.
2.3. Implementation and Evaluation
Implementing energy-saving measures involves coordinated efforts among key stakeholders, including the building owner, service providers, school administration, and local staff. Each measure is systematically recorded and monitored, facilitating an ongoing evaluation process. This enables a comparison of current energy use with historical consumption, allowing for the evaluation of the implemented measures and timely adaptations to the intervention strategy as needed. Through continuous monitoring, stakeholders can ensure that the energy-saving practices meet projected goals and make real-time adjustments to sustain progress toward optimal efficiency.
3. Results
The results chapter presents the findings of this study, which investigates energy-saving opportunities in educational buildings in Luxembourg, built before 1990, through the optimisation of operational settings. It presents the analysis from the two pilots, referred to as building B and building C. It highlights the potential for operational adjustments to improve energy performance without the need for major refurbishment, providing valuable lessons for energy management in similar contexts.
The analysis of the consumption data with regards to the reference area allows for the evaluation of the energy performance of the studied buildings and the identification of areas requiring further analytical attention in order to identify potential savings opportunities.
Table 4 and
Table 5 present the specific annual thermal and electricity consumption, obtained from the division of the total consumption by the reference areas from
Table 2. These data can be further compared with the local benchmarks presented in
Table 1. The comparative analysis indicates that both buildings B and C exhibit specific thermal consumption rates that are below the national average, indicating a good energetic performance. On average, over the years, the consumption of building B is 53% below the national average of 161 kWh/m
2, adopted as a reference in this study. With an expressive reduction 2022 of 13 kWh/m
2 in comparison with 2021, regarding savings measures during the energy crisis. As per building C, the data concerning the thermal consumption are scarce, with only data from three years, between 2018 and 2020. However, the consumption over this period is on average 38% below the reference, showing a good performance when compared with other school buildings in Luxembourg.
The comparison of the specific electricity consumption with the reference in
Table 1 shows that, on average, over the historical data, both buildings exceeded the national average, although a general tendency of reduction was observed. The electricity consumption of building B showed a gradual reduction over the years, with a difference of 34% between 2017 and 2023. As for building C, the consumption over the years followed a more stable pattern. However, there was a noticeable increase of 24% in 2018 compared with 2017 and an important reduction of 10% between 2022 and 2023, driven by the energy crisis. Therefore, a detailed analysis was carried out on the electricity consumption to identify high-impact savings opportunities.
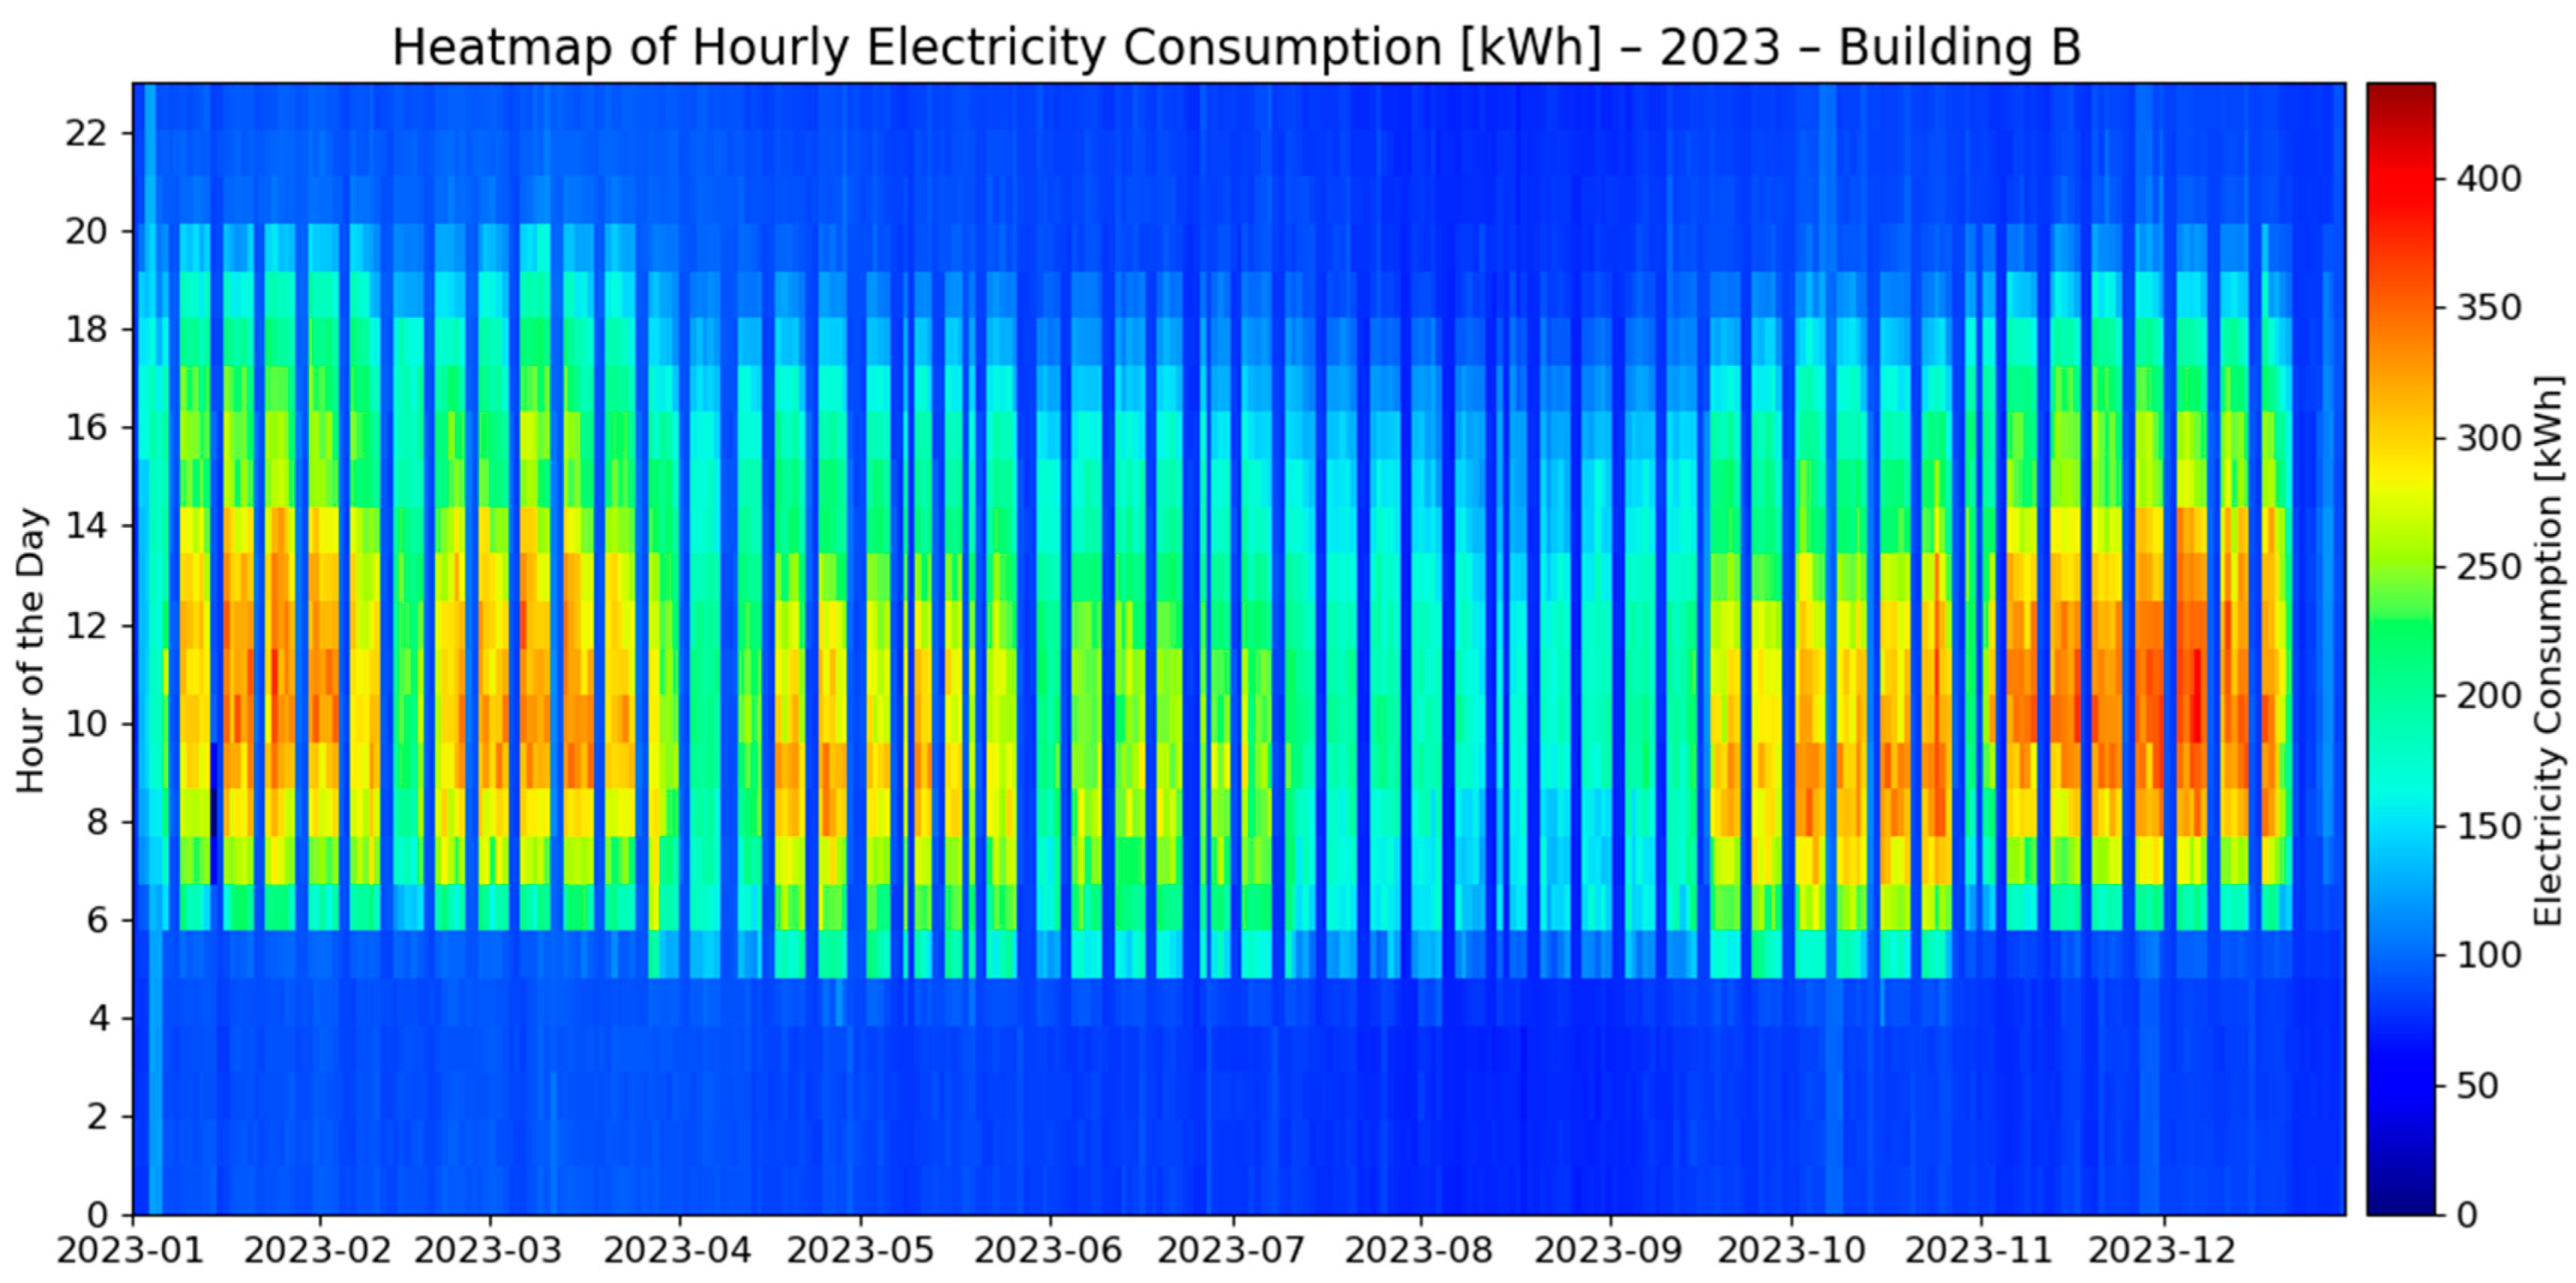
The two buildings under examination in this study are educational facilities, albeit with differing activity patterns. Building B is an educational facility comprising classrooms, laboratories and offices. In contrast, building C is a more diverse complex, housing classrooms, workshops and sports facilities, including a swimming pool. Building C and all its activities adheres to the official Luxembourgish school calendar, whereas building B continues to host office activities during periods of vacation. This is evident from an examination of the heatmap with the hourly electricity consumption presented in
Figure 3 and
Figure 4. The analysis of electricity consumption patterns reveals both typical behaviours and discrepancies.
Both buildings present a similar consumption pattern over the years in the plots in
Figure 3 and
Figure 4, with higher peaks during the winter, at the beginning and end of the year, and a lowering tendency towards the summer, where the lowest consumption occurs. This can be attributed to the absence of heating requirements and the increase in the duration of daylight hours. However, the comparison of these plots also indicates the discrepancy in the manner in which they are used. Since building C is dedicated primarily to educational activities, there is a notable decline in energy consumption during periods of vacation. In contrast, the reduction in energy usage during the summer months in building B is less pronounced due to the presence of office-related activities.
It should also be noted that the shift in the consumption pattern between the months of March and October observed in
Figure 3 and
Figure 4 was due to the fact that the data were recorded with a local time stamp without taking daylight saving time into account. This gives the impression that consumption starts one hour earlier, but in practice, daily activities start at the same hour of the day.
In
Figure 3, the heatmap with the hourly electricity of building B in 2023, registers hourly consumptions between 300 kWh and 400 kWh, between 9 h and 13 h, during weekdays in November and December. Whereas in August of the same year, the peaks are around 150 kWh and 200 kWh between 9 h and 12 h. During the nights, between 21 h and 5 h, over the weekends and during public holidays, the consumption drops to around 75 kWh to 100 kWh, with a smaller variation over the hours.
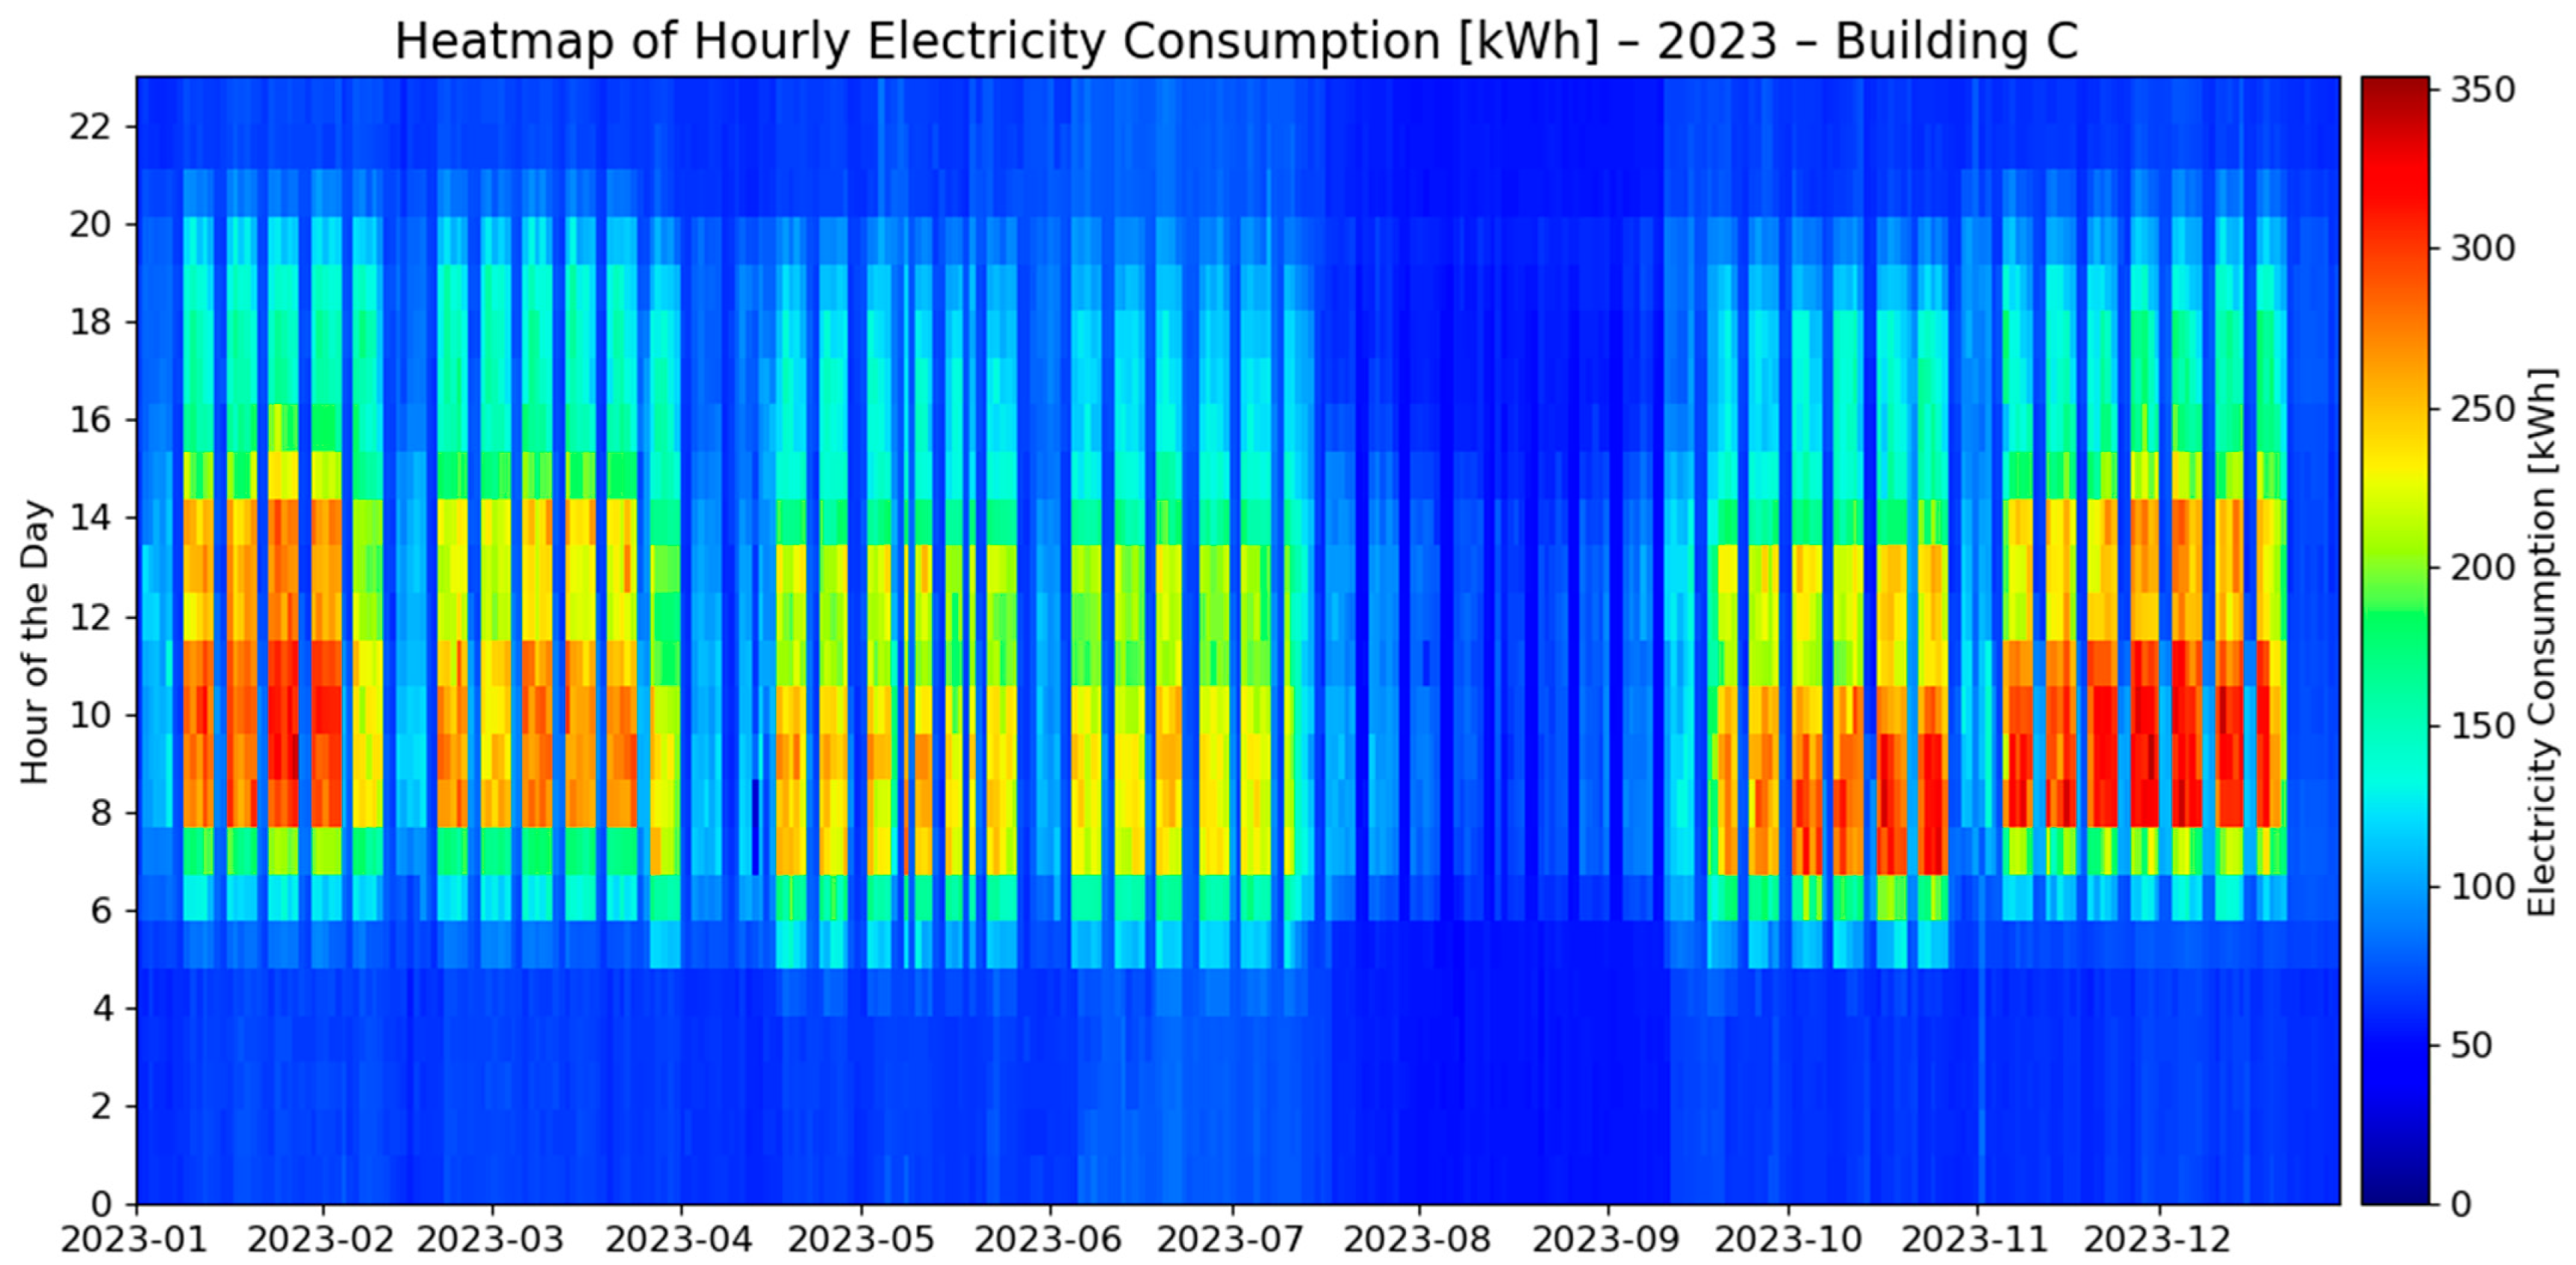
The heatmap displaying the hourly electricity consumption of building C in 2023, as illustrated in
Figure 4, demonstrates that, while both buildings exhibit a similar overall trend, the established consumption pattern is more pronounced in building C. The average overnight consumption is approximately 65 kWh. The rate of consumption begins to increase at 6 h and only declines between 20 h and 21 h. Peaks in consumption are observed during weekdays, between the hours of 8 h and 14 h. However, the highest recorded consumption levels, between 280 and 340 kWh, occur between 8 h and 11 h during weekdays in January, end of October, November, and December.
The influence of the presence of users in the building is further elucidated in
Figure 3 and
Figure 4. It is evident that there is a distinction between the consumption patterns observed in normal weeks, holidays, and on weekends. The influence of office-related activities in building B is also very clear when compared with the consumption pattern registered in building C. However, even in building C, it can be seen that, although the building is not in use during these periods, it still has higher consumption during the holiday weeks than during weekends. This indicates that, although the building is not in use, there are still appliances in operation, such as ventilation systems and circulators, that follow pre-set schedules following the week, disregarding holiday periods.
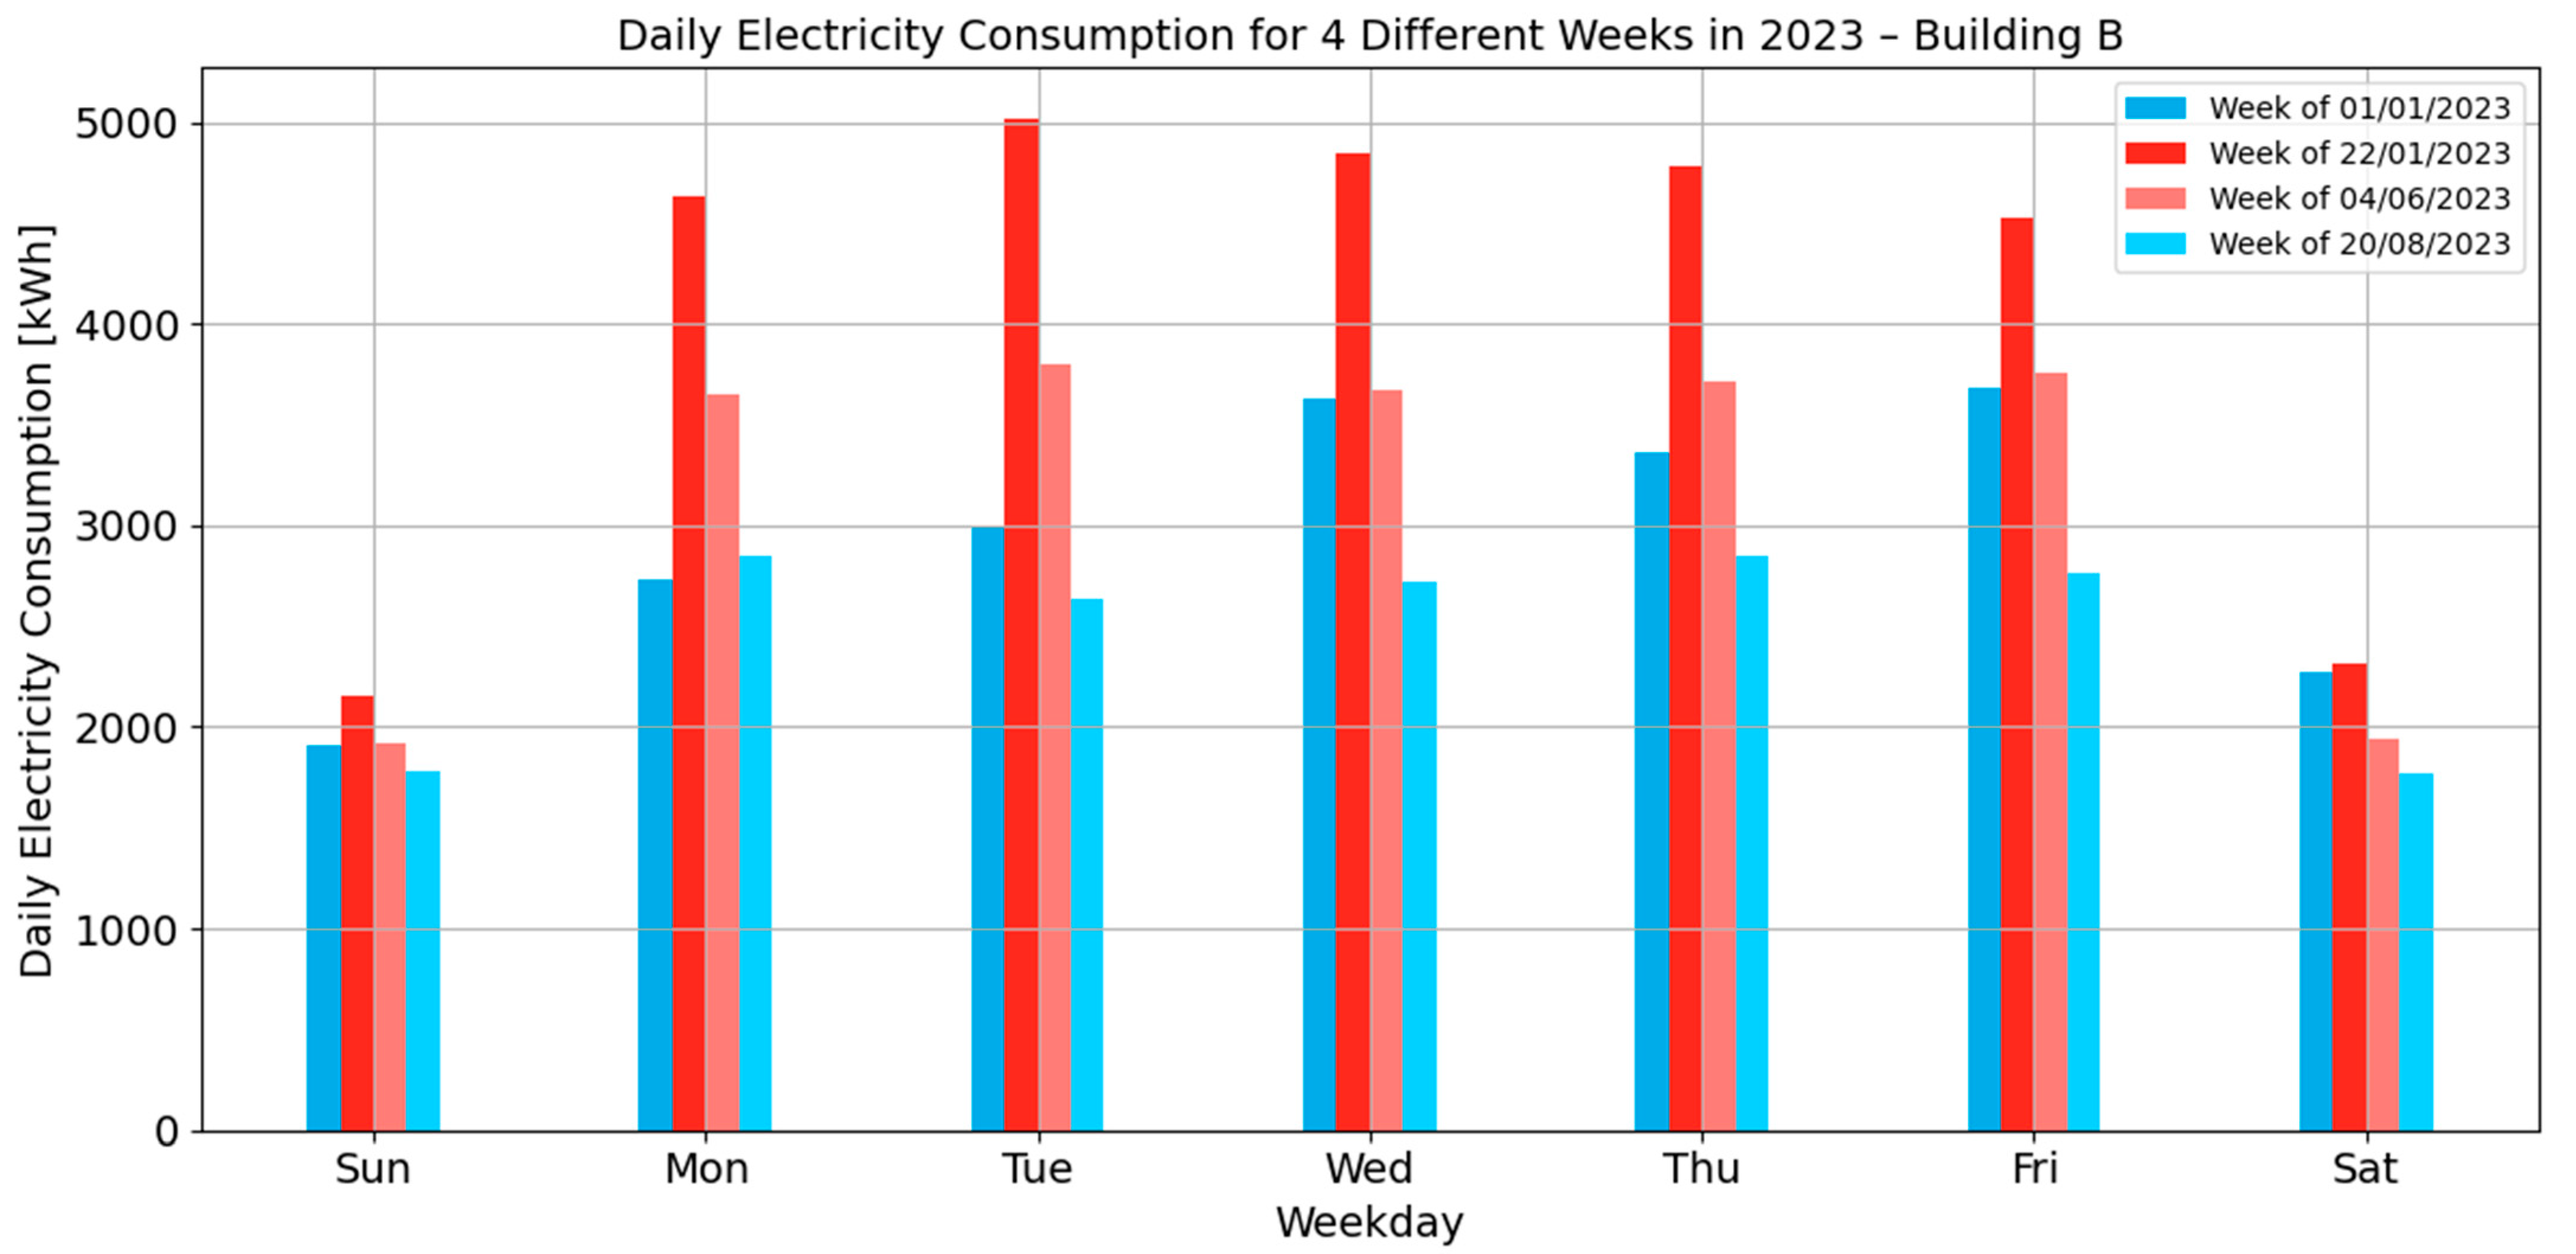
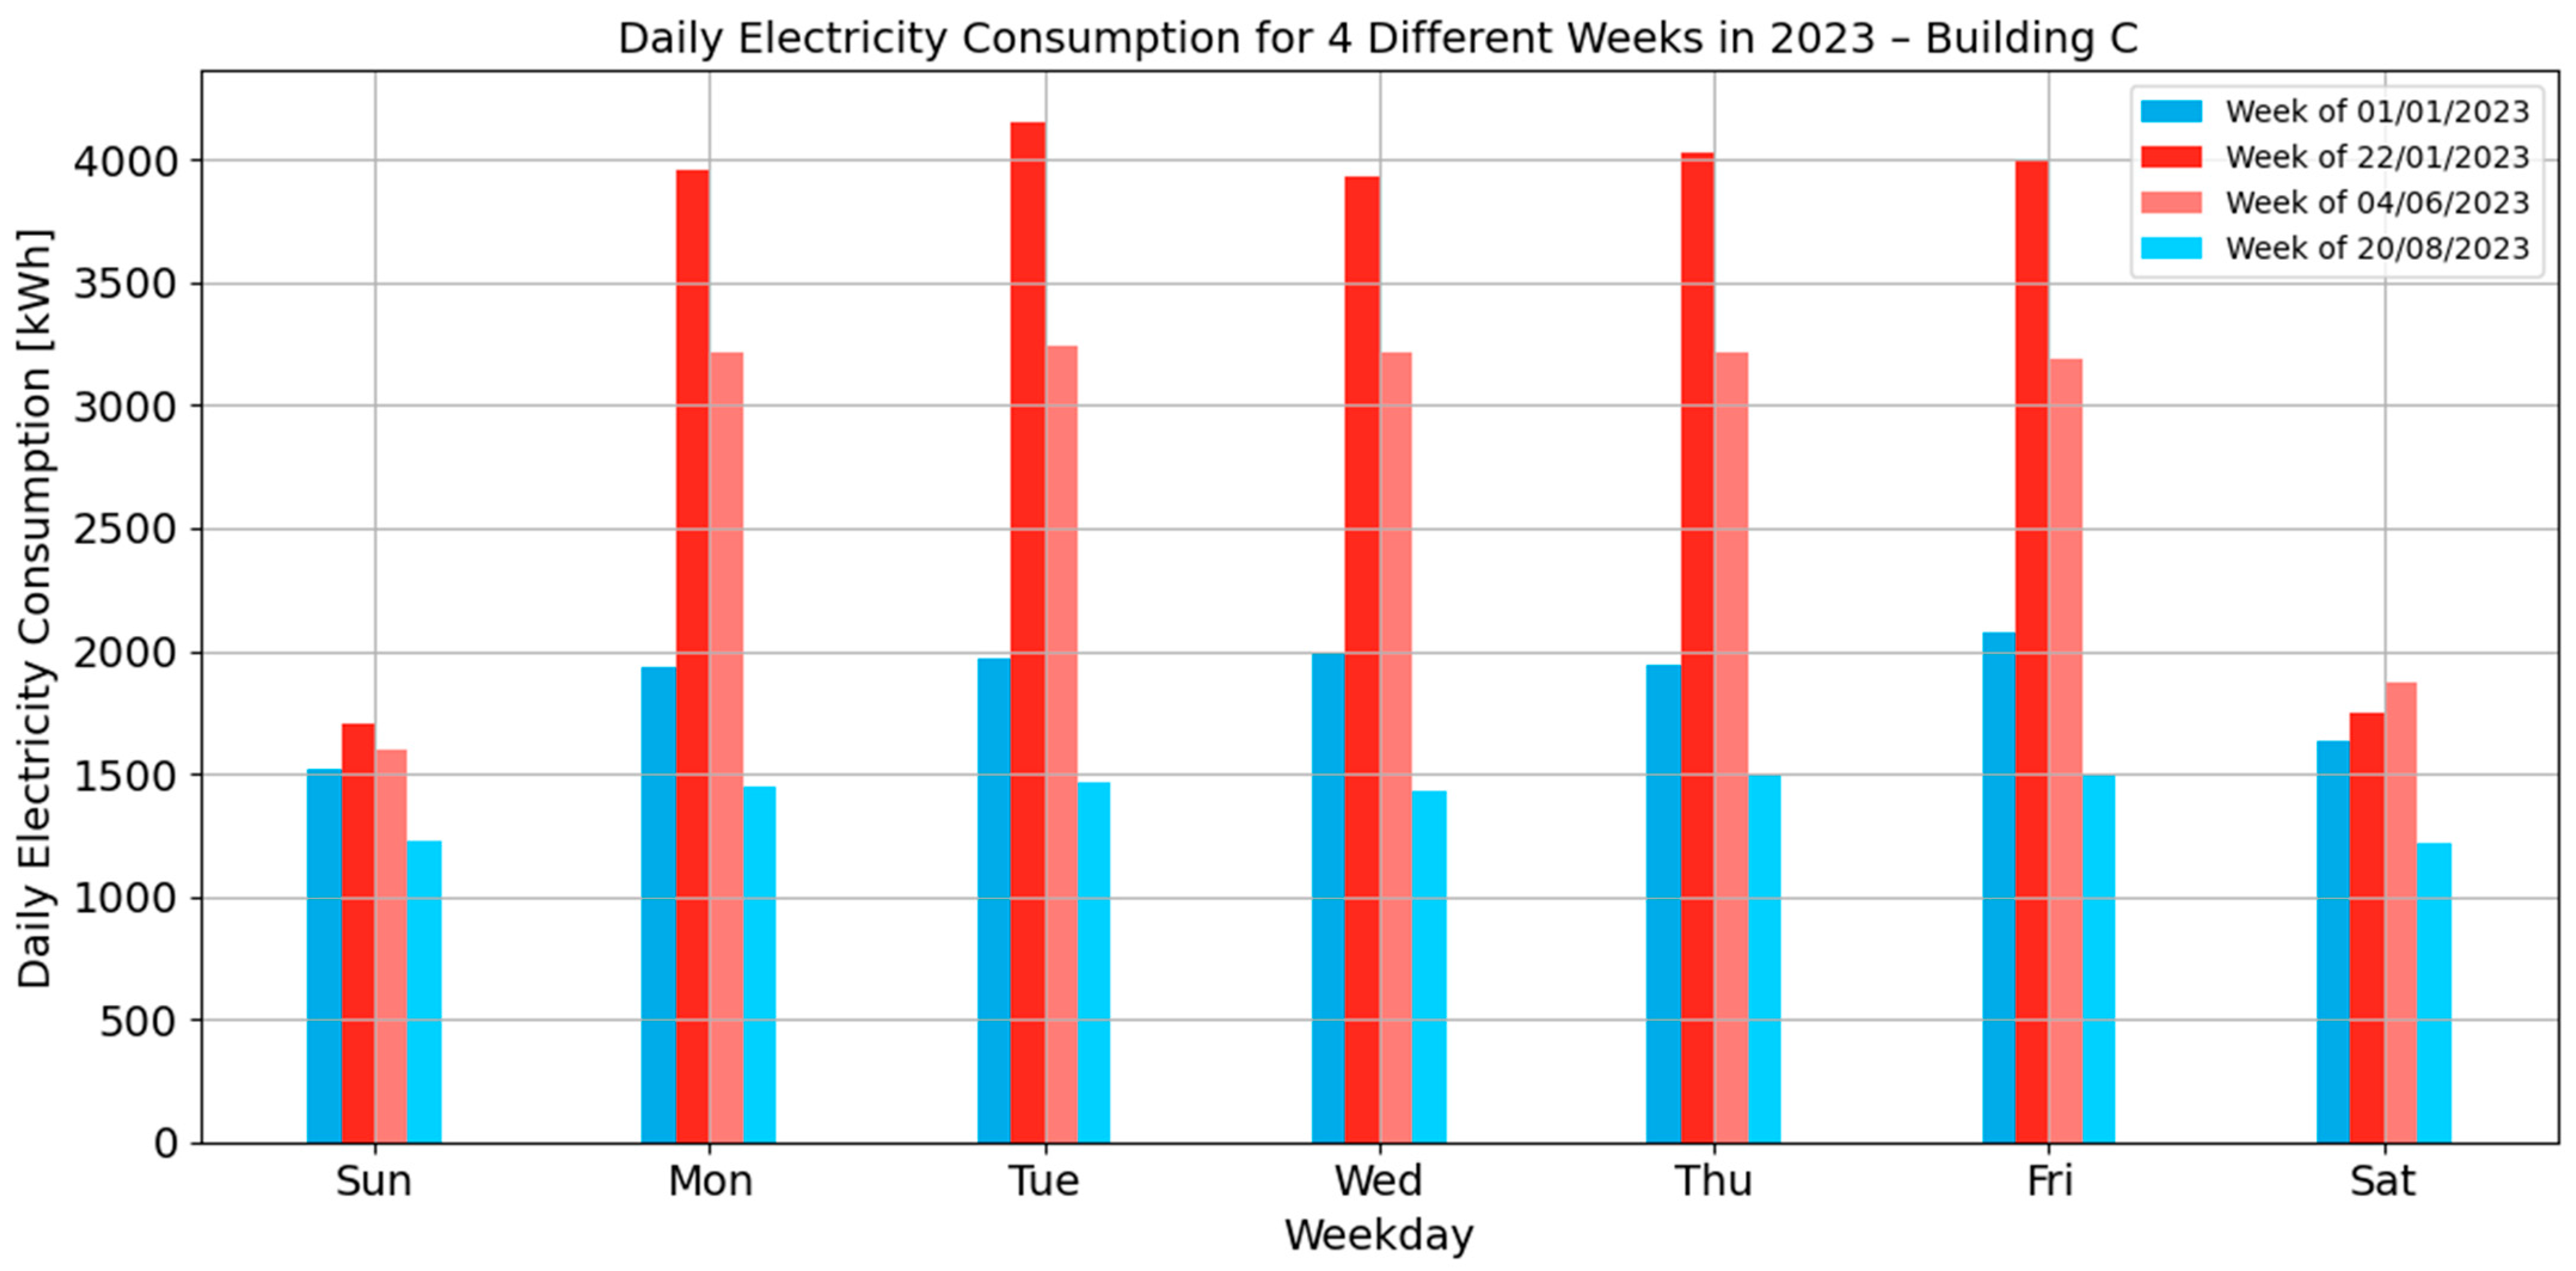
The difference between the consumption pattern over the year is even more explicit with the analysis of
Figure 5 and
Figure 6, which illustrate a comparison between four weeks throughout the course of a year, comprising two typical weeks and two holiday weeks in both the summer and winter. The normal weeks are represented in red and the holiday weeks in blue. The analysis of consumption data indicates that both the presence of users in the building and meteorological conditions exert a notable influence.
In both buildings, the lowest consumption is registered on the weekends, demonstrating the impact of the presence of users and the automatic schedule of technical appliances on the electricity consumption within the building. Furthermore, it is evident that the lowest consumption levels occur during the summer holiday period (week of 06/08/2023—represented in light blue). This emphasises the additional impact of meteorological conditions on energy consumption, particularly in comparison with the periods of low occupancy during the winter months (week of 01/01/2023—represented in dark blue), which exhibit higher energy consumption even during the first week of the year.
The analysis demonstrated that user presence is the primary factor influencing electricity consumption in building C. This effect is particularly evident when comparing holiday periods with normal weeks. Building B, which accommodates some office activities, displays a greater discrepancy in the consumption between weekdays and weekends, even during the winter and summer holidays. This suggests that, although reduced, there are still ongoing activities. Furthermore, the variation in consumption between typical winter weeks (dark colour) and summer weeks (light colour) demonstrates the impact of seasonal climate differences on electricity usage.
Moreover,
Figure 6 indicates that, although building C remains unoccupied during the holiday period, consumption in the winter is higher than that during the summer. In both cases, weekday consumption exceeds that of the weekend, with a more pronounced difference in the winter. This pattern suggests that systems may be operating automatically during unoccupied periods due to pre-set configurations, presenting notable opportunities for energy savings without compromising user comfort. Further investigation is required to ascertain the extent to which these opportunities can be exploited.
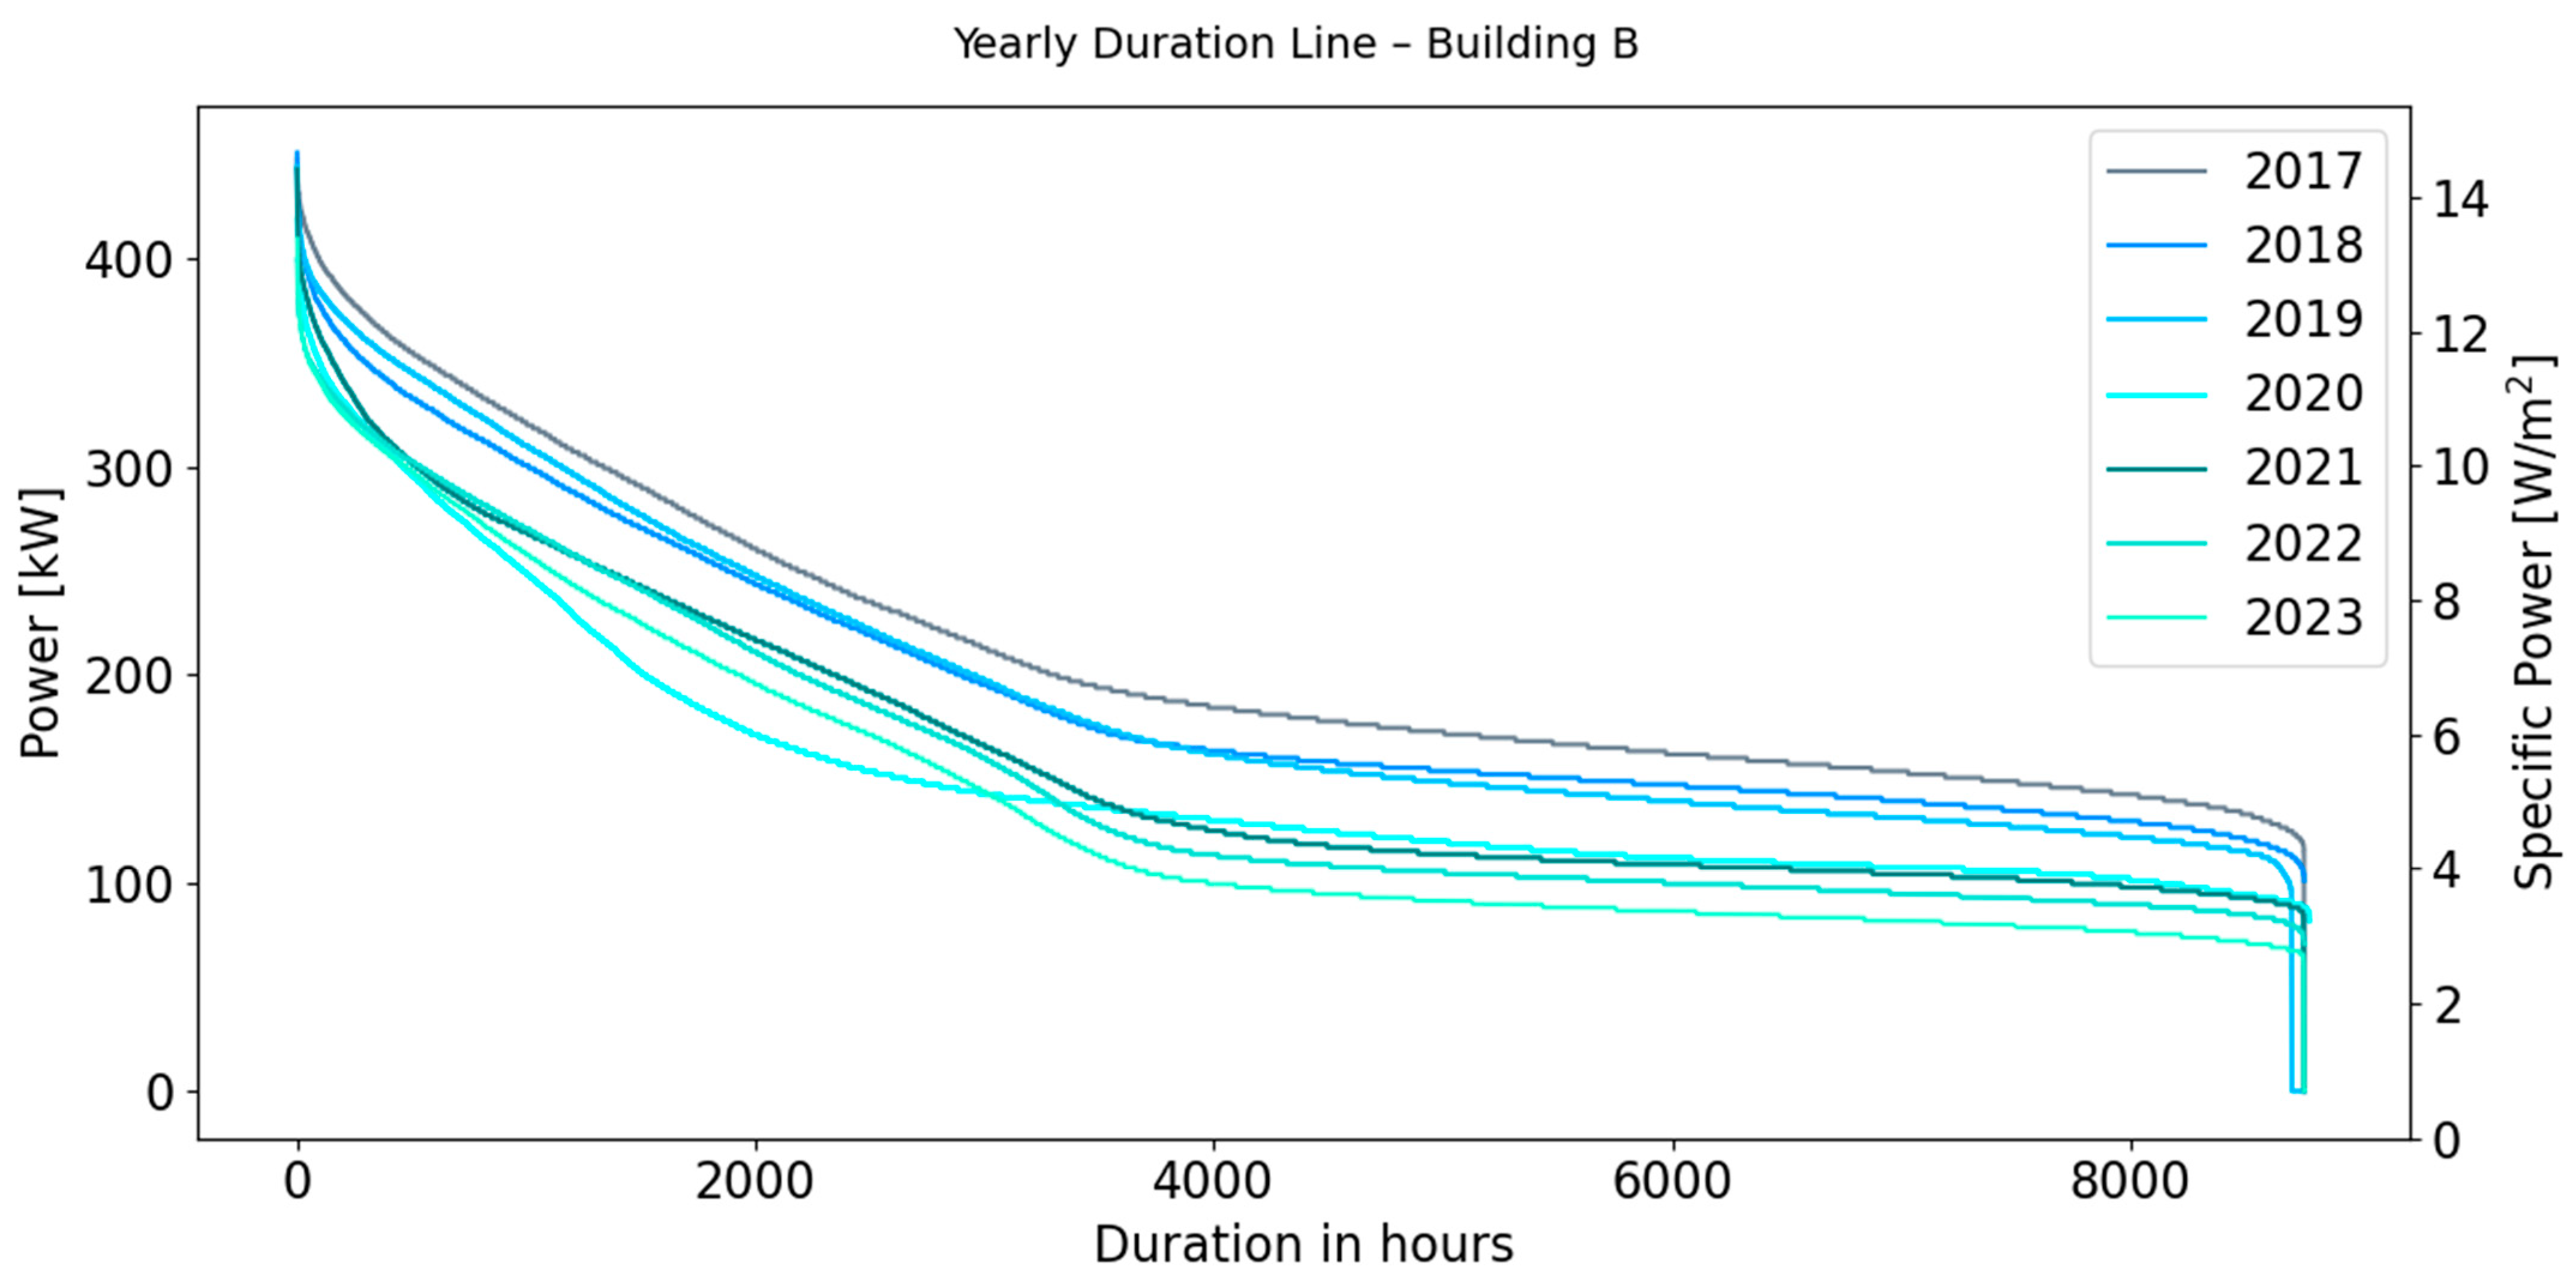
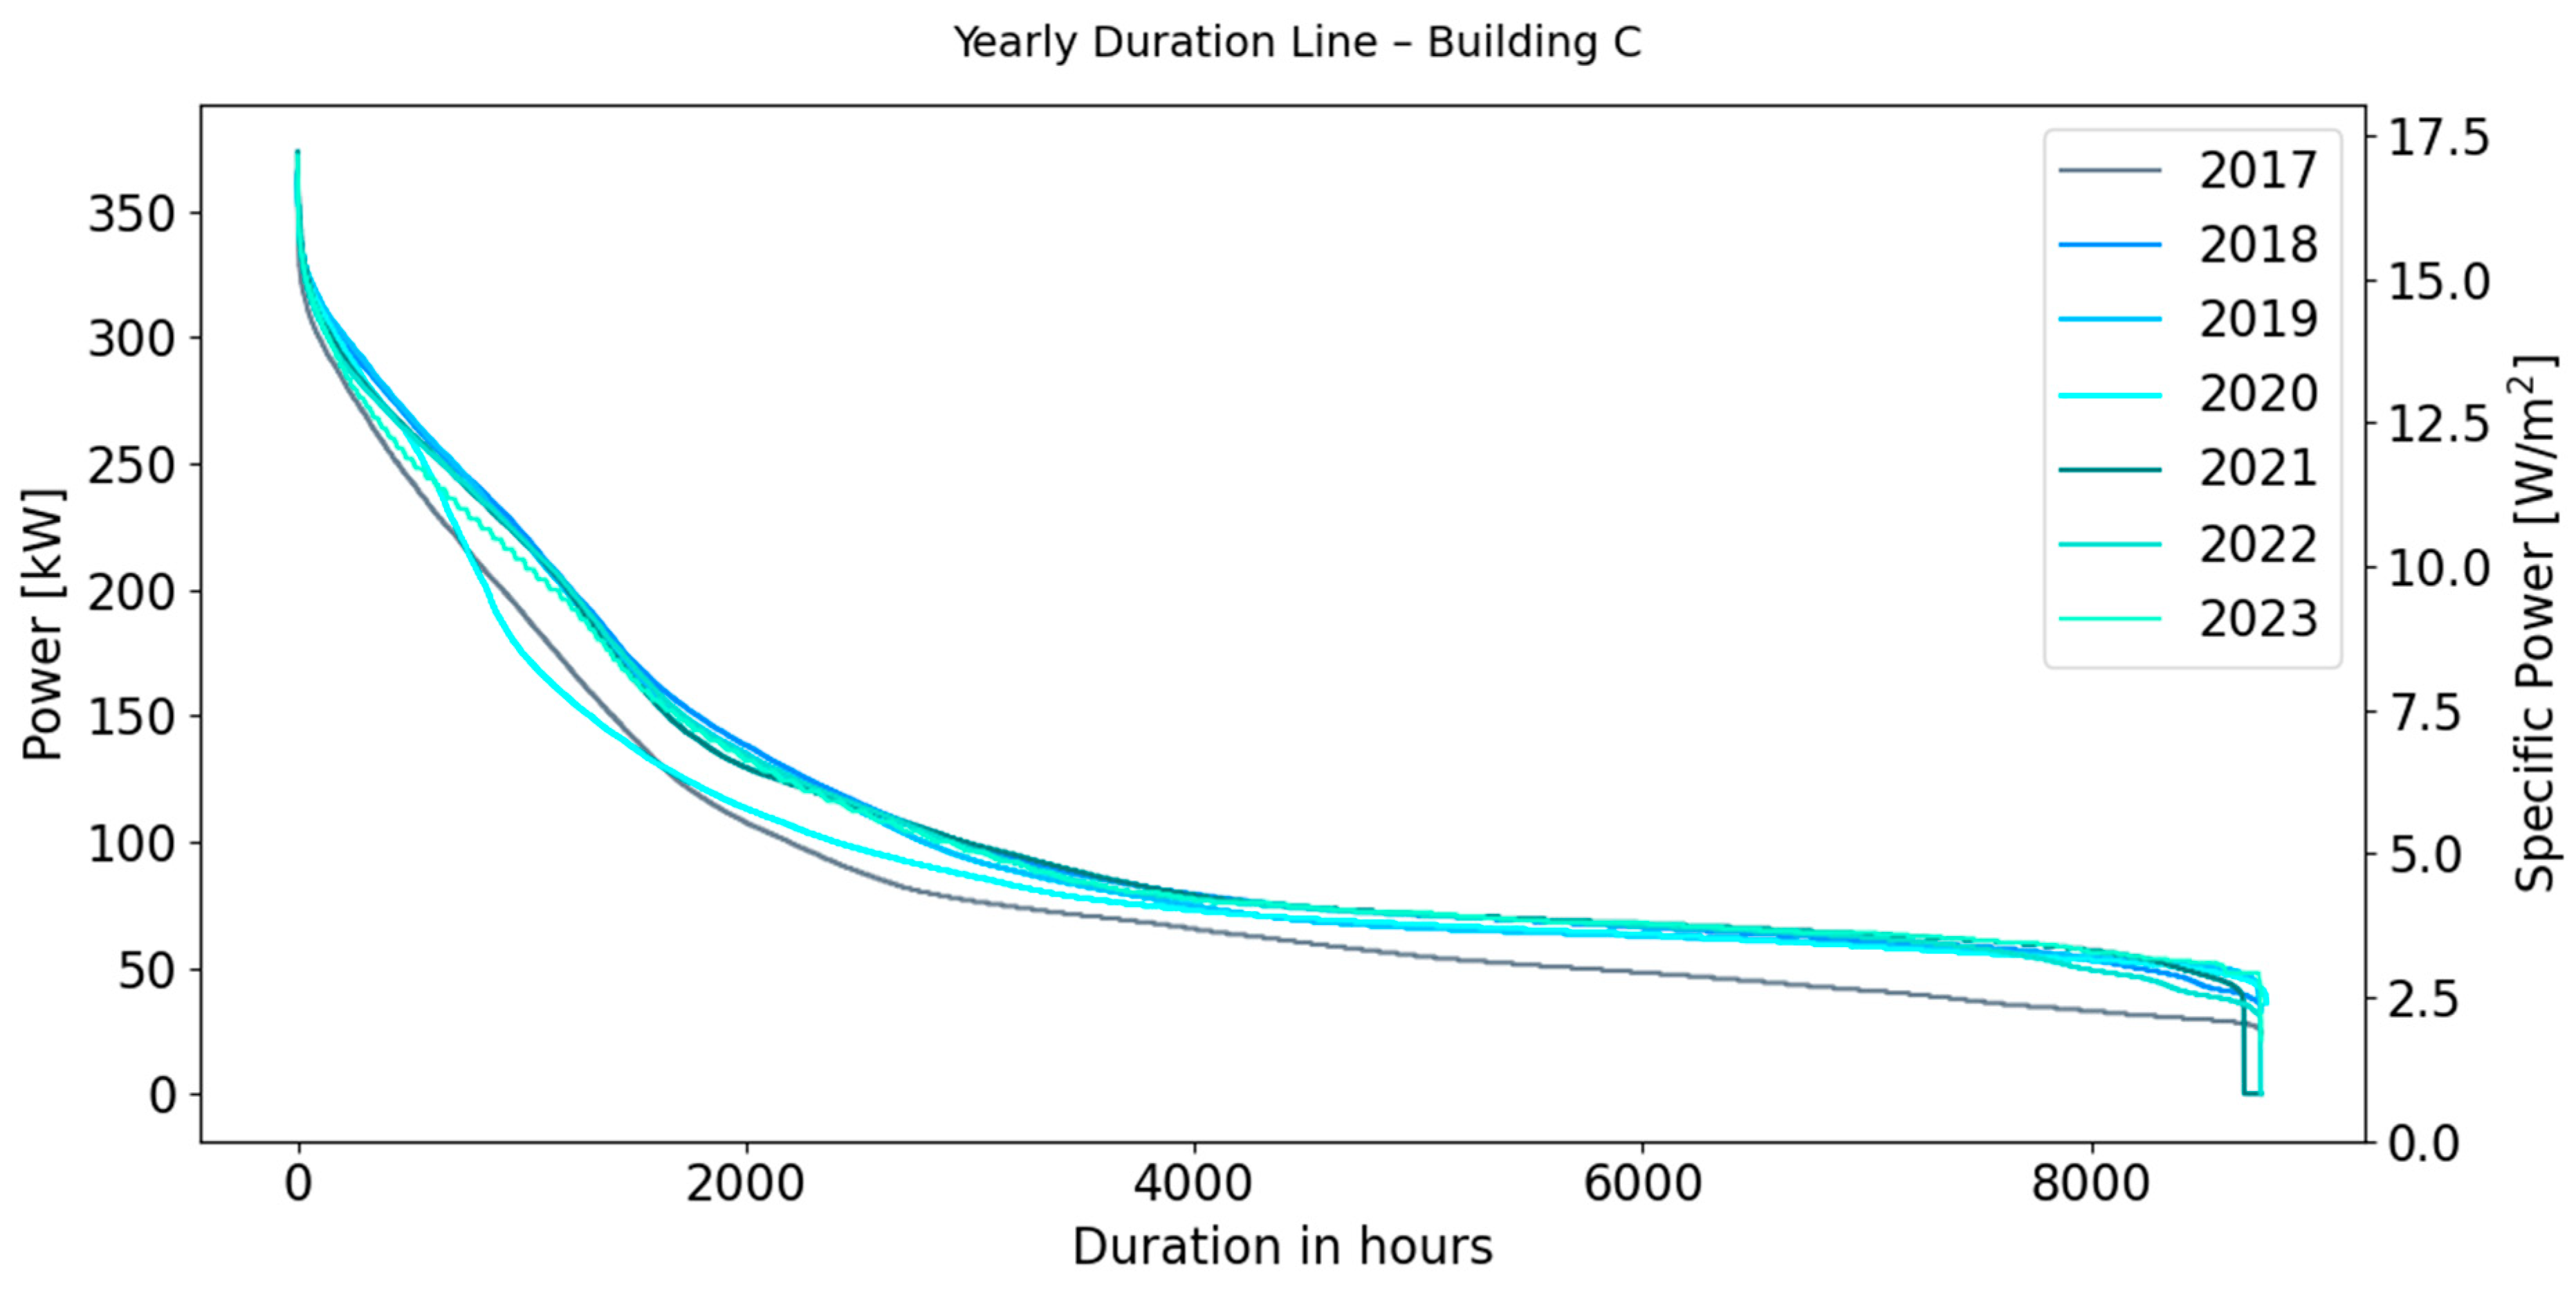
Figure 7 and
Figure 8 present the duration line of the power load over the year in buildings B and C, respectively, for the period between 2017 and 2023, with individual years overlaid in different colours. It serves to identify patterns, baseload, and peak requirements. The baseload consumption refers to the energy usage that occurs when the building is unoccupied. A comparison of the specific power reveals that both buildings exhibit a comparable level of specific baseload, with a range of 3.3 W/m
2 to 3.6 W/m
2. While this represents the lowest level of power demand, it accounts for approximately 50% of the yearly operational hours in the buildings analysed, as indicated by the flat portions of the duration lines.
As illustrated in
Figure 7, over the years, building B has exhibited a reduction in both peaks, but especially in the baseload, which is directly reflected in the overall reduction observed. Over the past seven years, a notable reduction of 50% in the annual baseload consumption has been observed. A remarkable reduction between 2019 and 2020 is observed, with two other important drops between the years of 2021 and 2023. These changes are related to the discontinuation of very inefficient mechanical ventilation in parts of the building, unnecessary due to the high air exchange rates, and the displacement of servers into another building.
Figure 8 illustrates that the consumption of electricity in Building C has remained relatively consistent throughout the course of the study period. There has been a slight increase in the base consumption levels, while the peak has decreased slightly. Furthermore, the data demonstrate a more stable consumption pattern over time for Building C, with the exception of 2017, when the sports hall underwent renovation, resulting in a notable reduction in baseload consumption. As a consequence of the lockdown measures implemented in response to the pandemic, in 2020, the duration line of both buildings presented a different pattern in comparison with the other years.
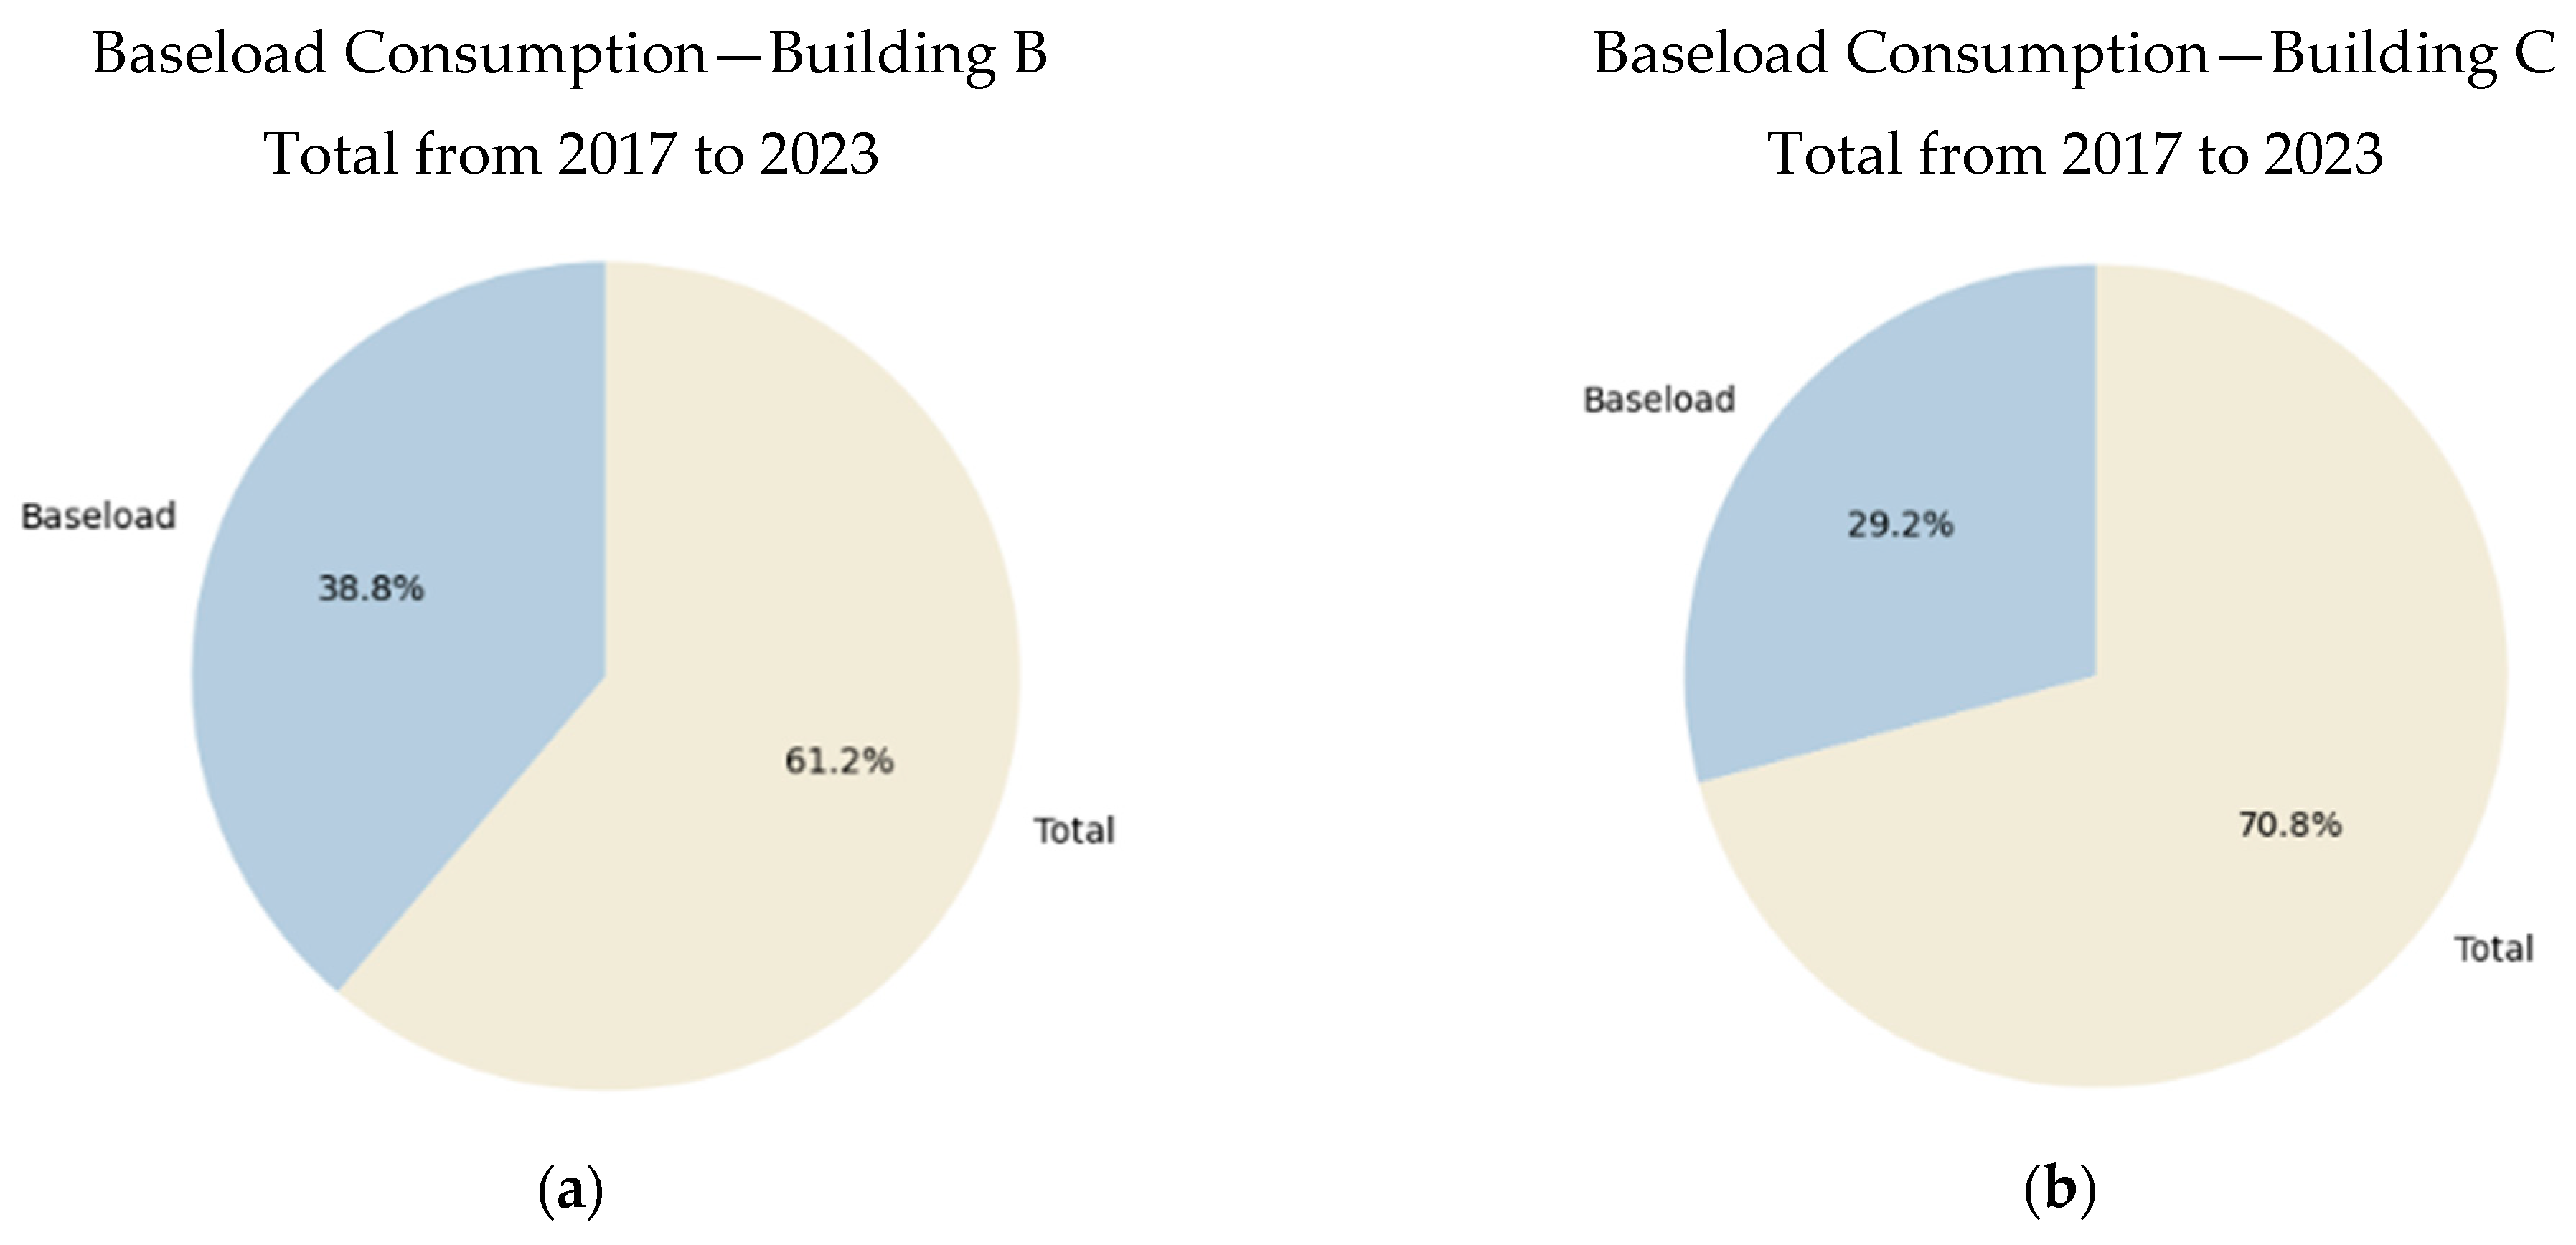
The consumption during unoccupied times in buildings B and C over the historical period analysed constitutes nearly one-third of the total energy usage over the analysed timeframe, as illustrated in
Figure 9, underscoring the potential for energy savings during these periods.
In order to analyse the distribution of electricity consumption in building B, within types of use, it is first necessary to identify all consumers connected to the main cabinet, given that it is a complex of different buildings with varied physical characteristics, technical appliances, and activities. It has been identified that the majority of the common areas within the main building are equipped with older and less efficient lighting systems. Furthermore, it has been determined that these common areas are frequently illuminated to a level exceeding the regulatory requirements. As they are not equipped with presence sensors, they operate for extended periods, representing an important part of the consumption.
The electrical consumption of building C is measured and broken down across various usage categories. Analysing electricity consumption according to these categories allows for a clearer understanding of which activities and systems are the major energy consumers. Larger energy-consuming systems are examined in detail to assess their performance and to identify specific opportunities for energy savings.
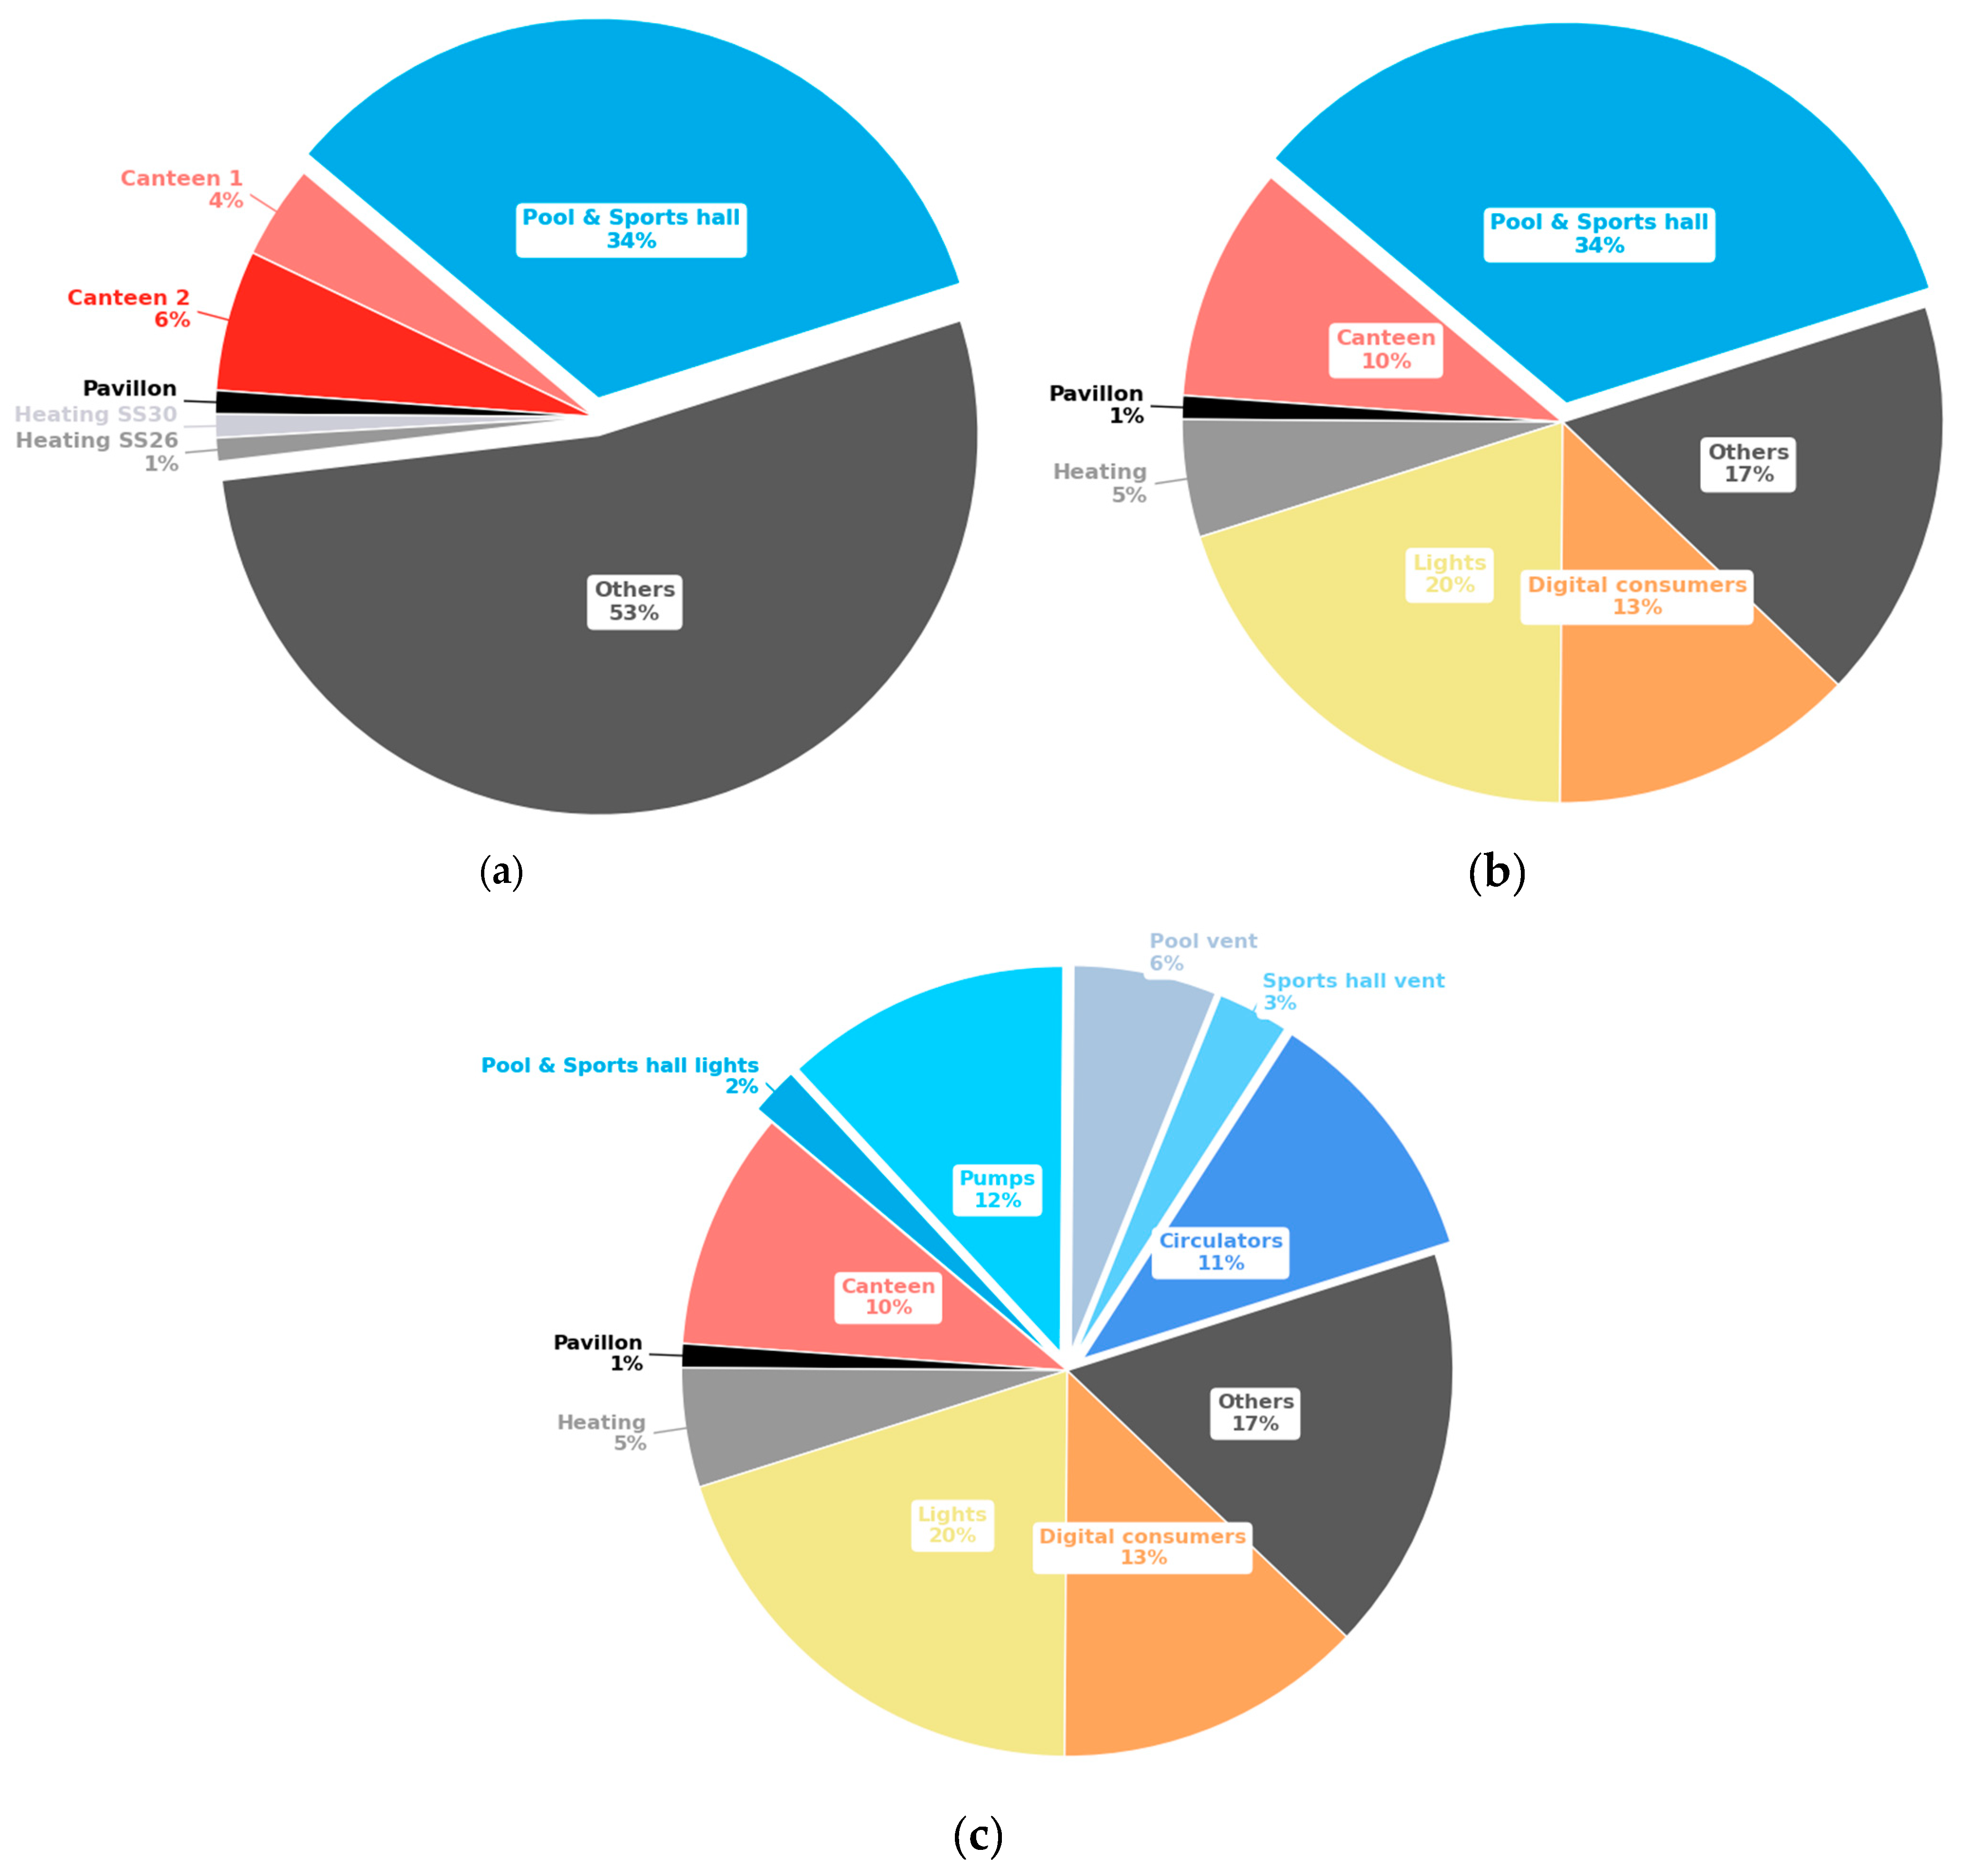
The plots presented in
Figure 10 represent the electricity consumption distribution of building C during the year of 2023. From the analysis of the main electrical cabinets in the building, six main users were chosen to be monitored during the ENERGE Project. The data from the monitoring were subtracted from the overall consumption obtained from the ABP monitoring system, and a first distribution was identified, as shown in
Figure 10a. The further distribution shown in
Figure 10b,c is the result of local temporary measurements of specific installations and estimations considering power capacity and working hours, starting from the analysis of the more than 50% of the overall consumption still not being identified in
Figure 10a.
From
Figure 10b, it can be observed that the lighting system accounts for a considerable proportion of the overall electricity consumption of the building, with digital devices representing a similarly significant contribution. In recent years, there has been a progressive upgrade of lighting to higher-efficiency solutions, which has resulted in a reduction in energy usage. However, the concurrent increase in digital device usage due to the adoption of connected classrooms counteracts these improvements, thereby limiting the observable impact of lighting upgrades on the overall consumption.
Building C has a separate building dedicated to the sports hall and the swimming pool. From the plots in
Figure 10, it is observed that it represents one-third of the entire energy consumption of the school, which is divided between a swimming pool, a sports court, cloakrooms, and showers.
Figure 10b shows that this activity is the larger consumer, and therefore, further measurements are required to analyse the performance of the sports hall and the swimming pool. The results presented in
Figure 10c show that the swimming pool pumps, as well as the circulators in this building represent the appliances with the largest electricity consumption.
The results of the energy audit guide the intervention strategy to save energy without compromising comfort, primarily by focusing on reduced operational modes during unoccupied periods. Building B focused on the savings related to the reduction of the baseload consumption and the lighting in common areas. For building C, the focus was set on the operation of the pumps at the swimming pool.
Energy Saving Measures
With regard to building B, the reduction in the baseload consumption is clearly noted from
Figure 7 and presented in
Table 6. Comparing the yearly consumption in 2023 to that in 2017 reveals a reduction of 620 MWh, with the baseload consumption decreasing by 454 MWh over the same period. This indicates that over 70% of the energy-saving measures implemented during this time primarily impacted periods when the building was unoccupied.
Over the years, various energy-saving measures have been implemented in this building. Lighting fixtures are gradually being upgraded to more efficient models, either when they fail or during renovations in specific areas where they must be replaced anyway. Additionally, since 2020, the ventilation systems in three auditoriums have been deactivated due their unnecessary due to the high air exchange rates of the rooms and highly inefficient operation.
Additionally, reductions in energy consumption were achieved through the optimisation of the lighting system in common areas. Corridor illuminance was measured, and redundant lighting fixtures were deactivated. Moreover, given that these systems lack presence detectors and typically operate for over two-thirds of the day, their operating hours were adjusted to align with actual usage needs. This optimisation alone resulted in a 5% reduction in the overall electricity consumption of the building.
The swimming pool in Building C operates for 10 months each year and is emptied during the summer holidays. This measure yields annual savings of approximately 20 MWh/a, equivalent to 2% of the total yearly electricity consumption of the school. As shown in the consumption distribution in
Figure 10, the pumps used to maintain water quality standards are among the largest energy consumers in the sports hall building.
The swimming pool operates with three pumps running continuously, with two pumps active during usage periods and one during times when the pool is not in use. This schedule is pre-set based on the working hours of the swimming pool, but does not always reflect actual usage patterns. For example, the system was found to be running during holiday weeks, disregarding reduced usage during these times. Additionally, the automated operation of the system means that it is not consistently monitored. Measurements taken during the energy audit phase revealed that the pumps were operating on a schedule that differed from the programmed settings, highlighting discrepancies in the intended versus actual operation of the system. Consequently, the intervention strategy aims to adjust its operation to better align with actual needs and to adopt reduced operational modes when the pool is not in use.
In periods when the swimming pool is not being used, there is less movement in the water, the air layer just above is saturated, and therefore, less evaporation happens. Hence, during these periods, ventilation can also be reduced to a minimum, just to guarantee the extraction of potential harmful components resulting from the water treatment and avoid condensation that could lead to a negative impact on the building structure. This measure also reduces heat losses. Consequently, adopting a reduced operational mode for the pumps when the swimming pool is not in use also allows for reducing ventilation.
The typical operation of the technical systems associated with the swimming pool comprises two distinct energy consumption profiles. The first operational profile is that of normal operation, which occurs during daytime hours when the infrastructure is in use. The second operational profile is that of the reduced mode, which is typically employed during nighttime hours. The typical power requirement of the pumps in normal operation is 17 kW, whereas reduced operation requires only 11 kW. With regard to ventilation, the typical consumption varies according to environmental conditions, with an average of approximately 7 kW during the day and 4 kW at night. During the holiday weeks distributed throughout the year, when the swimming pool is not in use, the standard operation of the aforementioned technical systems results in energy usage of 21 MWh/a for the pumps and 9 MWh/a for ventilation. By shifting to a reduced operational mode during this period, it is possible to decrease consumption to 16 MWh/a for the pumps and 6 MWh/a for ventilation, thereby achieving an annual energy saving of approximately 8 MWh/a. Furthermore, the monitoring of the consumption of the swimming pool also showed that, although there are no activities on Sunday, the consumption follows the same pattern as that on the weekdays. The correction of this deviation leads to further 4 MWh/a reduction in the electricity consumption of the building.


