Article

Determination and Sensitivity Analysis of Urban Waterlogging Driving Factors Based on Spatial Analysis Method

1
Beijing Climate Change Research and Talent Training Base, Beijing University of Civil Engineering and Architecture, Beijing 100044, China
2
Ecological and Municipal Infrastructure Planning & Design Institute (Beijing), CAUPD Beijing Planing & Design Consultants Ltd., Beijing 100044, China
*
Author to whom correspondence should be addressed.
Sustainability 2025, 17(6), 2785; https://doi.org/10.3390/su17062785
Submission received: 10 January 2025 / Revised: 25 February 2025 / Accepted: 5 March 2025 / Published: 20 March 2025

Abstract

:
The identification of waterlogging driving factors and the assessment of associated risks are of utmost importance to enable cities to sustain their development. Initially, this paper utilizes the kernel density estimation (KDE) technique to visually display the spatial distribution features of waterlogging points within the downtown region of City B. Employing a spatial analysis method, the examination through the application of Global Moran’s I reveals that the central urban area of City B exhibits a spatial clustering distribution. Moreover, nine influencing factors, including terrain characteristics, land cover features, and infrastructure construction aspects, are chosen as the elements that drive the continual occurrences of waterlogging due to rainstorms incidents. By applying the geographic detector (GD) and random forest regression (RF) models, an in-depth exploration into the agents leading to rainstorm waterlogging is conducted. The outcomes demonstrate that the surface impervious rate stands out as the primary factor. Additionally, under the geographic detector model, it has been verified that the integrated effect of two factors is more significant than that of a solitary factor, with the interaction between the surface impervious rate and community density having the most prominent influence on waterlogging situations within the investigated area. Finally, through the utilization of the random forest model, the sensitive areas inclined to experience waterlogging in the investigated area are demarcated. The findings of this research can offer valuable references for the management of urban rainstorm waterlogging as well as the sustainable development of cities.

1. Introduction

Against the backdrop of the accelerating global climate variation and the rapid pace of urban development, urban flood disasters are occurring frequently around the world, thereby giving birth to increasingly severe urban economic losses as well as casualties [1,2]. Urbanization has precipitated a substantial decline in natural green areas and a concomitant increase in impermeable surfaces. This transformation has notably impaired the soil’s capacity for rainwater infiltration [3]. In addition, the escalating frequency of extreme rainfall events, characterized by high volume and intensity in certain regions, has rendered surface water unable to drain promptly, thereby culminating in urban waterlogging [4,5]. Waterlogging is prone to induce serious urban economic losses and damages as well as environmental pollution problems [6,7].
In recent years, numerous cities around the world have suffered from relatively severe rainstorm waterlogging disasters. In 2017, the San Francisco Bay Area was afflicted by the California floods, which led to losses as high as USD 73 million. There was a severe rainstorm in Henan, China, in 2021, and a severe rainstorm in Beijing, China in 2023. Among these events, the number of people stricken by the rainstorm in Beijing reached 1.29 million.
Waterlogging disasters have imposed a substantial impact on the normal operation of cities [8]. Confronted with a severe ecological security situation and a basic need for sustainable development [9], an analysis of the causes of waterlogging has become an important part of urban water security preclusion and containment. Strengthening the resilience of cities to withstand and recover from rainstorm-induced waterlogging disasters has emerged as a pressing imperative in the field of urban expansion and erection. Numerous countries have put forward a multitude of strategies in response to urban rainstorm waterlogging disasters, including the establishment of low-impact development (LID) facilities [10], the construction of green infrastructure [11], the improvement of drainage systems [12], and the optimization of impervious surfaces [13]. Through the transformation of urban facilities, the setbacks engendered by urban waterlogging can be alleviated. The influencing factors of rainstorm waterlogging are quite complex, stemming from both natural factors and human factors. Natural factors mainly cover aspects such as meteorology and topography, while human factors are mainly reflected in two aspects, namely land use and weak drainage infrastructure [14]. Currently, drainage systems suffer from issues like sub-optimal design standards and inadequate maintenance [15,16]. Moreover, improper land use has expanded the impervious area, impairing the urban drainage capacity and resulting in a higher incidence of waterlogging [17,18].
In urban areas where rainstorm waterlogging disasters occur frequently, scholars have conducted investigations and demonstrations concerning the causative elements of waterlogging in cities due to rainstorms [19]. Gaitan et al. [20] have verified that elevation as well as slope significantly contribute to the phenomenon of urban rainstorm waterlogging. Moreover, the connection between land use and urban rainstorm waterlogging even exceeds that of elevation and slope. Many scholars have undertaken investigations into the laws manifested by urban impervious surfaces in different spaces when responding to urban waterlogging, and they found that the spatial distribution pattern exerts an influence on surface runoff and waterlogging disasters [21,22]. Yu et al. [23] employed the local spatial autocorrelation (LSA) and geographically weighted regression (GWR) methods to probe into the spatio-temporal correlation between impervious surfaces and the phenomenon of urban rainstorm waterlogging, finding that there were differences in waterlogging scenarios across different districts.
Previous studies have explored the effects exerted by various factors on the phenomenon of urban waterlogging during rainstorms and its spatial distribution patterns. However, due to the complexity of urban environmental characteristics, studying a single factor in isolation is insufficient to comprehensively explain the causes of urban waterlogging. From multiple perspectives, such as topographic features, land-cover characteristics, and infrastructure construction characteristics, this study probes into the driving factors of urban storm-induced waterlogging and their influences. The research findings provide a comprehensive understanding for urban sustainable development and help predict water-prone areas. Taking the central urban area of City B as an example, this study comprehensively adopts spatial analysis methods to examine the spatial distribution characteristics of waterlogging. Additionally, it uses Geodetector (GD) to evaluate the impacts of each driving factor and their interactions. Meanwhile, through the random forest (RF) model, it quantifies the degree of consequence of each specific factor, identifies the waterlogging-sensitive areas in the study region, provides a reference for urban waterlogging management, and promotes urban sustainable development.

2. Study Area and Datasets

2.1. Study Area

City B is positioned in the hinterland of the Wumeng Mountains in China. The located information of the study area is shown in Figure 1.It boasts a terrain sloping from west to east and its geomorphological types cover a multiplicity of forms including plateaus, mountains, hills, and basins. The river network in the principal urban section of City B is densely reticulated. City B belongs to the subtropical humid climate zone. Influenced by factors such as solar radiation and monsoon circulation, rainfall exhibits rather pronounced seasonal features. Generally, the precipitation from May to September constitutes about 80% of the annual precipitation, and the average annual rainfall is 897 mm. In recent years, the urbanization process in City B has accelerated. Obvious deficiencies exist in the construction of drainage facilities, and regional short-term extreme rainfall events have taken place. Against the backdrop of climate change and urbanization, urban waterlogging events have occurred with high frequency, inflicting heavy losses on the subsistence and estates of residents.

2.2. Datasets

The identification and analysis of the influencing factors pertaining to urban waterlogging necessitate the procurement of data from multiple sources. The initial data origins employed in this investigation include satellite remote sensing visuals, digital elevation maps, and urban waterlogging accumulation points, among others. The information on the acquisition sources of all the original data is presented in Table 1.

2.3. Data Processing

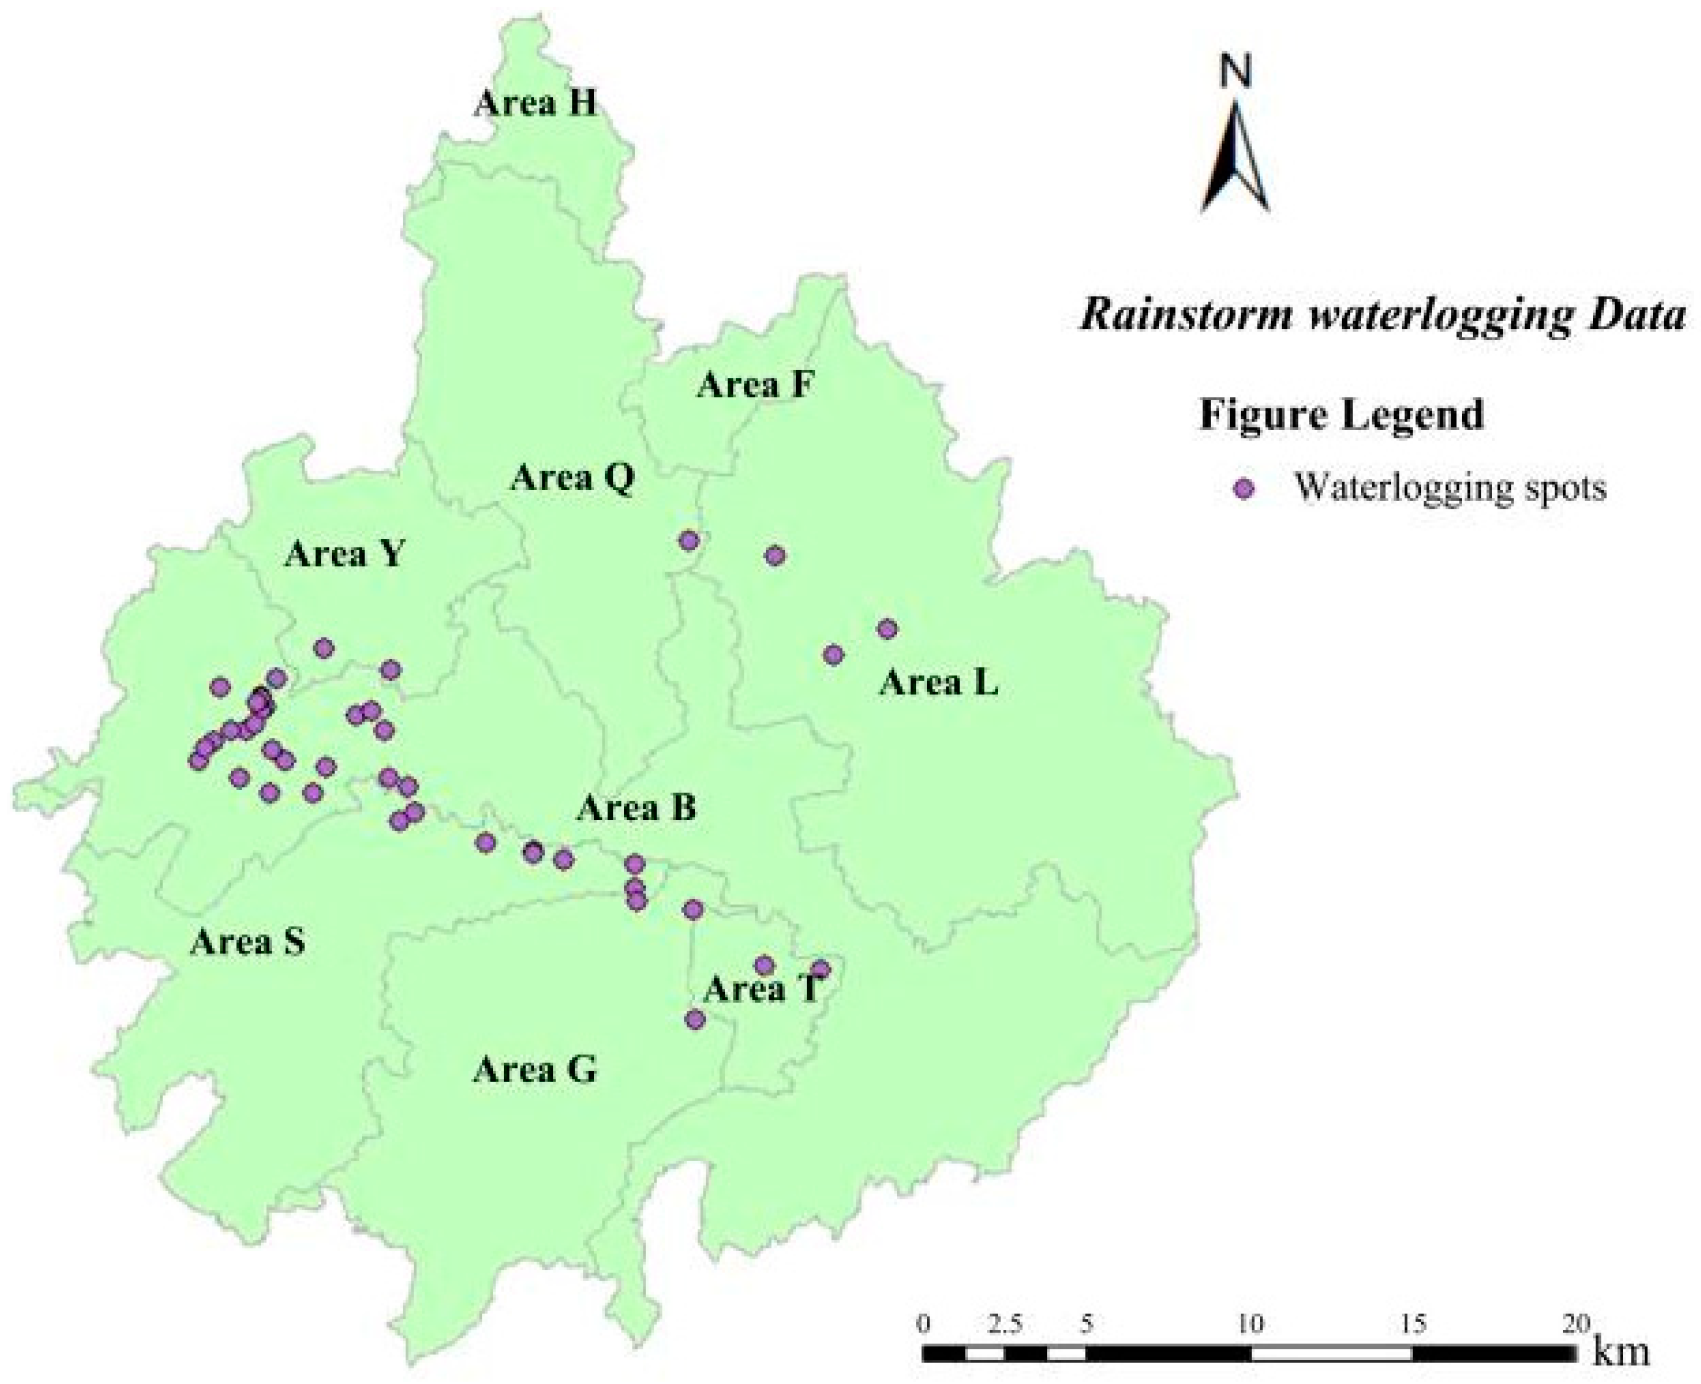
2.3.1. Rainstorm Waterlogging Data

In this research, records of waterlogging points containing accurate time and address information were collected. These records were sourced from various news media and water affairs departments in City B. Subsequently, ArcGIS 10.7 and Google Earth were employed to conduct the identification of the spatial coordinates of these regions stricken by rainstorm waterlogging and to create corresponding maps. Considering the existence of specific road intersections, community entrances, concrete buildings, and so on in the waterlogging areas, this study adopted the point-based form to represent the waterlogging points at specific positions. For example, in the case where the waterlogging area was a certain length of road, the geometric core location of that road was specified as the spatial coordinates of the waterlogging site. Over the timeframe spanning from 2015 to 2023, a total of 44 waterlogging points were found (Figure 2 for details).

2.3.2. Driving Factors of Rainstorm Waterlogging

A significant amount of research has shown that the agents driving the recurrent incidence of rainstorm waterlogging events can be summarized as alterations in land use and land cover during the urbanization process, spatial variations caused by topographic undulations, the degradation of the drainage function of river networks [25], and the insufficient drainage capacity of underground pipe networks [26,27]. Based on existing studies, this study has selected nine influencing factors, including elevation, slope, surface curvature, vegetation coverage, river density, surface impervious rate, community distribution density, road network density, and drainage pipe network density. These factors can be mainly divided into three categories, which are topographic characteristics, land cover characteristics, and infrastructure construction characteristics.
(1)
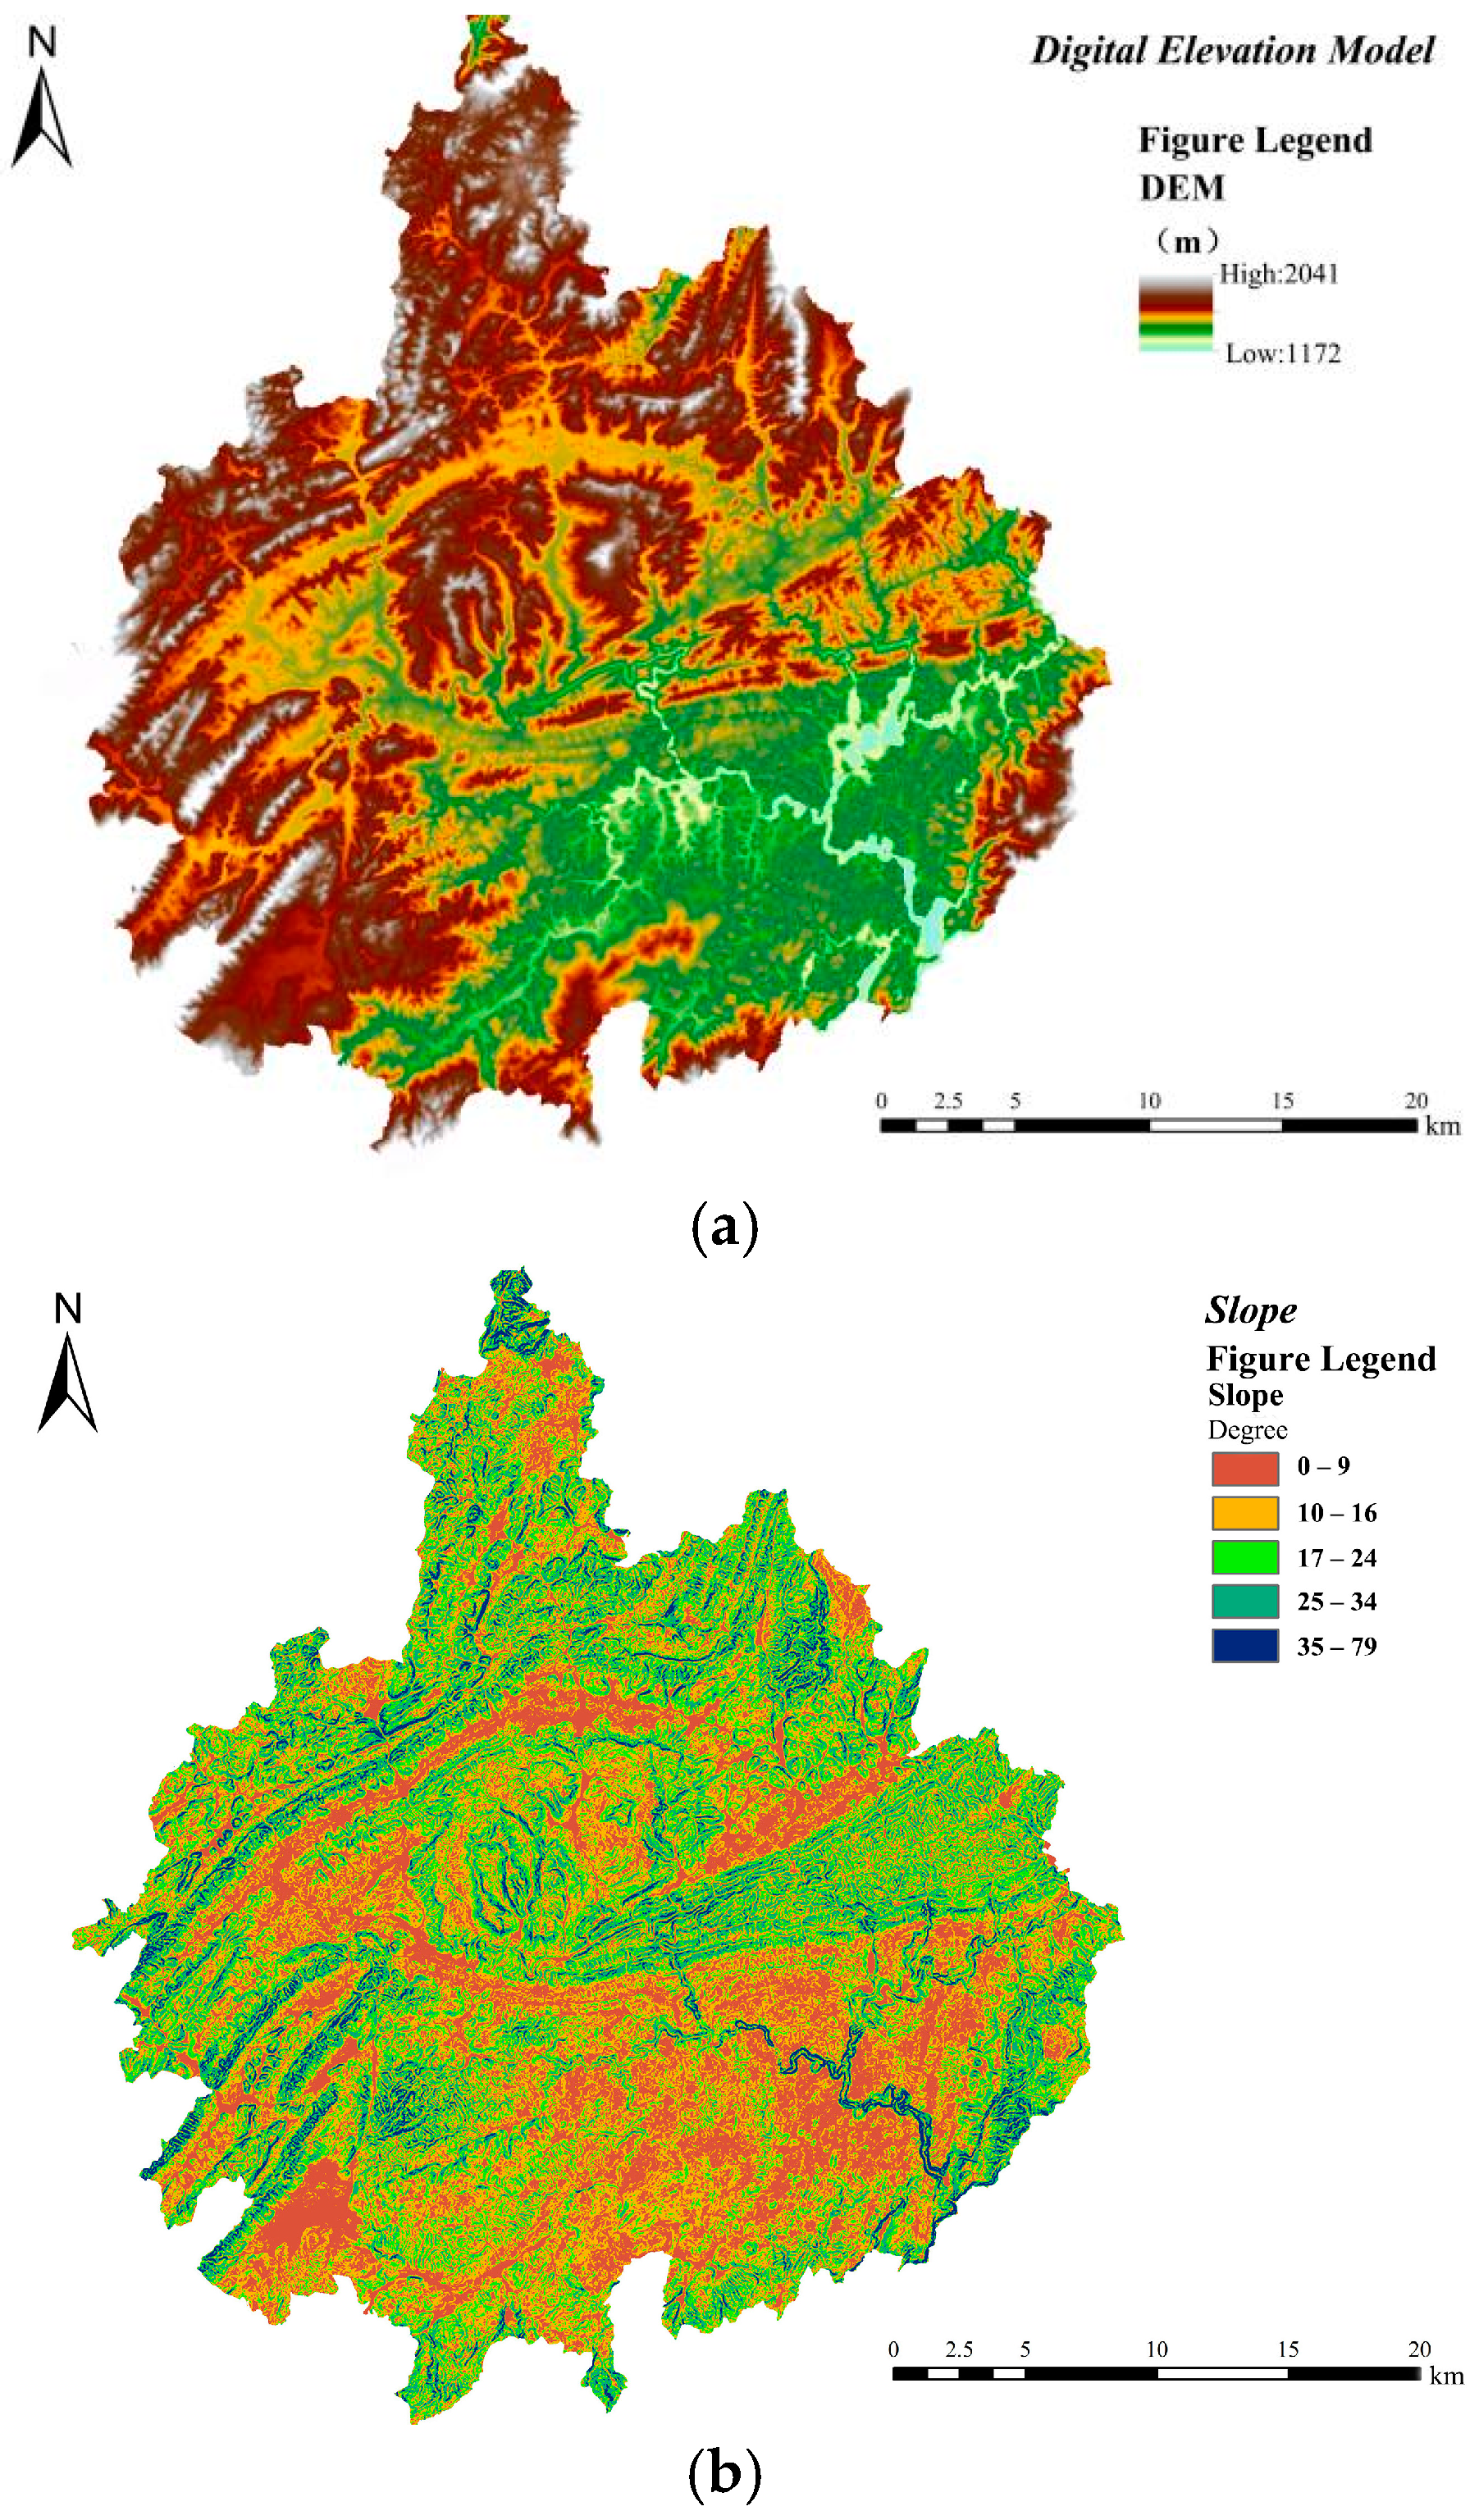
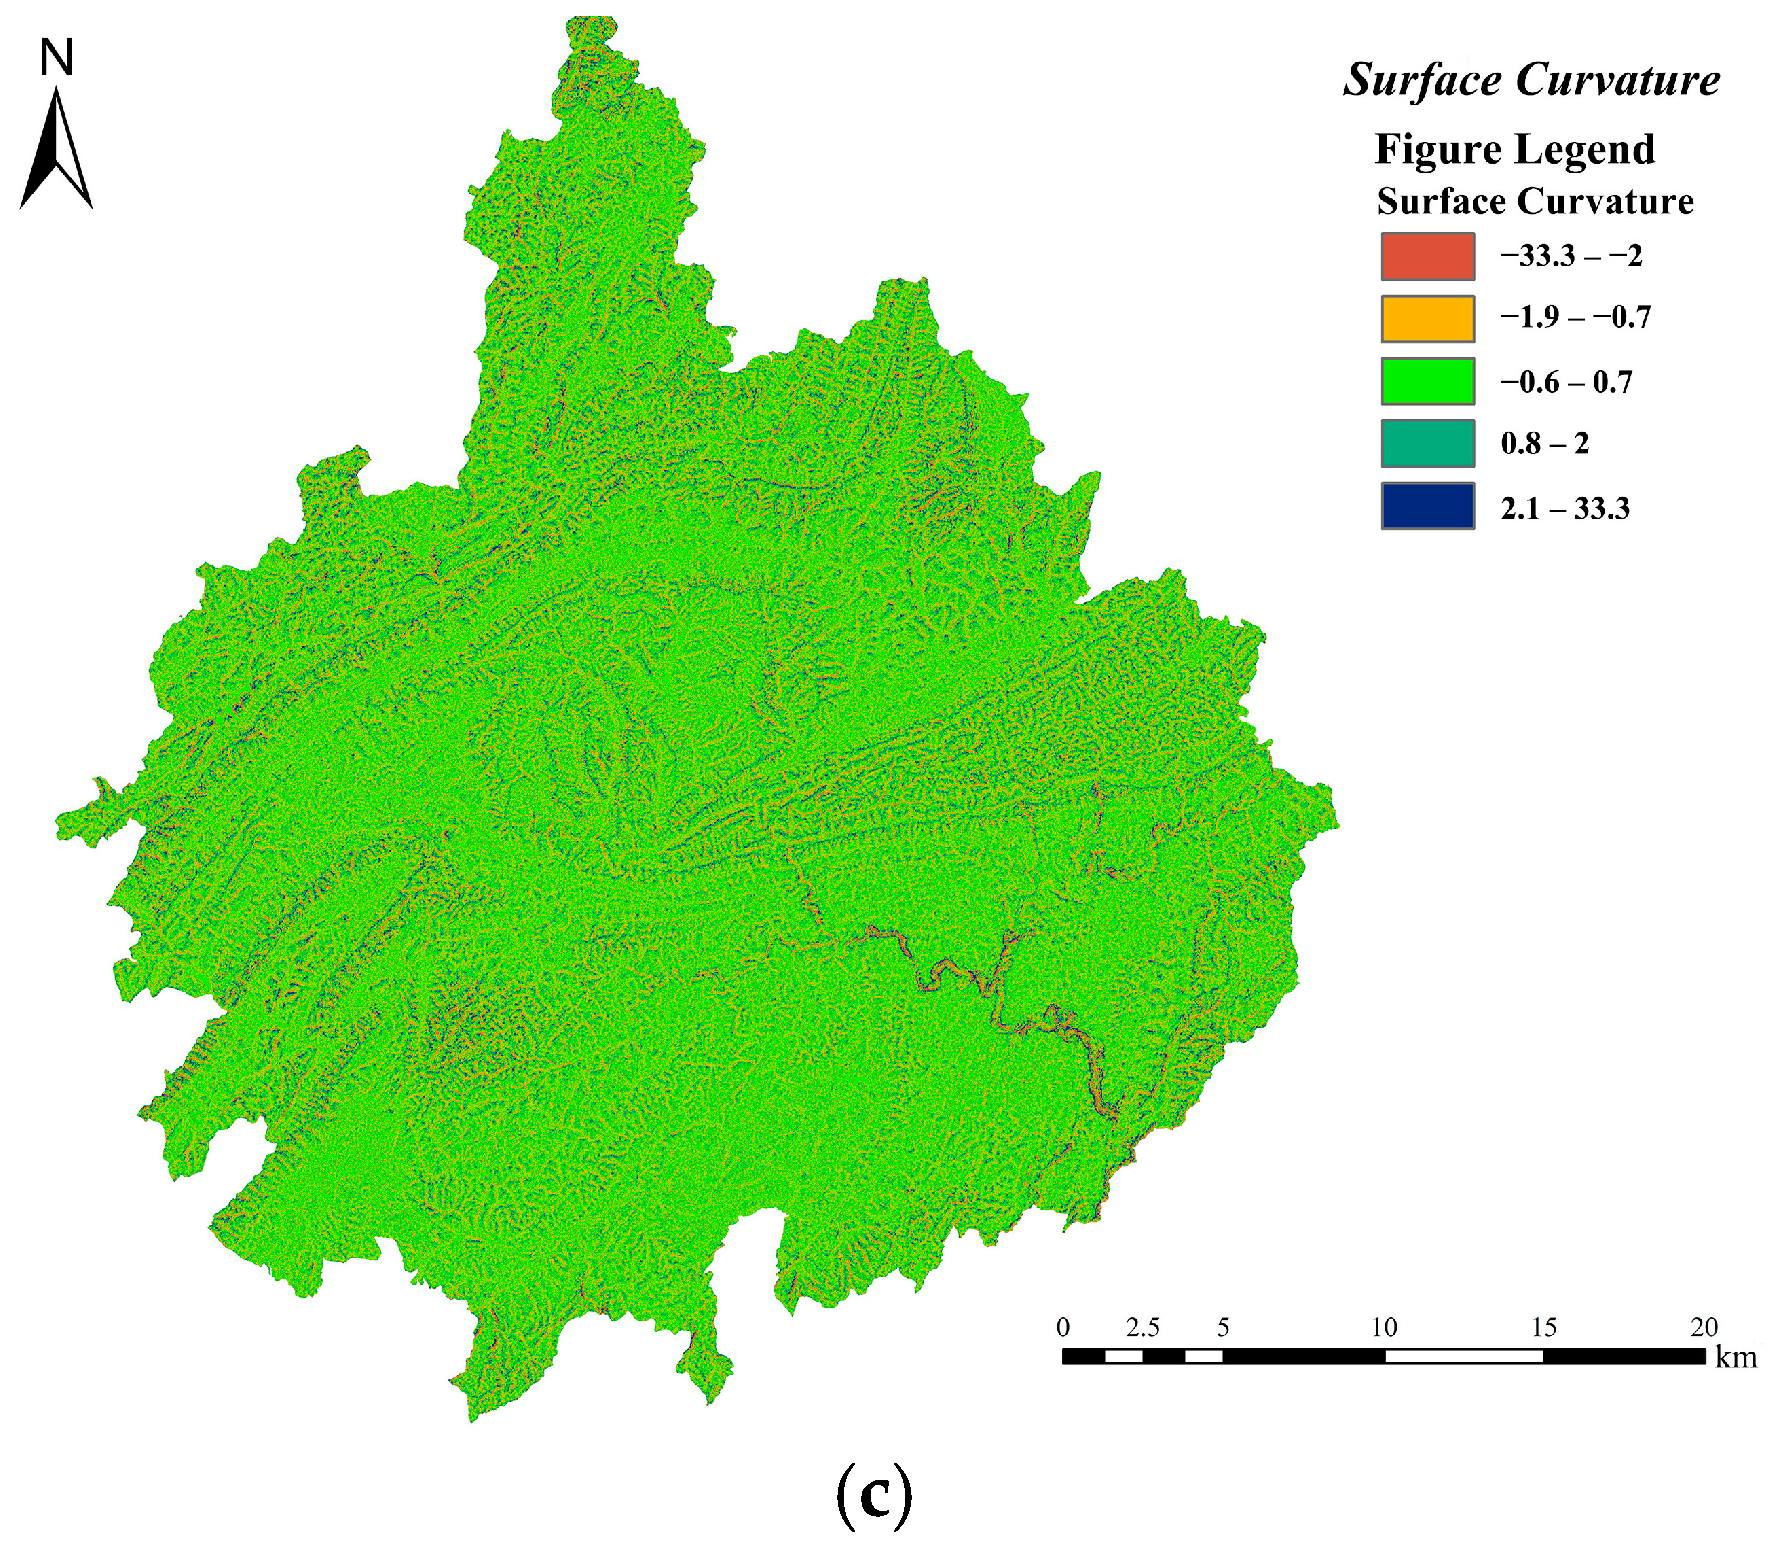
Topographic Characteristics
This study opted to select three influencing factors, namely elevation, slope, and surface curvature, which were regarded as the key elements for reflecting the topographic and geomorphic properties of the investigated area. In the process of the formation of surface runoff by rainwater, it has a close correlation with the terrain. Typically, rainstorm waterlogging episodes are more inclined to occur in areas characterized by relatively low altitude and gentle slopes. Regarding the relevant processing results, reference can be made to Figure 3.
(2)
Land Cover Characteristics
Three elements, namely vegetation coverage, river network density, and surface impervious rate, were chosen to represent the covering layer of the landmass status of the research area. The vegetation coverage is denoted by the normalized difference vegetation index (NDVI). By virtue of the ArcGIS 10.7 resampling method and relying on the calculation of the red band as well as the near-infrared band of remote sensing images, the vegetation coverage within the research area was acquired. The calculation formula of the normalized difference vegetation index is presented in Equation (1). River network density is a commonly used structural indicator for depicting the water storage capacity of rivers, and its calculation formula is exhibited in Equation (2). The surface impervious rate denotes the proportion of urban surface impervious coverings, including buildings, roads, and artificial pavements, which is closely related to the drainage capacity of the urban surface. Regarding the distribution situation of vegetation coverage, river network density, and surface impervious rate, reference can be made to Figure 4.
N D V I = N I R R N I R + R
D r = L F
In these equations, N I R is the surface reflectance of the near-infrared band, R is the surface reflectance of the red band, D r is the river density in m/km2, L is the river length in km, and F is the acreage in km2.
(3)
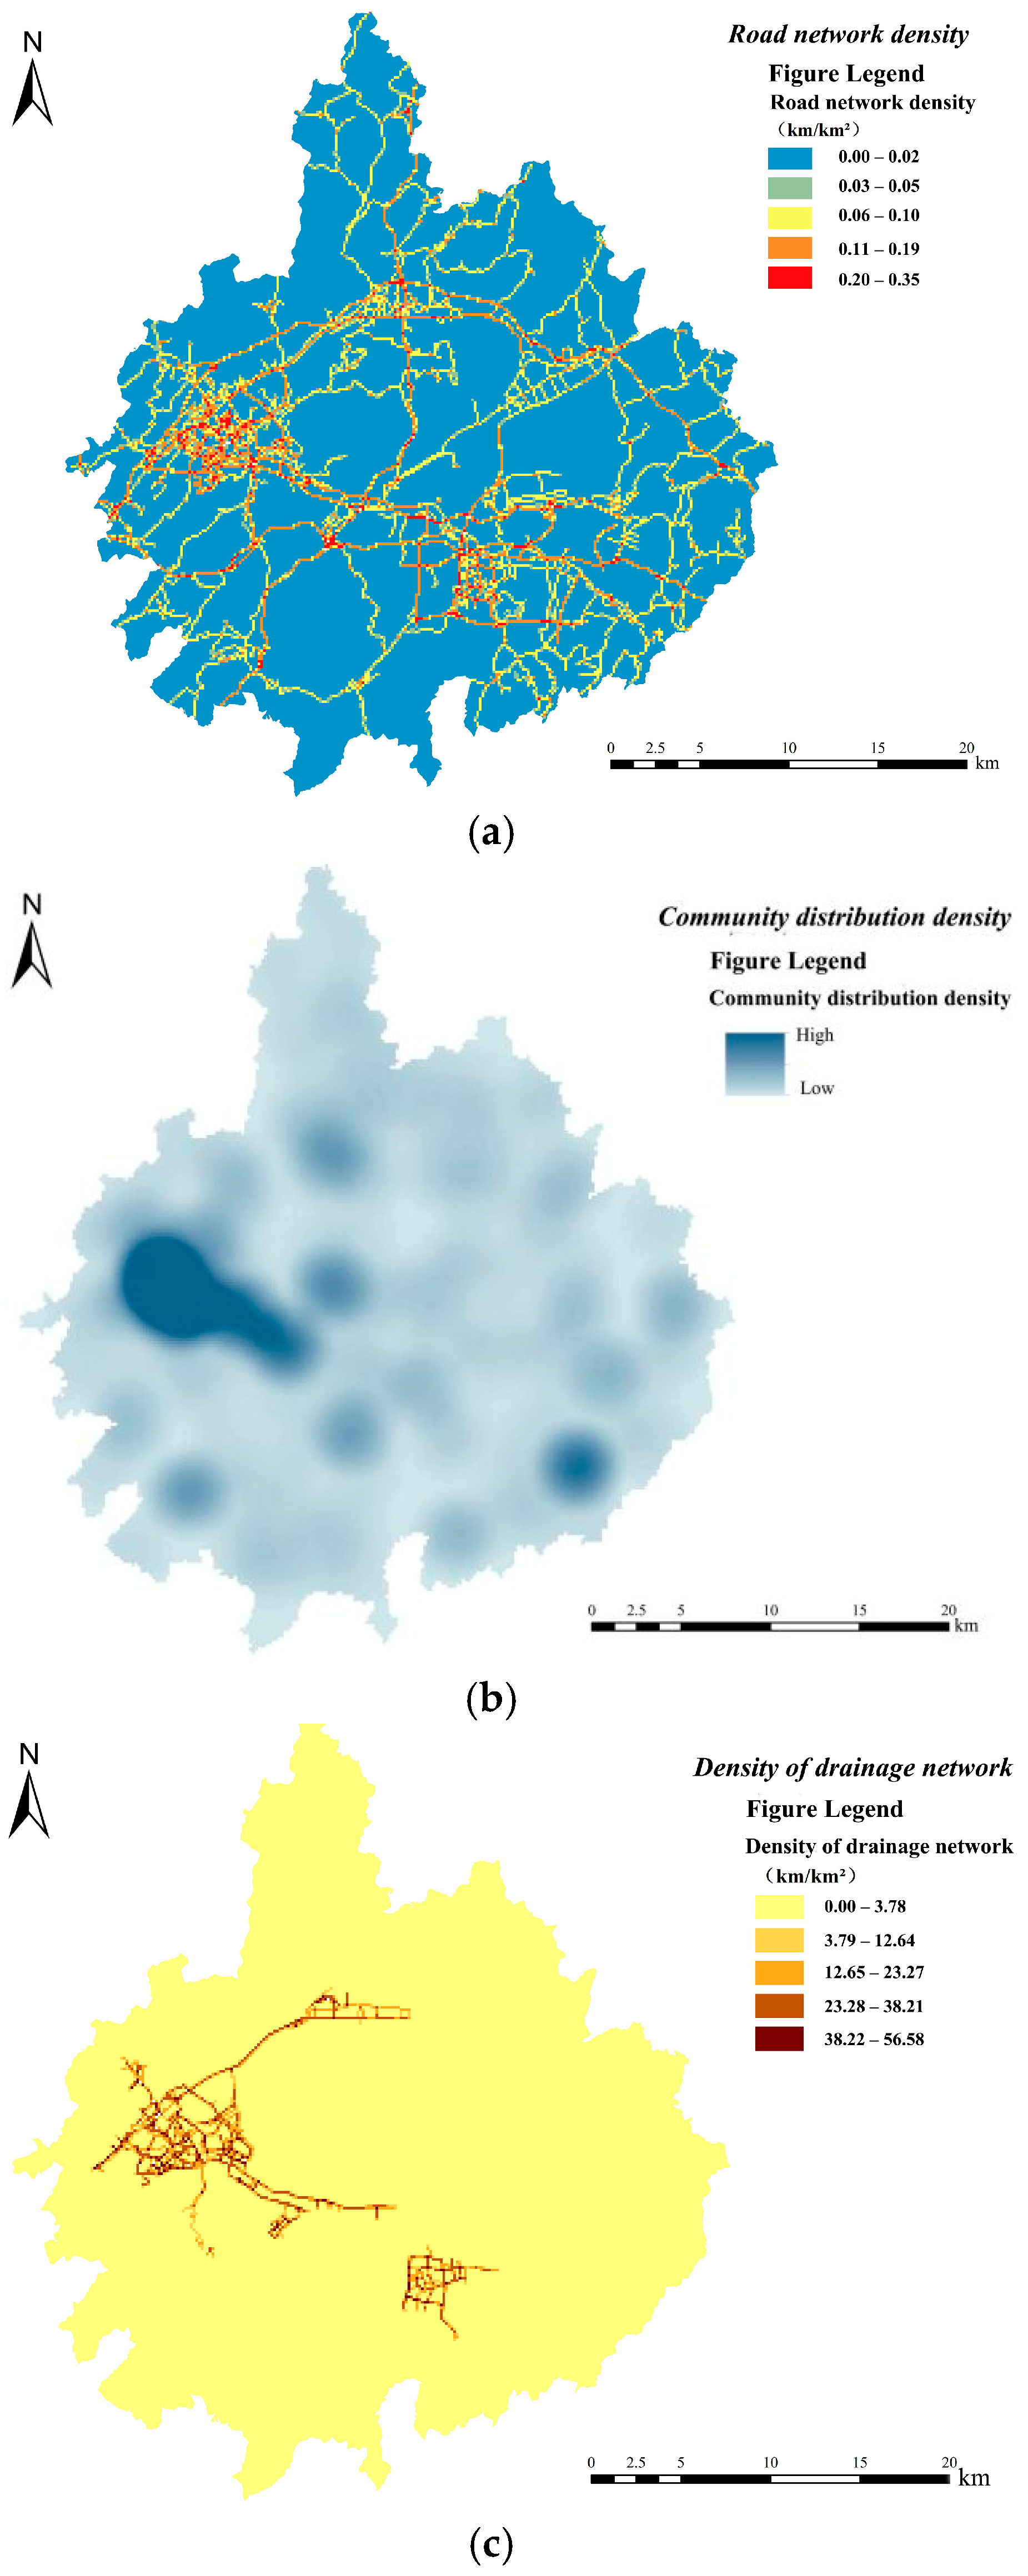
Infrastructure Construction Characteristics
The following three elements, namely road network density, community distribution density, and drainage pipe network density, were chosen to characterize the features of infrastructure construction within the research area. To a certain extent, the regional road network density as well as the community density can serve to represent the level of infrastructure construction and the degree of economic development in the region, which in turn exerts an influence on the occurrence of urban waterlogging incidents. The compactness within the drainage pipe network is capable of reflecting the construction status of urban drainage pipe networks and the drainage capacity of the city, and it maintains a close connection with the occurrence of urban waterlogging incidents. Both the factors of road network density and that of drainage pipe network density are acquired through the calculation of the lengths of roads or drainage pipe networks within the unit grid area sized at 150 m × 150 m. The relevant information regarding communities or villages in the research area was subjected to vectorization processing, thereby obtaining the vector point data of communities or villages. Subsequently, the community distribution density of the research area was computed by employing the kernel density analysis method. Regarding the calculation results of road network density, community distribution density, and drainage pipe network density, reference can be made to Figure 5.

3. Analysis Methods

The waterlogging and ponding triggered by rainstorms display a diffusive characteristic. As a result, analyzing the relationship among the waterlogging characteristics in adjacent areas holds great significance for delving into the spatial orientation patterns of waterlogging. The spatial correlation analysis method is capable of attaining this objective and can be employed to analyze the waterlogging characteristics within adjacent areas. The spatial correlation analysis method mainly consists of two types, which are the global spatial autocorrelation (GSA) analysis method, which approaches from an overall perspective, and the local spatial autocorrelation (LSA) analysis method, which proceeds from a local perspective. Through the visualization of the extent of spatial gathering of rainstorm waterlogging, we are able to comprehend the spatial dependence of waterlogging and ponding points and their diffusion characteristics. In this investigation, the research area was parceled into grids with a grid size of 150 m. Upon the assignment of the results of the kernel density analysis of waterlogging and ponding points to the grids of the research area, the spatial autocorrelation analysis method was subsequently utilized to estimate the spatial dependency pattern of waterlogging and ponding points.

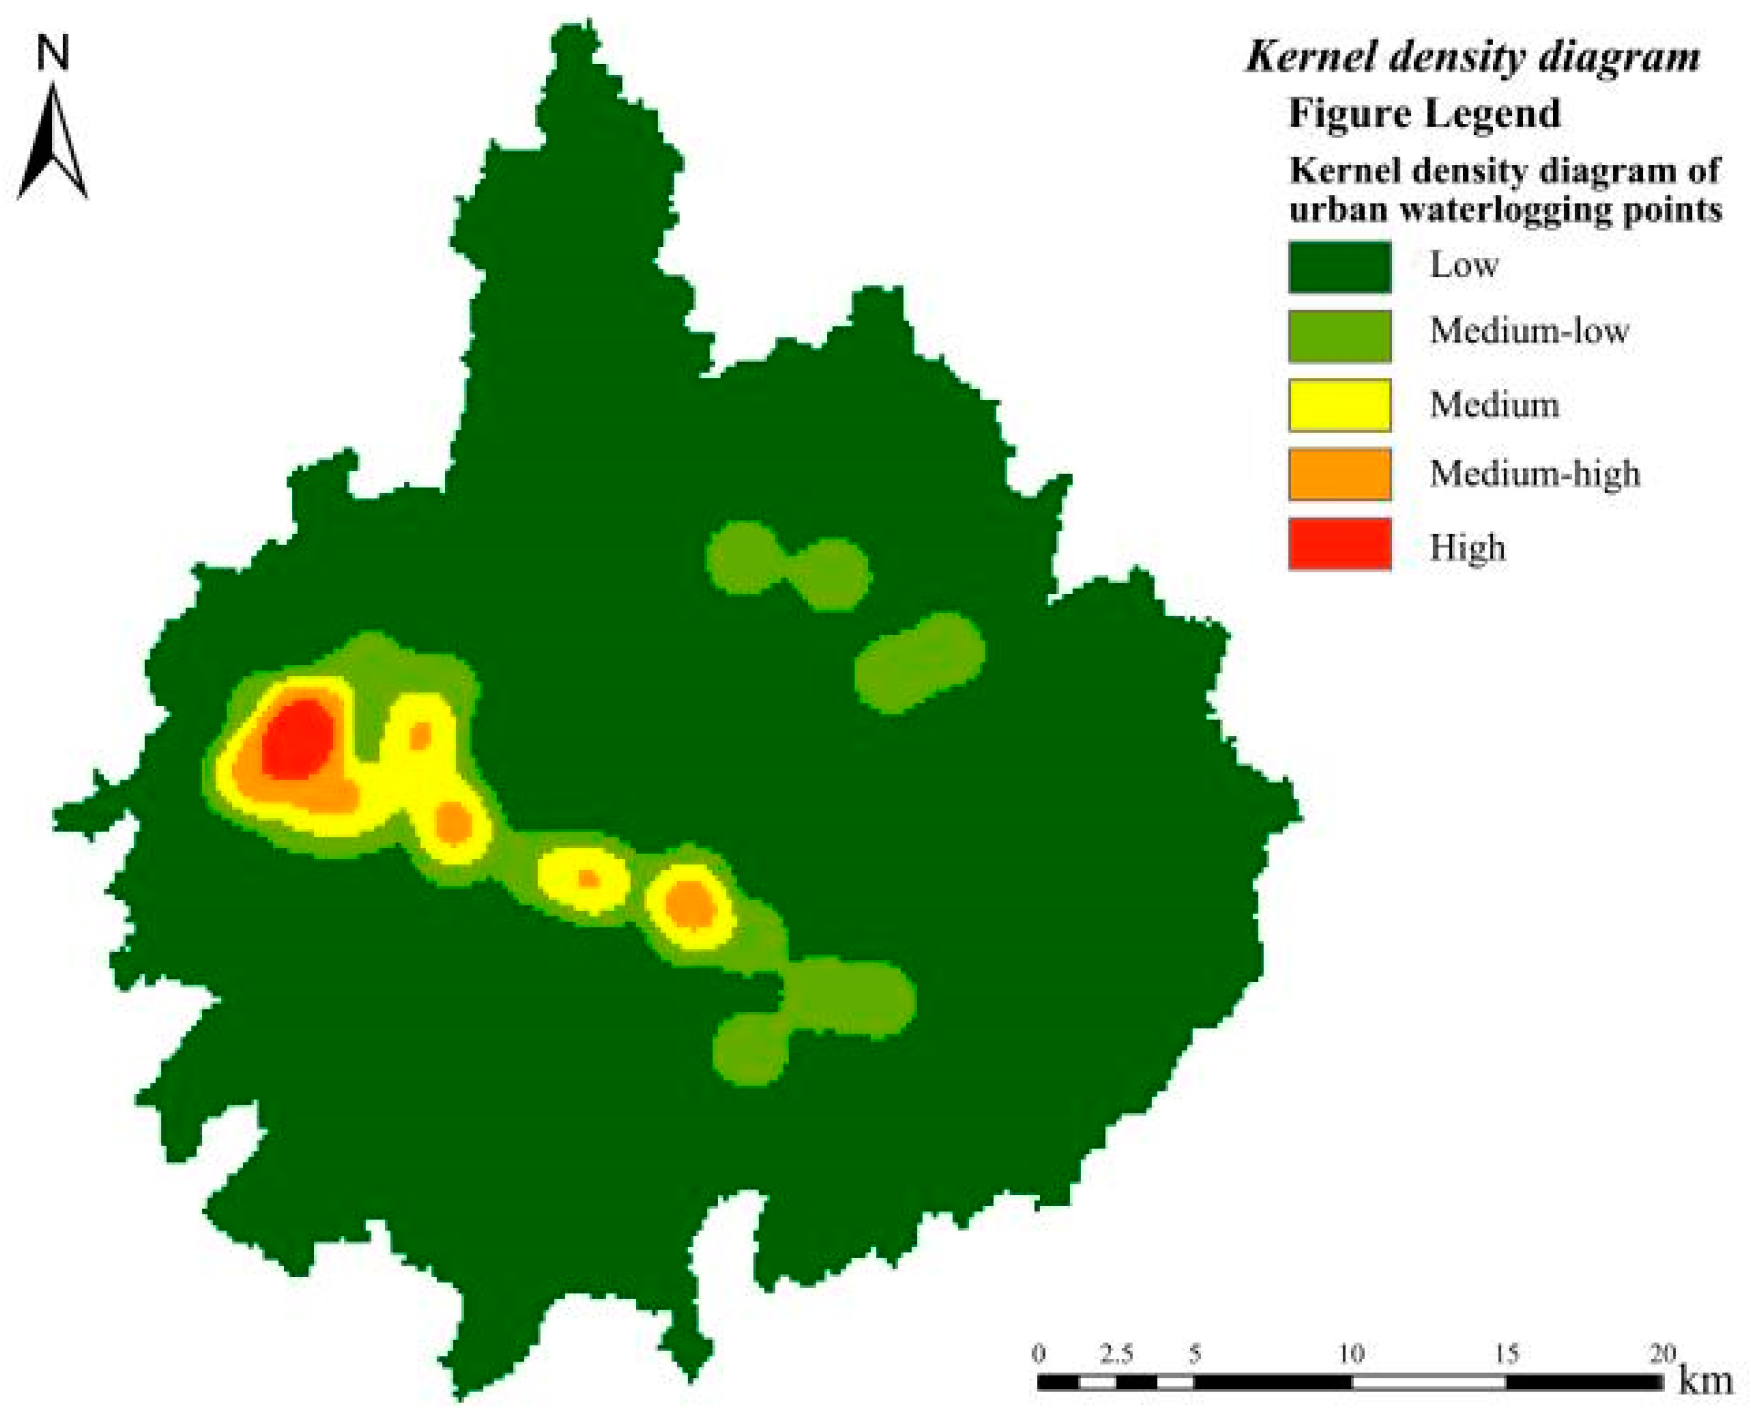
3.1. Kernel Density Estimation

Given that flood-prone points are incapable of intuitively depicting the situation of rainstorm waterlogging, the kernel density analysis method is consequently employed to obtain the kernel density values of flood-prone points, thereby being capable of effectively representing the situation of rainstorm waterlogging in adjacent areas [28]. The kernel density analysis method is capable of analyzing the aggregation of indicator data and its distribution in spatial areas. It primarily depends on the statistical analysis of the sample data of indicators for the accomplishment of the calculation regarding the surface density of the indicators and combines the distance decay function to examine the variations in the surface density. The calculation formula is shown in Equation (3).
f ( x ) = 1 n h i = 1 n K ( x x i h )
In this equation, f ( x ) is the estimated kernel density of the central grid pixel x , h is the bandwidth, n is the number of waterlogging points within the search range, K is kernel function, and x x i is the distance from the center raster pixel x of the search range to the flood prone raster pixel x i .

3.2. Spatial Autocorrelation Analysis Method

3.2.1. Global Spatial Autocorrelation Analysis

The Global Moran’s I was employed to perform the global spatial autocorrelation (GSA) analysis on the waterlogging and ponding points in every river basin of the investigated area. The Global Moran’s I features a value range of [−1, 1]. A value closer to 1 indicates a more evident spatial aggregation of the waterlogging and ponding points, while a value approaching −1 implies a more distinct spatial disparity of those points. The specific calculation method of the Global Moran’s I is shown in Equation (4) [29].
I = i = 1 n j = 1 n w i j ( y i y ¯ ) ( y j y ¯ ) S 2 ( i j w i j )
In the equation, n is the quantity of grid cells referenced by i and j in the research area, y i is the kernel density of waterlogging and ponding points in grid cell i , y j is the kernel density of waterlogging and ponding points in grid cell j , and y ¯ is the average magnitude of the kernel density of waterlogging and ponding points. w i j is the constituent elements of the weight matrix w ; it represents the spatial weight of grid cell i and grid cell j . If grid cell i and grid cell j are adjacent to each other, the value is 1; otherwise, it is 0. S 2 is the discrete variance of y i .
The calculation method of S 2 is shown in Equation (5).
S 2 = 1 n i = 1 n ( y i y ¯ ) 2
The value z is employed to gauge the significance of the Global Moran’s I, with its calculation being carried out based on Equation (6) [30].
z = 1 E ( I ) V a r ( I )
In this equation, E ( I ) is the mathematical expectation of I based on the assumption of spatial random distribution and V a r ( I ) is the magnitude of the variance of I .

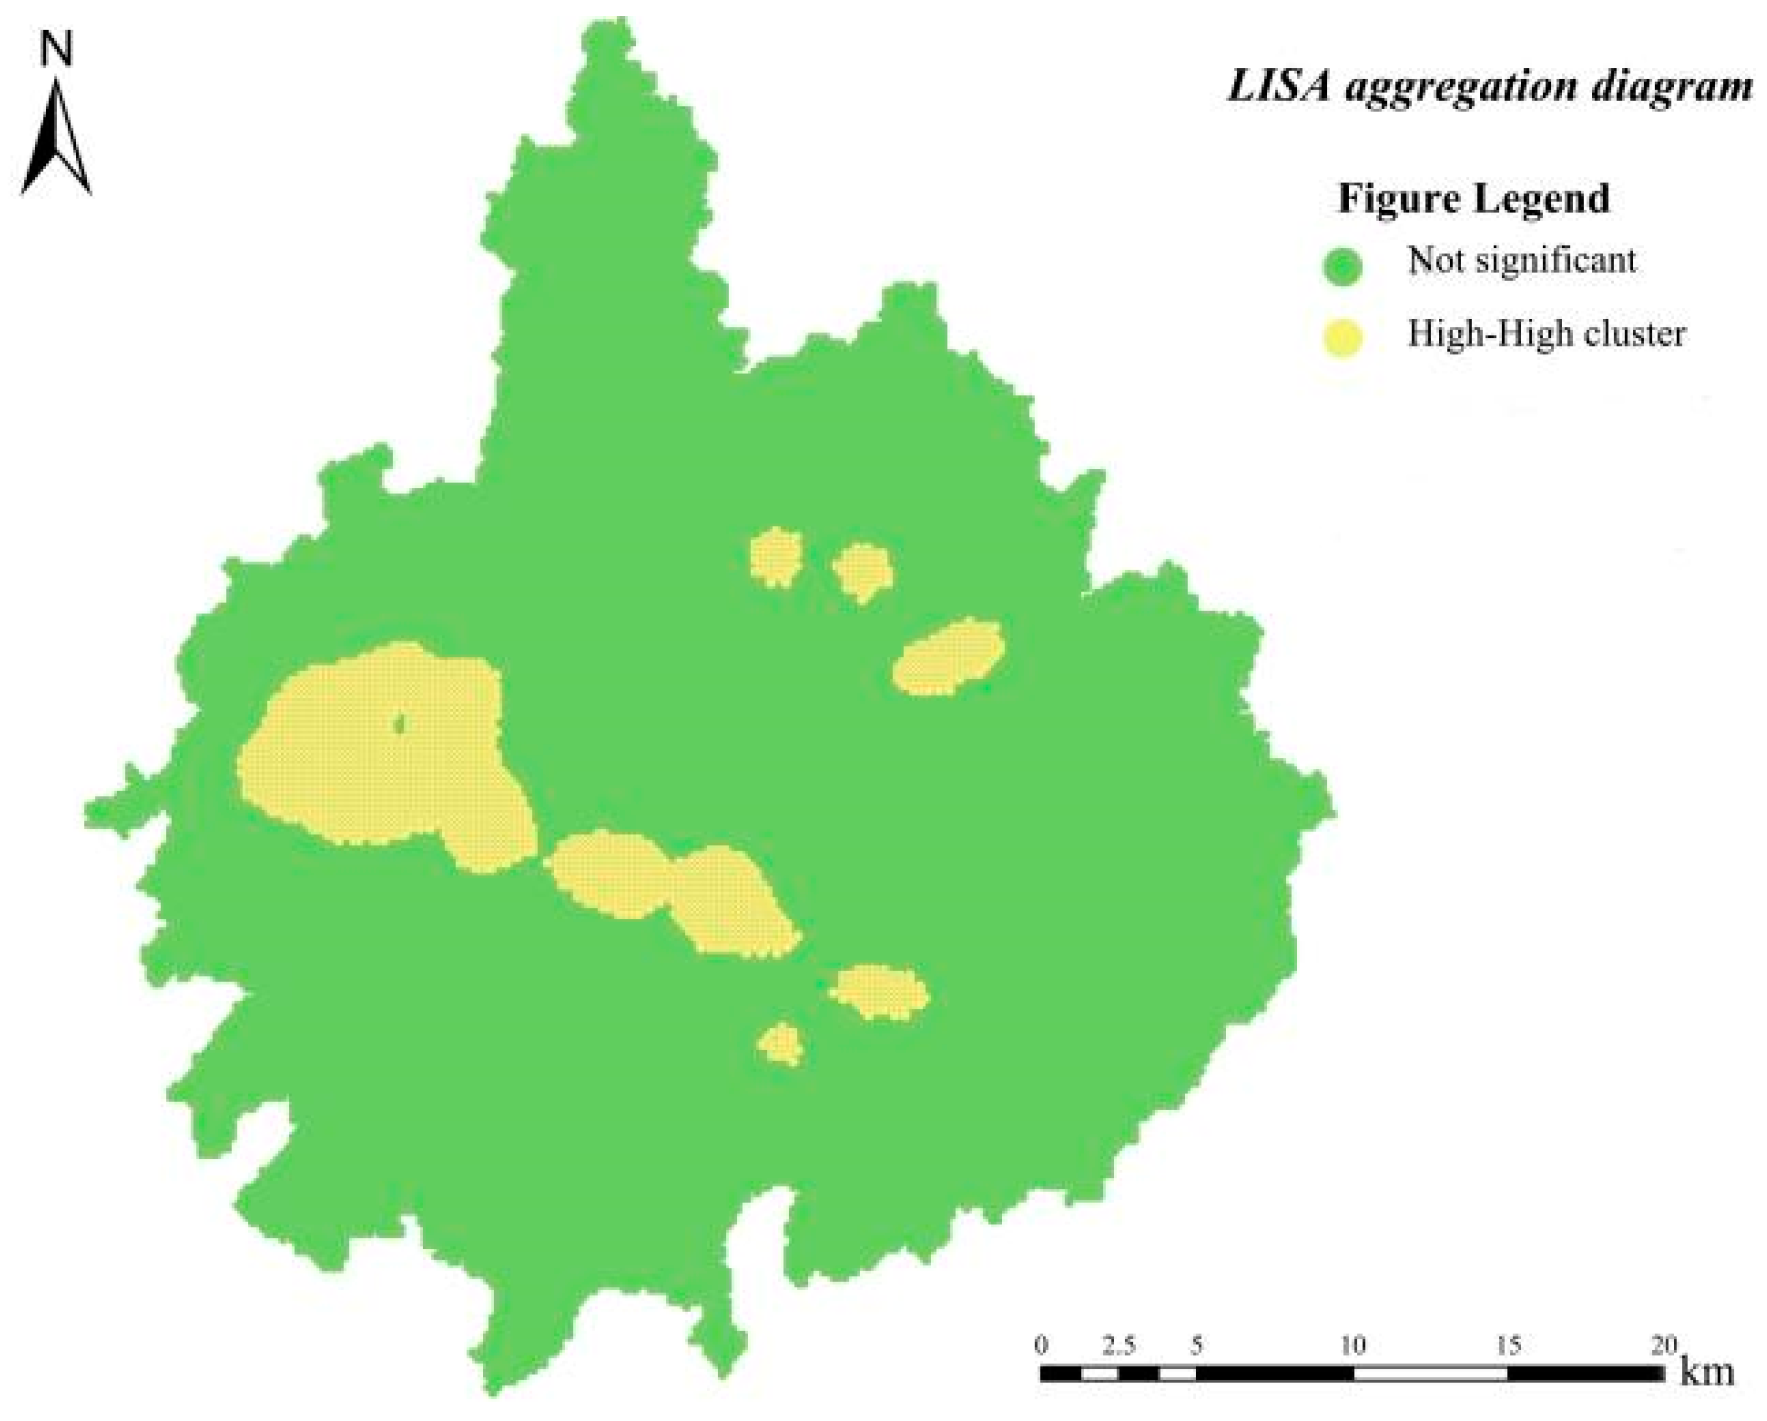
3.2.2. Local Spatial Autocorrelation Analysis

The local spatial autocorrelation method (LSA) was employed to estimate the changes in the autocorrelation degree of waterlogging and ponding points within the geographical space. The Local Moran’s I was adopted as the local index of spatial association (LISA) to signify the spatial correlation relationships among different local areas of the research area. The formula for its calculation is exhibited in Equation (7) [29].
I i = ( y i y ¯ ) j = 1 m w i j ( y j y ¯ ) S 2
In this equation, I i is the Local Moran’s I and m is the aggregate of the neighboring units of spatial unit i .
The spatial clustering characteristics need to be analyzed by combining the values of I i and z . z is shown in Equation (8).
z i = I i E I i V A R I i
In this equation, E ( I i ) is the mathematical expectation of I i based on the assumption of spatial random distribution and V a r ( I i ) is the magnitude of the variance of I i .
In general, the spatial distribution characteristics of waterlogging and ponding points are mainly divided into four types through the utilization of I i , namely high–high clustering, low–low clustering, high–low clustering, and low–high clustering. The spatial correlations indicated by high–high clustering and low–low clustering are positive, while the spatial correlations shown by high–low clustering and low–high clustering are negative. The spatial distribution traits at different locations within the research area can be illustrated by the LISA cluster map.

3.3. Geographical Detector

The geographical detector is a spatial statistical model, capable of revealing the relationship between independent variables and dependent variables through the quantitative analysis of the data on independent variables and dependent variables. Through analyzing the similarity in their spatial distributions, it holds that if the independent variables exert a significant impact on the dependent variables, they will present a spatially similar distribution [31]. In this section, the data regarding nine influencing factors in the central urban area of City B are selected as independent variables, and the corresponding kernel density data of waterlogging and ponding points are regarded as dependent variables for interactive detection analysis.
(1)
Differentiation and factor detection
The spatial stratified heterogeneity of urban waterlogging was explored, as well as the influence exerted by various factors on waterlogging within the research area, and measurement was conducted using the value q . The value of q ranges from 0 to 1 [32]. The larger the value, the greater the impact of the spatial variation degree of the influencing factor on that of waterlogging and ponding points. The expression of the value q is shown in Equation (9) [31].
q = 1 h = 1 L H n σ h 2 N σ 2 = 1 S S W S S T
S S W = h = 1 L H n σ h 2
S S T = N σ 2
In this equation, q is the explanatory power of the influencing factor X on the kernel density Y of waterlogging and ponding points, with its value range of [0, 1]; h is classification of influencing factors; H n is the total number of samples of influencing factor X in i category; σ h 2 is the discrete variance of the kernel density of waterlogging and ponding points in h category; σ 2 is the variance of the research area; N is the total number of samples extracted by ArcGIS 10.7; S S W is the sum of variances within each classification; and S S T is the total variance of the whole region.
(2)
Interaction Detection
The interaction relationships among different independent variables (influencing factors) were analyzed. The combined effect of two influencing factors with their individual effects was compared, and the reciprocal relationship between the two influencing factors was judged by observing the changes in the impact on the dependent variable. The main steps are as follows: calculate the q values of the explanatory power of the two influencing factors X 1 and X 2 on the dependent variable Y , respectively, denoted as q X 1 and q X 2 . Then, calculate the q value of the explanatory power generated when the two influencing factors X 1 and X 2 act together on the dependent variable Y , denoted as q X 1 X 2 . Compare the magnitudes of the three q values, and judge the interaction relationship between X 1 and X 2 based on the comparison results [33,34]. The judgment basis is shown in Table 2.

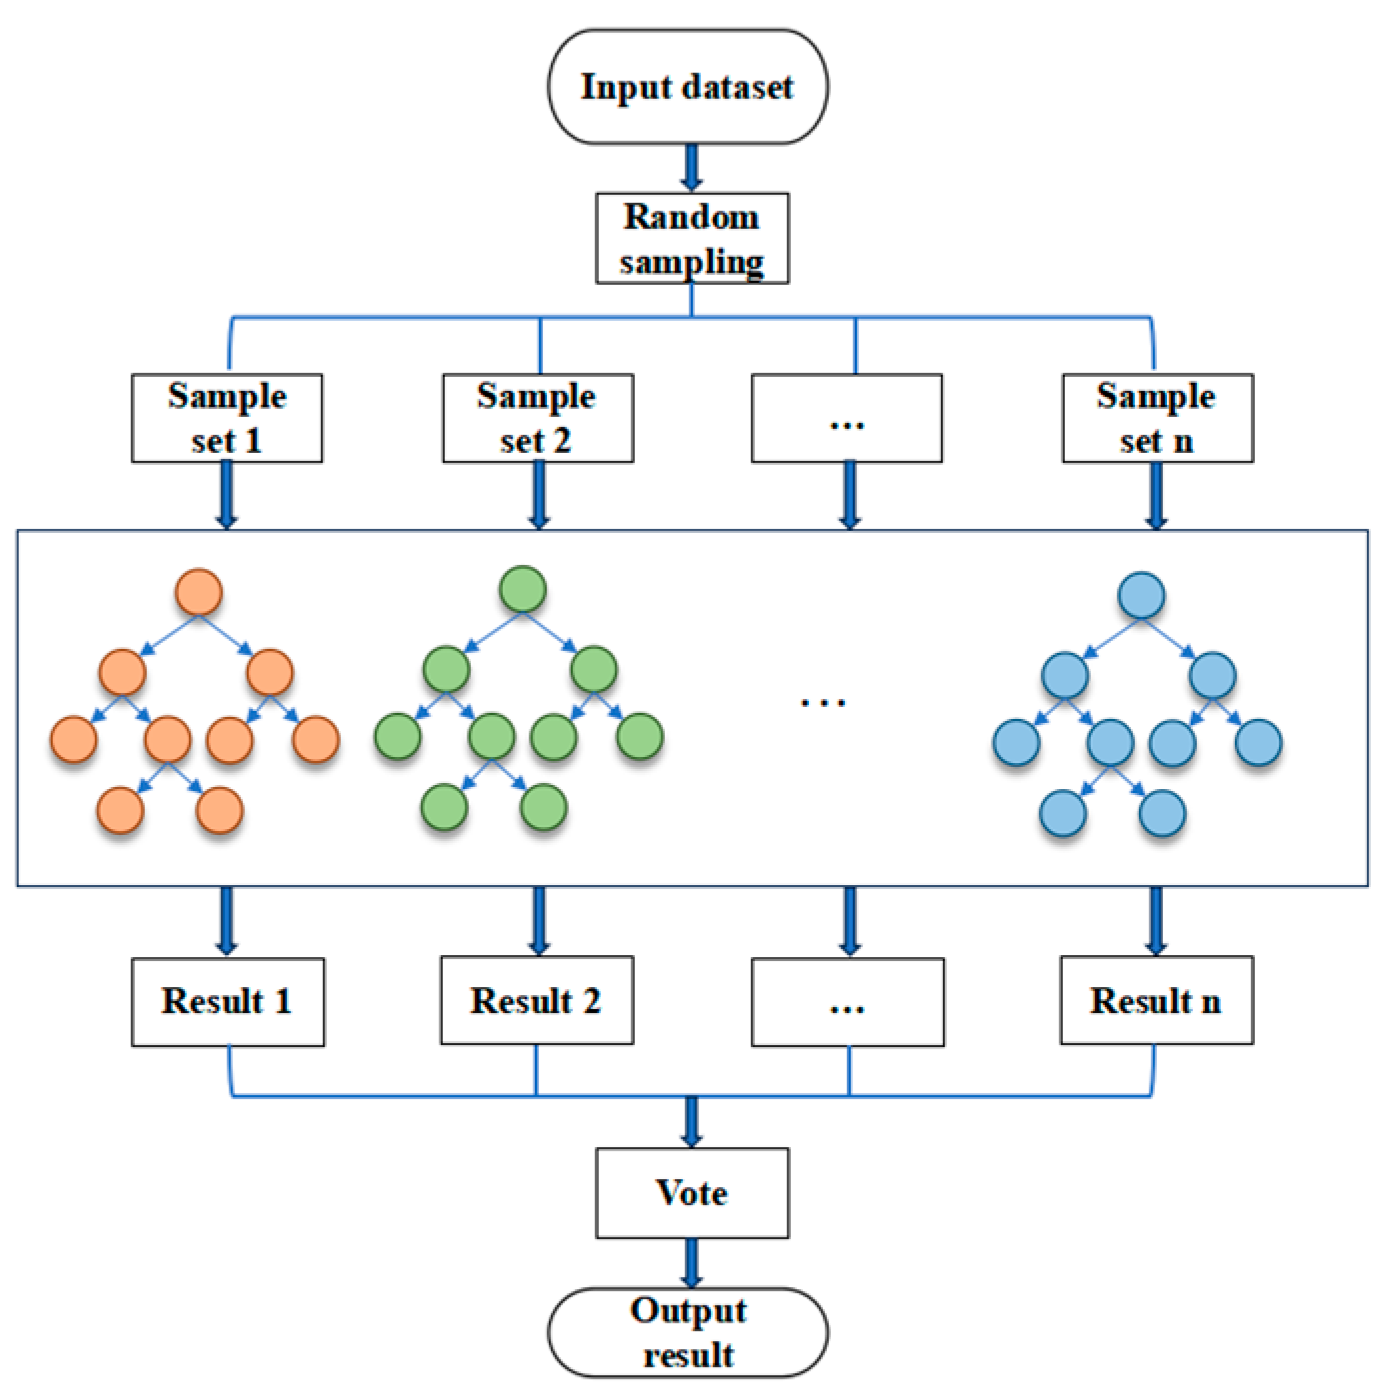
3.4. Random Forest Regression Model

The construction of the random forest (RF) model is based on the generation of decision trees. Decision trees randomly select samples and factors for splitting. This randomness makes each tree unique and improves the diversity of the model. The RF model is more suitable for dealing with datasets where there are complex connections among factors [35]. Since the random forest model is not prone to overfitting when processing data, there is no need to normalize the data, and the prediction effect of the model is not affected by the multicollinearity among variables. At present, RF has been widely used in various natural disaster assessments, such as flood disaster assessments and landslide assessments [36].
The flowchart for the construction of the RF model is shown in Figure 6. Firstly, a dataset is constructed based on the urban waterlogging situation and the conditions of various influencing factors. Then, the bootstrap resampling method is used to randomly sample the dataset to obtain n sample sets. For each sample set, a decision tree is constructed. Meanwhile, ( m < M ) factors are randomly selected from all M influencing factors for splitting nodes. Each decision tree is independent and undergoes individual training. When the decision tree grows to the preset n t r e e value, its growth stops [37]. Finally, the results of the decision trees are integrated, the optimal result is selected, and it is output [38].
The random forest model can serve the purpose of predicting risks and also has the functionality to measure the relative importance of each influencing factor to the dependent variable [39]. The random forest model can evaluate the importance of influencing factors by calculating the mean decrease accuracy (MDA) and the reduction in the G i n i index. Among them, the M D A is similar to the mean square error, which represents the degree of decline in the prediction accuracy of the random forest model when a certain influencing factor is randomly assigned values. The reduction in the G i n i index can indicate the change in the impurity of node splitting in the decision tree for each influencing factor. The larger the values of the M D A and the average reduction in the G i n i index are, the more prominent role of the influencing factor. The calculation formulas are shown in Equations (12) and (13).
M D A ( v ) = 1 n t r e e t e r r o o B t e r r o o B t
G i n i f = d = 1 k p d 1 p d = 1 d = 1 k p d / f 2
In these equations, v is the influencing factor of waterlogging, n t r e e is the number of decision trees, e r r O O B t is the out-of-bag estimate error, e r r O O B t is the out-of-bag estimate error after randomly permuting the t-th column, G i n i f is the Gini coefficient of node f, and p d / f is the probability of waterlogging occurring at node f.
In this research, the construction and simulation of the random forest model were achieved by leveraging the random forest library in the R language. Through a series of parameter adjustments, the specific parameter settings were determined as follows: the quantity of decision trees ( n t r e e ) was fixed at 350 and the number of features randomly chosen for each tree ( m t r y ) was set to 3, while the remaining parameters adopted the default values provided by the model.
With the assistance of ArcGIS 10.7 software, the research area was partitioned into multiple grids, each measuring 250 m × 250 m. Subsequently, the vector data of various influencing factors were sampled within every grid. Moreover, the research area was categorized into two distinct groups, namely the areas where waterlogging occurred and those where it did not. In total, 14,846 samples were collected. Among these samples, 70% were randomly picked out to form the training set, and the remaining 30% constituted the testing set. The performance of the model was appraised by means of the AUC value and the F1−score ( F 1 s c o r e ). Furthermore, the established model was employed to implement a profound analysis of the significance of each influencing factor and to make predictions regarding the episodes of waterlogging occur within the investigated area [40].

4. Result

4.1. Spatial Correlation Analysis of Urban Waterlogging and Ponding Points

During the period from 2015 to 2023, a total of 44 waterlogging and ponding points were identified in the principal urban area of City B. Figure 7 reveals the spatial distribution of the cores of waterlogging events triggered by rainstorms. The outcomes imply that the rainstorm waterlogging density within the downtown area of City B displays a spatial clustering configuration that is multi-core and multi-tiered. The areas with the utmost waterlogging density are clustered in the due west region of the central urban area. On the east side of the highest concentration area, there are two small dominant areas with relatively high waterlogging densities. In the area south of the central urban area, two secondary core areas with relatively high waterlogging densities have been formed. Other areas are peripheral areas with low rainstorm waterlogging densities.
The conclusions of the calculation of the global Moran’s I for the kernel density of waterlogging and ponding points are shown in Figure 8. The conclusions indicate that the global Moran’s I of the research area is 0.998, with the value p being less than 0.01. Meanwhile, the value z is approximately 296, which is far greater than 2.58. This demonstrates that the significance test has been passed, and the kernel density of waterlogging and ponding points in the research area exhibits a clustered distribution in space.
The prerequisite for conducting global spatial correlation analysis is that the spatial characteristics of all sub-regions possess the same features and properties. However, considering spatial heterogeneity, the characteristics of waterlogging occurrence among various local regions within the research area are not identical. Therefore, it becomes imperative to perform more in-depth research on local spatial autocorrelation analysis, with the aim of exploring and clarifying the distribution patterns of waterlogging in the local spatial domains of the area under study. Figure 9 demonstrates the results of the research.
It can be observed from the figure that the “high-high” clustering areas of waterlogging in the research area are predominantly located in the western region and the area south of the central part of the principal urban zone of City B. The degree of waterlogging occurrence in these areas is comparatively serious, and the surrounding areas are also more susceptible to rainstorm-induced waterlogging. The non-clustering areas are chiefly situated on the periphery of each sub-basin in the research area. In these areas and their surrounding regions, the degree of waterlogging and ponding is comparatively mild.

4.2. Analysis of Driving Factors for Waterlogging Disasters

The previous part conducted an analysis relating to the spatial distribution tendencies of waterlogging in the research area. In order to further delve into the influencing factors of the spatial changes in waterlogging in the research area, two methods, namely the geographical detector and the random forest model, were employed to conduct comprehensive comparative analysis. And the main influencing factors affecting the occurrence and differential distribution of waterlogging were identified.

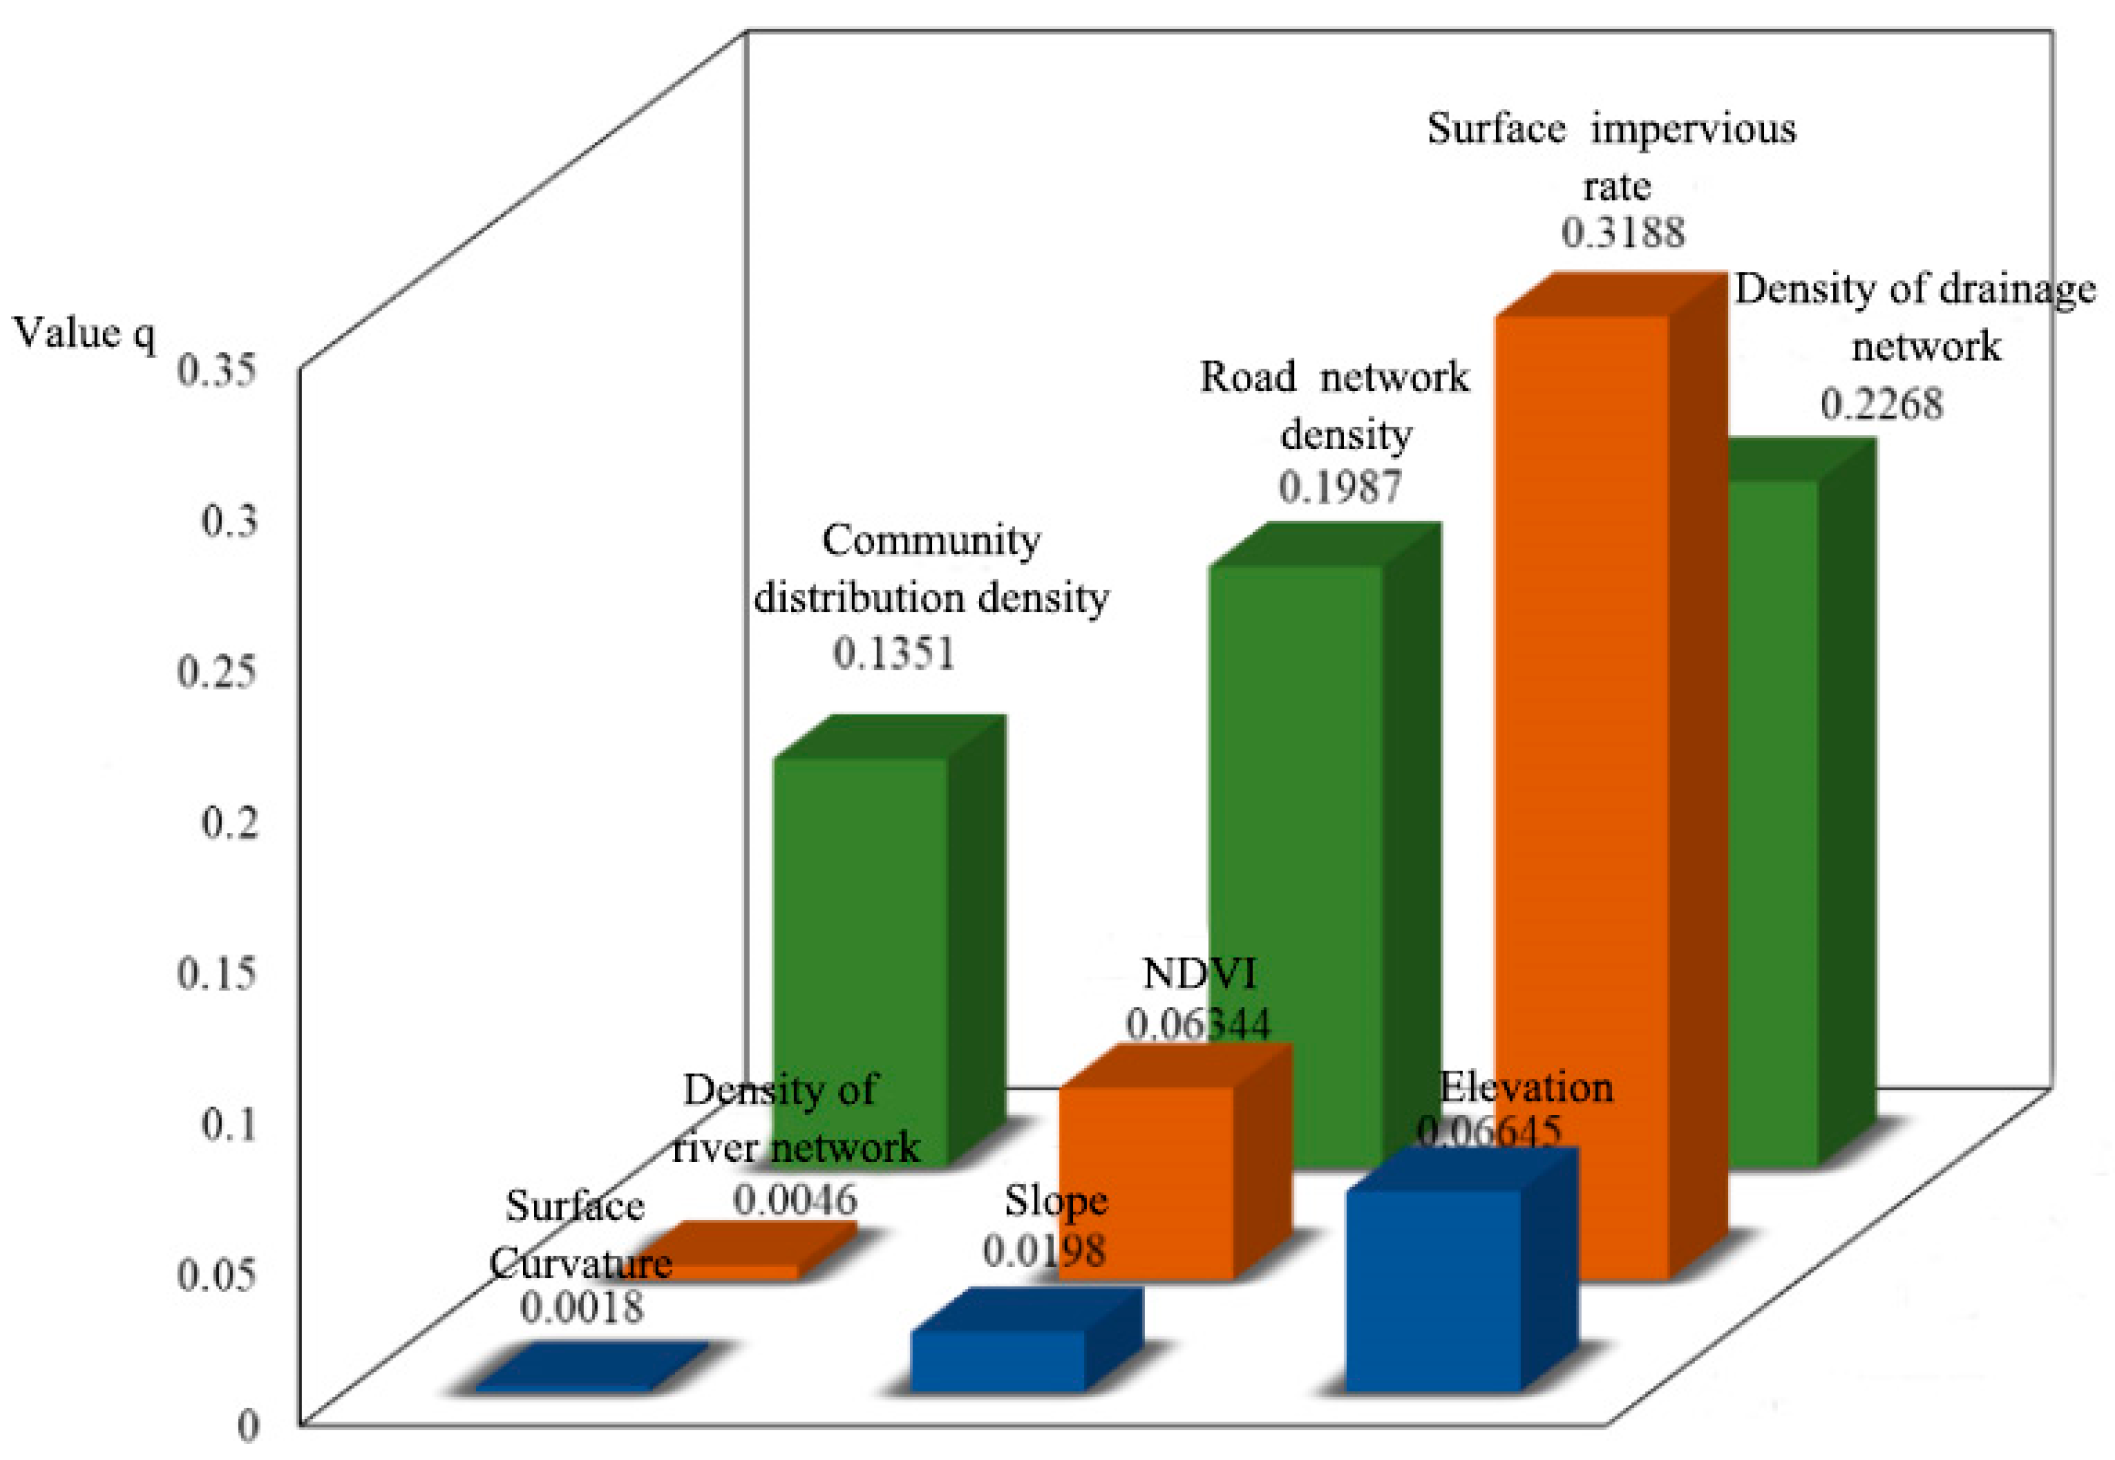
4.2.1. Analysis of Waterlogging Driving Factors Based on Geographical Detector

(1)
Analysis of Differentiation and Factor Detection
Through the factor detection analysis by the geographical detector, the explicative potency of nine diverse influencing elements on the spatial differentiation of the waterlogging degree in the central urban area of City B can be obtained. As shown in Table 3 and Figure 10, after analyzing the nine influencing factors, the value q of the explicative potency of a single influencing factor was obtained.
As described in Table 3, the influence of the spatial configuration of each influencing factor on the spatial configuration of waterlogging and ponding points in the central urban area of City B is as follows: surface imperviousness ratio > drainage pipe network density > road density > community density > vegetation coverage > elevation > slope > river network density > curvature. Among these influencing factors, the spatial distribution structures of the surface imperviousness ratio, drainage pipe network density, and road density demonstrate the most conspicuous correlation with the spatial configuration of waterlogging points. Specifically, the explanatory powers of these three influencing factors are 0.3188, 0.2268, and 0.1987, respectively. Additionally, the influence of the spatial configuration structures of community density, vegetation coverage, and elevation is also relatively notable, with their respective explanatory powers all surpassing 0.05.
As revealed in Table 3, it can be observed that the influence exerted by curvature and river network density is rather insignificant, with their q values being even lower than 0.01. Upon comprehensive analysis, the underlying reasons are as follows: in the principal urban zone of City B, the river network is densely and evenly distributed, which leads to relatively slight differences in its spatial distribution. During rainfall, the waterlogging drainage capacities of the river channels in different regions are similar. Moreover, the geomorphic types in the principal urban zone of City B are complex and multifaceted. As depicted in Figure 3c, the spatial variation pattern of the surface curvature is not readily apparent. In addition, the distribution of waterlogging and ponding points exhibits a certain degree of spatial aggregation. As a result, the spatial distribution variation in the curvature factor fails to effectively account for or modify the spatial distribution variation in waterlogging and ponding points as well.
Based on the value q table of individual influencing factors obtained by Geodetector, the distribution was plotted, and the result is shown in Figure 10.
As is illustrated in Figure 10, it is evident that all the influencing factors associated with the characteristics of infrastructure construction exert a significant impact on the spatial distribution of waterlogging-prone points within the study area. Simultaneously, certain influencing factors related to land cover characteristics and terrain characteristics also exert a definite influence pertaining to the spatial layout of waterlogging occurrences.
This phenomenon suggests that during the formation of waterlogging, natural factors serve as the basis for the differential distribution of waterlogging. In contrast, the influencing factors that represent the infrastructure construction status of the city have a more substantial impact on such differential distribution and play a pivotal “directive” role.
(2)
Detection of Interaction
Employing the module designed for the interaction detector of Geodetector, the interaction results among diverse potential influencing factors of urban waterlogging were acquired and then visualized as depicted in Figure 11. The findings demonstrated that the interaction types between any two of the nine influencing factors were either two-factor enhancement or nonlinear enhancement. Specifically, when two factors work in concert, their combined impact pertaining to the locational distribution of urban waterlogging surpasses that of a single factor, thereby exerting an evident promotional effect on urban waterlogging disasters. This implies that the influencing factors contributing to the occurrence of urban waterlogging are complex and multifaceted. In general, the urban waterlogging phenomenon within the study area is commonly influenced by multiple factors simultaneously.
As can be discerned from Figure 11, the interaction influence between the surface impervious rate and community density amounts to 0.3975, exerting the most prominent impact on the spatial differentiation of waterlogging within City B. By contrast, when solely taking into account the single factor of community density, its influence is merely 0.1351. This suggests that the indirect impact arising from the interaction between community density and the surface impervious rate on the spatial differentiation of urban waterlogging surpasses the direct impact generated by community density on its own.
Moreover, the interactions between the surface impervious rate and the drainage pipe network density (with an influence value of 0.3717) between the surface impervious rate and the road density (0.3631), as well as between the surface impervious rate and elevation (0.3515), also demonstrate relatively significant influences.
Therefore, in the endeavors of warding off and controlling urban waterlogging during rainstorms, it is imperative to comprehensively contemplate the interactions among various factors to formulate more effective anti-waterlogging strategies. During the urban construction process, it is of great importance to rationally plan the construction layout of infrastructure and the distribution of population, enhance urban greening efforts, and uphold the sustainable development of the city.

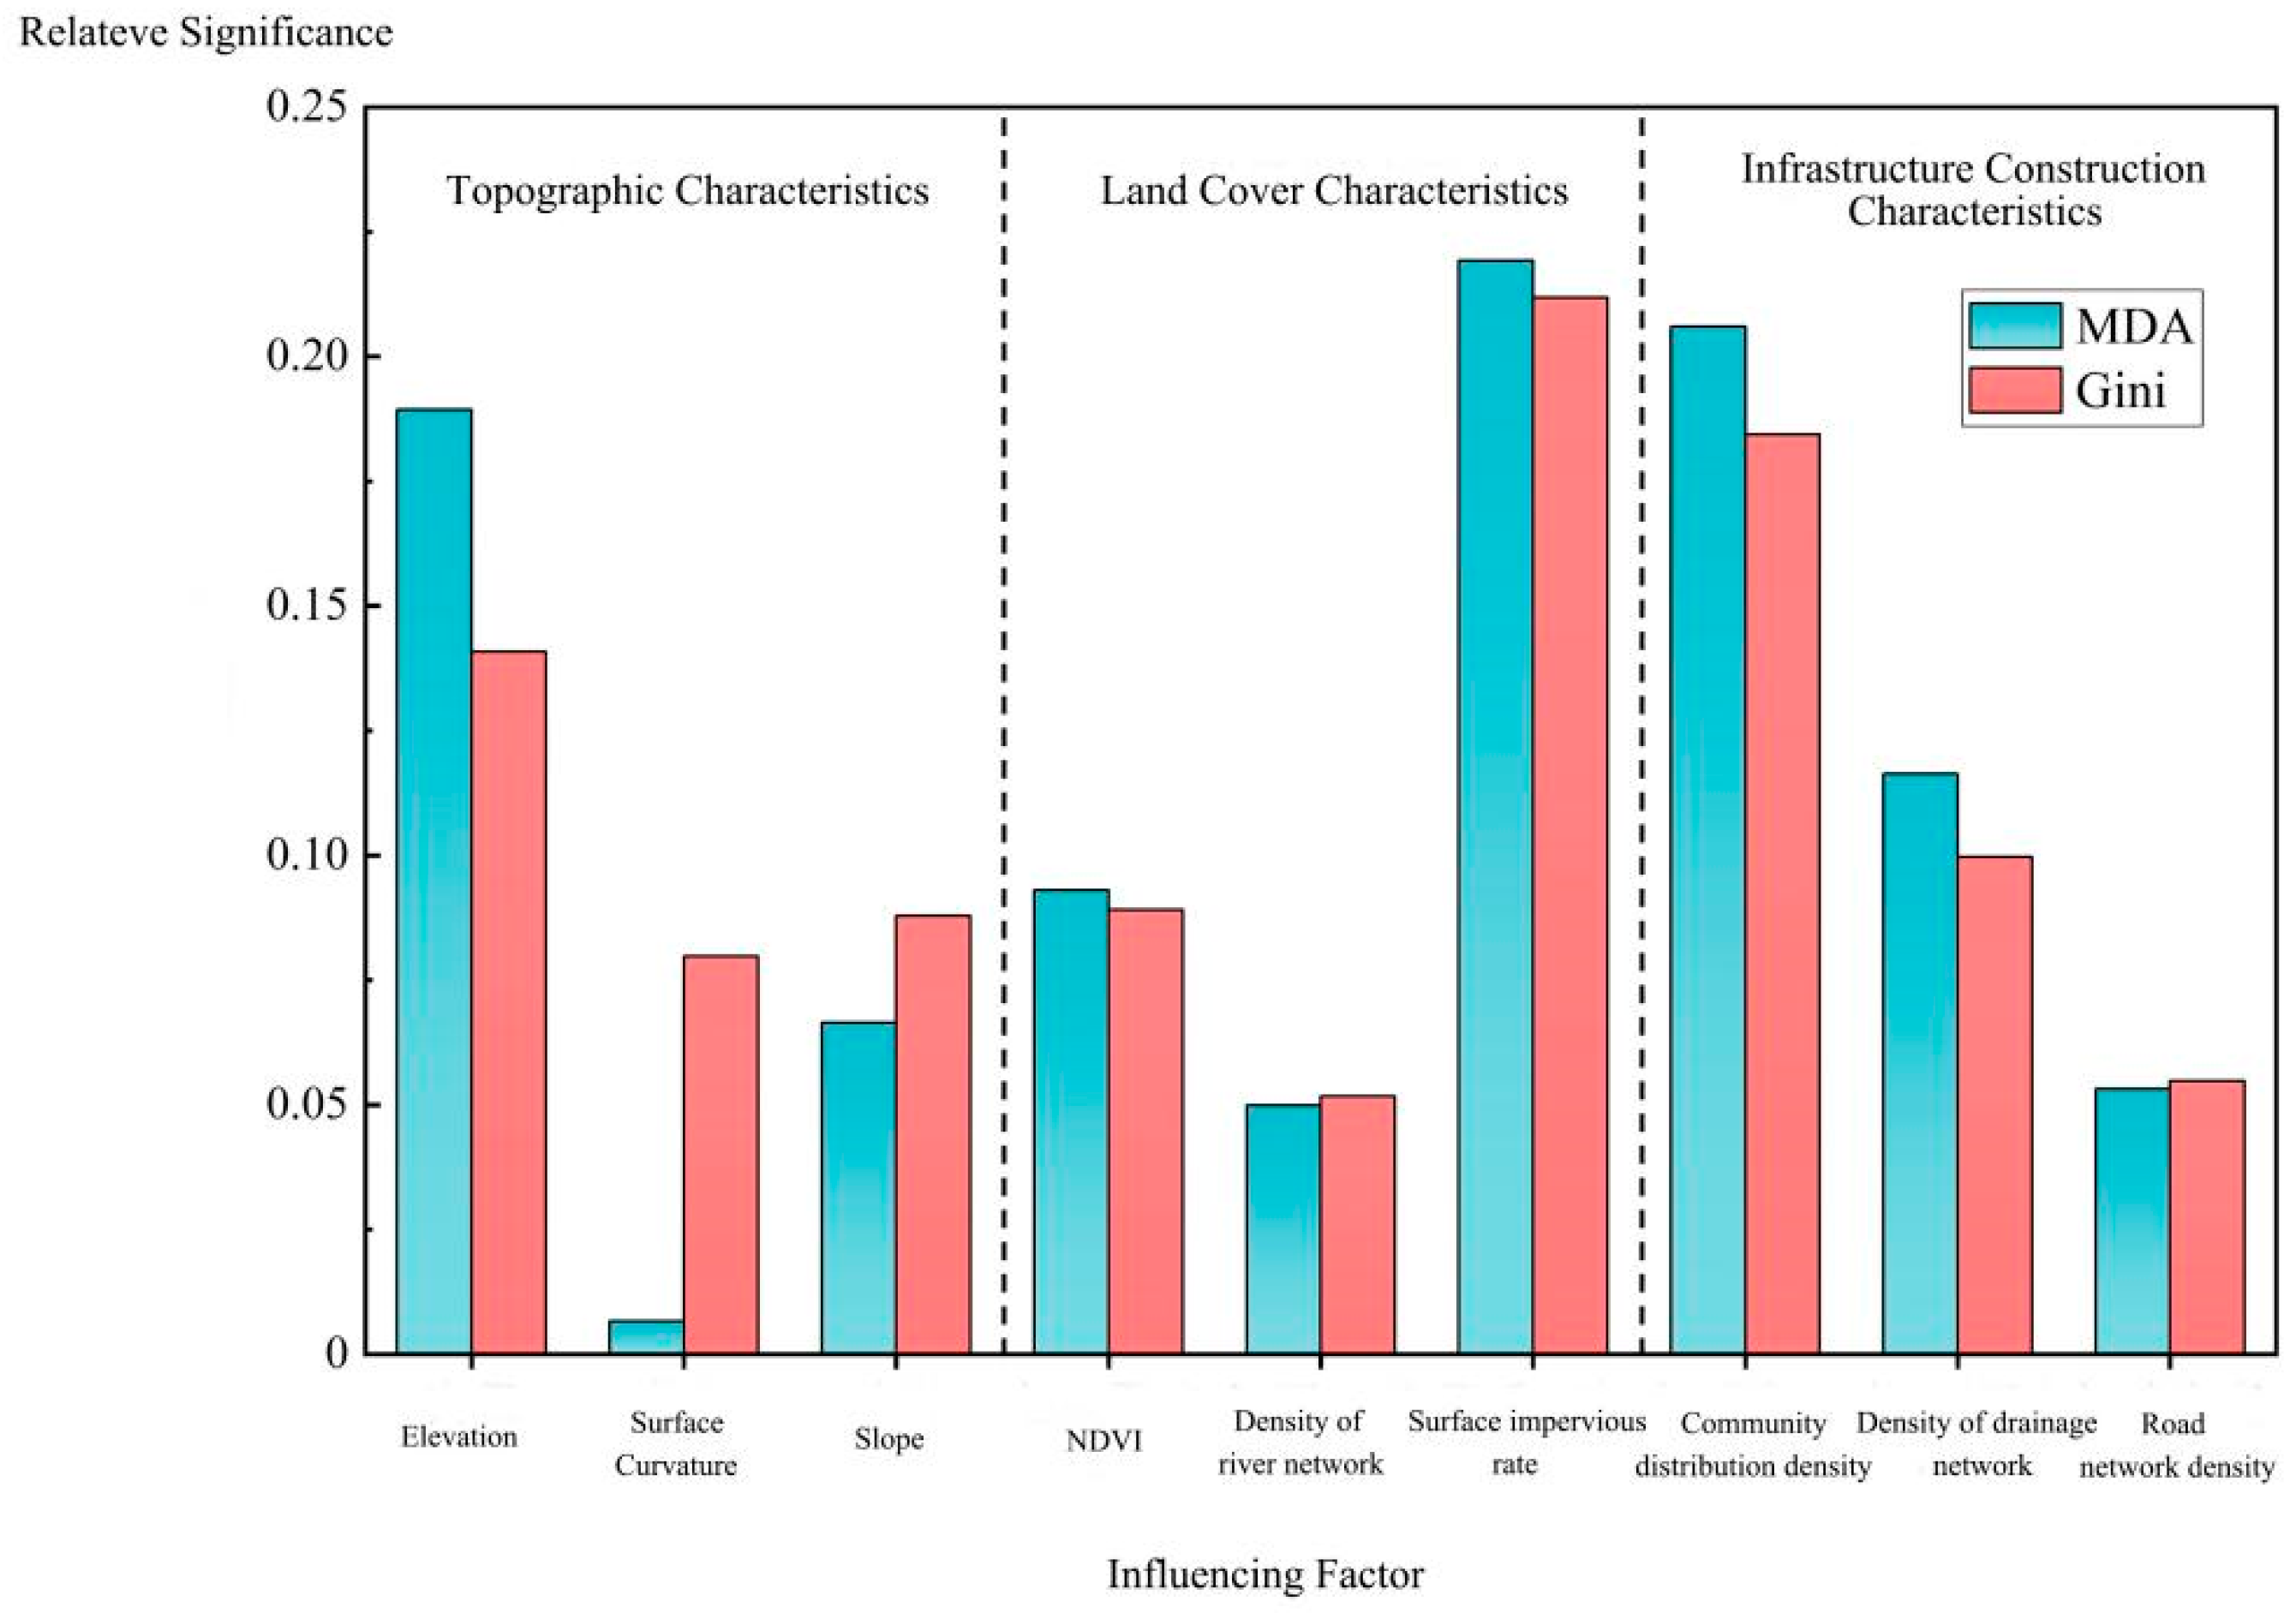
4.2.2. Analysis of Driving Factors for Waterlogging Based on Random Forest Model

The random forest model attains an AUC (area under the curve) of 0.862 and an F1 score of 0.909 on the test set, which implies that the results yielded by this model are reliable. Subsequently, the reduction amounts of M D A and G i n i calculated by the random forest model were normalized. After that, an analysis was carried out on the relative importance of specific influencing factors with respect to terrain characteristics, land cover characteristics, and infrastructure construction characteristics. The results are depicted in Figure 12.
From Figure 12, the evaluation results of the importance of each contributing factor based on the reduction amounts of M D A and G i n i are basically consistent. The importance ranking of each influencing factor according to M D A is as follows: surface impervious rate > community density > elevation > drainage pipe network density > vegetation coverage > slope > road density > river network density > curvature. The importance ranking of each influencing factor based on the reduction amounts of G i n i is as follows: surface impervious rate > community density > elevation > drainage pipe network density > vegetation coverage > slope > curvature > road density > river network density.
Combining these two evaluation indicators, the surface impervious rate, community density, and elevation are the three elements that predominantly affect the occurrence of urban waterlogging. That is to say, areas with a high surface impervious rate, dense community buildings, and relatively low elevation are prone to waterlogging, and the probability pertaining to the occurrence of waterlogging in these specific zones is higher than that in other areas. The curvature and river network density have the least impact on the occurrence of urban waterlogging. The reason is that the terrain in the central urban area of City B is relatively flat, and the river network density is evenly distributed. Under such conditions, waterlogging is less likely to occur, and other factors impose a more substantial difference to the occurrence of waterlogging.

4.3. Division of Waterlogging Disaster Sensitivity Areas

The division results of the sensitivity areas regarding the occurrence of waterlogging in the investigated area were acquired by means of the random forest model. Specifically, the random forest model was employed to forecast the potential for waterlogging taking place in the investigated area. Subsequently, the obtained results were fed into ArcGIS 10.7 for the purpose of visualization, which led to the generation of a distribution map demonstrating the waterlogging sensitivity of each area in descending order, as illustrated in Figure 13.
From Figure 13, most of the areas with high waterlogging sensitivity are concentrated in the central position of the study area, accounting for 7.54% of the total area of the study area. In combination with the construction situation of the core urban region of City B, it is found that the locations of the areas with high waterlogging sensitivity highly coincide with those of the built-up areas in the core urban region of City B. In this region, roads and buildings are densely distributed, and the proportion of impervious surfaces is high. Judging from the information obtained about City B, waterlogging on road surfaces is prone to occur in this area, which also verifies the accuracy of the model.

5. Discussion

5.1. Mechanism of Driving Factors for Urban Waterlogging

The driving factors of waterlogging exert varying degrees of influence on the waterlogging conditions within the study area. When considering both the spatial distribution and the occurrence patterns of urban waterlogging, the impact of the surface impervious rate stands out as the most prominent. This factor holds substantial significance in the study of urban waterlogging, aligning closely with the research findings of scholars such as Liu [26] and He [29]. They posit that the area of impervious surfaces and the alterations therein can significantly affect the surface permeability, thereby exerting a profound influence on the formation and development of urban waterlogging. In this regard, a rational layout of urban green spaces can play a positive role in reducing surface runoff and alleviating the issue of urban waterlogging.
The density of the drainage pipeline network also plays a crucial role, which is consistent with the research conducted by Li [28]. In her paper, it is emphasized that the construction and renovation of the drainage pipeline network are of vital importance for mitigating urban waterlogging. Additionally, elevation is another factor that impacts urban waterlogging. This study arrives at the same conclusion as Berndtsson [27], namely that regions with higher altitudes are less susceptible to waterlogging compared to flat areas.
Regarding the influence of the density and curvature of the river network on urban waterlogging, this study diverges from the findings of Lv [40]. Her research indicates a strong correlation between the density of the river network and urban waterlogging, suggesting that a dense river network can effectively enhance the urban drainage capacity. Conversely, in this study, the driving effects of the river network density and curvature on urban waterlogging are found to be the weakest. This is primarily attributed to the fact that City B features a flat terrain and a relatively uniform distribution of river network density, under which circumstances of the likelihood of waterlogging occurring is considerably low.
When considering the interactions among various driving factors, the interactive influence of some factors exceeds that of a single factor. This shows that the frequent urban waterlogging in the study area results from the interaction of multiple driving factors. Notably, the interaction between the impervious surface rate and community density has the greatest impact, followed by the interactions between the impervious surface rate and the density of the drainage pipeline network, road density, and elevation. This indicates that in areas with concentrated impervious surfaces, there are more interacting factors. For instance, in early-developed old urban areas, the combination of dense communities, sparse drainage pipeline networks, dense roads, and flat terrain—multiple complex factors—leads to the frequent occurrence of urban waterlogging.

5.2. Suggestions for Mitigating the Risk of Urban Waterlogging

City B is located in a subtropical humid climate zone, featuring a mild climate and abundant rainfall. The occurrence of rainfall is significantly correlated with the seasons. Approximately 80% of the annual precipitation occurs from May to September. The occurrence of heavy rainfall leads to urban waterlogging. Previous research has confirmed [25] that optimizing the spatial distribution pattern of the impervious surfaces in the city and increasing urban green spaces can effectively control surface runoff and alleviate urban waterlogging. Based on the GD and RF models, this study analyzes the causes of urban waterlogging and the characteristics of its spatial differentiation and provides suggestions for controlling the waterlogging risk in the study area.
The study shows that the areas directly west and south of the central urban area face a high waterlogging risk. These areas urbanized early, with a complex impervious surface distribution and backward drainage infrastructure. As Gaitan [20] believes, regions with high urbanization and poor drainage facilities are more likely to experience waterlogging. Thus, in urban planning, we should prevent the random expansion of impervious surfaces, plan building layouts rationally, and control the proportion of such surfaces to ease waterlogging.
The density of drainage pipelines is crucial for regional drainage capacity. High-density construction areas generally drain well, but as cities grow, issues like low pipeline standards and aging become evident, causing some pipelines to fail during heavy rain. So, we need to plan the construction, renovation, and maintenance of the drainage network properly. Low-lying or densely built areas also have a high waterlogging risk. While it is hard to change the terrain and layout, relevant departments can enhance monitoring and early warning for sudden rainstorms. Even if the river network density has little impact on waterlogging in this area, we should still desilt and widen rivers in a timely manner to ensure smooth drainage, reduce waterlogging risks, and sustain urban development.

6. Conclusions

This research concentrated on analyzing the elements of spatial differentiation features of waterlogging points within the core urban region of City B. Nine distinct influencing factors were considered to explore their impacts on the elements of spatial differentiation features of urban waterlogging, and a comprehensive analysis was conducted regarding the determination of the determinants for the occurrence of waterlogging in the study area. Eventually, by leveraging the determinants for the occurrence of waterlogging in said area, the waterlogging-sensitive areas were demarcated with the aim of evaluating the potential occurrence of waterlogging risk in the investigated area.
  • The research findings reveal that through kernel density analysis and spatial autocorrelation analysis, the distribution of waterlogging within the investigated area exhibits spatial non-uniformity. Additionally, the rainstorm waterlogging points demonstrate a pronounced spatial clustering characteristic, mainly being distributed in the westward and southward areas of the central part of the central urban area, which are precisely the regions with dense built-up areas, thus presenting a spatial clustering distribution pattern. In areas where the waterlogging situation is relatively serious, the surrounding areas are also more likely to experience rainstorm waterlogging.
  • Upon comprehensive consideration, it has been discovered that with regard to both the spatial layout of urban waterlogging incidents and the occurrence of such waterlogging incidents, the surface impervious rate exerts the most significant impact. Concurrently, three other influencing factors, namely the drainage pipe network density, community density (which can be regarded as population density), and elevation, also demonstrate considerable influence. When it comes to the interaction detection between any two factors, the interactive influences among the surface impervious rate, drainage pipe network density, road density, and elevation on the waterlogging within the study area are all rather substantial. In contrast, the influencing factors of river network density and curvature have relatively feeble influences.
  • Based on the random forest model for the division of waterlogging sensitivity areas in the study area, it was found that the areas with high waterlogging sensitivity highly coincided with the areas where waterlogging points were densely distributed in terms of spatial distribution, accounting for 7.54% of the total area of the study area. In these areas, infrastructure construction was carried out earlier, the terrain was low-lying, the surface impervious rate was high, the density of community buildings was large, and the drainage capacity was poor. As a result, waterlogging was prone to occur in such areas.
The research results have explored the driving factors of waterlogging in the investigated area. These factors are controllable for the city and possess relatively high-risk values for urban development. Therefore, it is necessary to manage these driving factors from a long-term perspective. Specifically, appropriate adjustments should be made to the road layout, the construction of drainage pipe networks should be improved, urban greening should be strengthened, and the land use layout should be planned reasonably, with the expectation of maintaining the sustainable advancement of the urban area.

Author Contributions

Conceptualization, H.Y. and Z.W.; methodology, W.N. and Z.W.; software, Z.W. and X.S.; data curation, W.N., Z.W. and X.S.; writing—original draft preparation, W.N.; writing—review and editing, H.Y., W.N., Z.W. and X.S.; visualization, W.N.; funding acquisition, H.Y. All authors have read and agreed to the published version of the manuscript.

Funding

This work was supported by the National Key R&D Plan of China (grant no. 2021YFC3001400) and the BUCEA Post Graduate Innovation Project (PG2024084).

Institutional Review Board Statement

Not applicable.

Informed Consent Statement

Not applicable.

Data Availability Statement

Data are contained within the article.

Conflicts of Interest

Author Xiaobo Sun was employed by the company CAUPD Beijing Planning & Design Consultants Ltd. The remaining authors state that the research was carried out without any commercial or financial connections that might be interpreted as a possible conflict of interest.

References

  1. Li, C.; Cheng, X.; Li, N.; Du, X.; Yu, Q.; Kan, G. A Framework for Flood Risk Analysis and Benefit Assessment of Flood Control Measures in Urban Areas. Int. J. Environ. Res. Public Health 2016, 13, 787. [Google Scholar] [CrossRef] [PubMed]
  2. Wu, Q. Urban Flood Disaster Risks and Disaster Mitigation Countermeasures in China in the 21st Century. J. Catastrophology 1998, 13, 6. (In Chinese) [Google Scholar]
  3. Zhang, J.; Wang, Y.; Liu, C.; He, R. Discussion on Urban Flooding and Prevention and Control Standards in China. J. Hydroelectr. Eng. 2017, 36, 6. (In Chinese) [Google Scholar]
  4. Zhang, H.; Yang, J.; Li, L.; Shen, D.; Dong, S. Measuring the resilience to floods: A comparative analysis of key flood control cities in China. Int. J. Disaster Risk Reduct. 2021, 59, 102248. [Google Scholar] [CrossRef]
  5. Alexander, D.E. Resilience and disaster risk reduction: An etymological journey. Nat. Hazards Earth Syst. Sci. 2013, 13, 2707–2716. [Google Scholar] [CrossRef]
  6. Salvadore, E.; Bronders, J.; Batelaan, O. Hydrological modelling of urbanized catchments: A review and future directions. J. Hydrol. 2015, 529, 62–81. [Google Scholar] [CrossRef]
  7. Lee, C.S.; Ho, H.Y.; Lee, K.T.; Wang, Y.C.; Guo, W.D.; Chen, Y.C.; Hsiao, L.F.; Chen, C.H.; Chiang, C.C.; Yang, M.J. Assessment of sewer flooding model based on ensemble quantitative precipitation forecast. J. Hydrol. 2013, 506, 101–113. [Google Scholar] [CrossRef]
  8. Office of State Flood Control and Drought Relief Headquarters; Ministry of Water Resources of the People’s Republic of China. China Flood and Drought Disaster Bulletin 2017; Ministry of Water Resources of the People’s Republic of China: Beijing, China, 2018. (In Chinese) [Google Scholar]
  9. Meng, Y.; Wang, X. Sustainable Design of Stormwater Landscapes in Sponge City Construction. Ecol. Econ. 2018, 34, 5. (In Chinese) [Google Scholar]
  10. Ahiablame, L.M.; Engel, B.A.; Chaubey, I. Effectiveness of Low Impact Development Practices: Literature Review and Suggestions for Future Research. Water Air Soil Pollut. 2012, 223, 4253–4273. [Google Scholar] [CrossRef]
  11. Jarden, K.M.; Jefferson, A.J.; Grieser, J.M. Assessing the effects of catchment-scale urban green infrastructure retrofits on hydrograph characteristics. Hydrol. Process. 2015, 30, 1536–1550. [Google Scholar] [CrossRef]
  12. Gaitan, S.; Veldhuis, J.A.E.T. Opportunities for multivariate analysis of open spatial datasets to characterize urban flooding risks. PIAHS 2015, 370, 9–14. [Google Scholar] [CrossRef]
  13. Yu, H.; Zhao, Y.; Fu, Y. Optimization of Impervious Surface Space Layout for Prevention of Urban Rainstorm Waterlogging: A Case Study of Guangzhou, China. Int. J. Environ. Res. Public Health 2019, 16, 3613. [Google Scholar] [CrossRef]
  14. Huang, T.; Chen, J.; Huang, F.; Su, Z. A Study of Urban Waterlogging Characteristics in Pearl River Delta Region Based on GIS. J. Guangdong Univ. Technol. 2017, 34, 24–30. [Google Scholar]
  15. Schmitt, T.G.; Thomas, M.; Ettrich, N. Analysis and modeling of flooding in urban drainage systems. J. Hydrol. 2004, 299, 300–311. [Google Scholar] [CrossRef]
  16. Yong-Chao, Z.; Tian, L.I. Design and Safety Assessment of Conduits in Buffering Stormwater Drainage System. Hunan Daxue Xuebao/J. Hunan Univ. Nat. Sci. 2008, 22, 199–205. [Google Scholar]
  17. Xu, H. Analysis of Impervious Surface and its Impact on Urban Heat Environment using the Normalized Difference Impervious Surface Index (NDISI). Photogramm. Eng. Remote Sens. 2010, 76, 557–565. [Google Scholar] [CrossRef]
  18. Marsalek, J.; Chocat, B. International Report: Stormwater management. Water Sci. Technol. 2002, 46, 1–17. [Google Scholar] [CrossRef] [PubMed]
  19. Wong, T.; Chiew, F.; Mcmahon, T.; Duncan, H. Urban Drainage Maintenance and Management Issues in Arid and Semiarid Regions; The United Nations Educational, Scientific and Cultural Organization: Paris, France, 2001. [Google Scholar]
  20. Gaitan, S.; Ten Veldhuis, M.C.; Nick, V.D.G. Spatial Distribution of Flood Incidents Along Urban Overland Flow-Paths. Water Resour. Manag. 2015, 29, 3387–3399. [Google Scholar] [CrossRef]
  21. Mejia, A.I.; Moglen, G.E. Impact of the spatial distribution of imperviousness on the hydrologic response of an urbanizing basin. Hydrol. Process. 2010, 24, 3359–3373. [Google Scholar] [CrossRef]
  22. Du, S.; Shi, P.; Van Rompaey, A.; Wen, J. Quantifying the impact of impervious surface location on flood peak discharge in urban areas. Nat. Hazards 2015, 76, 1457–1471. [Google Scholar] [CrossRef]
  23. Yu, H.; Zhao, Y.; Fu, Y.; Li, L. Spatiotemporal Variance Assessment of Urban Rainstorm Waterlogging Affected by Impervious Surface Expansion: A Case Study of Guangzhou, China. Sustainability 2018, 10, 3761. [Google Scholar] [CrossRef]
  24. Li, Z.; He, W.; Cheng, M.; Hu, J.; Yang, G.; Zhang, H. SinoLC-1: The first 1-m resolution national-scale land-cover map of China created with the deep learning framework and open-access data. Earth Syst. Sci. Data Discuss. 2023, 15, 4749–4780. [Google Scholar] [CrossRef]
  25. Liu, W.; Zhang, X.; Feng, Q.; Yu, T.; Engel, B.A. Analyzing the impacts of topographic factors and land cover characteristics on waterlogging events in urban functional zones. Sci. Total Environ. 2023, 904, 166669. [Google Scholar] [CrossRef] [PubMed]
  26. Liu, F.; Liu, X.; Xu, T.; Yang, G.; Zhao, Y. Driving Factors and Risk Assessment of Rainstorm Waterlogging in Urban Agglomeration Areas: A Case Study of the Guangdong-Hong Kong-Macao Greater Bay Area, China. Water 2021, 13, 770. [Google Scholar] [CrossRef]
  27. Berndtsson, R.; Becker, P.; Persson, A.; Aspegren, H.; Tussupova, K. Drivers of changing urban flood risk: A framework for action. J. Environ. Manag. 2019, 240, 47–56. [Google Scholar] [CrossRef]
  28. Li, Q.; Li, X.; Gong, Z.; Qin, Q.; Zhang, B. Analysis on the Temporal and Spatial Patterns and Causes of Waterlogging in the Central Urban Area of Lanzhou City. Remote Sens. Technol. Appl. 2023, 38, 935–944. (In Chinese) [Google Scholar]
  29. He, P.; Liu, D.; Lu, S.; He, X.; Li, Y.; Yang, L.; Lin, J. Analysis of Influencing Factors and Risk Assessment of Waterlogging in Shenzhen Based on the Maximum Entropy Model. Prog. Geogr. 2022, 41, 1868–1881. (In Chinese) [Google Scholar] [CrossRef]
  30. Fang, D. Research on the Influencing Factors of Population Distribution in Guangxi Based on the Random Forest Model and Geodetector. Master’s Thesis, Nanning Normal University, Nanning, China, 2020. (In Chinese). [Google Scholar]
  31. Wang, J.; Xu, C. Geodetector: Principles and Prospects. Acta Geogr. Sin. 2017, 72, 116–134. (In Chinese) [Google Scholar]
  32. Wang, J.-F.; Li, X.-H.; Christakos, G.; Liao, Y.-L.; Zhang, T.; Gu, X.; Zheng, X.-Y. Geographical Detectors-Based Health Risk Assessment and its Application in the Neural Tube Defects Study of the Heshun Region, China. Int. J. Geogr. Inf. Sci. 2010, 24, 107–127. [Google Scholar] [CrossRef]
  33. Zheng, J. Research on the Spatial Pattern and Driving Mechanism of Waterlogging in Karst Mountainous Cities. Master’s Thesis, Guizhou Normal University, Guiyang, China, 2023. (In Chinese). [Google Scholar]
  34. Tian, Z.; Yin, C.; Wang, X. Dynamic Assessment of the Ecological Environment and Analysis of Driving Factors in the Poyang Lake Basin. Environ. Sci. 2023, 44, 816–827. (In Chinese) [Google Scholar]
  35. He, R.; Lu, H.; Jin, Z.; Qin, Y.; Yang, H.; Liu, Z.; Yang, G.; Xu, J.; Gong, X.; Zhao, Q. Construction of a Forest Fire Occurrence Prediction Model and Driving Factors in Southwest China Based on the Random Forest Algorithm. Acta Ecol. Sin. 2023, 43, 9356–9370. [Google Scholar]
  36. Tang, X.; Li, J.; Liu, W.; Yu, H.; Wang, F. A method to increase the number of positive samples for machine learning-based urban waterlogging susceptibility assessments. Stoch. Environ. Res. Risk Assess. 2021, 36, 2319–2336. [Google Scholar] [CrossRef]
  37. Du, S.; Zhang, J.; Han, Z.; Gong, M. Prediction of Armed Conflict Risk and Analysis of Influencing Factors at the “Grid-Month” Scale Based on the Random Forest Model: A Case Study of the Indo-China Peninsula. J. Geo-Inf. Sci. 2023, 25, 2026–2038. (In Chinese) [Google Scholar]
  38. Wu, M.; Wu, Z.; Ge, W.; Wang, H.; Jiang, M. Identification of sensitivity indicators of urban rainstorm flood disasters: A case study in China. J. Hydrol. 2021, 599, 126393. [Google Scholar] [CrossRef]
  39. Yan, C. Multi-objective Optimization Research on the Regional Groundwater Pollution Monitoring Well Network—A Case Study of Pinggu Plain Area. China Univ. Geosci. 2021. (In Chinese) [Google Scholar]
  40. Lu, X.; Zhang, C.; Huang, J.; Tian, Y.; Wang, X. Analysis and Evaluation of Influencing Factors for Rainstorm and Flood Sensitivity—A Case Study of Anyi County in Jiangxi Province. J. Catastrophology 2021, 36, 223–229. (In Chinese) [Google Scholar]
Figure 1. The study area.
Sustainability 17 02785 g001
Figure 2. Rainstorm waterlogging data map of the study area.
Sustainability 17 02785 g002
Figure 3. Topographic feature factor. (a) Elevation, (b) slope, (c) surface curvature.
Sustainability 17 02785 g003aSustainability 17 02785 g003b
Figure 4. Land cover characteristic factor. (a) N D V I , (b) density of river network, (c) surface impervious rate.
Sustainability 17 02785 g004
Figure 5. Characteristic factors of infrastructure construction. (a) Road network density, (b) community distribution density, (c) density of drainage network.
Sustainability 17 02785 g005
Figure 6. Flow chart of random forest model.
Sustainability 17 02785 g006
Figure 7. Kernel density diagram of urban waterlogging points.
Sustainability 17 02785 g007
Figure 8. Global Moran’s I of core density of waterlogged water points in the study area.
Sustainability 17 02785 g008
Figure 9. LISA aggregation diagram of nuclear density at waterlogged water points.
Sustainability 17 02785 g009
Figure 10. The calculation result of the influence value of each influence factor.
Sustainability 17 02785 g010
Figure 11. Influence factor interaction result diagram.
Sustainability 17 02785 g011
Figure 12. Importance ranking of impact factors based on RF model.
Sustainability 17 02785 g012
Figure 13. Waterlogging-sensitive area partition diagram based on random forest model.
Sustainability 17 02785 g013
Table 1. Metadata information.
DataData TypeData YearData Source
Waterlogging accumulation pointsText file2015–2023City water authority,
mainstream media
Topographic dataRaster2020USGS (https://www.usgs.gov/)
High-resolution
remote sensing image
Satellite imagery2020Geospatial Data Cloud
(https://www.gscloud.cn/)
River dataVector2020Water Affairs Department
Administrative
divisions
Vector2020National Geomatics Center of China (https://www.ngcc.cn/)
Road dataVector2023National Earth System Science Data Center(http://www.geodata.cn/)
Administrative village dataText file2022National Bureau of Statistics (http://www.stats.gov.cn/)
Impervious surfaceVector1985–2020Reference [24]
Drainage pipe network dataVector2020Water Affairs Department
Table 2. Result type of two-factor interaction.
Interactive EffectJudgment Basis
Nonlinear enhancement q X 1 X 2 < M i n q X 1 ,   q X 2
Nonlinear enhancement of a single factor M i n q X 1 ,   q X 2 < M a x q X 1 , q X 2
Enhancement of dual factors q X 1 X 2 > M a x q X 1 , q X 2
Mutually independent q X 1 X 2 = q X 1 + q X 2
Nonlinear enhancement q X 1 X 2 > q X 1 + q X 2
Table 3. Value q of impact factor based on Geodetector.
(a) Topographic feature factor
Influencing FactorTopographic Feature Factor
ElevationCurvatureSlope
q 0.06650.00180.0198
(b) Land cover characteristic factor
Influencing factorLand Cover Characteristic Factor
Vegetation CoverageDensity of River NetworkSurface Impervious Rate
q 0.06340.00460.3188
(c) Characteristic factors of infrastructure construction
Influencing FactorCharacteristic Factors of Infrastructure Construction
Community Distribution DensityDensity of Drainage NetworkRoad Network Density
q 0.13510.22680.1987
Disclaimer/Publisher’s Note: The statements, opinions and data contained in all publications are solely those of the individual author(s) and contributor(s) and not of MDPI and/or the editor(s). MDPI and/or the editor(s) disclaim responsibility for any injury to people or property resulting from any ideas, methods, instructions or products referred to in the content.

