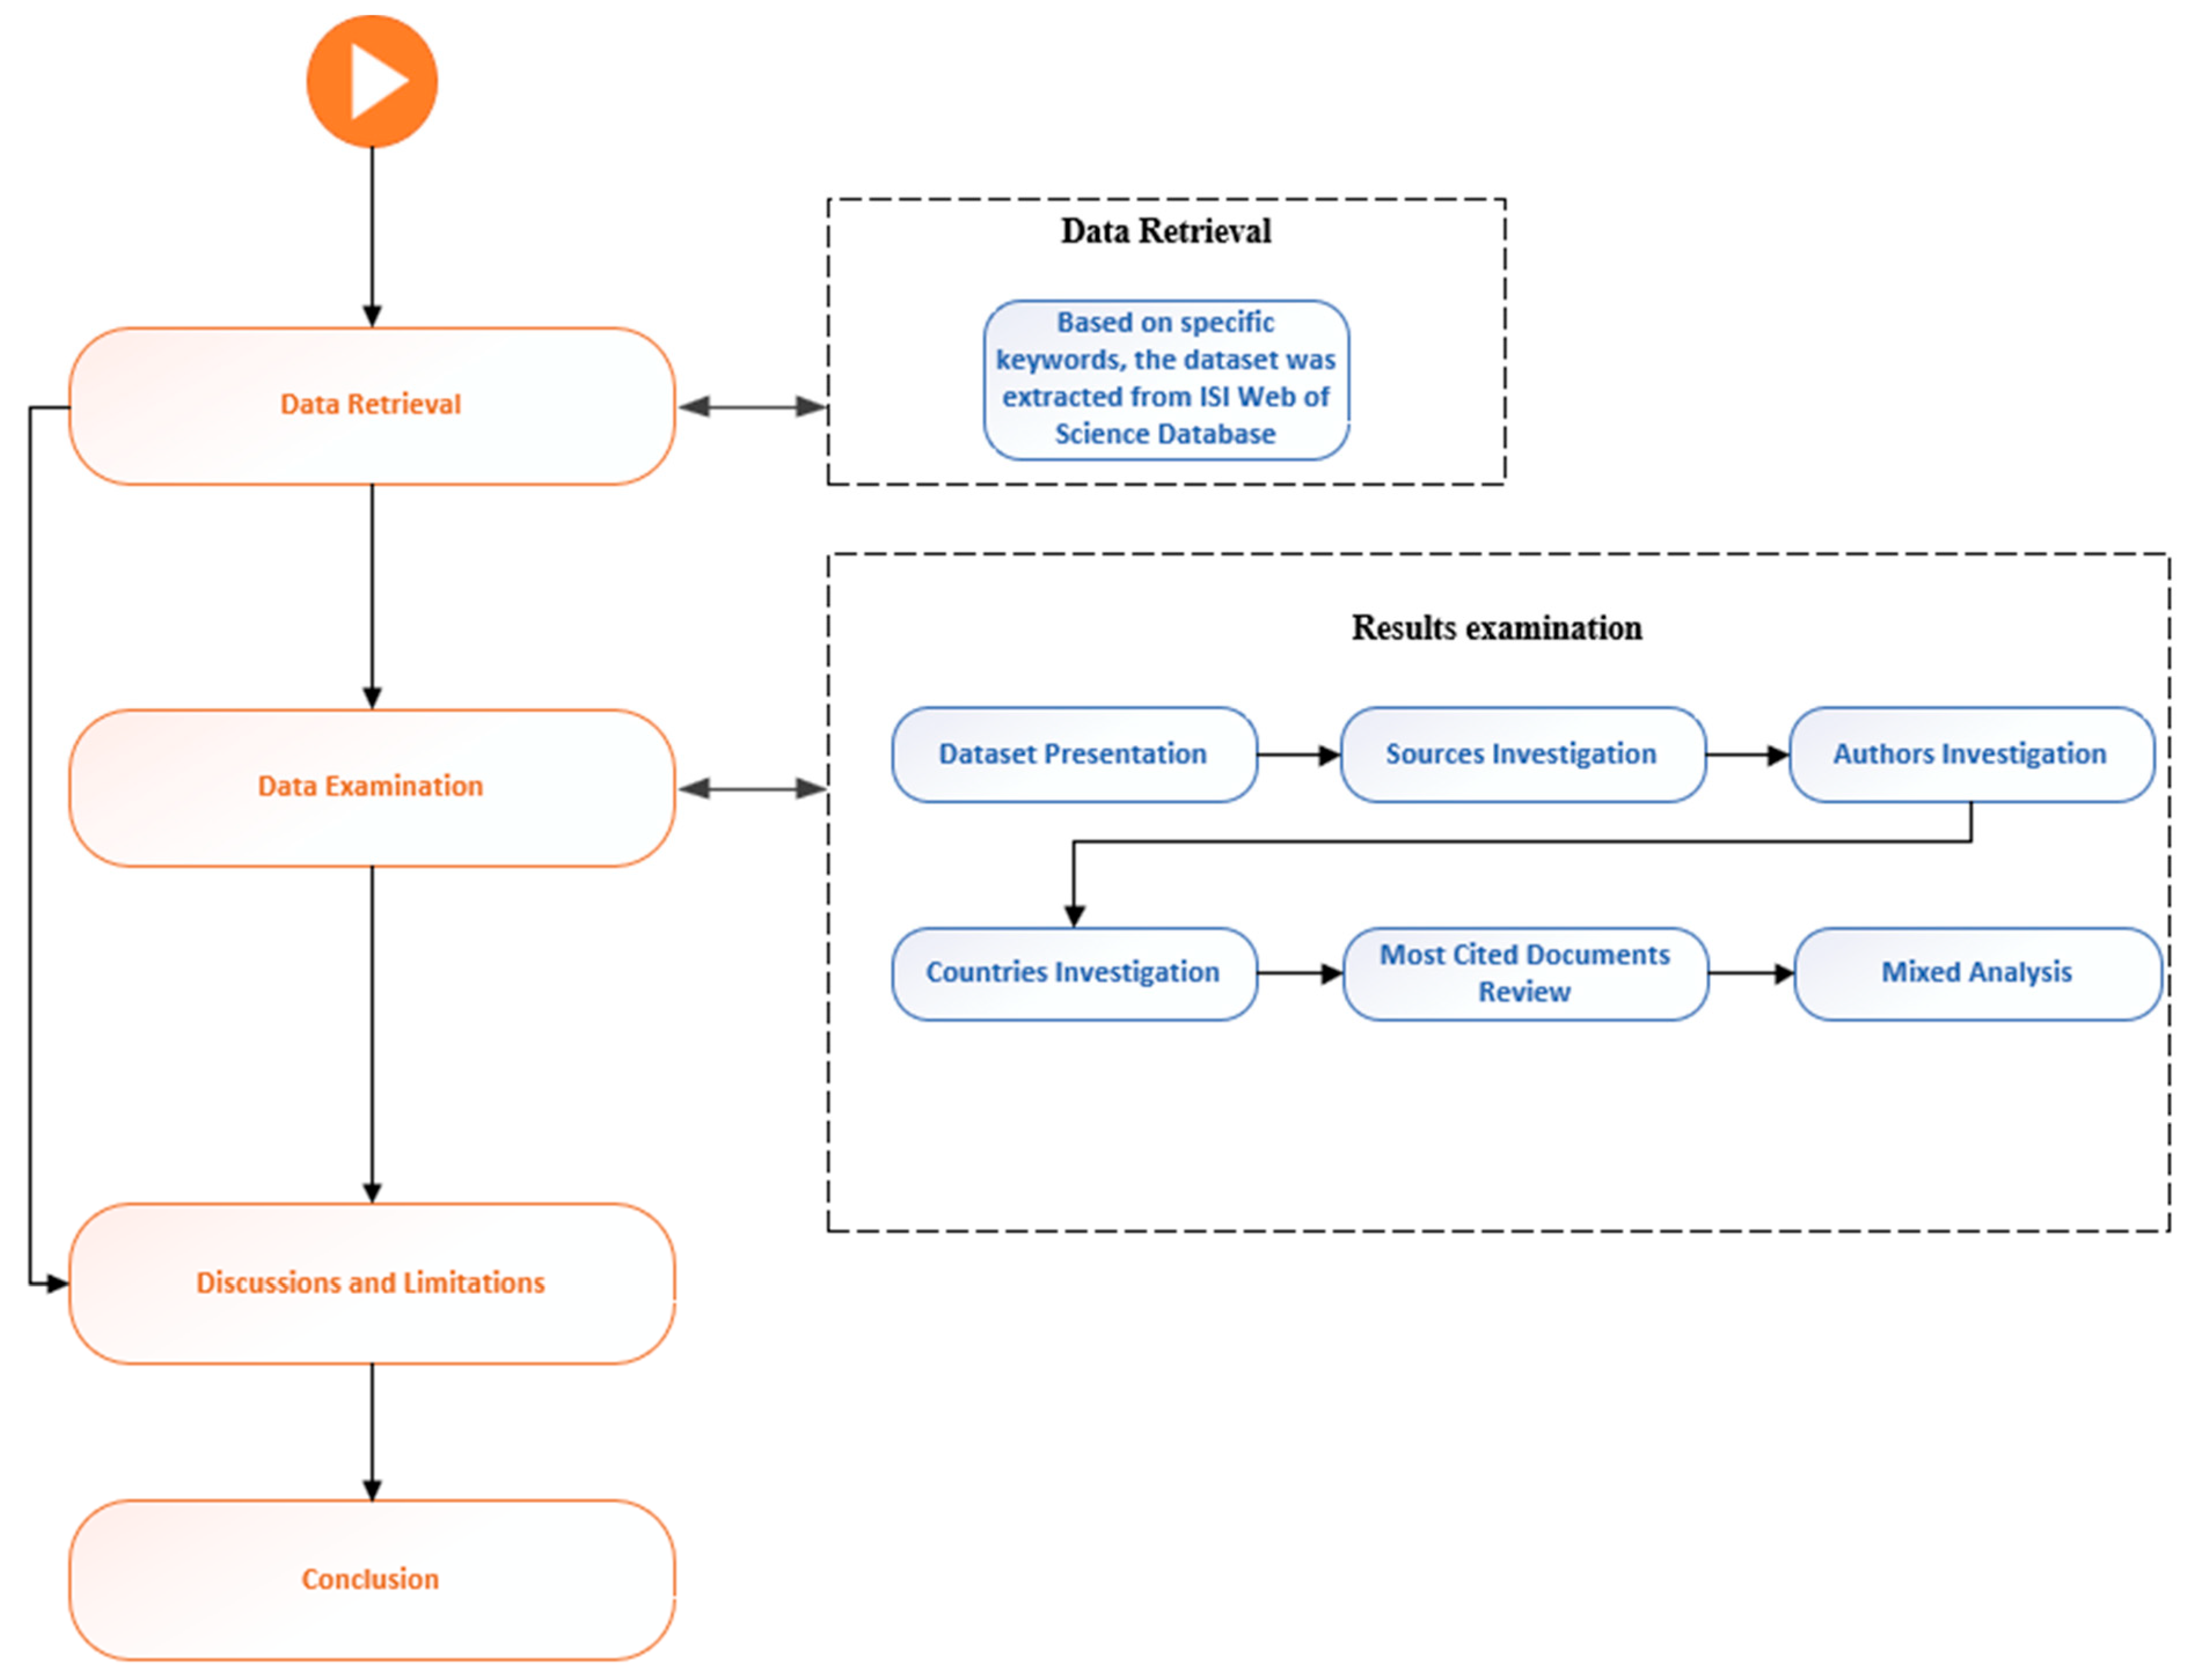
The third section investigates the extracted dataset from different perspectives, pointing out the main sources, authors, countries, keywords, thematic evolution, collaboration network, and which are the five most globally cited documents.
3.1. Dataset Presentation
The initial part of the third section explores the dataset by extracting information on variables such as the timespan, number of documents, sources, references, average years from publication, number of authors, Keywords Plus, authors’ keywords, which types of documents have been included in analysis, annual scientific production, and average citations per year.
Table 2 investigate the data by extracting the main information. The period analysed began in 1982 and ended in 2024, representing 42 years, which included 3483 sources, 9169 documents, and 158,021 references. The average number of years taken for publication was 9.1 and the average number of citations per document was 12.15. Compared to similar scientific papers, the number, 9169 documents, was much higher. Pan et al. [
28] investigated 4859 documents that had been published between 1991 and 2018 while Prakash et al. [
30] evaluated a total of 392 documents that had been published between 2011 and 2021. The article with the closest number of papers was published by Fang et al. [
31] and explored a total of 8898 articles that had been released between 2010 and 2020. Prakash et al. [
30] discovered an average years from publications of 4.52 years, with a mean number of citations per document of 3.591 and a total of 5084 references, while Fang et al. [
31] presented the average citation rate per field: Management had an average citation rate of 33.89, Business 30.96, Economics 25.30, and Green and Sustainable Science and Technology 34.35. In our case, the number of papers was higher compared to that in existing articles in the academic community, but this was due to the higher average number of years from publication. The mean number of citations per document was smaller compared to that in Fang et al. [
31] due to the fact that the focus of the authors was to evaluate the fields where grey systems had been implemented, but compared to Prakash et al. [
30], the mean citation rate was much higher because the top three most cited papers included in our analysis were published in 1982 and 2010, years that have not been included in the analysis.
Table 3 explores the author information. There were over 13,232 authors included in the dataset, which used 18,963 authors’ keywords and 5410 Keywords Plus. There were 12,554 multiple-authored documents and 678 single-authored documents, with an average number of co-authors per document of 3.29 and an international co-authorship of 11.28%. Considering the paper written by Prakash et al. [
30], the database that has been analysed by the authors contains a total of 1179 Keywords Plus, 835 authors’ keywords, 623 authors, 11 single-authored papers, 403 multiple-authored documents, and 3.19 co-authors per article. Due to the size difference among the datasets, in order to perform a correct comparison, the single- and multiple-authored documents have been calculated as percentages of the total number of articles. In our case, the single-authored documents represent approximately 7.39% of the total articles compared to the 2.80% in Prakash et al.’s [
30] paper, resulting a higher distribution of single-authored documents in our dataset. A similar approach has been applied to the authors’ keywords and Keywords Plus, dividing the number to the number of documents. In our document, the average number of Keywords Plus per document is only 0.59 while the number of authors’ keywords per document is 2.06. Prakash et al. [
30] had an average of three Keywords Plus per paper and 1.58 authors’ keywords per document. The difference is significant for Keywords Plus and it can be explained by the limited access to Keywords Plus, authors’ keywords, and abstracts for the articles published before 1990, as Liu et al. [
13] explained, which could have affected the outcome since the timespan was between 1982 and 2024.
Table 4 focuses on the types of papers that have been included in the dataset. The highest number of papers, 5057, was for “
Article”, followed by “
Proceedings paper” with 3747. There were only sixty-eight papers marked as “
Review”, thirty-six as “
book chapter”, and five as “
letter”. According to Pan et al. [
28], who evaluated the grey systems theory topic, the most common type of document that has been investigated using the bibliometric approach differs from one year to another. Between 2000 and 2016, most of the papers that had been investigated were proceeding papers, followed by articles and a few reviews or retracted publications. In 2017, most papers were articles, representing the single year of the analysed timespan wherein articles were the majority.
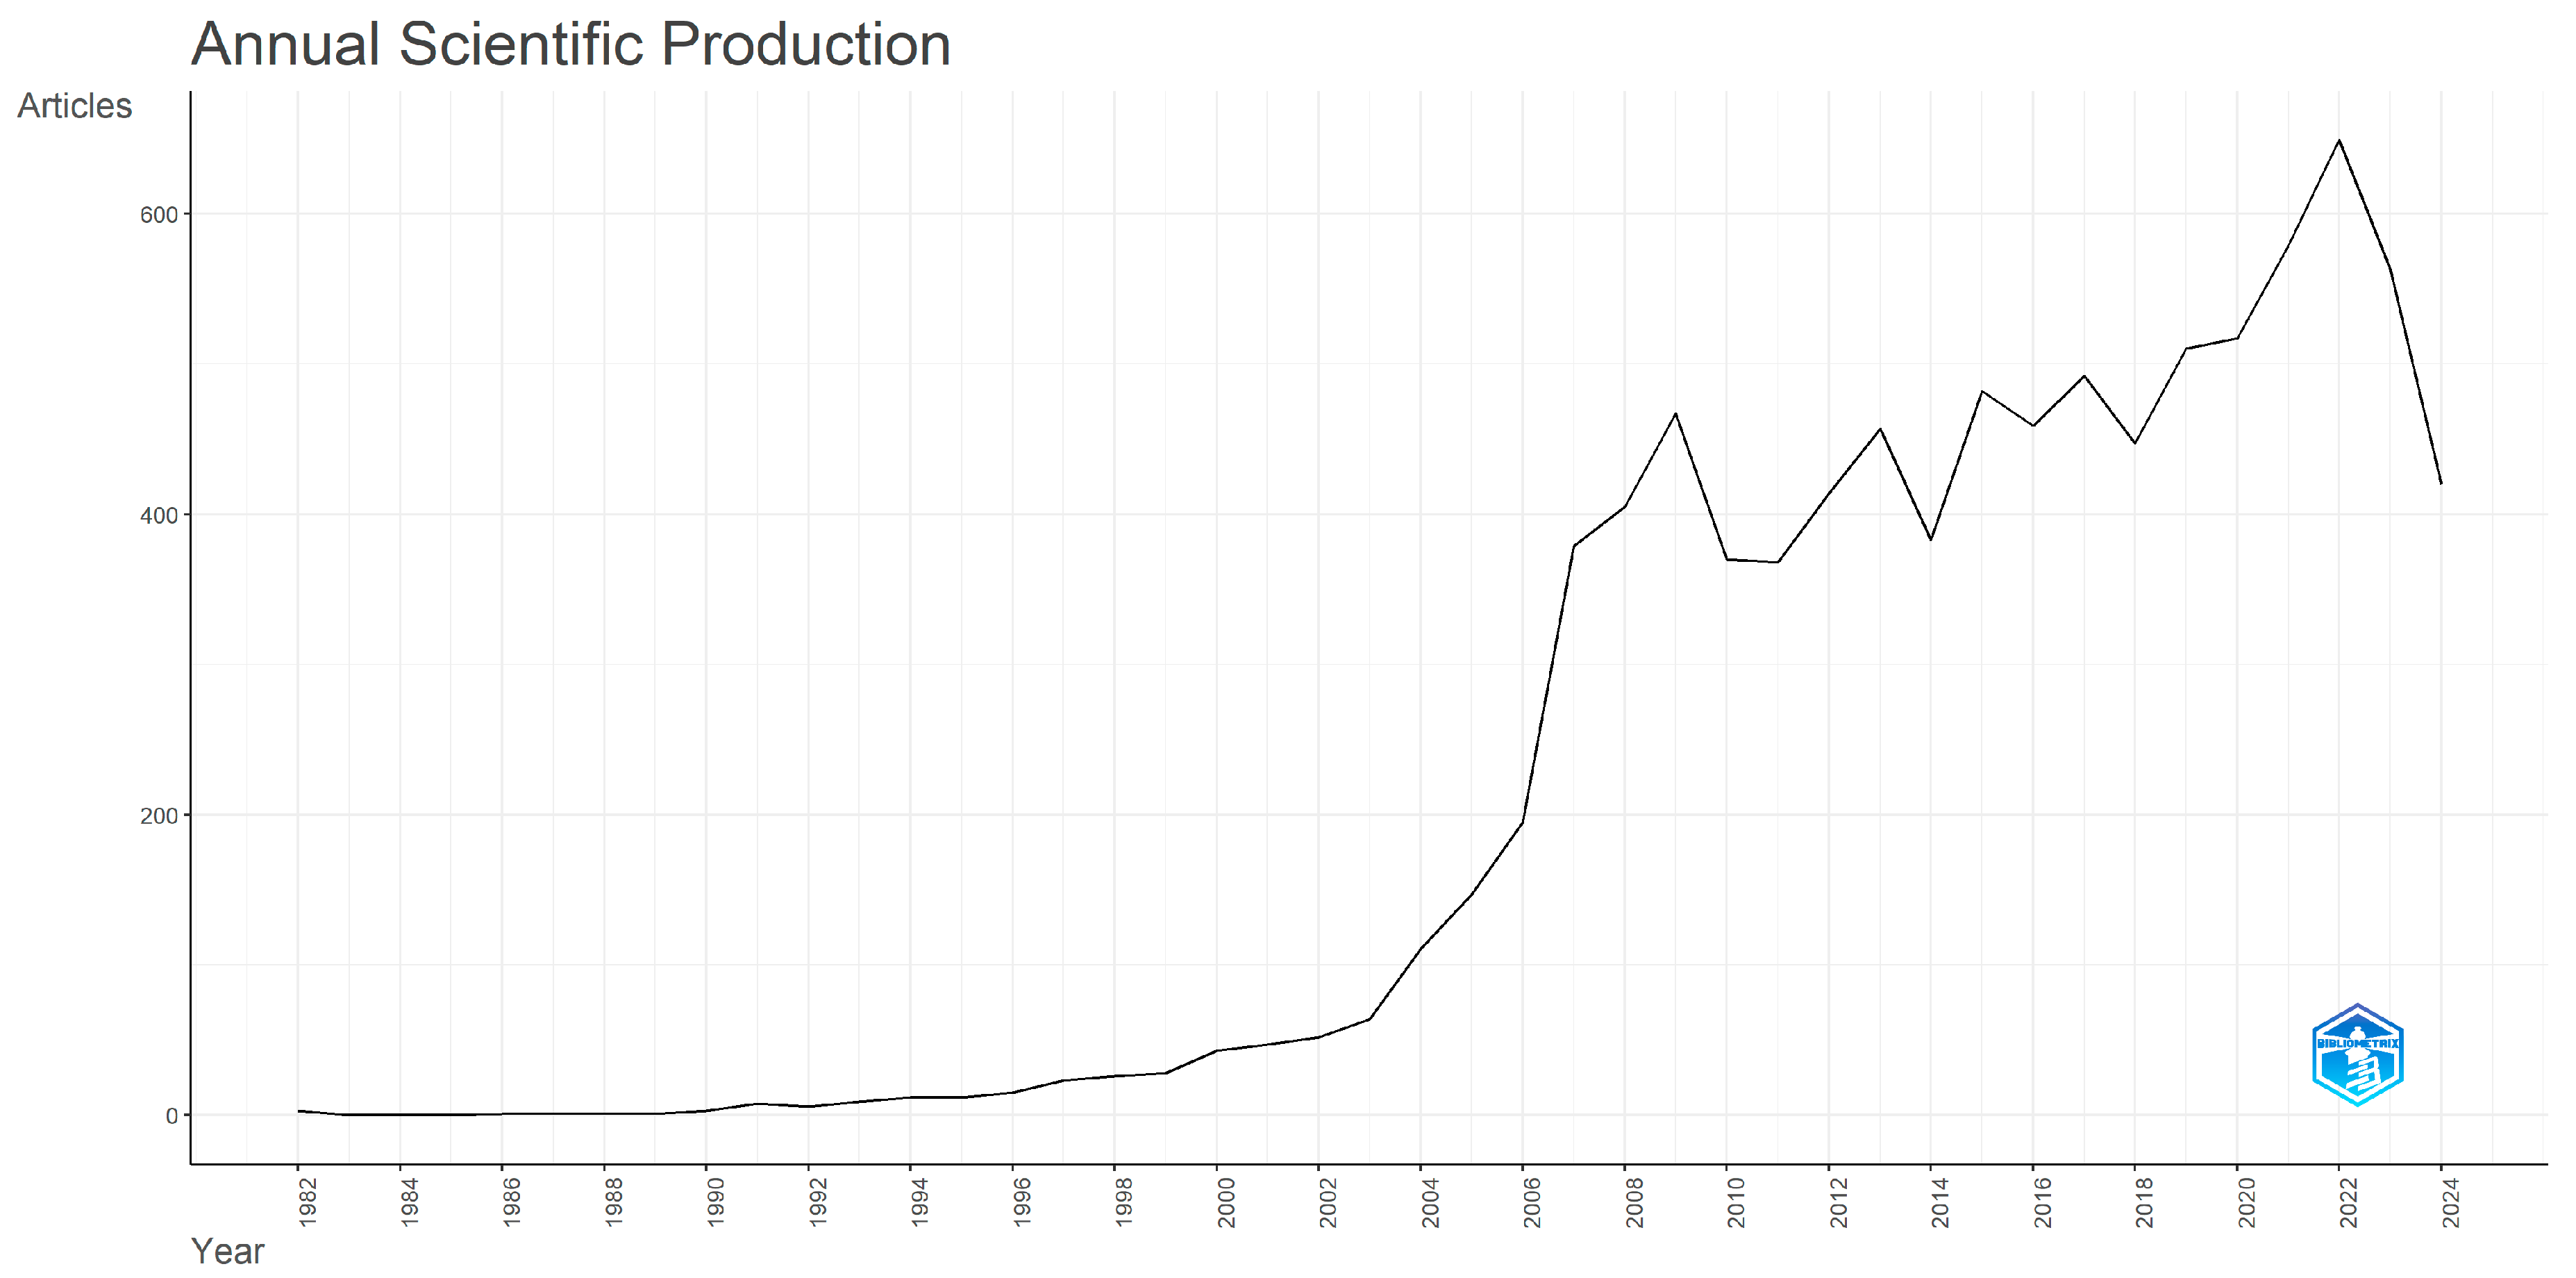
Figure 2 explores the yearly scientific production of grey system documents.
The first three articles were published in 1982 and the next one was published in 1986. Starting with 1993, when nine articles were released, the trend started to increase in a positive manner, with twelve articles in 1994 and 1995, and fifteen in 1996, achieving 47 in 2001. The trend growth exponentially in 2004 when, from 64 documents in 2003, it grew to 111 in 2004, achieving a total in 2009 of 467 publications. Between 2012 and 2020, the annual production rate was between 400 and 500, and in 2021, the level rose a little to 579 papers. In 2022, 649 papers were published, representing the peak while, in 2023, there were 563 documents and, in 2024, 420 articles. Prakash et al. [
30] evaluated the grey systems theory publications that had been released between 2011 and 2021. The trend of the publications was positive up to 2020, starting with 25 in 2011 and achieving a peak in 2020 with 60 papers published. In 2021, there was a decrease from 60 papers to 31.
Similar results have been observed also by Wani and Ganaie [
32], who investigated the same timespan, between 2011 and 2021, and the same topic, grey systems. In 2011, 201 papers were published, and the peak was achieved in 2020, with 606 papers published. In 2021, there was a small decrease, from 606 to 547 articles. In our case, there was also a positive trend during the timespan, having several decreases, but the peak was registered in 2022, followed by a significant decrease, which may be explained by the keywords that were included into the extraction step. The outcomes of our paper and the investigated articles from the academic community follow a similar pattern.
With all this, it shall be mentioned that the increased interest in research in a particular research area might also be affected by the general trend that favourises the scientific publication number, which might be due to a continuous increase in the number of research institutes and researchers that are pursuing research careers, as Ofer et al. [
33] and Vincent-Lacrin [
34] pointed out in their work. Furthermore, the expansion of the Web of Science Core Collection might have been another cause for the growth in the number of publications [
35].
Figure 3 presents the average yearly citations. The highest value was registered at the beginning of the timespan, in 1982, with a value of 25.2 citations per year. The value decreased significantly between 1982 and 1986, achieving an average citation rate of 0.9 in 1986. Until the end of the timespan, the citations values were between 0.5 and 3.5 with small periods of peaks.
3.2. Source Investigation
The focus in the second section is to understand which the most relevant sources are based on Bradford’s Law, the number of documents, and local impact by using the HirscH index.
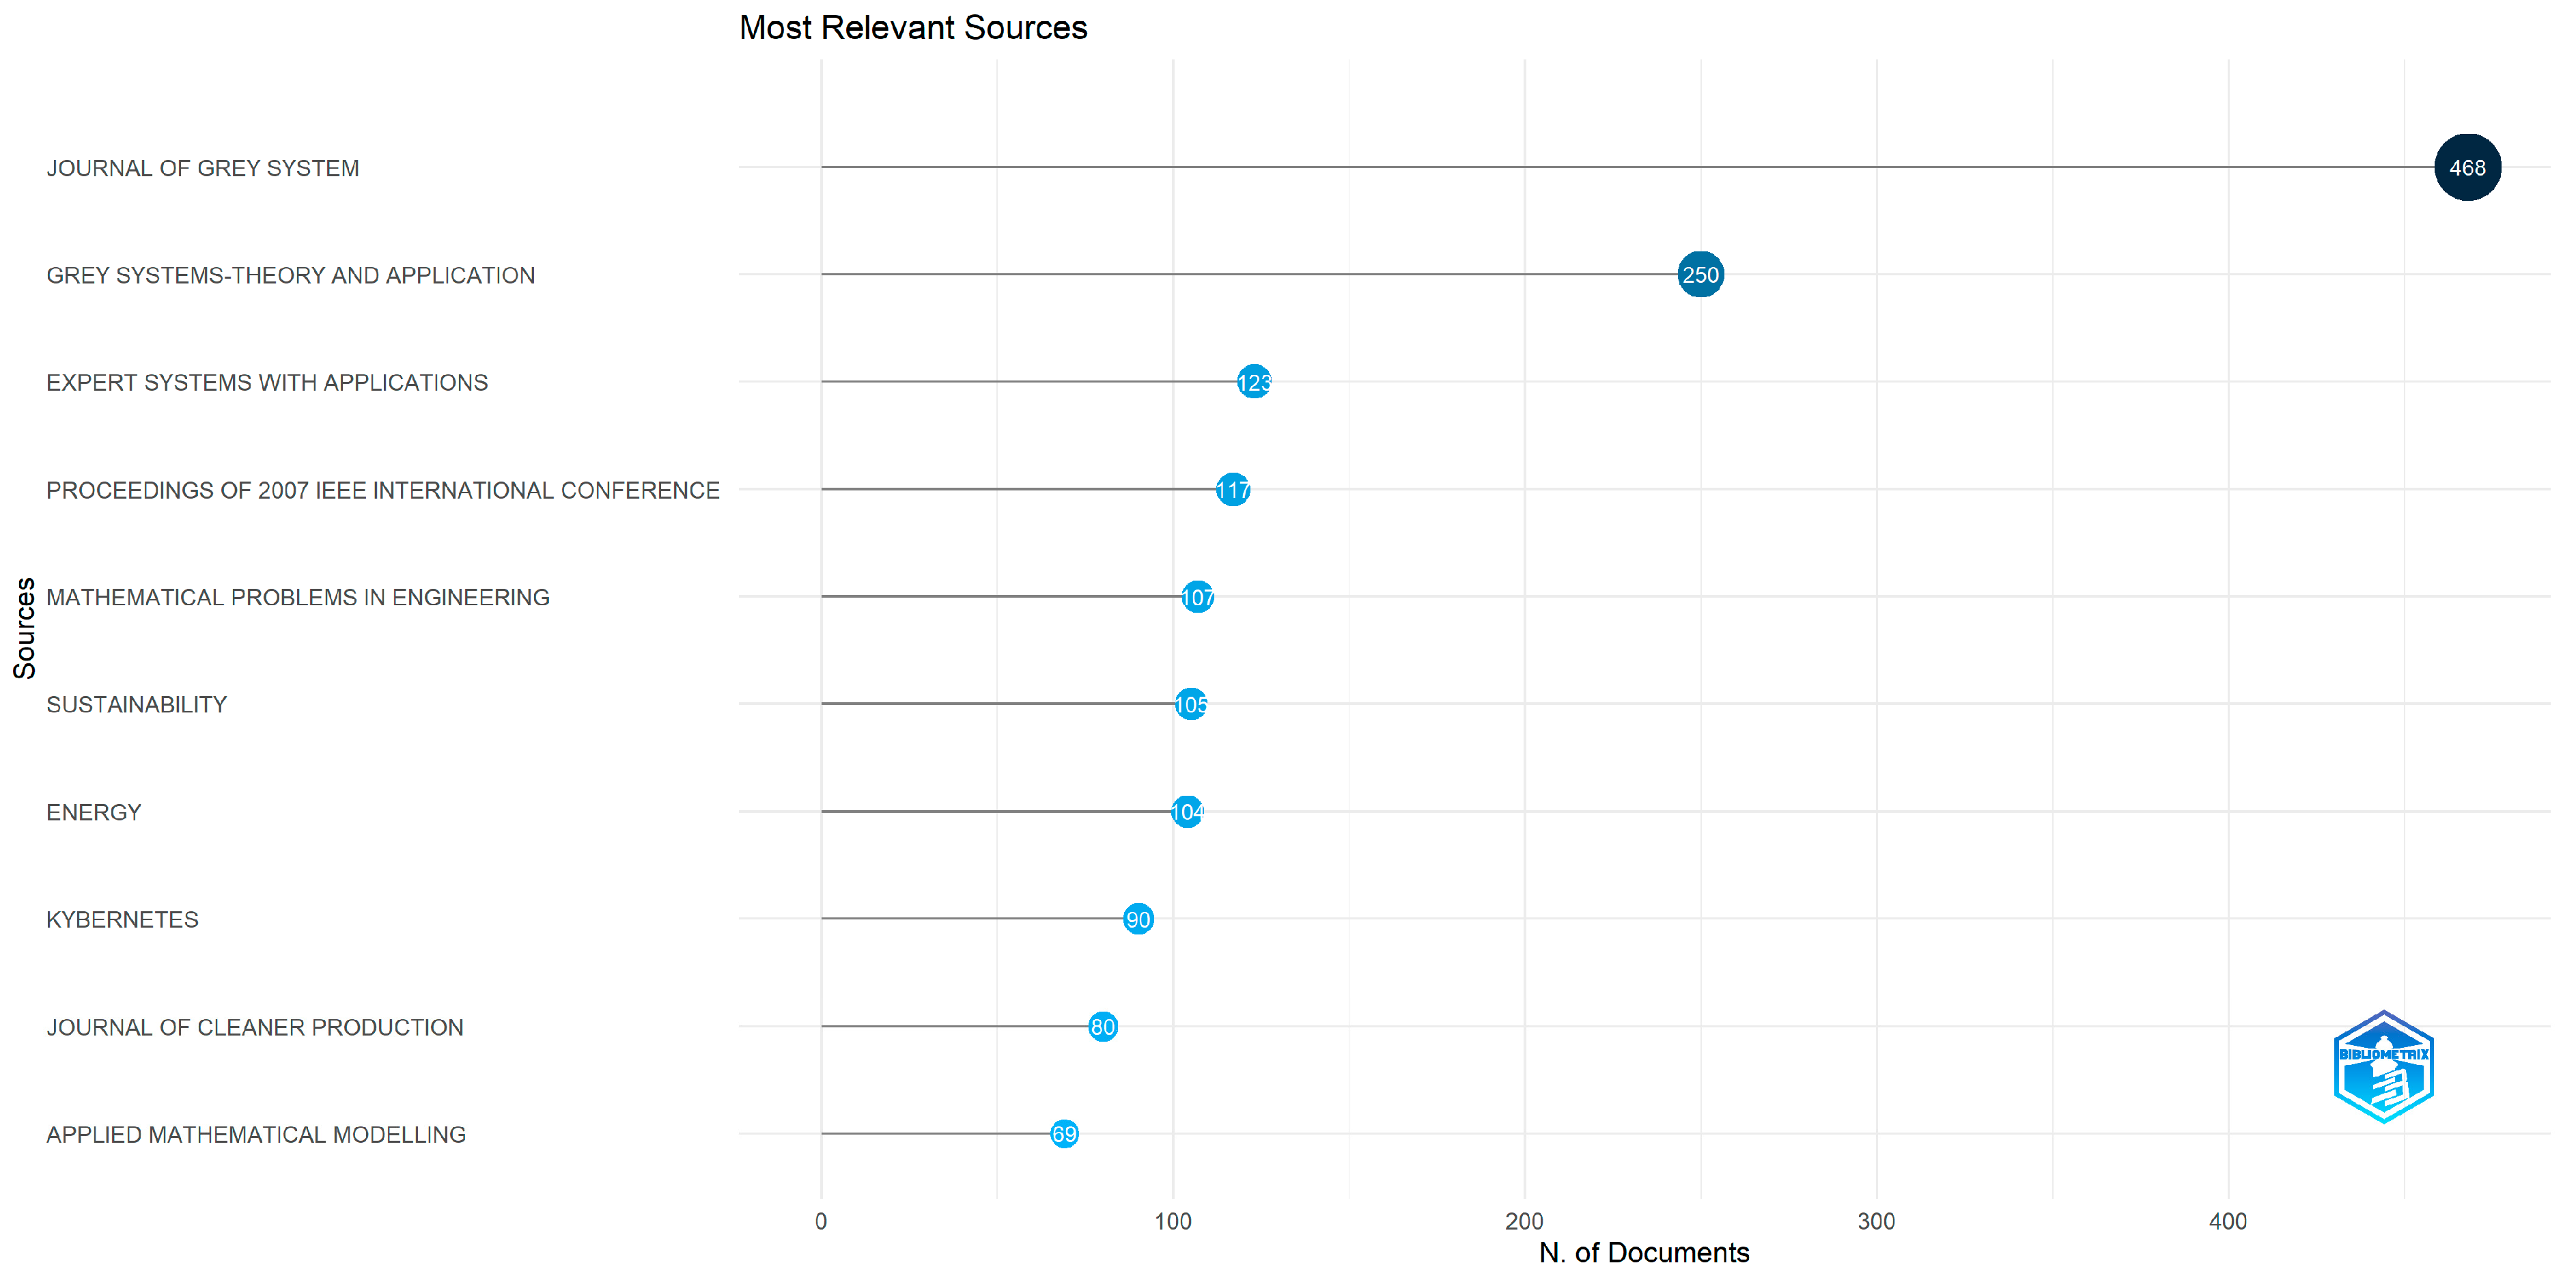
Figure 4 described the top 10 most relevant sources based on the numbers of publications. In first place, with 468 articles, is
Journal of Grey System, followed by
Grey Systems: Theory and Application with 250 papers and
Expert Systems with Applications with 123 documents. In fourth place is
Proceedings of 2007 IEEE International Conference on Grey Systems and Intelligent Services, Vols 1 and 2 with 117 publications while
Mathematical Problems in Engineering released 107 articles,
Sustainability 105 documents, and
Energy 104 articles. The last three journals are
Kybernetes, Journal of Cleaner Production, and
Applied Mathematical Modelling, which published 90, 80, and 69 documents. Yin [
4] explored the grey systems theory domain from a bibliometric point of view between 1996 and 2010, and some of the most relevant journals were
Journal of Grey System, Expert System with Applications, Energy, and
Applied Mathematical Modelling. Wani and Ganaie [
32] evaluated the grey systems theory topic from a bibliometric perspective, discovering that
PloS ONE was the most representative journal with 98 articles, followed by
BMJ Open with 65 papers,
Environmental Evidence with 44 articles, and
Sustainability with 37. There were also similar journals with our results, such as
Journal of Cleaner Production, Expert Systems with Application, and
Grey Systems: Theory and Application, but their impacts were much reduced. It can be stated that there are specific publications where authors publish scientific papers related to the grey systems topic regardless of the topic, but due to the expansion of the domain and limited timespans that have been analysed by other authors, there are journals that have not been included in our top 10.
With regard to the journals listed in
Figure 4, a further analysis has been conducted on WoS and the data in
Table 5 have been retrieved. It should be mentioned that in
Table 5, only the journals listed in the last WoS report [
36] have been provided. As can be observed, the top sources belong mainly to four publishers, namely, Elsevier, Emerald Gorup, MDPI, and Research Information. Most of the sources are indexed in well-quoted journals listed in the first quartiles of the
2023 WoS Journal Citation Report with respect to the journal impact factor (JIF) while having good scores in terms of the article influence score (AIS) values.
Figure 5 contains the most significant journals based on the number of citations, isolating the journals with smaller numbers of citations. Using the Bradford’s Law method, the journals have been separated into three different categories by taking into account the numbers of documents and the rule that each category must contain the same number of documents. In the final step, Bradford’s Law clustered proportionally with 1:n:n
2 as Yang et al. [
37] explained. There are numerous journals that have been included with Bradford’s Law, and the most crucial ones, based on the numbers of papers, are
Journal of Grey System with 468 papers,
Grey Systems: Theory and Application with 250 documents,
Expert Systems with Applications with 123 articles,
Proceedings of 2007 IEEE International Conference on Grey Systems and Intelligent Services, Vols 1 and 2 with 117 publications, and
Mathematical Problems in Engineering with 107 papers. Delcea et al. [
27] evaluated the grey systems theory domain between 1987 and 2021, investigating a total of 1624 documents. On Bradford’s Law, the authors found that
Journal of Grey System, Sustainability, Expert System with Applications, Journal of Cleaner Production and
Energy were the most representative journals in the analysed area.
Figure 6 details the most relevant local sources based on the value of the H index. The H index is used in order to differentiate local and global citations. Global citations refer to citations that have been obtained from “all over the world” while local citations refer to the number of references obtained from articles included in a collection, as is explained on the Bibliometrix webpage [
38]. The H index calculates the total number of papers that have the source cited at least the same number of times [
39]. The G index is an improvement of the H index, taking into consideration only unique greatest numbers, wherein the top g papers have received, together, at least g
2 citations [
40].
Based on the H index and G index values, the most significant journal is Energy, which has an H index value of 46 and a G index value of 84, followed by Expert Systems with Applications with an H index of 39 and a G index of 69. In third place is Journal of Cleaner Production with an H index of 38 and a G index of 64, followed by Applied Mathematical Modelling with an H index value of 34 and a G index value of 57. The rest of the journals have smaller impacts but are worthy of being mentioned: Applied Soft Computing (21 H index, 29 G index), Grey Systems: Theory and Application (21 H index, 31 G index), International Journal of Advanced Manufacturing Technology (21 H index, 39 G index), Computers & Industrial Engineering (20 H index, 28 G index), Journal of Grey System (20 H index, 30 G index), and Sustainability (19 H index, 28 G index).
Furthermore, according to the
2023 WoS Journal Citation Report [
36], the local sources listed in the top contributors mainly belong to Elsevier, with most of them scoring high JIF values, and most of them are being listed in the top quartile based on JIF values or AIS values—please consider the information in
Table 6. As the JIF distribution has been used for comparing different journals across various domains, the importance of the indicator has increased over time [
41].
3.4. Countries’ Investigation
The most relevant affiliations and countries are extracted based on the numbers of papers and citations. The world collaboration map will be evaluated, extracting the 10 most significant collaborations between countries.
Figure 9 details the 10 most influential affiliations based on the number of publications. In first place, with the greatest number of articles is the
Nanjing University of Aeronautics and Astronautics with 821 documents, followed by the
Chinese Academy of Sciences and the
North China Electric Power University, having 238 and 220, respectively. In fourth place is the
Wuhan University of Technology with 216 articles while
Assistance Publique Hopitaux Paris (APHP) is fifth with 185 papers. In sixth place is another university from France,
Universite Paris Cite with 150 documents, followed by the
Hebei University of Engineering and the
University of California System with 149 and 142 documents. The last two universities are the
University of Toronto and the
Nanjing University of Information Science and Technology with 139 and 137 publications. According to Pan et al. [
28], the
Nanjing University of Aeronautics and Astronautics is the most significant affiliation based on the number of publications, with a total of 434 articles, followed by the
North China Electric Power University (166 articles),
Wuhan University of Technology (113 articles), and
Chinese Academy of Sciences (77 articles). Other relevant affiliations are
De Montfort University (42 articles) and
the Hebei University of Engineering (40 articles). Prakash et al. [
30] extracted the
Nanjing University of Aeronautics and Astronautics as the most influential affiliation in the grey system sector with a total of 124 papers, followed, at a difference of 100 papers, by the
Henan Agricultural University with only 24 articles, the
Nanjing University of Informatic Science and Technology with 22 articles, the
Shantou University with 17 documents, and
De Montfort University, which published 15 papers. Most of the
Nanjing University popularity is thanks to Liu S. F., who published the most articles, and they are one of the most influential authors in the topic of grey systems, with hundreds of articles published. Alongside Liu S. F., there are also numerous important authors who contributed significantly to the evolution of grey systems theory such as Xie NM or Yang Y. J. However, as a consequence of the field’s development, grey systems has now a multitude of applications in numerous industries, which could represent a reason why our research has had different results from the existing academic-community papers regarding the most influential affiliations.
Figure 10 includes the 10 most representative countries based on the total number of SCPs (Single-Country Publications) and MCPs (Multiple-Country Publications). In first place is China, with the greatest number of articles published, having a total of 7487 documents, with 6904 SCPs (92.2%) and 583 MCPs (7.8%). China has a proportion of 81.7% of the total documents published in the grey systems domain, showing the interest and importance of Chinese authors. In second place is India, with 240 documents, with a global contribution of 2.6%, having 211 SCPs (87.9%) and 29 MCP articles (12.1%). In third place is the USA, with 175 publications; 113 documents are SCPs (64.6%) and 62 MCPs (35.4%), representing only 1.9% of the total articles. In fourth and fifth place are Iran and Turkey with 123 and 107 papers. Iran’s contribution is around 1.3% while Turkey’s contribution is approximately 1.2%. Turkey has more SCPs, ninety-eight in total (91.6%), compared to Iran, which has ninety-four papers (76.4%), while Iran has more MCPs, twenty-nine in total (23.6%), compared to Turkey, which has nine (8.4%). In sixth place is the UK, with 84 documents, 44 SCPs (52.4%), and 40 MCPs (47.6%), having the highest percentage of MCPs, indicating the lack of experience for the UK, which has collaborated with international authors more experienced in the grey systems domain, representing 0.9% of the total articles published. Japan is seventh, with 70 documents, having a small contribution of 0.8%, with 54 SCPs (77.1%) and 16 MCPs (22.9%) articles. Poland and Canada are in eighth and ninth places, with 59 and 53 documents, having a contribution of 0.6%. Poland released fifty SCPs (84.7%) and nine MCPs (25%) while Canada published 36 SCPs (67.9%) and 17 MCPs (32.1%). The last country in the top 10 is Romania, with 47 documents published, 33 SCPs (70.2%) and 14 MCPs (29.8%). The contribution of Romania is only 0.5%. According to the academic community, China is the most representative country based on the number of publications, having a total of 1038 papers, followed by India with 357 articles, Turkey with 78, the USA with 63, and Iran with 46 documents [
42]. Pan et al. [
28] found that China has the highest impact on the grey systems area, with a total of 4433 documents released, followed by the USA with only 146, England with 87, India with 65, Japan with 64, Turkey with 51, Canada with 44, and Iran with 41.
Besides the fact that in the case of grey systems theory, the home country of the theory is China, it should be mentioned that, in general, in the scientific output in the last years, a dominance of Chinese researchers has been observed as acknowledged by the scientific literature. For a comprehensive discussion related to this issue, please consider the recent works from the field of scientometrics [
43,
44,
45].
Figure 11 explores the most cited countries. In first place is China with 74,567 citations and an average article citation rate of 10, followed at a significant difference of 69,705 citations by the USA with only 4862 citations and an average article citation rate of 27.80. In third place is India with 4686 citations, having an average article citation rate of 19.50, followed by Turkey with 3626 citations and an average article citation rate of 33.90. The UK is fifth with 2958 citations and an average article citation rate of 35.20 while Canada has 2342 citations and 44.20 average article citations. The last four countries have less of an impact but are worthy of mentioning: Iran (1699 citations, 13.80 average article citations), Japan (1490 citations, 21.30 average article citations), France (1434 citations, 42.20 average article citations), and Australia (1185 citations, 38.20 average article citations). According to similar papers that have been found in the academic community, Delcea et al. [
27] found that China is the most cited country with a total of 26,861 citations, followed by Turkey (2237 citations), India (2205 citations), the USA (2079 citations), Canada (1747 citations), Lithuania (897 citations), Iran (833 citations), Japan (705 citations), Denmark (456 citations), and Australia (437 citations) [
27]. Based on Prakash et al.’s [
30] results, China has the most number of citations, with a value of five-hundred-and-three, followed by Iran with only eighty-one, India with sixty-four, Turkey with forty-three, Libya with twelve, and the USA with eight citations. Wani and Ganaie [
32] explored the grey systems theory literature by using the R programming language and VOSViewer, and according to them, the most impactful country is the USA with 29,830 citations, followed by the UK with 19,810, Canada with 14,090, Australia with 1020, and China with 6335 citations. The results were partially similar in two papers: China was the most representative country, similar to our results, while in the last paper, the USA was the most cited country. India and Turkey appeared as relevant countries in multiple papers, showing the interest of the authors in the grey systems topic. At the same time, there are different results such as those showing the USA in first place, Libya, or the missingness of Denmark or Japan from the top list of the countries.
Figure 12 includes the countries’ collaborations. The most fruitful collaboration was between China and the USA, creating, together, a total of 235 publications, followed by that between China and the UK, with 164 papers.
The next collaborations had smaller numbers of papers but are still worthy of being mentioned: China–Canada with 51 papers, China–Australia with 50 papers, China–Japan with 35 papers, China–Pakistan with 27 papers, the USA–the UK with 27 papers, China–Singapore with 24 papers, China–Korea with 23 papers, and China–Vietnam with 22 papers.
Considering similar works from the field, it has observed that Delcea et al. [
27] presents China as the country with the most connections, publishing 67 papers with the USA, 37 with the UK, 19 with Australia and Canada, 14 with Pakistan, and 13 with Iran. Furthermore, Prakash et al. [
30] investigated grey systems using a bibliometric analysis. The country with the highest number of publications was China, followed by India, Iran, Turkey or Poland, and Libya. Pan et al. found China, the USA, England, India, Italy, Iran, France, the Netherlands, and Japan as the countries with the highest collaboration between 1991 and 2018, confirming a part of our results. Indeed, China, the USA, the UK, and Japan were identified as the most representative countries in our results, but at the same time, there were different results, such as those with Italy, France, the Netherlands, or Iran, most probably due to the extraction process that included different papers.
3.6. Mixed Analysis
In this section, the focus will be on thematics that are included in grey systems theory papers, together with the factorial analyses, WordClouds, collaboration networks of the authors, and which are the most used bigrams and trigrams in titles and abstracts.
Figure 13 describes the most influential Keywords Plus, grouped in three clusters based on the thematics. On the top right part of the graph, in Motor Themes, is the highest cluster, which has high density and centrality values. The cluster focuses on grey system applicability areas and statistical methods: “prediction” (473 appearances), “China” (238 appearances), “algorithm” (212 appearances), “consumption” (206 appearances), “demand” (189 appearances), “energy-consumption” (187 appearances), “forecasting-model” (146 appearances), “electricity consumption” (140 appearances), “prediction model” (130 appearances), and “co2 emissions” (115 appearances). The presence of China in the cluster outlies how crucial Chinese authors have been to the evolution of the grey systems domain. The second cluster, coloured green, is in the middle of all four quadrants, having medium density and centrality values. The cluster express the main steps that must be applied in order to use grey systems: “model” (717 occurrences), “performance” (247 occurrences), “management” (223 occurrences), “selection” (187 occurrences), “systems” (171 occurrences), “design” (157 occurrences), “framework” (97 occurrences), “relational analysis” (89 occurrences), “quality” (84 occurrences), and “decision-making” (81 occurrences). In the bottom left part of the graph is the smallest cluster, the red one, which has reduced values for density and centrality. The most representative terms included in cluster are “optimization” (314 appearances), “system” (304 appearances), “impact” (108 appearances), “efficiency” (71 appearances), “grey” (71 appearances), “network” (70 appearances), “energy” (69 appearances), “time” (56 appearances), “behavior” (53 appearances), and “simulation” (50 appearances). Similar results were observed in the paper published by Prakash et al. [
30], with “model”, “optimization”, “performance”, “prediction”, “algorithms”, and “management” as the main keywords utilized in grey systems.
Figure 14 includes the thematic map of authors’ keywords, grouped in two clusters.
The blue cluster, which is in the bottom right part of the graph, in the Basic Themes quadrant, shows a small value for density and a high centrality value. The terms that are part of the blue cluster are related to the grey systems area: “grey model” (614 appearances), “grey system” (374 appearances), “grey prediction” (353 appearances), “prediction” (269 appearances), “forecasting” (268 appearances), “grey prediction model” (211 appearances), “genetic algorithm” (117 appearances), “gm(1,1) model” (117 appearances), and “neural network” (113 appearances). In the opposite part of the graph is pointed out the second cluster, with the red colour and which is much smaller, which is focusing on grey methods and applications such as “grey theory” (603 occurrences), “grey system theory” (516 occurrences), “grey relational analysis” (220 occurrences), “grey clustering” (133 occurrences), “grey incidence analysis” (127 occurrences), “grey system theory” (103 occurrences), “grey systems” (99 occurrences), “uncertainty” (99 occurrences), and “grey number” (94 occurrences). Prakash et al. [
30] had similar results while investigating grey systems, finding ”model” or “grey algorithms”, while Pan et al. [
28] considers, as the most relevant keywords in grey systems theory, “grey model” and “forecasting accuracy”.
Figure 15 explores the 100 most used Keywords Plus, grouped in three clusters. The most significant cluster is coloured in red and focuses on applicability domains such as “electricity consumption”, “natural gas”, “energy consumption”, and “climate change” by using grey system methods such as “swarm particle optimization”, “classification”, or “regression” in order to minimize the “risk”. Also, “China” is part of the red cluster, showing the importance of the country in the evolution of the grey systems area. The blue cluster, which contains fewer terms, focuses on the supply chain domain, one of the areas where grey system applications have offered great results. The most representative terms are “supply chain”, “management”, “supplier selection”, and “ahp” and “dematel” methods, which facilitate the decision-making processes by taking into consideration multiple criteria and supporting business goals. The last cluster, the green one, refers to “carbon emissions”, which could affect “countries” and their “economic growth”. A factorial map has been implemented also by Delcea et al. [
27], pointing out “energy consumption”, “sustainable development”, “electricity consumption”, “economic growth”, and “economic development” as the main keywords.
Figure 16 details the factorial analysis of 100 title terms, which have been grouped in three different clusters. In
Figure 16, the red cluster, which is the most representative, includes various terms related to grey systems, such as “networks”, “evaluation”, “relational”, or application domains “supply”, “control”, “estimation”, “research”, “risk”, and “industry”, or methods including “fuzzy”, “fault”, “gm”. The second cluster, coloured in blue, is smaller compared to the red one, but it is also crucial, containing information about the most productive country in theacademic domain, China, and various grey system methods such as “nonlinear”, “optimized”, and “discrete” and noting where the methods have the highest accuracy: “electricity”, “consumption”, “carbon”, “emissions”, “gas”, and “demand”. The green cluster, which is the smallest, expresses information about “neural network” and “short term memory” methods.
Figure 17 includes the thematic evolution for Keywords Plus in three different time periods, between 1982 and 2000, 2001–2015, and 2016–2024. For the first period, the most used keywords are “
algorithm”, “
optimization”, “
system”, “
energy transfer”, “
uncertainty”, and “
models”. Between 2001 and 2015, “
algorithm”, “
optimization”, “
system”, and “
energy transfer” were replaced by “
model” while “
uncertainty” was replaced with “
performance” and “
models” remained unchanged. In the last period, between 2016 and 2024, “model” was divided into two parts: it was kept as “
model” but also used “
prediction”. The “
performance” keyword was replaced with “
model” while “
models” was replaced with “
risk”. The thematic evolution has been defined also by other authors of the academic community, illustrating the evolution of the domain, which began with generic terms and evolved into specific and technical keywords [
27].
Figure 18 is correlated with
Figure 17, representing the thematic map of the Keywords Plus included in thematic evolution. There are three clusters, with different terms included and different sizes, divided based on their importance. The most significant cluster is presented at the border of the Basic Themes quadrant and Motor Themes, with a high centrality and a medium density. The most used terms that are part of the cluster are “
prediction” (334 occurrences), “
optimization” (241 occurrences), “
China” (216 occurrences), “
system” (203 occurrences), “
consumption” (192 occurrences), “
algorithm” (155 occurrences), “
demand” (150 occurrences), “
electricity consumption” (138 occurrences), and “
forecasting-model” (120 occurrences). The second cluster, coloured green, is at the border between Emerging or Declining Themes and Basic Themes, with a very small value for density and a medium value for centrality. The most representative Keywords Plus are “
model” (558 appearances), “
management” (223 appearances), “
performance” (202 appearances), “
selection” (145 appearances), “
impact” (136 appearances), “
design” (109 appearances), “
framework” (88 appearances), “
systems” (88 appearances), “
quality” (72 appearances), and “
decision-making” (59 appearances). The last cluster, which is on the top left part of the graph, has a small value for centrality and a high value for density. The most relevant terms are “
risk” (135 occurrences), “
survival” (95 occurrences), “
mortality” (89 occurrences), “
outcomes” (69 occurrences), “
disease” (58 occurrences), “
diagnosis” (51 occurrences), “
health” (44 occurrences), “
association” (43 occurrences), “
prevalence” (37 occurrences), and “
epidemiology” (33 occurrences). According to the a segment of the academic community that has been studying the grey systems field, the most representative terms for thematic evolution are “model”, “performance”, “management”, “optimization”, and “prediction”, which confirms the outcome discovered during bibliometric analysis [
30].
Figure 19 explores the collaboration network involving the 50 most influential authors. There are nine clusters presented, which will be detailed separately. The first cluster, coloured in green, contains nine authors: Liu S. F., Xie N. M., Yang Y. J., Fang Z. G., Wu LF., Chen Y., Zhang K., Mi CM., and Wang H. Liu S. F. is pointed out among the rest of the authors, which represents the importance of the author in the domain, having numerous articles published on the commercial aircraft domain by forecasting the costs or analysing the measures of information for grey numbers or predicting the lifetime of mica paper capacitors. Liu S. F. also analysed the supply chain management domain by using multiple attributes for decision-making on the mean values of grey numbers or to predict energy consumption using grey models [
50,
51,
52,
53,
54]. Xie N. M. focused on uncertainty information and the representation measurement of grey numbers, the construction of whitenisation mechanism functions, and the applicability using the grey clustering method; a grey incidence cluster model was used to identify the complex equipment’s development cost [
55,
56,
57]. Mi C. M.’s research was on using grey nonlinear clusters in order to investigate the credibility level of trustworthy software, analysing the supply chain domain by using multiple attributes for decision-making for the mean values of grey numbers and clustering the whitenisation weight function using grey methods [
54,
58,
59].
The second cluster, coloured in blue, is formed by only two authors: Xiao X. P. and Duan H. M. The focus of the authors was on short-term traffic and traffic flow mechanisms using grey systems [
60,
61,
62].
The third cluster, coloured in red, contains 25 authors: Wang Y., Zeng B., Liu Y., Zhang Y., Wang L., Zhang L., Wang J., Liu J., Ma X., Li Q., Zhang J., Li J., Li L., Li H., Luo YX., Chen L., Wang X., Wang C., Luo D., Yang Y., Wang Z. Y., Wang Q., Li C., Wang J. Z., and Wang W. The majority of the authors are from China, and the focus was on the optimum allocation of water while taking into account the uncertainties, biogas forecast, main power grid prediction and policies in China, hazard assessment using grey systems, irrigation control technology, energy production in China, and many other applications [
63,
64,
65,
66,
67,
68].
The fourth cluster, coloured in pink, contains eight authors, Dang Y. G., Li Y., Wang ZX., Wang Y. H., Li XM., Liu B., Ding S., and Wang J. J, focusing on virtual machine consolidation strategy together with energy-awareness for cloud computing platforms by using grey models, building and solving the whitenisation weight function by using grey numbers, and calculating the degree of greyness for grey numbers [
69,
70,
71].
The last five clusters, numbers 5 (coloured in orange), 6 (coloured in brown), 7 (coloured in pink), 8 (coloured in grey), and 9 (coloured in turquoise), contain only 1 author each: the orange cluster is formed by Liu C., the brown cluster contains Hu Y. C., the pink cluster contains Nagai M., the grey cluster is formed by Xie W. L., and the last cluster contains Li G. D. The authors explore the possibility of predicting the energy consumption or forecasting using the interval grey method for energy demand, predicting machining accuracy, forecasting the retail sales of consumer goods by using the discrete grey polynomial model, or identifying the solution of the supplier selection problem using grey methods [
65,
72,
73,
74,
75].
Table 9 contains the bigrams that are pertinent to investigating the grey systems domain, removing those that are synonyms and related to search terms. The first two columns focus on title bigrams while the last two are on abstracts. The first and third bigrams are describing the key parts of grey systems, “
grey model” with 744 appearances and “
system theory” with 346 occurrences. The terms “
prediction model” (401 appearances), “
model based” (322 appearances), “
neural network” (285 appearances), “
relational analysis” (160 appearances), “
time series” (107 appearances), and “
evaluation model” (88 appearances) focus on the statistical and mathematical approach of the domain. Two of the main applications of grey systems are also detailed: “
energy consumption” (141 appearances) and “
supply chain” (96 appearances). On the right part of the table are presented the 10 most used bigrams in abstracts, which can be divided into three categories: the first one includes grey system information with terms such as “
grey model” (2711 occurrences) or “
system theory” (1552 occurrences), the second category encapsulates the statistical methods with terms such as “
prediction model” (1976 occurrences), “
neural network” (1307 occurrences), “
proposed model” (953 occurrences), “
prediction accuracy” (885 occurrences), “
time series” (832 occurrences), “
forecasting model” (693 occurrences), and “
experimental results” (546 occurrences), and the last cluster includes the “
energy consumption” area, where grey systems have been successfully applied. Delcea et al. [
27] evaluated grey systems theory, extracting the most representative bigrams for titles and abstracts as the following: “
grey model” (357 appearances), “
energy consumption” (328 appearances), “
supply chain” (231 appearances), and “
prediction model” (229 appearances). They showed an overlap between the identified bigrams for grey systems theory.
Table 10 presents the most used trigrams. In the first two columns, the titles are described, and in the last two, the abstracts are detailed. The most relevant trigrams are “
grey system theory” (300 occurrences), “
grey prediction model” (213 occurrences), “
prediction model based” (55 occurrences),“
neural network model” (41 occurrences),“
particle swarm optimization” (38 occurrences),“
support vector machine” (31 occurrences),“
power load forecasting” (29 occurrences),“
natural gas consumption” (24 occurrences),“
artificial neural network” (23 occurrences), and “
carbon dioxide emissions” (22 occurrences). On the right side of the table are detailed the most used trigrams in abstracts. In first place is “
grey system theory”, which appeared 1304 times, followed by ”grey
prediction model” with 810 occurrences. In third place is “
bp neural network” with 273 appearances while “
particle swarm optimization” and “
evaluation index system” appeared 263 and 181 times. The rest of the trigrams have smaller numbers of appearances but are worthy of mentioning: “
artificial neural network” (161 appearances), “
prediction model based” (136 appearances), “
natural gas consumption” (117 appearances), “
hierarchy process ahp” (113 appearances), and “
relational analysis gra” (109 appearances). In both titles and abstracts, the focus was especially on grey theory, expressing the main characteristic of the area and how to use it, presenting also algorithms and real examples where the models offered great results. According to Delcea et al. [
27], the most representative trigrams for titles and abstracts in the case of grey systems used in economic studies are “
grey system theory” (131 appearances), “
grey prediction model” (113 appearances), “
particle swarm optimization” (
38 appearances), “
hierarchy process ahp” (
113 appearances), and “
relational analysis gra” (
18 appearances), highlighting, once more, the overlapping of the identified trigrams in titles and abstracts, underscoring the unicity of the keywords associated with the studies from various disciplines in the case of grey systems theory.
Figure 20 explores the top 50 most used authors’ keywords and Keywords Plus. Using the Biblioshiny library, which is part of the R programming language, WordClouds have been created, providing graphical representations of the most frequently used terms. The size of the text reflects the number of appearances. On the left part are presented the 50 most used authors’ keywords. The most used term is “
grey model” with 616 appearances, followed by “
grey theory” and “
grey system theory”, with 603 and 516 occurrences. In fourth place is “
grey system” with 374 occurrences, and “
grey prediction” is fifth with 353 occurrences. The rest of the terms have fewer than 300 appearances but are worthy of mentioning: “
prediction” (269 occurrences), “
forecasting” (268 occurrences), “
grey relational analysis” (220 occurrences), “
grey prediction model” (211 occurrences), and “
grey clustering” (133 occurrences). The most 50 used keywords on the right part are presented. In first place is “
model” with 717 occurrences, followed by “
prediction” with 473 appearances and “
optimization” with a frequency of 314. In fourth place is “
system” with 304 occurrences, followed by “
performance” with 247 appearances and “
China” with 238 occurrences. In seventh and eighth place are “management” with 223 appearances and “
algorithm” with 212 occurrences. The last two terms are “
consumption” with a frequency of 206 and “
demand” with a frequency of 189. Delcea et al. [
27] have discovered similar authors’ keywords and Keywords Plus as the most representative: “
model”, “
grey theory”, “
grey system theory”, “
grey prediction”, “
forecasting”, and “
performance”. Prakash et al. [
30] defined a WordCloud for the most utilized keywords between 2011 and 2021 as having “
grey systems”, “
grey systems theory”, “
decision making”, “
forecasting”, or “
grey incidence analysis”. Some of the keywords were common with the outcome that was extracted from our dataset, but at the same time, there were different keywords that have higher frequencies, with all of them being related to grey systems theory.
Lastly, an analysis regarding the connections between authors, their organisations, and the keywords used in the extracted dataset is depicted in
Figure 21. As can be observed, the authors included in the analysis are sometimes connected to more than one university while the keywords used are related, as expected, with various aspects from grey systems theory, such as grey systems in general, the grey model, grey incidence analysis, grey clustering, grey forecasting, and the grey GM(1,1) model.


