Abstract
Ecological security describes the capacity of ecosystems to maintain their integrity and resilience under anthropogenic and natural pressures. The Yangtze River Basin plays a critical role in China’s ecological security and economic growth. In this study, the spatiotemporal patterns and drivers of ecological quality indexes (EQIs) from 2000 to 2018 in the Yangtze River Basin were explored using spatial trend analysis and importance analysis. The results demonstrated that the EQI changes in the Yangtze River Basin showed an overall downward trend during the study period, while the regions with significant increases in EQIs were concentrated in the southwestern basin. Moreover, the differences between mega cities and ordinary cities were analyzed. The decline rate of the EQIs in mega cities was relatively smaller than that in ordinary cities. Additionally, anthropogenic drivers, including global artificial impervious area (GAIA) rate, population density, and gross domestic product (GDP), were identified as factors affecting environmental quality. Among them, the increase in the proportion of impervious areas was the most significant driver of environmental degradation in both mega cities and ordinary cities. The relatively important ecological driving factors varied in the two types of cities. This study provides a theoretical basis and decision support for green development in the Yangtze River Basin. In the future, policymakers should focus on the dominant factors affecting ecological quality and develop appropriate environmental management measures.
1. Introduction
Ecosystems provide the basic natural conditions and essential services for human survival, such as food production, carbon sequestration, soil and water retention, sandstorm prevention, and climate regulation [1,2,3]. Maintaining high ecosystem quality is an important foundation for human sustainable development. However, the growth of the global population, the intensification of human activities, and the development of socioeconomics have resulted in significant degradation of ecosystem quality [4,5,6]. Therefore, understanding the spatiotemporal dynamics of ecological quality and the underlying the driving mechanisms is of great practical significance for informed decision making, sustainable resource management, and environmental conservation in critically affected regions.
Ecological quality changes are closely related to multiple anthropic factors, such as significant population growth [7,8], rapid economic development [9,10], and land use change [11,12], which may give rise to climate change [13], biodiversity loss [14], and overconsumption of natural resources [15], posing significant threats to ecological quality. Many studies have considered urbanization a determinant of ecological quality [16,17,18]. However, as different driving factors have spatial heterogeneity [19], it is still unclear what is the main driving factor of ecological quality index (EQI) changes. Thus, in-depth investigations on the dominant influencing factors and comparisons of regional differences are necessary.
The impacts of urbanization on ecological quality are complex. On the one hand, in the early stages of advancing urbanization, the plundering of natural resources and the destruction of natural habitats commonly occurred during rapid changes in land cover, which have caused direct damage to ecological quality [20,21,22]. On the other hand, in the middle and later stages of the urbanization process, there is a tendency to give more consideration to the value of natural ecosystems in socio-economic development. Individuals and organizations have the capacity to allocate greater resources toward ecological and environmental conservation, leading to improved environmental quality [23,24]. In light of the heterogeneous urbanization stages observed across cities in the Yangtze River Basin, we posit that the ecological impacts of urbanization are likely to differ among these regions.
The Yangtze River Basin, the largest river basin in China and one of the most economically dynamic regions globally, plays a pivotal role in supporting ecological integrity, sustaining biodiversity, and influencing the socioeconomic fabric of the country [25,26,27,28,29]. In recent decades, rapid urbanization, population expansion, and economic development have placed unprecedented pressures on the ecological health in the Yangtze River Basin [30]. Cities in the Yangtze River Basin have gone through different stages of urbanization and may have exhibited different responses to such ecological pressures. Thus, the specific objectives of our research study were threefold: (1) explore the overall trends and spatiotemporal characteristics of ecological quality in the Yangtze River Basin during 2000–2018, (2) identify the key driving factors for the ecological quality in the Yangtze River Basin, and (3) determine the differences in driving factors of environmental quality in different urbanization processes.
2. Materials and Methods
2.1. Study Area
The Yangtze River Basin is the third largest basin worldwide, with a total area of approximately 1.8 million square kilometers, accounting for 18.8% of the overall land area of China (Figure 1). It covers 19 provinces, located at 24–36° N and 90–122° E. The climate is mostly categorized as a subtropical monsoon or warm temperate monsoon climate. The temporal and spatial distribution of precipitation and temperature are uneven. The average precipitation in the basin is 1067 mm and gradually increases from northwest to southeast. Average temperatures across the basin range from −4 °C in the source region to 18 °C in the lower reaches [31]. Multiple types of landforms are distributed in the basin, including plateaus, hills, mountains, basins, lakes, and plains. According to official Statistical Yearbooks, in 2018, the total population of the Yangtze River Basin was 459 million people, and the total gross domestic product (GDP) reached CNY 40.29 trillion. As one of the developed regions in China, the Yangtze River Basin has the fastest economic development and the highest level of urbanization [32], including cities at different levels of urbanization.
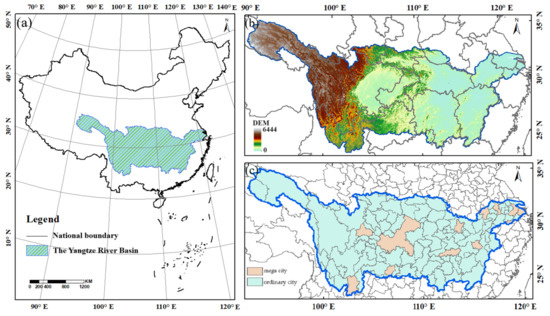
Figure 1.
The geographical position of the study area. (a) The blue area is the Yangtze River Basin. (b) The topography of the Yangtze River Basin and the provinces it contains. (c) Mega cities and ordinary cities in the Yangtze River Basin.
2.2. Data Collection
2.2.1. Ecological Quality Indexes
The dataset of the ecological quality indexes of terrestrial ecosystems in China from 2000 to 2018 was provided by the National Ecosystem Science Data Center, National Science & Technology Infrastructure of China (http://www.nesdc.org.cn).
A conceptual framework for ecological quality was developed by using satellite remote sensing and ecosystem process model data, including Normalized Difference Vegetation Index, Fractional Vegetation Cover, Leaf Area Index, Gross Primary Productivity, Net Primary Production, Net Ecosystem Productivity, Bowen ratio, Land Surface Temperature, Index of Wetness, Water Storage Index, and Water-Use Efficiency. The conceptual framework for ecological quality was grounded in a pixel-level historical baseline of current ecosystem functions and biodiversity habitats based on data quality control in forward normalization, correlation analysis, and the projection pursuit algorithm based on particle swarm optimization [33]. The spatial resolution of the dataset was 1 km.
2.2.2. The Global Artificial Impervious Area
The change in the global artificial impervious area (GAIA) serves as a pivotal metric for comprehending the ramifications of worldwide urbanization on both human societies and the natural environment [34]. In this study, we downloaded the annual artificial impervious area dynamics from 1985 to 2018 at a 30 m resolution from the Google Earth Engine platform. This dataset uses the Exclusion Inclusion algorithm and the temporal consistency check approach to locate artificial impervious areas by masking out potential areas of vegetation, water, and bare lands based on the full archive of 30 m resolution Landsat images, nighttime light data, and Sentinel-1 Synthetic Aperture Radar data.
To study the impact of urban expansion on the EQIs, the 30 m resolution GAIA dataset was first preprocessed with the delta calculation of impervious surfaces (2018 vs. 2000); Then, the changes were spatially aggregated into a 1000 m resolution GAIA rate dataset to keep the resolution consistent. These processes were implemented by using the Raster Calculator and Zonal Statistics tools in ArcGIS 10.8.
2.2.3. Population Density and Economic Data
Population density is one of the important factors affecting the EQIs of the Yangtze River Basin. The population density dataset, with a spatial resolution of 1000 m, was sourced from the WorldPop website (https://hub.worldpop.org/geodata/summary?id=44832 (accessed on 16 February 2025)), a publicly accessible resource for spatial demography [35]. The population density changes from 2000 to 2018 were calculated with ArcGIS 10.8 software.
Raster-based gross domestic product (GDP) data (unit: millions of 2017 USD) were collected from a previous study [36]. In this study, we employed a particle swarm optimization-back propagation (PSO-BP) algorithm to unify the scales of DMSP/OLS and NPP/VIIRS images and obtained continuous nighttime light data. Based on the calibrated nighttime light data, global 1 km × 1 km gridded revised real GDP data were obtained. We calculated the GDP changes to explore the EQI changes under different economic conditions.
2.3. Data Analysis
2.3.1. Calculation of Temporal Trends in Ecological Quality
Pixel information was analyzed using linear regression modeling. A positive coefficient indicates a rising trend in the variable, while a negative one indicates a declining trend in the variable. In the significance test, the sample size corresponded to the total count of grid cells in the study region. The null hypothesis (H0) was that there would be no significant difference, p-values greater than 0.05 indicated non-significant changes, while p-values less than or equal to 0.05 denoted significant changes. Given the chosen significance level (α = 0.05), there was a 5% risk of Type I error (false positives), meaning that there was a 5% probability of incorrectly rejecting the null hypothesis when it was true. Therefore, the pixel-scale spatial pattern of ecological quality index changes from 2000 to 2018 was divided into four categories, significant increase, significant decrease: the non-significant increase, and non-significant decrease. The trend analysis and significance test were conducted with R 4.3.1 software.
2.3.2. Classification into Mega Cities and Ordinary Cities
To compare the impact of the urbanization level on EQI changes, we divided the cities in the Yangtze River Basin into two categories, mega cities and ordinary cities. This classification processes mainly referred to their urbanization process. We defined urban areas with a permanent population of over 5 million as mega cities. According to our classification criteria, there are 12 mega cities and 111 ordinary cities in the Yangtze River Basin, where the former are Shanghai, Nanjing, Suzhou, Hangzhou, Hefei, Nanchang, Wuhan, Changsha, Chongqing, Chengdu, Guiyang, and Kunming. We calculated the annual average for each city category and then conducted a trend analysis for the period of 2000–2018.
2.3.3. Determination of Influence of Various Factors on EQI Dynamics
The level of urbanization, population mobility, and economic development have different pathways of impact on ecological quality. We aimed to determine the influence of various factors on EQI dynamics. The GAIA rate, population density, and GDP change data were unified to 1000 m grid data. We used the standardized regression coefficient to evaluate the relative importance of the above factors, and then determined the dominant factor for EQI changes with multiple linear regression. We used the variance expansion factor method to perform a multicollinearity analysis to eliminate the problem of unreliable results. The general formula is shown below:
y = β0 + β1x1 + β2x2 + β3x3 + … + βpxp.
βi* = βi/(SY/SXi).
y is the EQI change, β0 to βp are unknown linear regression coefficients, and x1 to xp represent independent variables. SY is the standard deviation of the dependent variable (y), and SXi is the standard deviation of the independent variable (xi); βi is the original regression coefficient, and βi* is the standardized regression coefficient. All statistical analyses were conducted with R software.
3. Results
3.1. Spatiotemporal Dynamics of EQI Changes
Spatially, the EQIs in the western regions (0.4–0.8) of the Yangtze River Basin were lower than those in the eastern regions (0.6–1.0), while the EQIs in the northern regions (0.6–1.0) were higher than those in the southern regions (0.2–0.8) (Figure 2a,b). Specifically, regions with high EQIs were mainly concentrated in the Yangtze River Delta, the lower reaches of the Yangtze River Basin.
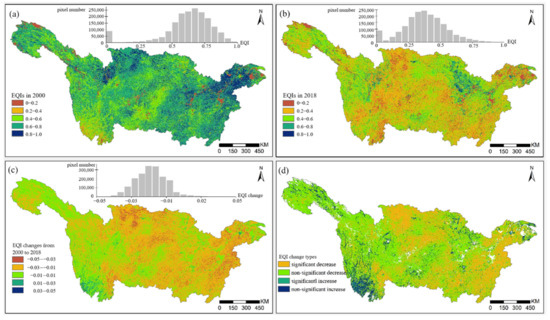
Figure 2.
Spatiotemporal pattern of EQI (ecological quality index) changes in the Yangtze River Basin. (a) EQIs in 2000. (b) EQIs in 2018. (c) EQI changes from 2000 to 2018. (d) EQI change types.
Overall, the EQIs of most areas of the Yangtze River Basin showed a decline trend in 2000–2018, approximately decreasing from 0.4–0.6 in 2000 to 0.2–0.4 in 2018 (Figure 2c). The regional EQI variation ranged from −0.03 to 0.01 and accounted for a high proportion. The magnitude of the change in the EQIs was within 0.1 in more than one-third of the study area. Spatially, the EQIs showed an increasing trend in southwestern regions (mainly in Yunnan), while a decrease was observed in most central and eastern regions (including Jiangxi, Hunan, Hubei, and Chongqing). As noted in the EQI spatiotemporal dynamics distribution map (Figure 2d), the areas with a significant decrease and a non-significant decrease in EQI changes accounted for almost 90% of the whole basin. Simultaneously, the areas with a significant increase and a non-significant increase accounted for a minority proportion, which was mainly distributed in the southwestern regions and scattered throughout the whole basin.
3.2. Differences in EQI Changes Between Mega Cities and Ordinary Cities
The EQIs in cities in the Yangtze River Basin underwent very large changes of various magnitude. For mega cities, the EQIs decreased from 0.57 in 2000 to 0.34 in 2018, while for ordinary cities, they dropped from 0.65 in 2000 to 0.38 in 2018 (Figure 3). The EQI changes from 2000 to 2018 were extremely significant both in mega cities and ordinary cities. In addition, from a spatial perspective, there was a significant difference (p < 0.05) in the EQIs between mega cities and ordinary cities in 2000. However, there were no significant differences (p > 0.05) in the EQIs between the two classes of cities in 2018.
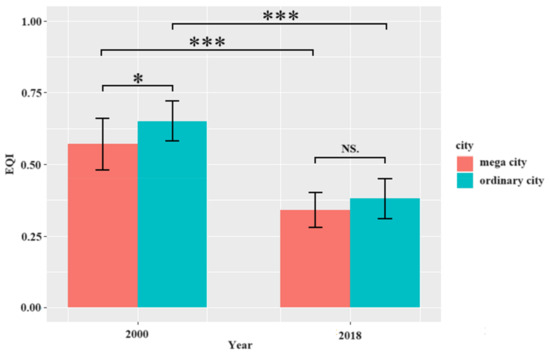
Figure 3.
Comparison of EQI between mega cities and ordinary cities in 2000 and 2018. Stars * and *** indicate significant differences (0.001 < p < 0.05) and extremely significant differences (p < 0.001) between different types of cities and years. “NS.” indicates no significant difference.
During the study period from 2000 to 2018, the EQIs in mega cities and ordinary cities showed similar trends (Figure 4). Overall, the EQIs showed a general downward trend both in mega cities and ordinary cities. Specifically, the mean values of the EQIs for mega cities and ordinary cities declined from 0.65 in 2000 to 0.34 in 2018 and from 0.57 in 2000 to 0.38 in 2018, respectively. The lowest values of the mean EQIs for mega cities (0.28) and ordinary cities (0.30) both emerged in 2015. It was noteworthy that although the EQI of mega cities had always been lower than that of ordinary cities, the overall decline rate (slope = −0.0104) of the EQIs in mega cities was relatively smaller, and the gap between mega cities and ordinary cities narrowed after 2015. It can be seen that the changes in the EQIs in mega cities and ordinary cities showed an intersecting trend.
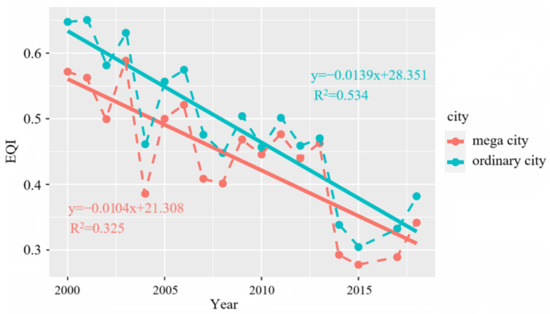
Figure 4.
Inter-annual change trend of EQI in mega cities and ordinary cities.
3.3. The Relative Contribution of Influencing Factors on EQI Changes
The regression coefficients in Table 1 represent the correlation between driving factors and EQI changes. The larger the absolute value of the coefficient, the higher the correlation. The GAIA rate (p < 0.001) and population density (0.001 < p < 0.01), but not the GDP factor, were negatively correlated with EQI changes in mega cities. GDP (p < 0.001) and population density, but not the GAIA rate, were positively correlated with the EQI changes in ordinary cities. In both mega cities and ordinary cities, the GAIA rate had the strongest correlation with the EQI changes, the relationship between GDP and EQI changes showed positive correlations under the interaction of multiple factors, and the regression coefficients between population density and EQI changes were close to 0.

Table 1.
The relative contribution of influencing factors on EQI changes. Two stars indicate significant influence (0.001 < p < 0.01), and three stars indicate extremely significant influence (p < 0.001).
Table 2 shows an intuitive comparison of the importance of the GAIA rate, GDP, and population density in the Yangtze River Basin for EQI changes at the city scale. For mega cities, the dominant factor of the GAIA rate, population density, and GDP accounted for 62.5%, 25.0%, and 12.5%, respectively, of the EQI changes. Simultaneously, based on relative importance analysis, the EQI changes were primarily influenced by the GAIA rate, population density, and GDP in 83, 9, and 19 ordinary cities, with contributions of 74.8%, 8.1%, and 17.1%, respectively. Among these three driving factors, the GAIA rate had the highest proportion as the dominant factor in both mega cities and ordinary cities. However, population density and GDP showed different proportions in the two types of cities. In mega cities, more cities were dominantly influenced by population density, after the GAIA rate, while in ordinary cities, the ranking of dominant factors was the GAIA rate, GDP, and population density.
Table 2.
The dominant factor for EQI changes in mega cities and ordinary cities.
4. Discussion
4.1. Spatiotemporal Characteristics of EQIs in the Yangtze River Basin
In terms of the time span from 2000 to 2018, the overall EQI changes in the Yangtze River Basin showed a downward trend (Figure 2). Our research findings are not entirely consistent with previous studies. Likewise, previous studies have not shown a consistent results, as upward, flat, and downward trends in ecological quality in the Yangtze River Basin have all been confirmed [37,38,39,40]. The reasons for different results are multifaceted, but primarily include the different research time periods and different ecological quality calculation methods. The EQIs in most regions of the Yangtze River Basin significantly decreased, while a few regions showed an upward trend. The reduction in the EQIs is determined by multiple factors and we analyzed the relative importance of the influencing factors in the following discussion. The regions with significant increases in the EQIs were concentrated in Yunnan province, which has more than 19,000 higher plants, representing the highest plant diversity in the country [41]. Since the 21st century, many new species have been continually discovered or described [42,43,44,45]. The spatial pattern of high biodiversity ensures the efficiency of regional ecosystem services, which is closely related to enhancing the quality of the ecological environment.
Our study demonstrated an overall downward trend in both mega cities and ordinary cities. In addition, we were surprised to find that there has been an ecological improvement since 2015 and that mega cities performed better than ordinary cities (Figure 4). In recent years, China has implemented many ecological restoration programs [46], which have gradually restored the damaged ecosystem and promoted an increase in ecological service functions. Efforts in the Yangtze River Basin mainly focus on water and wetlands restoration, which has brought ecological benefits including increased biodiversity, the regulation of water resources, the promotion of ecosystem sustainability, and the regulation of the local climate [47,48,49]. These water and wetlands restoration efforts in urban environments also extend to rural areas. Therefore, in this study, we do not make a specific distinction between rural regions and central urban zones within cities. The better performance of mega cities may be attributed to their advanced management modes and economic development modes. The urban management modes of mega cities exhibit enhanced efficiency in resource allocation and the rigorous enforcement of environmental regulations and policies. Concurrently, their economic development modes are underpinned by advanced technological innovation capabilities. These efficient management practices and progressive economic frameworks collectively provide continuous impetus for the enhancement of ecological environments [50,51,52]. Firstly, the observed environmental advantages of mega cities may stem primarily from institutionalized governance mechanisms. Especially in China’s mega cities, municipal governments enforce multilevel regulatory frameworks that systematically constrain environmentally detrimental choices while incentivizing sustainable practices [53]. Secondly, in mega cities, it is possible to build a dense public transportation network, such as subways, buses, and light rail. Comprehensive transportation systems play a very important role in reducing environmental pollution, which is primarily caused by energy consumption and carbon emissions [54,55]. Lastly, in mega cities, priority is given to developing advanced pollution treatment equipment and technology. The treatment of municipal wastewater [56], exhaust gas [57], and solid waste [58] is crucial to the ecological quality of a city. In the future, we will further study the change trend in ecological environmental quality under different development and management modes.
4.2. Influences of Drivers of EQI Changes
Against the background of rapid land cover change, we investigated the influence of the GAIA rate on EQI changes. According to the results in Table 1 and Table 2, the GAIA rate is the dominant factor in the changes in the EQIs in most cities. The increase in the proportion of GAIA indicates the acceleration of the urbanization process, which has caused many ecological problems, such as urban heat islands, soil erosion, and air pollution [59,60,61], and the occurrence of these ecological problems can directly lead to the decrease in EQIs. The phenomenon of accelerated land urbanization has existed in both mega cities and ordinary cities in recent decades. Our finding is in agreement with previous research results on the negative impact of land urbanization on ecological quality [37,62,63]. A previous study has shown that by 2030, the urbanization level will reach 61.32% and the eco-environmental quality comprehensive index will drop to 0.3016 in China [64]. Alleviating the ecological environmental pressure due to the urbanization process is a notable challenge for regional sustainable development, not only for the Yangtze River Basin.
The ecological impacts of urbanization are different among different regions. Land urbanization is the direct and crucial factor influencing ecological quality. Furthermore, we considered some indirect factors, such as population density and GDP. Population growth and economic growth are also usually negatively correlated with ecological quality in the short and long run [65,66]. Our research study indicates that mega cities should prioritize addressing the impact of population density, whereas ordinary cities should pay more attention to the impact of GDP growth on ecological quality. Mega cities have advantages in terms of economic income, employment opportunities, educational resources, infrastructure, and so on. Population migration leads to high population density in mega cities and low population density in ordinary cities. Under the high pressures of high population density, the increase in resource demand and pollution emissions exacerbate environmental vulnerability, leading to increasingly prominent environmental quality issues [67,68,69]. Fortunately, population growth will decline in most areas of the Yangtze River Basin from 2021 to 2100 [29]. For ordinary cities, population pressure is relatively low compared with that in mega cities, and population density has a relatively small impact on the environment, while economic development has a greater effect. The Yangtze River Basin plays an important role in national economic development, accounting for approximately 30% of China’s GDP [28]. The relationship between ecological protection and socioeconomic development is interdependent and mutually restrictive. On the one hand, high economic growth is usually accomplished via environmentally destructive activities, by which we mainly refer to the over-exploitation of natural resources and consumption [66,70]. On the other hand, the decline in the carrying capacity of the ecological environment restrains the sustainable development of socioeconomic development [71,72,73]. Our study may pave the way for further analysis of the relative importance of the driving factors of ecological environmental quality. In the process of strengthening ecological environmental protection, it is necessary to take rationalized distribution pattern of population and high-quality economic development into consideration. Socioeconomic development not only impacts environmental quality but also influences overall quality of life. Therefore, research on the interplay among these factors represents a promising direction for future research.
4.3. Research Limitation and Insights for Environmental Protection
There are several limitations associated with our study. From the data source perspective, the absence of original 1 km GAIA data made it necessary to spatially aggregate 30 m impervious surface data to 1 km grids, which may cause loss of spatial information, and temporal limitations restricted the analysis to historical trends rather than future predictions. From the analytical perspective, the binary classification of cities into mega cities (>5 million permanent residents) and ordinary cities prioritized population thresholds as a proxy for integrated urbanization intensity. This approach acknowledges that population density inherently correlates with socioeconomic and other related indicators, while recognizing the need for future multidimensional refinements, for enhancing classification robustness. In addition, the temporal and spatial differentiation of the EQIs resulted from many factors and their interaction. Economic activity may drive urban land use change, and the presence of more people in urban areas may lead to the expansion of urban land [74]. Comprehensive understanding and quantifying differential factors are highly complex endeavors, so we focused on the relative importance of driving factors and the differences between mega cities and ordinary cities.
The continuous growth of GAIA, population, and GDP has placed significant pressure on the environment. Our results, focusing on key points, have profound significance within the overall framework of ecological long-term planning with the purpose of enhancing ecological quality. The pattern of ecological environmental quality and its driving factors are still research hotspots. This study can provide scientific reference for the development of basin ecological management measures. For cities with high demands for urban expansion, high-value ecological spaces such as urban parks, forests, and wetlands, should be avoided as much as possible in the selection of expansion areas. Meanwhile, cities with lower expansion demands should prioritize the conservation of existing ecological spaces and the establishment of resilient ecological security barriers. In addition, ecological protection measures such as promoting ecological restoration, rational population distribution, and reducing economic activities at the expense of the environment are also key to ensuring regional socioeconomic sustainable development.
5. Conclusions
In this study, EQI changes in the Yangtze River Basin from 2000 to 2018 were classified into four categories, i.e., significant increase, significant decrease, non-significant increase, and non-significant decrease, and showed an overall downward trend both in mega cities and ordinary cities. Notably, mega cities have made greater efforts in environmental protection, resulting in a slower decline in the EQIs compared with that in ordinary cities. Furthermore, we attributed ecological quality degradation to the GAIA rate, population density, and GDP growth. Among them, the correlation between the GAIA rate and the EQI changes was the strongest. The ecological impacts of urbanization are likely to differ among different regions. For mega cities, the ranking of dominant factors was the GAIA rate, population density, and GDP, while for ordinary cities, it was the GAIA rate, GDP, and population density. These results have potential reference value for policymakers to determine the main factors that affect ecological quality and act according to local conditions. We recommend strengthening ecological restoration and placing importance on urbanization in the future.
Author Contributions
Conceptualization, J.X. and Y.J.; methodology, J.X. and Y.J.; software, J.X. and W.Y.; validation, J.X. and W.Y.; formal analysis, J.X. and W.Y.; investigation, J.X.; resources, J.X.; data curation, J.X.; writing—original draft preparation, J.X.; writing—review and editing, J.X. and Y.J.; project administration, J.X.; funding acquisition, J.X. All authors have read and agreed to the published version of the manuscript.
Funding
This research was funded by the Shanghai Industrial Collaborative Innovation Leading Group, grant number “XTCX-KJ-2024-23”.
Institutional Review Board Statement
Not applicable.
Informed Consent Statement
Not applicable.
Data Availability Statement
The data supporting this study are available upon request from the corresponding author.
Conflicts of Interest
The authors declare no conflicts of interest.
References
- Ouyang, Z.; Zheng, H.; Xiao, Y.; Polasky, S.; Liu, J.; Xu, W.; Wang, Q.; Zhang, L.; Xiao, Y.; Rao, E.M.; et al. Improvements in ecosystem services from investments in natural capital. Science 2016, 352, 1455–1459. [Google Scholar] [CrossRef]
- Costanza, R.; de Groot, R.; Sutton, P.; van der Ploeg, S.; Anderson, S.J.; Kubiszewski, I.; Farber, S.; Turner, R.K. Changes in the global value of ecosystem services. Glob. Environ. Change Hum. Policy Dimens. 2014, 26, 152–158. [Google Scholar] [CrossRef]
- Ji, J.W.; Wang, S.X.; Zhou, Y.; Liu, W.L.; Wang, L.T. Spatiotemporal Change and Landscape Pattern Variation of Eco-Environmental Quality in Jing-Jin-Ji Urban Agglomeration From 2001 to 2015. IEEE Access 2020, 8, 125534–125548. [Google Scholar] [CrossRef]
- Krausmann, F.; Erb, K.H.; Gingrich, S.; Haberl, H.; Bondeau, A.; Gaube, V.; Lauk, C.; Plutzar, C.; Searchinger, T.D. Global human appropriation of net primary production doubled in the 20th century. Proc. Natl. Acad. Sci. USA 2013, 110, 10324–10329. [Google Scholar] [CrossRef]
- Mubareka, S.; Ehrlich, D. Identifying and modelling environmental indicators for assessing population vulnerability to conflict using ground and satellite data. Ecol. Indic. 2010, 10, 493–503. [Google Scholar] [CrossRef]
- Borgwardt, F.; Robinson, L.; Trauner, D.; Teixeira, H.; Nogueira, A.J.A.; Lillebo, A.I.; Piet, G.; Kuemmerlen, M.; O’Higgins, T.; McDonald, H.; et al. Exploring variability in environmental impact risk from human activities across aquatic ecosystems. Sci. Total Environ. 2019, 652, 1396–1408. [Google Scholar] [CrossRef] [PubMed]
- Dimnwobi, S.K.; Ekesiobi, C.; Madichie, C.V.; Asongu, S.A. Population dynamics and environmental quality in Africa. Sci. Total Environ. 2021, 797, 149172. [Google Scholar] [CrossRef]
- Khan, I.; Hou, F.J.; Le, H.P. The impact of natural resources, energy consumption, and population growth on environmental quality: Fresh evidence from the United States of America. Sci. Total Environ. 2021, 754, 142222. [Google Scholar] [CrossRef]
- Sun, Y.H.; Dong, Y.; Chen, X.L.; Song, M.L. Dynamic evaluation of ecological and economic security: Analysis of China. J. Clean. Prod. 2023, 387, 135922. [Google Scholar] [CrossRef]
- Cao, H.J.; Li, M.N.; Qin, F.Q.; Xu, Y.K.; Zhang, L.; Zhang, Z.F. Economic Development, Fiscal Ecological Compensation, and Ecological Environment Quality. Int. J. Environ. Res. Public Health 2022, 19, 4725. [Google Scholar] [CrossRef]
- Zhang, M.; Wang, J.M.; Zhang, Y.; Wang, J. Ecological response of land use change in a large opencast coal mine area of China. Resour. Policy 2023, 82, 103551. [Google Scholar] [CrossRef]
- Aizizi, Y.; Kasimu, A.; Liang, H.W.; Zhang, X.L.; Zhao, Y.Y.; Wei, B.H. Evaluation of ecological space and ecological quality changes in urban agglomeration on the northern slope of the Tianshan Mountains. Ecol. Indic. 2023, 146, 109896. [Google Scholar] [CrossRef]
- Ripple, W.J.; Wolf, C.; Newsome, T.M.; Gregg, J.W.; Lenton, T.M.; Palomo, I.; Eikelboom, J.A.J.; Law, B.E.; Huq, S.; Duffy, P.B.; et al. World Scientists’ Warning of a Climate Emergency 2021. Bioscience 2021, 71, 894–898. [Google Scholar] [CrossRef]
- Ceballos, G.; Ehrlich, P.R.; Dirzo, R. Biological annihilation via the ongoing sixth mass extinction signaled by vertebrate population losses and declines. Proc. Natl. Acad. Sci. USA 2017, 114, E6089–E6096. [Google Scholar] [CrossRef]
- Eisenmenger, N.; Pichler, M.; Krenmayr, N.; Noll, D.; Plank, B.; Schalmann, E.; Wandl, M.T.; Gingrich, S. The Sustainable Development Goals prioritize economic growth over sustainable resource use: A critical reflection on the SDGs from a socio-ecological perspective. Sustain. Sci. 2020, 15, 1101–1110. [Google Scholar] [CrossRef]
- Khan, I.; Hou, F.J.; Zakari, A.; Tawiah, V.; Ali, S.A. Energy use and urbanization as determinants of China’s environmental quality: Prospects of the Paris climate agreement. J. Environ. Plan. Manag. 2022, 65, 2363–2386. [Google Scholar] [CrossRef]
- Bao, L.Y.; Ding, X.H.; Zhang, J.X.; Ma, D.Y. Can New Urbanization Construction Improve Ecological Welfare Performance in the Yangtze River Economic Belt? Sustainability 2023, 15, 8758. [Google Scholar] [CrossRef]
- Qayyum, U.; Sabir, S.; Anjum, S. Urbanization, informal economy, and ecological footprint quality in South Asia. Environ. Sci. Pollut. Res. 2021, 28, 67011–67021. [Google Scholar] [CrossRef]
- Kashki, A.; Karami, M.; Zandi, R.; Roki, Z. Evaluation of the effect of geographical parameters on the formation of the land surface temperature by applying OLS and GWR, A case study Shiraz City, Iran. Urban Clim. 2021, 37, 100832. [Google Scholar] [CrossRef]
- Yao, J.; Xu, P.; Huang, Z. Impact of urbanization on ecological efficiency in China: An empirical analysis based on provincial panel data. Ecol. Indic. 2021, 129, 107827. [Google Scholar] [CrossRef]
- Wu, C.; Li, C.; Ouyang, L.; Xiao, H.; Wu, J.; Zhuang, M.; Bi, X.; Li, J.; Wang, C.; Song, C.; et al. Spatiotemporal evolution of urbanization and its implications to urban planning of the megacity, Shanghai, China. Landsc. Ecol. 2023, 38, 1105–1124. [Google Scholar] [CrossRef]
- Sun, Y.; Jiao, L.; Guo, Y.; Xu, Z. Recognizing urban shrinkage and growth patterns from a global perspective. Appl. Geogr. 2024, 166, 103247. [Google Scholar] [CrossRef]
- Nathaniel, S.; Victor Bekun, F. Environmental management amidst energy use, urbanization, trade openness, and deforestation: The Nigerian experience. J. Public Aff. 2019, 20, e2037. [Google Scholar] [CrossRef]
- Chen, X.F.; Liu, C.; Yu, X.H. Urbanization, Economic Development, and Ecological Environment: Evidence from Provincial Panel Data in China. Sustainability 2022, 14, 1124. [Google Scholar] [CrossRef]
- Zhou, Z.C.; Wang, J. Evolution of landscape dynamics in the Yangtze River Delta from 2000 to 2020. J. Water Clim. Change 2022, 13, 1241–1256. [Google Scholar] [CrossRef]
- Shi, Z.T.; Zhou, S.L. A study on the dynamic evaluation of ecosystem health in the Yangtze river Basin of China. Ecol. Indic. 2023, 153, 110445. [Google Scholar] [CrossRef]
- Jiang, Z.G.; Dai, B.G.; Wang, C.; Xiong, W. Multifaceted biodiversity measurements reveal incongruent conservation priorities for rivers in the upper reach and lakes in the middle-lower reach of the largest river-floodplain ecosystem in China. Sci. Total Environ. 2020, 739, 140380. [Google Scholar] [CrossRef]
- Qi, W.; Feng, L.; Yang, H.; Liu, J.G.; Zheng, Y.; Shi, H.Y.; Wang, L.; Chen, D.L. Economic growth dominates rising potential flood risk in the Yangtze River and benefits of raising dikes from 1991 to 2015. Environ. Res. Lett. 2022, 17, 034046. [Google Scholar] [CrossRef]
- Zhu, M.; Zhang, Z.X.; Zhu, B.; Kong, R.; Zhang, F.Y.; Tian, J.X.; Jiang, T. Population and Economic Projections in the Yangtze River Basin Based on Shared Socioeconomic Pathways. Sustainability 2020, 12, 4202. [Google Scholar] [CrossRef]
- Zhao, W.; Liu, X.; Deng, Q.; Li, D.; Xu, J.; Li, M.; Cui, Y. Spatial Association of Urbanization in the Yangtze River Delta, China. Int. J. Environ. Res. Public Health 2020, 17, 7276. [Google Scholar] [CrossRef]
- Chang, L.; Cheng, L.; Li, S.; Guo, Z.; Liu, Y.; Zhang, L. Reservoir dominated spatio-temporal changes of the surface water area in the Yangtze River Basin during past three decades. J. Hydrol. Reg. Stud. 2024, 55, 101948. [Google Scholar] [CrossRef]
- Tian, Y.Y.; Jiang, G.H.; Zhou, D.Y.; Li, G.Y. Systematically addressing the heterogeneity in the response of ecosystem services to agricultural modernization, industrialization and urbanization in the Qinghai-Tibetan Plateau from 2000 to 2018. J. Clean. Prod. 2021, 285, 125323. [Google Scholar] [CrossRef]
- Wang, J.; Chen, X.; Ouyang, X.; Ding, Y. A dataset of ecological quality indexes of terrestrial ecosystems in China from 2000 to 2018. China Sci. Data 2023, 8, 1–9. [Google Scholar] [CrossRef]
- Gong, P.; Li, X.C.; Wang, J.; Bai, Y.Q.; Cheng, B.; Hu, T.Y.; Liu, X.P.; Xu, B.; Yang, J.; Zhang, W.; et al. Annual maps of global artificial impervious area (GAIA) between 1985 and 2018. Remote Sens. Environ. 2020, 236, 111510. [Google Scholar] [CrossRef]
- Tatem, A.J. Comment: WorldPop, open data for spatial demography. Sci. Data 2017, 4, sdata20174. [Google Scholar] [CrossRef]
- Chen, J.D.; Gao, M.; Cheng, S.L.; Hou, W.X.; Song, M.L.; Liu, X.; Liu, Y. Global 1 km × 1 km gridded revised real gross domestic product and electricity consumption during 1992–2019 based on calibrated nighttime light data. Sci. Data 2022, 9, 202. [Google Scholar] [CrossRef]
- Zhang, S.Q.; Yang, P.; Xia, J.; Qi, K.L.; Wang, W.Y.; Cai, W.; Chen, N.C. Research and Analysis of Ecological Environment Quality in the Middle Reaches of the Yangtze River Basin between 2000 and 2019. Remote Sens. 2021, 13, 4475. [Google Scholar] [CrossRef]
- Yang, X.Y.; Meng, F.; Fu, P.J.; Zhang, Y.X.; Liu, Y.H. Spatiotemporal change and driving factors of the Eco-Environment quality in the Yangtze River Basin from 2001 to 2019. Ecol. Indic. 2021, 131, 108214. [Google Scholar] [CrossRef]
- Liu, Z.X.; Zhang, W.W.; Lu, H.Y.; Ji, J.W.; Yang, Z.H.; Chen, C. Exploring evolution characteristics of eco-environment quality in the Yangtze River Basin based on remote sensing ecological index. Heliyon 2023, 9, e23243. [Google Scholar] [CrossRef]
- Cao, Y.; Wang, C.; Su, Y.; Duan, H.L.; Wu, X.M.; Lu, R.; Su, Q.; Wu, Y.T.; Chu, Z.J. Study on Spatiotemporal Evolution and Driving Forces of Habitat Quality in the Basin along the Yangtze River in Anhui Province Based on InVEST Model. Land 2023, 12, 1092. [Google Scholar] [CrossRef]
- Qian, L.S.; Chen, J.H.; Deng, T.; Sun, H. Plant diversity in Yunnan: Current status and future directions. Plant Divers. 2020, 42, 281–291. [Google Scholar] [CrossRef] [PubMed]
- Du, C.; Liao, S.; Boufford, D.E.; Ma, J.S. Twenty years of Chinese vascular plant novelties, 2000 through 2019. Plant Divers. 2020, 42, 393–398. [Google Scholar] [CrossRef] [PubMed]
- Enroth, J.; Shevock, J.R.; Ignatov, M.S. Mawenzhangia thamnobryoides (Bryophyta, Lembophyllaceae), a new moss genus and species from the Shangri-la region of Yunnan Province, China. Phytotaxa 2018, 346, 237–246. [Google Scholar] [CrossRef]
- Häkkinen, M. Musa chunii Hakkinen, a new species (Musaceae) from Yunnan, China and taxonomic identity of Musa rubra. J. Syst. Evol. 2009, 47, 87–91. [Google Scholar] [CrossRef]
- Zhang, M.L.; He, Y.; Liu, Q.R. A new species of Argyreia (Convolvulaceae) from Yunnan, China. Phytokeys 2023, 225, 199–209. [Google Scholar] [CrossRef]
- Song, W.Q.; Feng, Y.H.; Wang, Z.H. Ecological restoration programs dominate vegetation greening in China. Sci. Total Environ. 2022, 848, 157729. [Google Scholar] [CrossRef]
- Zhang, Y.Q.; Zhao, X.; Gong, J.; Luo, F.; Pan, Y.P. Effectiveness and driving mechanism of ecological restoration efforts in China from 2009 to 2019. Sci. Total Environ. 2024, 910, 168676. [Google Scholar] [CrossRef]
- Cai, Y.J.; Liang, J.S.; Zhang, P.Y.; Wang, Q.Y.; Wu, Y.; Ding, Y.R.; Wang, H.J.; Fu, C.; Sun, J.J. Review on strategies of close-to-natural wetland restoration and a brief case plan for a typical wetland in northern China. Chemosphere 2021, 285, 131534. [Google Scholar] [CrossRef]
- Rodrigo, M.A. Wetland Restoration with Hydrophytes: A Review. Plants 2021, 10, 1035. [Google Scholar] [CrossRef]
- Lin, J.; Yang, S.; Liu, Y.; Zhu, Y.; Cai, A. The urban population agglomeration capacity and its impact on economic efficiency in the Yangtze River Delta Urban Agglomeration. Environ. Dev. Sustain. 2023, 26, 13739–13768. [Google Scholar] [CrossRef]
- Jin, M.; Lin, K.-C.; Shi, W.; Lee, P.T.W.; Li, K.X. Impacts of high-speed railways on economic growth and disparity in China. Transp. Res. Part A Policy Pract. 2020, 138, 158–171. [Google Scholar] [CrossRef]
- Ilyas, M.; Mu, Z.; Akhtar, S.; Hassan, H.; Shahzad, K.; Aslam, B.; Maqsood, S. Renewable energy, economic development, energy consumption and its impact on environmental quality: New evidence from South East Asian countries. Renew. Energy 2024, 223, 119961. [Google Scholar] [CrossRef]
- Zhu, X.; Gao, W.; Zhou, N.; Kammen, D.M.; Wu, Y.; Zhang, Y.; Chen, W. The inhabited environment, infrastructure development and advanced urbanization in China’s Yangtze River Delta Region. Environ. Res. Lett. 2016, 11, 124020. [Google Scholar] [CrossRef]
- Salman, M.Y.; Hasar, H. Review on environmental aspects in smart city concept: Water, waste, air pollution and transportation smart applications using IoT techniques. Sustain. Cities Soc. 2023, 94, 104567. [Google Scholar] [CrossRef]
- Costa, E.; Seixas, J.; Baptista, P.; Costa, G.; Turrentine, T. CO2 emissions and mitigation policies for urban road transportation: Sao Paulo versus Shanghai. Urbe Rev. Bras. Gestão Urbana 2018, 10, 143–158. [Google Scholar] [CrossRef]
- Sheikh, M.; Harami, H.R.; Rezakazemi, M.; Cortina, J.L.; Aminabhavi, T.M.; Valderrama, C. Towards a sustainable transformation of municipal wastewater treatment plants into biofactories using advanced NH3-N recovery technologies: A review. Sci. Total Environ. 2023, 904, 166077. [Google Scholar] [CrossRef]
- Fayyazbakhsh, A.; Bell, M.L.; Zhu, X.B.; Mei, X.Y.; Koutny, M.; Hajinajaf, N.; Zhang, Y.X. Engine emissions with air pollutants and greenhouse gases and their control technologies. J. Clean. Prod. 2022, 376, 134260. [Google Scholar] [CrossRef]
- Hong, J.L.; Chen, Y.L.; Wang, M.; Ye, L.P.; Qi, C.C.; Yuan, H.R.; Zheng, T.; Li, X.Z. Intensification of municipal solid waste disposal in China. Renew. Sustain. Energy Rev. 2017, 69, 168–176. [Google Scholar] [CrossRef]
- Wentz, E.A.; Anderson, S.; Fragkias, M.; Netzband, M.; Mesev, V.; Myint, S.W.; Quattrochi, D.; Rahman, A.; Seto, K.C. Supporting Global Environmental Change Research: A Review of Trends and Knowledge Gaps in Urban Remote Sensing. Remote Sens. 2014, 6, 3879–3905. [Google Scholar] [CrossRef]
- Gao, F.; De Colstoun, E.B.; Ma, R.H.; Weng, Q.H.; Masek, J.G.; Chen, J.; Pan, Y.Z.; Song, C.H. Mapping impervious surface expansion using medium-resolution satellite image time series: A case study in the Yangtze River Delta, China. Int. J. Remote Sens. 2012, 33, 7609–7628. [Google Scholar] [CrossRef]
- Fu, P.; Weng, Q.H. A time series analysis of urbanization induced land. use and land cover change and its impact on land surface temperature with Landsat imagery. Remote Sens. Environ. 2016, 175, 205–214. [Google Scholar] [CrossRef]
- Zhang, Y.Y.; Yi, L.W.; Xie, B.G.; Li, J.H.; Xiao, J.Y.; Xie, J.; Liu, Z.X. Analysis of ecological quality changes and influencing factors in Xiangjiang River Basin. Sci. Rep. 2023, 13, 4375. [Google Scholar] [CrossRef] [PubMed]
- Cui, R.H.; Han, J.Z.; Hu, Z.Q. Assessment of Spatial Temporal Changes of Ecological Environment Quality: A Case Study in Huaibei City, China. Land 2022, 11, 944. [Google Scholar] [CrossRef]
- Fang, C.; Lin, X.Q. The eco-environmental guarantee for China’s urbanization process. J. Geogr. Sci. 2009, 19, 95–106. [Google Scholar] [CrossRef]
- Yuan, B.D.; Fu, L.N.; Zou, Y.; Zhang, S.Q.; Chen, X.S.; Li, F.; Deng, Z.M.; Xie, Y.H. Spatiotemporal change detection of ecological quality and the associated affecting factors in Dongting Lake Basin, based on RSEI. J. Clean. Prod. 2021, 302, 126995. [Google Scholar] [CrossRef]
- Ramezani, M.; Abolhassani, L.; Foroushani, N.S.; Burgess, D.; Aminizadeh, M. Ecological Footprint and Its Determinants in MENA Countries: A Spatial Econometric Approach. Sustainability 2022, 14, 11708. [Google Scholar] [CrossRef]
- Miao, C.L.; Sun, L.Y.; Yang, L. The studies of ecological environmental quality assessment in Anhui Province based on ecological footprint. Ecol. Indic. 2016, 60, 879–883. [Google Scholar] [CrossRef]
- Fakher, H.A.; Ahmed, Z.; Acheampong, A.O.; Nathaniel, S.P. Renewable energy, nonrenewable energy, and environmental quality nexus: An investigation of the N-shaped Environmental Kuznets Curve based on six environmental indicators. Energy 2023, 263, 125660. [Google Scholar] [CrossRef]
- Sharma, R.; Sinha, A.; Kautish, P. Does renewable energy consumption reduce ecological footprint? Evidence from eight developing countries of Asia. J. Clean. Prod. 2021, 285, 124867. [Google Scholar] [CrossRef]
- Abid, M.; Sakrafi, H.; Gheraia, Z.; Abdelli, H. Does renewable energy consumption affect ecological footprints in Saudi Arabia? A bootstrap causality test. Renew. Energy 2022, 189, 813–821. [Google Scholar] [CrossRef]
- Van Hoey, G.; Permuy, D.C.; Vandendriessche, S.; Vincx, M.; Hostens, K. An ecological quality status assessment procedure for soft-sediment benthic habitats: Weighing alternative approaches. Ecol. Indic. 2013, 25, 266–278. [Google Scholar] [CrossRef]
- Karimi, A.; Brown, G.; Hockings, M. Methods and participatory approaches for identifying social-ecological hotspots. Appl. Geogr. 2015, 63, 9–20. [Google Scholar] [CrossRef]
- Drayson, K.; Wood, G.; Thompson, S. Assessing the quality of the ecological component of English Environmental Statements. J. Environ. Manag. 2015, 160, 241–253. [Google Scholar] [CrossRef] [PubMed]
- Mahtta, R.; Fragkias, M.; Güneralp, B.; Mahendra, A.; Reba, M.; Wentz, E.A.; Seto, K.C. Urban land expansion: The role of population and economic growth for 300+ cities. NPJ Urban Sustain. 2022, 2, 5. [Google Scholar] [CrossRef]
Disclaimer/Publisher’s Note: The statements, opinions and data contained in all publications are solely those of the individual author(s) and contributor(s) and not of MDPI and/or the editor(s). MDPI and/or the editor(s) disclaim responsibility for any injury to people or property resulting from any ideas, methods, instructions or products referred to in the content. |
© 2025 by the authors. Licensee MDPI, Basel, Switzerland. This article is an open access article distributed under the terms and conditions of the Creative Commons Attribution (CC BY) license (https://creativecommons.org/licenses/by/4.0/).