Article

Data Factor Marketization and Urban Industrial Land Use Efficiency: Evidence from the Establishment of Data Trading Platforms in China

by
Weiwei Chen
1,2,* and
Shunyi Li
1
1
School of Economics, Guizhou University of Finance and Economics, Guiyang 550025, China
2
Department of Economics and Management, Party School of the Guizhou Provincial Committee of C.P.C Guizhou Institute of Public Administration, Guiyang 550025, China
*
Author to whom correspondence should be addressed.
Sustainability 2025, 17(6), 2753; https://doi.org/10.3390/su17062753
Submission received: 7 February 2025 / Revised: 13 March 2025 / Accepted: 18 March 2025 / Published: 20 March 2025
(This article belongs to the Special Issue Sustainability in Urban Development and Land Use)

Abstract

:
Enhancing urban industrial land use efficiency (UILUE) is critical for addressing human–land conflicts and promoting sustainable urban development. However, the role of data trading in influencing UILUE remains insufficiently examined in the literature. This study explores the effect of data factor marketization (DFM) on UILUE and its underlying mechanisms. Using data from 284 Chinese cities between 2006 and 2022, this study treats the establishment of data trading platforms as a quasi-natural experiment. A multi-period difference-in-differences (DID) model is applied to evaluate the causal impact of DFM. The findings indicate that DFM significantly improves UILUE. This improvement mainly occurs through technological innovation and reduced land resource misallocation. Furthermore, the positive impact is more pronounced in cities with lower levels of market segmentation, stricter environmental regulations, and those located in the eastern region. This study offers valuable theoretical insights and practical implications for optimizing urban land use and advancing sustainable development.

1. Introduction

Urbanization and industrialization have driven rapid economic growth and social development worldwide. However, they have also resulted in significant challenges, such as urban sprawl, imbalances in land supply and demand, and environmental degradation [1,2]. As the largest developing country, China had an urbanization rate of 65% in 2022, with urban areas covering more than 190,000 square kilometers [3]. Compared to other countries, China faces a dual challenge: limited per capita land resources and inefficiencies in urban industrial land use exacerbated by reliance on land-based fiscal revenues. Despite its vast territory, China’s high population density, rapid urbanization, and strict land use regulations constrain the availability of urban and agricultural land. These factors contribute to increasing urban land scarcity, heightening the need for more efficient land use. Since the 1994 tax-sharing reform, China has transitioned from a system where local governments transferred fixed revenues to the central government to one that clearly divides tax revenues between central and local levels. This reform significantly increased central fiscal power, placing fiscal pressures on local governments. Consequently, local governments responded by selling industrial land at low prices to attract investment and compensating through high-priced residential and commercial land sales to fund urban infrastructure [4]. This distorted land allocation model weakens the market’s selection mechanism, leading to inefficient urban industrial land allocation and even land idleness [5]. Such inefficiencies lead to greater land consumption for the same industrial output, intensifying urban land scarcity. With increasing urban land shortages and persistently low industrial land utilization efficiency, enhancing UILUE has become crucial for balancing urbanization and industrialization.
In the digital era, data have immense value, often likened to the new “gold” and “oil” [6]. In 2024, China introduced the “Data Factors×” Three-Year Action Plan (2024–2026), positioning urban governance as one of the twelve key areas for data application [7]. Theoretically, information is non-rivalrous in consumption and partially excludable [8]. Its utilization enhances productivity, expands the boundaries of innovation, and drives economic growth [8,9]. DFM is a dynamic process that treats data as a production factor and shifts its allocation from monopolistic control to market-based mechanisms [10]. The primary goal of DFM is to optimize data resource allocation and maximize its economic and social value [11]. It reduces uncertainties linked to technological innovation and mitigates the risks of resource misallocation [12]. It also enables governments to strengthen urban land regulation [13]. Thus, DFM has become a critical factor influencing UILUE. How exactly does DFM impact UILUE, and what mechanisms underlie this effect? Addressing these questions is vital for optimizing data utilization systems and promoting sustainable urban development.
Data trading platforms serve as market-oriented infrastructures that facilitate the exchange of data with market access rights and essential information on production, circulation, and consumption. These platforms provide key services such as data ownership verification, valuation, transaction intermediation, delivery and settlement, asset management, and financial services [14]. By leveraging data factors, enterprises can enhance market forecasting and make more informed decisions on production technology and innovation [15,16]. By improving the efficiency of factor allocation, data platforms foster technological innovation and support industrial upgrading [12,17], playing a crucial role in China’s factor market reform and high-quality development. As key components for DFM, data trading platforms largely reflect the practical impact of data marketization [11]. In 2014, Beijing launched China’s first data trading platform [14]. Since then, numerous platforms have been established across various regions. By 2022, over 40 data trading platforms had been established nationwide [18]. The establishment of these platforms, as an exogenous shock, provides an ideal quasi-natural experiment for analyzing the impact of data marketization on UILUE.
The Super-SBM model extends the DEA framework by removing the radial constraint and eliminating the assumption of fixed inputs or outputs during efficiency measurements. It also allows efficient decision-making units (DMUs) to attain efficiency scores greater than one, enabling more precise ranking and comparison. This feature makes the model widely applicable in efficiency analysis. This study employs a Super-SBM model with undesirable outputs to assess UILUE, drawing on panel data from 284 Chinese cities spanning the period of 2006 to 2022. The establishment of data trading platforms is treated as an exogenous shock, providing a quasi-natural experiment. A multi-period DID model is applied to estimate the causal impact of DFM on UILUE and its underlying mechanisms. Additionally, the study explores the heterogeneous effects based on geographical location, market segmentation, and environmental regulations. All these findings help policymakers design data trading policies, enhance UILUE, and promote sustainable urban development.

2. Literature Review

2.1. DFM and Efficiency

Extensive research has explored the relationships among marketization, land marketization, DFM, and efficiency. Market-oriented reforms have significantly improved resource allocation efficiency in China, contributing 1.3% percentage points annually to economic growth and accounting for 35% of total factor productivity growth [19]. Land marketization has promoted high-quality industrial development by increasing land prices and fostering an open and fair land market [20]. It also improves resource allocation efficiency by effectively signaling land prices and reducing land resource misallocation [21]. This, in turn, significantly enhances green total factor productivity [22]. For industrial land specifically, land marketization reforms have curbed industrial land expansion and improved UILUE [23].
DFM shares the general functions of marketization while also playing a broader role by facilitating data flow. It reduces uncertainty in product and service investments, minimizes resource misallocation between supply and demand, and enhances firms’ operational efficiency [12]. Ouyang and Hu [18] demonstrated that DFM enables more accurate assessments of firm conditions by financial institutions, thereby enhancing financing efficiency. By providing essential data resources, DFM facilitates the integration of green technology and enhances the efficiency of green innovation [24]. Additionally, it increases market competition, compelling firms to improve production efficiency [25]. DFM also improves carbon emission efficiency through carbon monitoring and resource reutilization, further promoting green production efficiency [11,26]. However, some studies highlight the potential adverse effects, noting that the infrastructure required for DFM—such as network facilities and data centers—may increase resource and energy consumption, thereby hindering efforts to control pollution [27,28].
Prior research on marketization and land marketization provides an important theoretical foundation for understanding total factor productivity, resource allocation efficiency, and UILUE. However, DFM differs significantly from traditional marketization. Traditional marketization shifts resource allocation from government planning to market-driven mechanisms. Unlike traditional marketization, DFM does not primarily focus on the role of government and the market in resource allocation. Instead, it addresses issues such as data ownership, pricing, and security [29,30]. Moreover, traditional marketization involves conventional factors of production, such as land, capital, and labor. In contrast, DFM deals specifically with data, a novel production factor distinct from traditional factors in terms of competitiveness and externalities [31]. Thus, the impact of DFM is likely to differ notably from that of traditional marketization.
The impact of DFM on efficiency provides a direct theoretical foundation for this study, particularly in relation to resource misallocation and technological innovation. Although existing studies confirm that DFM significantly enhances firms’ operational efficiency, financing efficiency, green innovation, and productivity, its impact on UILUE remains unclear. This gap presents opportunities for further theoretical and empirical investigation.

2.2. Definition, Measurement Methods, and Influencing Factors of UILUE

Urban land use efficiency (ULUE) is a key metric for evaluating the quality of urban land resource allocation. Improving ULUE involves producing more output with the same land input or achieving the same output with less land input [1]. It reflects optimized resource allocation and a shift toward intensive economic development [32]. Studies on the determinants of ULUE have primarily focused on economic, technological, and institutional drivers. Ge and Liu [1] highlighted economic development and industrial upgrading as key determinants of ULUE. Han et al. [33] found that agricultural–industrial agglomeration decreases ULUE, whereas manufacturing and technological service agglomeration enhances ULUE. Several studies have confirmed that technological innovation and R&D investment significantly enhance ULUE [26,34,35]. Yu and Zhou [36] found that China’s urban administrative hierarchy significantly influences ULUE by altering resource agglomeration patterns and allocation processes. Moreover, inefficient urban spatial planning may exacerbate land hoarding and inefficient land circulation [37]. Studies on Ethiopia suggest that its urban land leasing policies have failed to effectively address inefficiencies in land use [38].
UILUE measures how efficiently industrial land inputs are converted into economic outputs, considering industrial pollutants as negative outputs [39]. It is a crucial component of industrial productivity. Early studies primarily used index methods to measure UILUE, typically focusing on inputs such as industrial investment and employment per unit of industrial land [40]. Other studies adopted industrial output per unit area of industrial land as a direct efficiency measure [41,42]. More recent research has utilized methods such as entropy-weighted TOPSIS, which incorporate broader indicators like industrial assets, profits, green space coverage, and air quality [43]. DEA, which measures efficiency by comparing DMUs against the production frontier, is widely used in UILUE studies [44,45]. More recently, the Super-SBM model, which incorporates undesirable outputs like industrial pollutants, has gained popularity. This method comprehensively evaluates UILUE by including environmental impacts and providing more accurate efficiency estimates [46,47]. Key determinants of UILUE include industrialization, technological progress, and land investment [45,48]. Locurcio et al. [49] emphasize that goal-oriented economic growth and economies of scale shape the allocation of urban industrial land. Additionally, technological innovation is playing an increasingly significant role in this process. Chen et al. [45] found that economic development in China’s resource-dependent cities significantly enhances UILUE. Xie et al. [48] observed an inverted N-shaped nonlinear relationship between economic development and UILUE in cities along the middle reaches of the Yangtze River. Moreover, Yan et al. [39] highlighted that urban expansion exhibits a phased effect on UILUE, initially increasing before subsequently declining.
Existing studies primarily focus on ULUE, while research on UILUE remains limited. However, UILUE issues in China are more pronounced than those in general urban land use efficiency. Specifically, China’s industrial land is excessively large and spatially inefficient [50]. Despite substantial industrial investment, economic efficiency remains low [51]. The extensive use of industrial land has led to significant farmland loss, exacerbating conflicts between food security and industrial development [48]. Moreover, industrial emissions not only pose a direct threat to urban residents’ health but also severely damage the environment [52]. Research on UILUE has primarily focused on conventional factors, identifying technological advancement, industrial upgrading, and land investment as key drivers. Studies on DFM suggest that it significantly fosters technological innovation and alleviates resource misallocation. This implies that DFM may have a substantial impact on UILUE through technological innovation and resource allocation. However, few studies have systematically examined the impact of DFM on UILUE from the perspective of data trading platforms, and even fewer have explored the underlying mechanisms.
This study examines how DFM affects UILUE, using the super-efficiency SBM model to measure UILUE. It also explores the underlying mechanisms driving this relationship. This study not only contributes to the theoretical framework but also offers valuable policy insights for improving UILUE and promoting sustainable urban development.

3. Theoretical Analysis

DFM enables market participants to fully exploit the value of data, significantly enhancing UILUE by improving productivity, increasing land output per unit, reducing production costs, and mitigating industrial pollution. On the one hand, DFM enhances UILUE by boosting industrial productivity and increasing land output per unit. Data trading platforms aggregate vast, multi-source market information, allowing industrial firms to access real-time market dynamics, including raw material prices, industry demand fluctuations, and supply chain conditions. This information enables firms to refine production and operational strategies [12], leading to higher economic output per unit of industrial land. Additionally, it facilitates strategic adjustments in production scale and site selection, further enhancing UILUE. On the other hand, DFM strengthens UILUE by lowering production costs and mitigating industrial pollution. The open and shared nature of marketized data enables firms to access information on cost structures, resource consumption, pollution emissions, and environmental policies from industry leaders. In a competitive market environment, firms—either proactively or reactively—adopt advanced technologies and management practices from industry leaders [25]. This process lowers production costs, minimizes emissions, reduces resource waste, and enhances environmental efficiency [26]. Therefore, the following hypothesis is proposed:
H1. 
DFM enhances UILUE.
From the perspective of indirect effects, DFM enhances UILUE by stimulating technological innovation. Technological innovation is a key determinant of industrial land resource allocation efficiency, and its absence can constrain improvements in land use efficiency [1]. First, DFM expands the frontier of innovation possibilities, creating greater opportunities for technological advancements. Data trading platforms provide diverse data resources, enabling firms to access cross-sector and cross-industry insights, identify technological gaps, and explore new application scenarios, thereby fostering technological innovation [29]. Additionally, data ownership and valuation mechanisms enhance data reliability and validity, assisting innovators in integrating technological and market demand data, fostering synergy among technological components, and driving both integrative and breakthrough innovations. Second, DFM facilitates the circulation of failed innovation data, optimizing the innovation ecosystem. It not only accelerates the diffusion of successful innovations but also enables the sharing of failed innovation data, allowing other innovators to identify critical challenges and constraints in innovation pathways, thereby preventing redundant investments in similar technological directions [53]. Failed innovation data contain insights into technological bottlenecks and market demand, providing innovators with new perspectives and solutions while unlocking the potential for secondary innovations.
Technological innovation enables producers to substitute high-energy-consuming inputs, reduce resource consumption, and mitigate environmental burdens, thereby enhancing the environmental performance of industrial production [35]. Additionally, by optimizing production processes and end-of-pipe treatment technologies [54], technological innovation reduces pollution intensity per unit area of industrial land. Endogenous growth theory identifies technological innovation as a key engine of long-term economic growth [53]. Innovation-driven economic growth not only enhances urban land productivity but also boosts government fiscal revenue [35,55], supporting infrastructure development in transportation networks, energy supply, and information services. This, in turn, optimizes industrial land conditions and further improves UILUE.
DFM also enhances UILUE by reducing land resource misallocation. Improving UILUE depends on the effective matching of land resources with highly productive firms. However, low-cost or even “zero-cost” industrial land policies often attract inefficient firms, which consume substantial land resources and restrict the expansion of more productive enterprises [5]. Resource misallocation weakens the selection effect of the land market [5], hindering the upgrading of productive firms and leading to land idleness and resource waste. DFM integrates and analyzes land supply and demand data, allowing policymakers to precisely identify optimal land use and allocate industrial land to efficient firms, thereby reducing inefficient utilization. Moreover, the transparency mechanisms of data trading platforms reduce resource misallocation caused by rent-seeking behavior and minimize economic losses due to rent dissipation [56]. Through bidding and information disclosure, DFM minimizes resource waste caused by allocation biases or policy distortions and enhances the competitive environment for land distribution. Additionally, data trading platforms facilitate dynamic land use monitoring by providing data to help governments identify idle and inefficient land, thereby optimizing land management strategies. Therefore, we propose the following hypothesis:
H2. 
DFM enhances UILUE by stimulating technological innovation and mitigating land resource misallocation.

4. Research Design

4.1. Variables

4.1.1. Dependent Variable

UILUE is commonly measured using three methods: DEA, the index method, and the entropy weight method. DEA, a widely used method in efficiency assessment, evaluates the relative performance of DMUs in multi-input, multi-output settings [57]. The index method quantifies UILUE using a single indicator, providing a straightforward representation of the effects of urban land use [57]. The entropy weight method assigns weights based on the dispersion of efficiency measurement data and calculates UILUE through weighted dimensionality reduction [58].
Compared to traditional DEA models, the standard SBM model relaxes the radial assumption of proportional input-output changes and the angular assumption of fixed input or output orientations. This relaxation allows for efficiency evaluations that better align with real-world conditions [59]. However, the standard SBM model cannot rank or differentiate multiple efficient DMUs [60]. The Super-SBM model overcomes this limitation. The model constructs a production frontier and evaluates efficiency by comparing each DMU’s inputs, desirable outputs, and undesirable outputs against this benchmark. It has been widely applied in research on energy efficiency [61], land use efficiency [62], and environmental performance [63]. The Super-SBM model is sensitive to outliers and extreme values, making it difficult to distinguish inefficiency from random errors. To ensure robustness, this study uses UILUE measured by the super-efficiency SBM model incorporating undesirable outputs as the baseline measure. Additionally, UILUE calculated with the index method is used for robustness checks.
In the super-efficiency SBM model, inputs follow the conventional production function framework, incorporating land, labor, and capital. Based on the existing literature [39], this study selects urban industrial land area, industrial employment, and industrial fixed asset investment as input variables. Output indicators are divided into desirable and undesirable outputs. The desirable output primarily reflects industrial economic performance [39], while the undesirable output represents pollutants generated by industrial activities [64]. Industrial value-added is used as a proxy for industrial economic output [48]. Given that industrial waste is a major source of environmental pollution [34], this study includes industrial wastewater, sulfur dioxide emissions, and industrial dust as undesirable outputs. Following Lee [65], the UILUE calculation formula is specified as follows:
UILUE = m i n 1 1 m i = 1 m s i x x i 0 t 1 + 1 s 1 + s 2 ( k = 1 s 1 s k y y k 0 t + l = 1 s 2 s l z z l 0 t ) s . t . x i 0 t = t = 1 T j = 1 n λ j x j t + s i x , i y k 0 t = t = 1 T j = 1 n λ j y j t s k y , k z l 0 t = t = 1 T j = 1 n λ j z j t + s l z , l s i x , s k y , s l z , λ j   0 , j = 1 n λ j = 1   , i , j , k , l
where s i x ,   s k y , and s l z denote slack variables for inputs, desirable outputs, and undesirable outputs, respectively.

4.1.2. Independent Variables

As the primary infrastructure for the standardized exchange of data factors, data trading platforms play a crucial role in DFM [25]. Their establishment serves as a key indicator of DFM’s development. Following Shen et al. [11], this study employs the presence of a data trading platform as a proxy for DFM. Specifically, cities with an operational data trading platform are assigned to the treatment group, whereas those without are assigned to the control group. For cities in the treatment group, DFM is coded as 1 from the platform’s establishment year onward; otherwise, it remains 0.

4.1.3. Mediating Variables

To test hypothesis 2, this study identifies technological innovation (Tech) and land resource misallocation (Misi) as the two mediating variables. Given that patent grants are a common indicator of urban technological innovation [66], and that invention patents more effectively capture substantive innovation capacity [67], this study uses the number of invention patents granted per capita as a proxy for technological innovation. In an efficiently allocated environment, firms should have similar rankings in productivity and factor utilization [68]. A weaker correlation between these rankings signals misallocation, leading to lower actual output and a decline in output ranking [69]. This suggests that misallocation worsens when the share of factor use is disproportionately high while the share of output remains relatively low. Following Duranton et al. [69], we measure misallocation by calculating the ratio between a city’s share of industrial land use and its share of industrial output within the overall allocation framework, as defined in Equation (2):
M i s i i t = U I L i t / i = 1 N U I L i t I n d i t / i = 1 N I n d i t
where M i s i i t denotes the urban land resource misallocation index, U I L i t represents the industrial land area, and I n d i t refers to local industrial value-added.

4.1.4. Control Variables

To address potential omitted variable bias, this study incorporates several control variables that may affect UILUE:
  • Economic development (ED): Compared to per capita GDP, nighttime light data obtained through satellite remote sensing are less affected by statistical methods and data collection biases. They provide a more objective measure of regional economic development [70]. Therefore, this study employs the nighttime light index as a proxy for regional economic development.
  • Industrial structure (IS): Defined as the share of secondary sector value-added in regional GDP, reflecting its impact on UILUE.
  • Openness to trade (OP): Measured as the ratio of total trade (imports and exports) to regional GDP, accounting for the potential impact of economic openness on UILUE.
  • Population density (PD): Measured as the ratio of the urban population to the built-up area, reflecting the influence of population agglomeration on UILUE.
  • Technological investment (TI): Measured as the share of government expenditure on science and technology to total fiscal expenditure.
  • Marketization of land transactions (ML): Existing studies indicate that the marketization of land transactions significantly enhances UILUE [71]. Therefore, this study employs the share of land transferred via bidding, auction, and listing in total land transactions as a proxy for land marketization. The definitions of these variables are presented in Table 1.

4.2. Sample and Data

Given data availability, this study analyzes a sample of 284 prefecture-level cities in China from 2006 to 2022. Data for calculating UILUE are sourced from the China Urban Statistical Yearbook and the China Urban Construction Statistical Yearbook. Data on platform transactions were manually collected from the Big Data White Paper (2021), published by the China Academy of Information and Communications Technology [14]. The establishment year and location of each data trading platform are identified and matched to the corresponding UILUE cities. Cities with data platforms are assigned to the treatment group, whereas those without are assigned to the control group. The number of invention patents granted is sourced from the China National Intellectual Property Administration. Control variables include the nighttime light index from the Harvard Dataverse, land marketization data from the China Land Market website, and other variables from the China Urban Statistical Yearbook. Missing values are handled using linear interpolation. Table 2 reports descriptive statistics of the main variables.

4.3. Empirical Methodology

To evaluate the effect of DFM on UILUE, this study uses the establishment of data trading platforms as the treatment variable and applies a multi-period DID model. Data trading platforms are designed to standardize and centralize data transactions, reducing information asymmetry between buyers and sellers [14]. These platforms were not created to improve UILUE, making their establishment exogenous to UILUE. Therefore, the DID approach effectively isolates the causal effect of DFM on UILUE. In standard DID models, policy shocks occur simultaneously, meaning all treatment groups receive the intervention at the same time [72]. Propensity Score Matching-DID (PSM-DID) improves upon standard DID by matching treated and control units with similar characteristics, helping to mitigate sample selection bias. However, when using unbalanced panel data, PSM-DID may introduce missing data bias due to incomplete matching [73]. Since data trading platforms were introduced gradually from 2014 to 2021 and the dataset is an unbalanced panel, this study employs PSM-DID only as a robustness check, rather than as the baseline regression. The multi-period DID approach extends the standard DID model by accounting for policies implemented at different times, allowing for the identification of policy effects across various treatment groups [74]. Accordingly, this study adopts a multi-period DID model, implemented in Stata 18.0, to estimate the impact of data trading platform establishment on UILUE [25]:
U I L U E i t = α 0 + α 1 D F M i t + α 2 c o n t r o l s i t + μ i + ν t + ε i t
where i denotes cities and t indexes years. U I L U E i t measures urban industrial land use efficiency. D F M i t is the primary explanatory variable, coded as 1 if a city has established a data trading platform for the first time (including the establishment year and subsequent years) and 0 otherwise. The coefficient α 1 captures the difference in UILUE between treated and control groups after platform establishment, identifying its causal effect. c o n t r o l s i t represents a vector of control variables. μ i and ν t denote individual and year fixed effects, respectively, while ε i t is the stochastic error term.

5. Results

5.1. Baseline Regression Results

To examine the relationships among key variables, we present the correlation matrix in Table 3. The results indicate that UILUE is positively correlated with DFM, ED, IS, OP, and TI, suggesting that cities with data trading platforms, higher levels of economic development, a more robust industrial structure, greater openness to trade, and higher technological investment tend to achieve higher UILUE. In contrast, UILUE is negatively correlated with PD and ML, indicating a potential inverse relationship. Although some correlations among the variables are statistically significant, most coefficients remain below 0.6. The only exception is the correlation between ED and TI, which slightly exceeds 0.6, necessitating further assessment of potential multicollinearity. To address this, we performed a variance inflation factor (VIF) test. The results confirm that all VIF values are below the commonly accepted threshold of 3, suggesting no severe multicollinearity issues. The highest VIF, observed for ED (2.22), indicates a moderate correlation with other variables but remains within an acceptable range. Furthermore, the model’s mean VIF is 1.36, well below 3, confirming that multicollinearity does not materially affect the regression results.
This study conducts regression analysis based on Model (2) to assess the impact of DFM on UILUE. The regression results are reported in Table 4. Column (1) includes only individual and time-fixed effects. Column (2) introduces control variables. Column (3) reports estimates with clustered robust standard errors. As shown in Table 4, the estimated DFM coefficients remain consistently positive and statistically significant at the 1% or 5% levels. This suggests that, after controlling for regional characteristics and fixed effects, data trading platforms exert a significant positive effect on UILUE. After controlling for other factors, the establishment of data trading platforms increases UILUE in treated cities by an average of 3.89% relative to control cities. These findings indicate that treated cities experience greater UILUE improvements following the establishment of data trading platforms.
Among the control variables, all except TI have a significant positive effect on UILUE. Several factors may explain these relationships. First, cities with higher ED tend to have larger market sizes and better infrastructure, which attract a diverse range of industries and firms. In a market-driven environment, firms compete more intensively for land, thereby enhancing UILUE. Second, as IS improves, high-value-added industries expand more rapidly, increasing industrial output per unit of land. Third, greater OP facilitates the relocation of production chains and attracts foreign capital, technology, and management expertise, all of which enhance productivity. Fourth, cities with higher PD benefit from a more abundant labor force and larger consumer markets. These advantages lower labor costs for firms and facilitate industrial clustering, further enhancing UILUE. The negative effect of TI may stem from China’s relatively low technological innovation efficiency and the long lag between R&D investment and its practical application [75]. Finally, ML reinforces the role of price mechanisms in regulating urban land supply and demand [76], thereby optimizing land resource allocation.
Comparing Table 3 and Table 4 reveals that the coefficients and directions of DFM, IS, and OP on UILUE remain largely unchanged. However, the coefficient of ED on UILUE decreases compared to its correlation, while the coefficients of PD, TI, and ML on UILUE show significant directional differences from their correlations. This discrepancy may result from omitted variable bias. In the correlation analysis, other variables were not controlled, whereas the regression analysis accounts for multiple influencing factors, particularly by controlling for time and city effects. This adjustment allows for a more precise estimation of the true impact of these control variables on UILUE.

5.2. Robustness Tests

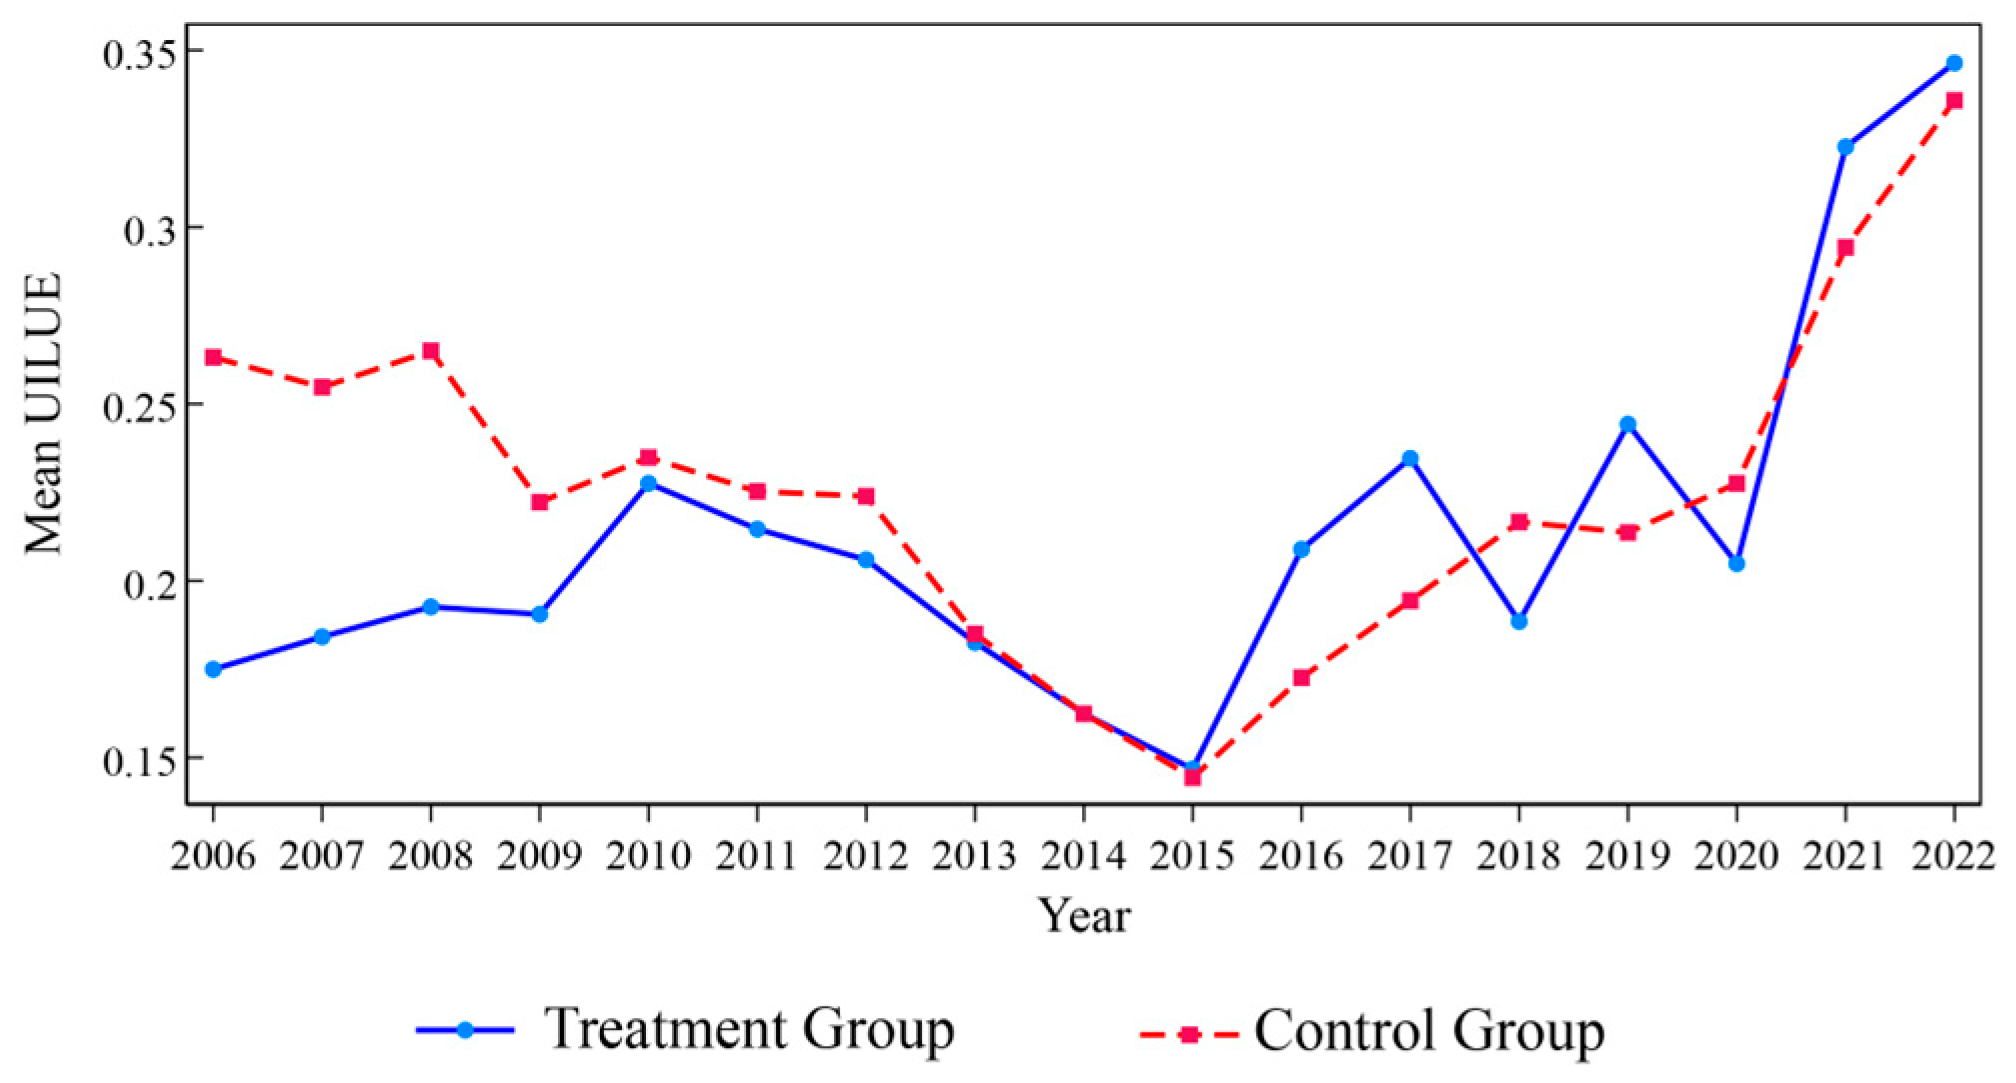
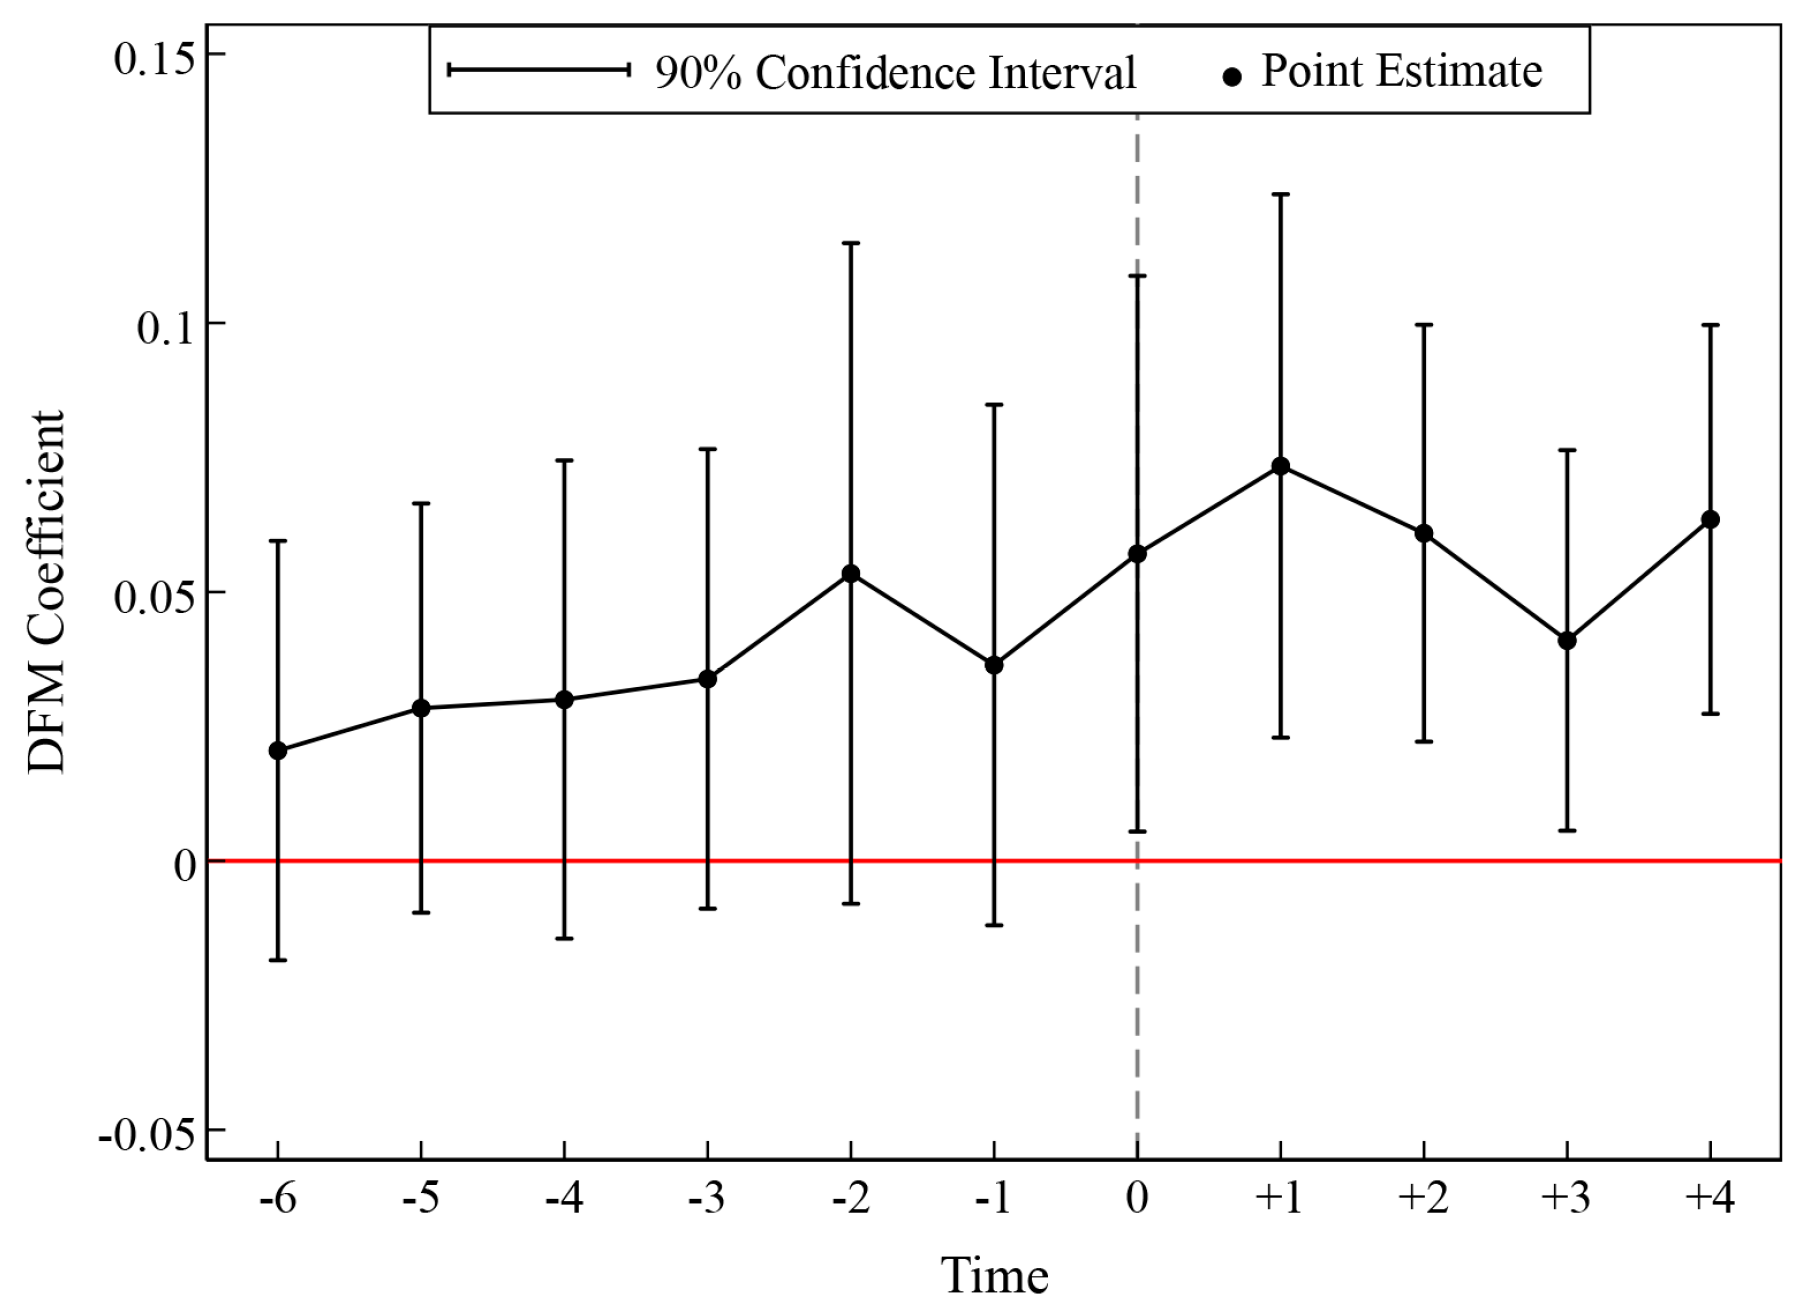
5.2.1. Parallel Trend Test
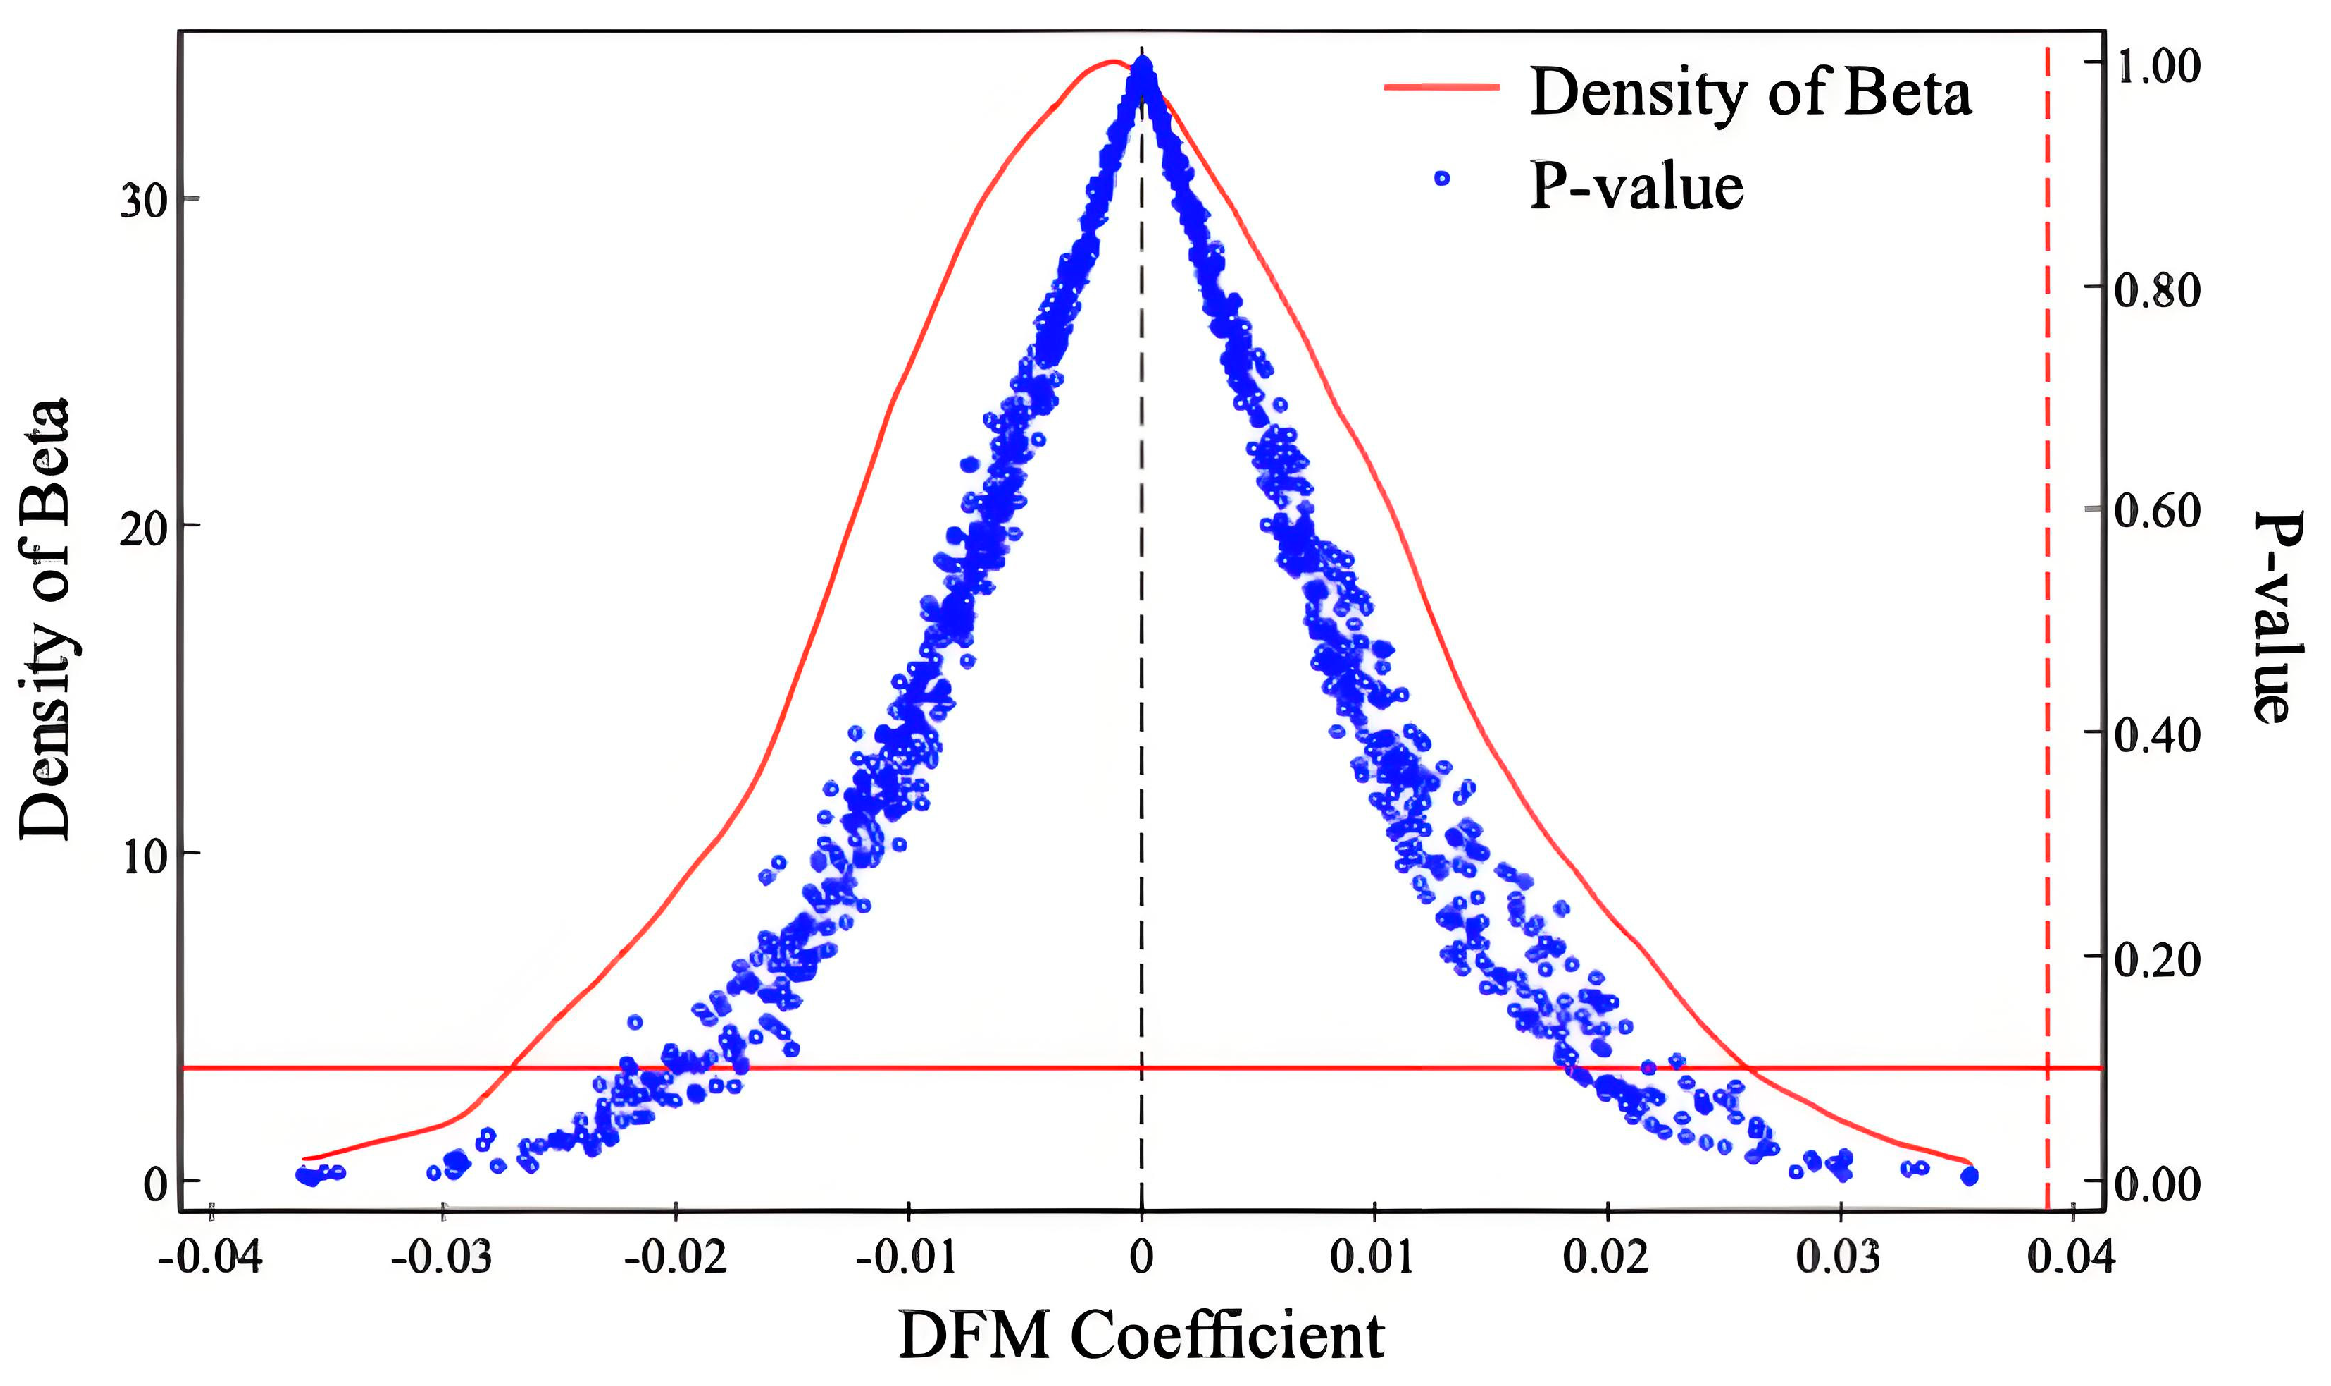
We calculate the mean UILUE for the treatment and control groups based on whether a city has established a data trading platform and compare their trends over time (Figure 1). The results show that before China’s first data trading platform was established in 2014, the mean UILUE of the treatment group was either lower than or equal to that of the control group. However, after the introduction of data trading platforms, the mean UILUE of the treatment group surpassed that of the control group in multiple years, partially supporting the parallel trend assumption.
To further explore the dynamic effects of DFM, this study employs an event study methodology [77]. The analysis period is set from six years before to four years after platform establishment. This approach evaluates the pre-treatment parallel trends assumption and quantifies the post-treatment effects of platform establishment on UILUE. The dynamic effects model is specified as follows:
U I L U E i t = β 0 + m = 1 6 Q m D F M i , t m + n = 1 4 H n D F M i , t + n + β 1 c o n t r o l s i t + μ i + λ t + ε i t
D F M i , t m represents the m-th year before platform establishment, while D F M i , t + n denotes the n-th year after. If the pre-establishment coefficients Q m are statistically insignificant, it suggests that the treatment and control groups follow parallel trends. If the post-establishment coefficients H n are significant, it confirms the dynamic effects of platform establishment on UILUE. Other variable specifications remain consistent with Equation (3).
Figure 2 presents the estimated coefficients Q m and H n from Equation (4). The pre-establishment coefficients are statistically insignificant, confirming that the treatment and control groups followed parallel trends before the platform’s introduction. This validates the parallel trends assumption. Following the platform’s establishment, UILUE in the treatment group improves significantly relative to the control group. The post-establishment coefficients remain significantly positive, indicating a sustained positive impact of data trading platforms on UILUE.

5.2.2. Placebo Test

Following Qian et al. [78], this study randomly assigns cities and their respective data trading platform establishment years to generate pseudo-DFM. Then, we re-estimate the regression based on Equation (2) and record the coefficient and p-value of the pseudo-DFM. After repeating this process 1000 times, the coefficient distribution is visualized using a kernel density plot, while the p-values are represented as blue scatter points (Figure 3). The placebo test results show that the estimated coefficients of the pseudo-DFM follow an approximately normal distribution centered around zero. These coefficients are significantly different from the actual DFM coefficient in the baseline regression. Moreover, the majority of pseudo-DFM coefficients have p-values greater than 0.1. These findings reinforce the robustness of the baseline regression results, confirming that the positive effect of DFM on UILUE is not an artifact of spurious correlations.

5.2.3. Bacon Decomposition

Recent developments in multi-period DID theory indicate that when treatment effects follow a clear time trend, the TWFE-DID estimator can produce estimates that deviate from the true effects, even with random treatment assignment. This happens because the multi-period DID estimator is essentially a weighted average of multiple two-period DID estimates. These estimates often use early-treated and future-treated units as control groups, creating the “bad control group” problem. Early-treated units have already been exposed to the policy, so their behavior no longer represents an untreated state. Using them as controls may bias the estimated treatment effects. If future-treated units serve as controls, they may already be affected by policy anticipation, further distorting the estimated effects. The Goodman-Bacon decomposition separates the TWFE-DID estimator into treatment effects based on different control groups and their respective weights in the overall estimate. It identifies cases where early-treated, future-treated, and never-treated units serve as controls. This allows researchers to identify bad control groups and assess their impact on the overall estimate. This study applies the Goodman-Bacon decomposition to examine this issue [79]. Table 5 reports the decomposition results. Although the estimated treatment effect is negative when the late-treated group is used as the control, its weight is only 1.6%. Thus, the “bad control group” problem does not substantially affect the results.

5.2.4. Propensity Score Matching (PSM)

Although the parallel trends test confirms that cities exhibited similar UILUE trends before the establishment of data trading platforms, selection bias may still arise due to unobserved confounding factors. Cities with certain observable characteristics, such as high population density and economic development, are more likely to establish these platforms, as they generate more data and exhibit greater demand for data trading. To mitigate potential selection bias, this study constructs a control group from cities that have never established data trading platforms, ensuring comparability with the treatment group in terms of observable characteristics. To ensure robustness in estimation, this study employs four annual PSM methods: radius matching, 1:2 nearest neighbor matching, local linear regression, and kernel matching. Table 6 reports the PSM-DID regression results. The findings indicate that across all matching methods, the DFM coefficient remains significantly positive at the 5% level, highlighting the strong and consistent impact of DFM on UILUE.

5.2.5. Other Robustness Tests

Since DFM may generate spillover effects on neighboring cities [12], such as increased data flows and technological diffusion, multi-period DID may not fully isolate these effects. In contrast, the Synthetic Control Method (SCM) constructs a synthetic control group by optimally weighting untreated cities, thereby mitigating spillover bias. This study employs SCM to estimate the impact of DFM on UILUE [80]. According to the 2023 China Statistical Yearbook (https://www.stats.gov.cn/sj/ndsj/2023/indexch.htm, accessed on 21 January 2025), Shanghai, Beijing, Shenzhen, and Guangzhou have the highest economic output in China. Their exceptionally high levels of economic development, population density, and other structural characteristics make it difficult to construct a valid synthetic control group. Therefore, these cities are excluded from the analysis to ensure the validity of SCM. The SCM regression results are presented in Table 7, Column (1). The estimated DFM coefficient is 0.048, closely aligning with the coefficient and significance level in the baseline regression, further confirming the robustness of the findings.
To mitigate potential measurement errors, this study adopts an alternative approach to measuring UILUE. Following Zhang et al. [57], this study measures UILUE using industrial value-added output per unit of industrial land. A higher value of this metric reflects greater UILUE. The super-efficiency SBM method yields dimensionless efficiency values, whereas the index-based approach represents UILUE in billion yuan per square kilometer, which complicates direct comparisons. To ensure comparability, this study standardizes industrial value-added output per unit of industrial land by applying the Z-score prior to regression analysis [81]. The regression results in Column (2) of Table 7 confirm that even when using an alternative UILUE measure, DFM maintains a significant positive effect on UILUE.
To further address potential estimation bias from unobserved city-level factors, this study includes city-time trend interaction terms in the baseline regression model. The regression results in Column (3) of Table 7 reaffirm the positive impact of DFM.
This study also considers potential confounding effects from other policies introduced during the sample period, such as the establishment of National Big Data Comprehensive Pilot Zones and Smart City initiatives. The treatment variables for these policies are added to the baseline regression model, and the corresponding results reported in Column (4) of Table 7. The estimated coefficient of data trading platform establishment remains positive.
To account for the potential influence of special policies on centrally administered municipalities, this study excludes these municipalities and re-estimates the model. The re-estimation results presented in Column (5) of Table 7 indicate that the coefficient of DFM remains significantly positive, further corroborating the research conclusions.

5.3. Mechanism Analysis

Theoretical analysis indicates that DFM enhances UILUE through two primary mechanisms: fostering technological innovation and reducing land resource misallocation. To empirically test these mechanisms, this study constructs the following mediation model [76]:
M i t = ρ 0 + ρ 1 D F M i t + ρ 2 c o n t r o l s i t + μ i + υ t + ε i t
U I L U E i t = γ 0 + γ 1 D F M i t + γ 2 M i t + γ 3 c o n t r o l s i t + μ i + ν t + ε i t
where M i t denotes the mediating variable, including technological innovation (Tech) and land resource misallocation (Misi).
Table 8 presents the mediation analysis results. Columns (1) and (2) report the estimates using technological innovation as the mediating variable. The results indicate that the coefficient for DFM’s effect on technological innovation is significantly positive, confirming that DFM significantly fosters technological innovation. Similarly, the coefficient for technological innovation’s effect on UILUE is significantly positive, confirming its beneficial impact on efficiency. After accounting for the mediation effect, DFM’s impact on UILUE remains significantly positive, though the coefficient decreases relative to the baseline regression. This indicates that technological innovation partially mediates the relationship between data trading platforms and UILUE. The Sobel test reveals that technological innovation mediates approximately 29.29% of the total effect.
Columns (3) and (4) display the results using land resource misallocation as the mediating variable. Column (3) shows that the establishment of data trading platforms significantly reduces land resource misallocation. Column (4) indicates that land resource has a significant negative effect on UILUE. Even after accounting for the mediation effect, the positive impact of data trading platforms on land use efficiency remains significant, though the coefficient decreases slightly, suggesting that land resource misallocation acts as a partial mediator. Additionally, the Sobel test shows that land resource misallocation mediates approximately 7.88% of the total effect.

5.4. Heterogeneity Analysis

Since the study sample includes cities in diverse geographic locations with varying market conditions and environmental regulations, market participants may respond differently to the establishment of data trading platforms. Therefore, further investigation into the heterogeneous effects of DFM on UILUE is necessary.

5.4.1. Geographic Location

Significant regional disparities exist in economic development, technological innovation capabilities, and human capital across China, which may result in heterogeneous effects of DFM on UILUE. To examine this heterogeneity, the sample is divided into two groups: eastern and central-western cities. Separate regressions are performed for each group. The results, presented in Columns (1) to (3) of Table 9, show that the platform establishment significantly improves UILUE in both regions, with a more pronounced effect in the eastern region. This disparity is likely driven by higher population density, concentrated economic activity, and a larger volume of data in the eastern region. Moreover, market participants in the East exhibit a stronger demand for data trading, coupled with a more favorable innovation environment and abundant institutional support, leading to greater UILUE gains from the establishment of platforms.

5.4.2. Market Segmentation

In highly segmented markets, barriers between markets hinder the free flow of data resources and production inputs, restricting data trading platforms’ access to high-quality data, skilled labor, and advanced technology. This constrained resource flow slows improvements in data service quality and efficiency, thereby weakening the capacity of data trading platforms to enhance UILUE. In contrast, less segmented markets overcome geographical barriers, facilitating the cross-regional flow of resources and information. This enables data trading platforms to more efficiently access critical resources such as data, capital, and technology, thereby improving UILUE. Accordingly, this study categorizes cities into high and low market segmentation regions based on the median level of market segmentation. It then separately estimates the impact of DFM on UILUE. The estimation results are reported in Columns (4) and (5) of Table 9. In cities with low market segmentation, data trading platforms establishment significantly boosts UILUE, whereas in highly segmented markets, the effect is not significant.

5.4.3. Environmental Regulation

Some studies suggest that environmental regulation may raise production costs and reduce investment in innovation, potentially lowering production efficiency [82]. However, the Porter hypothesis argues that moderate environmental regulatory pressure can stimulate technological innovation and enhance resource efficiency [83]. This study measures the proportion of environmental regulation-related terms in government reports as a measure of regulatory intensity [84]. Based on the median value, cities are classified into high and low environmental regulation groups, and separate regressions are performed for each. As shown in Columns (6) and (7) of Table 9, DFM significantly enhances UILUE in high environmental regulation regions. In contrast, this positive effect is not statistically significant in low environmental regulation regions. This may be because high environmental regulatory pressure, which compels firms to focus more on green technological innovation and pollution reduction. Moreover, the establishment of data trading platforms provides firms with diverse data resources, facilitating technological breakthroughs and efficiency gains, thereby amplifying the positive impact of DFM on UILUE.
Table 10 summarizes the estimated impact of DFM on UILUE under varying conditions. The estimated DFM coefficient ranges from 0.0242 to 0.048, with slight fluctuations. However, when UILUE is measured as industrial value-added output per unit of industrial land rather than using the super-efficiency SBM model, the coefficient rises to 0.0762. This may be due to the omission of capital and labor inputs in the alternative measurement method. While DFM enhances industrial productivity, its effects on labor and capital inputs emerge more gradually. Consequently, its positive impact on UILUE, which accounts for multiple inputs, is smaller than its effect on industrial output per unit of land. Both the baseline regression and robustness tests produce statistically significant results at the 5% and 1% levels, reinforcing the robustness of the findings.

5.5. Discussion

Prior studies have explored the role of DFM and the factors influencing of UILUE. This study treats the establishment of data trading platforms as an exogenous shock and systematically examines the effect of DFM on UILUE. The results indicate that DFM significantly enhances UILUE. The finding is consistent with the conclusions of Ouyang and Hu [18], who analyzed the impact of DFM on business operations and management efficiency, and Shen et al. [11], who focus on its effect on urban carbon emission efficiency.
This study further identifies two primary channels through which DFM positively impacts UILUE. On the one hand, DFM facilitates data flow and reduces information asymmetry, significantly promoting technological innovation. According to endogenous growth theory, technological innovation is a direct driver of economic development [53]. Economic development not only enhances urban land productivity but also increases government fiscal revenue [35,55], which, in turn, improves industrial land conditions and the production environment, ultimately boosting UILUE. Similarly, Yan et al. [39] argue that technological innovation enables higher output with fixed land resources, thereby improving UILUE. On the other hand, DFM effectively alleviates the resource misallocation caused by land finance, further enhancing UILUE. DFM enables the integration and analysis of land supply-demand data, accurately identifies optimal land use, and reduces economic losses from “rent dissipation” [56], thereby improving UILUE. This conclusion not only validates Chen’s [85] finding regarding the significant impact of land resource misallocation on land use efficiency but also indirectly supports Cong et al.’s [9] argument that data factors enhance production efficiency.
This study examines the heterogeneous effects of DFM on UILUE and finds that DFM significantly improves efficiency only in regions with low segmented markets and stringent environmental regulations, with the most pronounced impact in Eastern China. This finding aligns with previous studies [71,86]. In regions with low market segmentation, data trading platforms can access essential resources more efficiently, thereby enhancing UILUE. In areas with stringent environmental regulations, firms experience increased environmental pressures, increasing their likelihood of leverage data factors for green technological innovation and pollution reduction, which amplifies DFM’s positive effect. However, Shen et al. [11] argue that stringent environmental regulations may force firms to allocate more resources to pollution control equipment, thereby reducing investment in data factor market development and potentially weakening DFM’s impact. Regarding regional heterogeneity, the higher concentration of technology- and knowledge-intensive industries in Eastern China, along with a highly skilled workforce, facilitates the adoption and utilization of data factors. Furthermore, the region’s favorable innovation environment, strong institutional support, and high market openness enhance the positive impact of data trading platforms. Additionally, the urgent demand for improved UILUE, driven by rapid land development and conflicts between land supply and urban expansion [33], further reinforces this effect.
This study has certain limitations. First, although the study treats the platform establishment as an exogenous shock to examine the influence of DFM on UILUE, residual risks of endogeneity remain. Future research could enhance the robustness of these conclusions by identifying and applying suitable instrumental variables. Second, due to limited access to statistical data, this study measures UILUE at the city level. If future studies obtain firm-level land use data, more granular analyses could be performed. Third, while this study selects representative mediating variables and heterogeneity characteristics, the mechanisms through which DFM affects UILUE may involve additional, unexplored factors. Due to space and data constraints, these aspects are not examined in depth in this study. Future research could further investigate the underlying mechanisms. Finally, this study focuses exclusively on China. However, other countries, particularly those facing urbanization, industrialization, and land finance challenges, may encounter similar UILUE issues. This study does not examine the heterogeneous effects and mechanisms of DFM across different national contexts, highlighting an important avenue for future cross-country comparative research.

6. Conclusions

This study examines the impact of DFM on UILUE and its underlying mechanisms, using the establishment of data trading platforms as a quasi-natural experiment. The findings indicate that DFM significantly improves UILUE, and this conclusion remains robust across multiple robustness checks. Mechanism analysis reveals that DFM promotes UILUE by stimulating technological innovation and mitigating land resource misallocation. Heterogeneity analysis shows that the positive impact is most pronounced in regions with low market segmentation and stringent environmental regulation, particularly in Eastern China.
Based on these findings, we recommend the following policies. First, enhance data governance and strengthen market security. Governments should establish a structured data classification system, that categorizes data by sensitivity—public, corporate, personal, and sensitive—each with designated access controls, encryption standards, and transaction protocols. Regulatory authorities should monitor data participants, sources, transaction mechanisms, and intended uses to ensure compliance. Unauthorized access, data misuse, and illegal transactions should be strictly penalized to enhance data security and strengthen market trust. Furthermore, a scientifically sound data valuation and pricing mechanism should be established to quantify the economic value of various data assets. This will incentivize data providers to engage actively in market transactions and foster the sustainable growth of the data economy.
Second, technological innovation must be strengthened and land resource allocation must be improved. Governments should utilize data trading platforms to promote industry-university-research collaboration, facilitate the integration and exchange of innovative data, and advance key technologies such as homomorphic encryption, distributed computing, data masking, and blockchain. These initiatives contribute to the development of an open and efficient innovation ecosystem. Additionally, land market regulations should be reinforced to enhance transparency and efficiency, ensuring land is allocated through fair market mechanisms, thereby further improving urban land use.
Finally, the development environment must be improved and DFM’s potential must be fully realized. The central government should further reduce market segmentation and accelerate the establishment of a unified national market with standardized regulations. This will facilitate the free flow of production factors, goods, talent, and technology, promoting fair competition and land use efficiency across regions. Local governments should implement differentiated environmental regulations and incentivize industries to adopt clean energy and advanced technologies. Policies should encourage the restructuring, relocation, or phased exit of high-pollution, low-efficiency enterprises, ensuring the sustainable use of land resources. In the central and western regions, where marketization remains limited and technological foundations are weaker, government intervention is essential. Targeted public investments should expand broadband networks, 5G infrastructure, and data transmission capacity, ensuring robust digital connectivity. National and provincial technology funds should facilitate the establishment of regional data innovation hubs and government-supported incubators. Targeted incentives, such as tax breaks and subsidies, should be used to attract big data, AI, and cloud computing firms to these regions. These measures will help central and western regions bridge technological gaps and unlock their economic potential.

Author Contributions

Conceptualization, W.C. and S.L.; methodology, W.C.; software, W.C.; validation, W.C.; formal analysis, W.C.; investigation, W.C.; resources, S.L.; data curation, W.C.; writing—original draft preparation, W.C.; writing—review and editing, S.L.; visualization, W.C.; supervision, S.L.; project administration, S.L. All authors have read and agreed to the published version of the manuscript.

Funding

This research received no external funding.

Institutional Review Board Statement

Not applicable.

Informed Consent Statement

Not applicable.

Data Availability Statement

Dataset available on request from the authors.

Conflicts of Interest

The authors declare no conflicts of interest.

References

  1. Ge, X.J.; Liu, X. Urban Land Use Efficiency under Resource-Based Economic Transformation—A Case Study of Shanxi Province. Land 2021, 10, 850. [Google Scholar] [CrossRef]
  2. Gao, B.; Huang, Q.; He, C.; Sun, Z.; Zhang, D. How does sprawl differ across cities in China? A multi-scale investigation using nighttime light and census data. Landsc. Urban Plan. 2016, 148, 89–98. [Google Scholar] [CrossRef]
  3. National Bureau of Statistics. Available online: https://www.stats.gov.cn/sj/ndsj/ (accessed on 21 January 2025).
  4. Li, G.; Liu, Z.; Liu, T.; Chen, L. Twisted industrial structure, land financing mode and social security. Financ. Res. Lett. 2024, 69, 106115. [Google Scholar] [CrossRef]
  5. Zhang, J.; Xu, R.; Chen, J. Does industrial land marketization reform faciliate urban land use efficiency? Int. Rev. Econ. Financ. 2024, 96, 103609. [Google Scholar] [CrossRef]
  6. Tao, C.-Q.; Yi, M.-Y.; Wang, C.-S. Coupling coordination analysis and Spatiotemporal heterogeneity between data elements and green development in China. Econ. Anal. Policy 2023, 77, 1–15. [Google Scholar] [CrossRef]
  7. National Data Administration. Available online: https://www.nda.gov.cn/sjj/zwgk/zcfb/0830/20240830174038137859023_pc.html (accessed on 21 January 2025).
  8. Li, Q.; Chen, H.; Chen, Y.; Xiao, T.; Wang, L. Digital economy, financing constraints, and corporate innovation. Pac.-Basin Financ. J. 2023, 80, 102081. [Google Scholar] [CrossRef]
  9. Cong, L.W.; Wei, W.; Xie, D.; Zhang, L. Endogenous growth under multiple uses of data. J. Econ. Dyn. Control 2022, 141, 104395. [Google Scholar] [CrossRef]
  10. Kuizao, D.; Siman, W.; Zi, H. How the Construction of Data Trading Platform Affects Firms’ TFP? Econ. Perspect. 2023, 12, 58–75. [Google Scholar]
  11. Shen, N.; Zhou, J.; Zhang, G.; Wu, L.; Zhang, L. How does data factor marketization influence urban carbon emission efficiency? A new method based on double machine learning. Sust. Cities Soc. 2025, 119, 106106. [Google Scholar] [CrossRef]
  12. Wang, X.; Shi, Y.; Liu, D. Research on the Influence of Market-based Allocation of Data Elements on the Integration of Digital Economy and Real Economy: A Quasi-natural Experiment Based on a Data Trading Platform. J. Guangdong Univ. Financ. Econ. 2024, 39, 44–58. [Google Scholar]
  13. Ke, Y.; Zhang, Q.; Wang, G. How Market-based Allocation of Data Element Can Promote Urban Entrepreneurial Vitality—Explanation Based on the Factor Synergy Perspective. Inq. Econ. Iss. 2024, 8, 73–86. [Google Scholar]
  14. China Academy of Information and Communications Technology. Available online: http://www.caict.ac.cn/kxyj/qwfb/bps/202112/t20211220_394300.htm (accessed on 21 January 2025).
  15. Prüfer, J.; Schottmüller, C. Competing with Big Data. J. Indust. Econ. 2021, 69, 967–1008. [Google Scholar] [CrossRef]
  16. Farboodi, M.; Veldkamp, L. A Model of the Data Economy; National Bureau of Economic Research: Cambridge, MA, USA, 2021. [Google Scholar]
  17. Ming, C.; Zhifan, W. Empowering with “Digital”, improving quality with “New”: Marketization of data elements and new qualitative productivity of cities. J. Chongqing Univ. Soc. Sci. Ed. 2024, 1–13. [Google Scholar]
  18. Ouyang, Y.; Hu, M. The impact of data elements marketization on corporate financing constraints: Quasi-experimental evidence from the establishment of data trading platforms in China. Financ. Res. Lett. 2024, 69, 106132. [Google Scholar] [CrossRef]
  19. Fan, G.; Ma, G.R.; Wang, X.L. Institutional reform and economic growth of China: 40-year progress toward marketization. Acta Oecon. 2019, 69, 7–20. [Google Scholar] [CrossRef]
  20. Jin, W.; Zhang, Q.; Liu, T. Effect of Land Marketization on the High-Quality Development of Industry in Guangdong Province, China. Land 2024, 13, 1400. [Google Scholar] [CrossRef]
  21. Zhong, W.; Zheng, M. How the Marketization of Land Transfer Affects High-Quality Economic Development: Empirical Evidence from 284 Prefecture-Level Cities in China. Sustainability 2022, 14, 12639. [Google Scholar] [CrossRef]
  22. Lu, X.; Jiang, X.; Gong, M. How land transfer marketization influence on green total factor productivity from the approach of industrial structure? Evidence from China. Land Use Policy 2020, 95, 104610. [Google Scholar] [CrossRef]
  23. Pu, W.; Zhang, A. Can Market Reforms Curb the Expansion of Industrial Land?—Based on the Panel Data Analysis of Five National-Level Urban Agglomerations. Sustainability 2021, 13, 4472. [Google Scholar] [CrossRef]
  24. Li, H.; Du, X.; Yan, X.-W.; Xu, N. Digital Transformation and Urban Green Development: Evidence from China’s Data Factor Marketization. Sustainability 2024, 16, 4511. [Google Scholar] [CrossRef]
  25. Wang, D.; Liao, H.; Liu, A.; Li, D. Natural resource saving effects of data factor marketization: Implications for green recovery. Resour. Policy 2023, 85, 104019. [Google Scholar] [CrossRef]
  26. Zhou, Y.; Lu, Y. Spatiotemporal evolution and determinants of urban land use efficiency under green development orientation: Insights from 284 cities and eight economic zones in China, 2005–2019. Appl. Geogr. 2023, 161, 103117. [Google Scholar] [CrossRef]
  27. Zhang, L.; Mu, R.; Zhan, Y.; Yu, J.; Liu, L.; Yu, Y.; Zhang, J. Digital economy, energy efficiency, and carbon emissions: Evidence from provincial panel data in China. Sci. Total Environ. 2022, 852, 158403. [Google Scholar] [CrossRef] [PubMed]
  28. Coyne, B.; Denny, E. Applying a Model of Technology Diffusion to Quantify the Potential Benefit of Improved Energy Efficiency in Data Centres. Energies 2021, 14, 7699. [Google Scholar] [CrossRef]
  29. Cong, L.W.; Xie, D.; Zhang, L. Knowledge Accumulation, Privacy, and Growth in a Data Economy. Manag. Sci. 2021, 67, 6480–6492. [Google Scholar] [CrossRef]
  30. Jones, C.I.; Tonetti, C. Nonrivalry and the Economics of Data. Am. Econ. Rev. 2020, 110, 2819–2858. [Google Scholar] [CrossRef]
  31. Acemoglu, D.; Makhdoumi, A.; Malekian, A.; Ozdaglar, A. Too Much Data: Prices and Inefficiencies in Data Markets. Am. Econ. J. Microecon. 2022, 14, 218–256. [Google Scholar] [CrossRef]
  32. Stull, W.J. Land Use and Zoning in an Urban Economy. Am. Econ. Rev. 1974, 64, 337–347. [Google Scholar]
  33. Han, W.; Zhang, Y.; Cai, J.; Ma, E. Does Urban Industrial Agglomeration Lead to the Improvement of Land Use Efficiency in China? An Empirical Study from a Spatial Perspective. Sustainability 2019, 11, 986. [Google Scholar] [CrossRef]
  34. Zhang, R.; Wen, L.; Jin, Y.; Zhang, A.; Gil, J.M. Synergistic impacts of carbon emission trading policy and innovative city pilot policy on urban land green use efficiency in China. Sust. Cities Soc. 2025, 118, 105955. [Google Scholar] [CrossRef]
  35. Wang, Y.; Zhang, L. The Impact of Technology Innovation on Urban Land Intensive Use in China: Evidence from 284 Cities in China. Sustainability 2023, 15, 3801. [Google Scholar] [CrossRef]
  36. Yu, B.; Zhou, X. Urban administrative hierarchy and urban land use efficiency: Evidence from Chinese cities. Int. Rev. Econ. Financ. 2023, 88, 178–195. [Google Scholar] [CrossRef]
  37. Koroso, N.H.; Zevenbergen, J.A. Urban land management under rapid urbanization: Exploring the link between urban land policies and urban land use efficiency in Ethiopia. Cities 2024, 153, 105269. [Google Scholar] [CrossRef]
  38. Koroso, N.H. Urban land policy and urban land use efficiency: An analysis based on remote sensing and institutional credibility thesis. Land Use Policy 2023, 132, 106827. [Google Scholar] [CrossRef]
  39. Yan, S.; Peng, J.; Wu, Q. Exploring the non-linear effects of city size on urban industrial land use efficiency: A spatial econometric analysis of cities in eastern China. Land Use Policy 2020, 99, 104944. [Google Scholar] [CrossRef]
  40. Meng, Y.; Zhang, F.-R.; An, P.-L.; Dong, M.-L.; Wang, Z.-Y.; Zhao, T. Industrial land-use efficiency and planning in Shunyi, Beijing. Landsc. Urban Plan. 2008, 85, 40–48. [Google Scholar] [CrossRef]
  41. Zhao, X.; Zhang, L.; Huang, X.; Zhao, Y.; Zhang, Y. Evolution of the Spatiotemporal Pattern of Urban Industrial Land Use Efficiency in China. Sustainability 2018, 10, 2174. [Google Scholar] [CrossRef]
  42. Chen, W.; Shen, Y.; Wang, Y.; Wu, Q. The effect of industrial relocation on industrial land use efficiency in China: A spatial econometrics approach. J. Clean. Prod. 2018, 205, 525–535. [Google Scholar] [CrossRef]
  43. Qiao, L.; Huang, H.P.; Tian, Y.C. The Identification and Use Efficiency Evaluation of Urban Industrial Land Based on Multi-Source Data. Sustainability 2019, 11, 6149. [Google Scholar] [CrossRef]
  44. Gao, J.X.; Song, J.B.; Wu, L.F. A new methodology to measure the urban construction land-use efficiency based on the two-stage DEA model. Land Use Policy 2022, 112, 105799. [Google Scholar] [CrossRef]
  45. Chen, W.; Chen, W.; Ning, S.; Liu, E.; Zhou, X.; Wang, Y.; Zhao, M. Exploring the industrial land use efficiency of China’s resource-based cities. Cities 2019, 93, 215–223. [Google Scholar] [CrossRef]
  46. Zhu, X.H.; Li, Y.; Zhang, P.F.; Wei, Y.G.; Zheng, X.Y.; Xie, L.L. Temporal-spatial characteristics of urban land use efficiency of China’s 35mega cities based on DEA: Decomposing technology and scale efficiency. Land Use Policy 2019, 88, 104083. [Google Scholar] [CrossRef]
  47. Wang, Y.; Zhang, A.L.; Min, M.; Zhao, K.; Hu, W.Y.; Qin, F.D. Research on the Effect of Manufacturing Agglomeration on Green Use Efficiency of Industrial Land. Int. J. Environ. Res. Public Health 2023, 20, 1575. [Google Scholar] [CrossRef] [PubMed]
  48. Xie, H.; Chen, Q.; Lu, F.; Wu, Q.; Wang, W. Spatial-temporal disparities, saving potential and influential factors of industrial land use efficiency: A case study in urban agglomeration in the middle reaches of the Yangtze River. Land Use Policy 2018, 75, 518–529. [Google Scholar] [CrossRef]
  49. Locurcio, M.; Tajani, F.; Anelli, D. Sustainable Urban Planning Models for New Smart Cities and Effective Management of Land Take Dynamics. Land 2023, 12, 621. [Google Scholar] [CrossRef]
  50. Yang, F. Problem Analysis of Urban-Rural Industrial Land Use in Metropolitan Areas Under the New Urbanization Policy—A Case Study of Shanghai. In Smart Growth and Sustainable Development: Selected Papers from the 9th International Association for China Planning Conference, Chongqing, China, 19–21 June 2015; Pan, Q., Li, W., Eds.; Springer International Publishing: Cham, Switzerland, 2017; pp. 193–213. [Google Scholar]
  51. Xie, H.; Wang, W.; Yang, Z.; Choi, Y. Measuring the sustainable performance of industrial land utilization in major industrial zones of China. Technol. Forecast. Soc. Chang. 2016, 112, 207–219. [Google Scholar] [CrossRef]
  52. Niu, Y.; Yan, Y.; Dong, J.; Yue, K.; Duan, X.; Hu, D.; Li, J.; Peng, L. Evidence for sustainably reducing secondary pollutants in a typical industrial city in China: Co-benefit from controlling sources with high reduction potential beyond industrial process. J. Hazard. Mater. 2024, 478, 135556. [Google Scholar] [CrossRef]
  53. Akcigit, U.; Liu, Q. The Role of Information in Innovation and Competition. J. Eur. Econ. Assoc. 2015, 14, 828–870. [Google Scholar] [CrossRef]
  54. Su, Y.; Fan, Q. Renewable energy technology innovation, industrial structure upgrading and green development from the perspective of China’s provinces. Technol. Forecast. Soc. Chang. 2022, 180, 121727. [Google Scholar] [CrossRef]
  55. Tan, R.; Zhang, T.; Liu, D.; Xu, H. How will innovation-driven development policy affect sustainable urban land use: Evidence from 230 Chinese cities. Sust. Cities Soc. 2021, 72, 103021. [Google Scholar] [CrossRef]
  56. Anderson, J.E. Access to land and permits: Firm-level evidence of impediments to development in transition countries. J. Econ. Bus. 2019, 101, 38–57. [Google Scholar] [CrossRef]
  57. Zhang, W.; Wang, B.; Wang, J.; Wu, Q.; Wei, Y.D. How does industrial agglomeration affect urban land use efficiency? A spatial analysis of Chinese cities. Land Use Policy 2022, 119, 106178. [Google Scholar] [CrossRef]
  58. Liu, J.; Hou, X.; Wang, Z.; Shen, Y. Study the effect of industrial structure optimization on urban land-use efficiency in China. Land Use Policy 2021, 105, 105390. [Google Scholar] [CrossRef]
  59. Tone, K. A slacks-based measure of efficiency in data envelopment analysis. Eur. J. Oper. Res. 2001, 130, 498–509. [Google Scholar] [CrossRef]
  60. Tone, K. A slacks-based measure of super-efficiency in data envelopment analysis. Eur. J. Oper. Res. 2002, 143, 32–41. [Google Scholar] [CrossRef]
  61. Ul Hassan Shah, W.; Zhu, N.; Hao, G.; Yan, H.; Yasmeen, R. Energy efficiency evaluation, technology gap ratio, and determinants of energy productivity change in developed and developing G20 economies: DEA super-SBM and MLI approaches. Gondwana Res. 2024, 125, 70–81. [Google Scholar] [CrossRef]
  62. Zhang, H.; Song, Y.; Zhang, M.; Duan, Y. Land use efficiency and energy transition in Chinese cities: A cluster-frontier super-efficiency SBM-based analytical approach. Energy 2024, 304, 132049. [Google Scholar] [CrossRef]
  63. Cecchini, L.; Venanzi, S.; Pierri, A.; Chiorri, M. Environmental efficiency analysis and estimation of CO2 abatement costs in dairy cattle farms in Umbria (Italy): A SBM-DEA model with undesirable output. J. Clean. Prod. 2018, 197, 895–907. [Google Scholar] [CrossRef]
  64. Yang, L.; Li, Y.; Liu, H. Did carbon trade improve green production performance? Evidence from China. Energy Econ. 2021, 96, 105185. [Google Scholar] [CrossRef]
  65. Lee, H.-S. Integrating SBM model and Super-SBM model: A one-model approach. Omega 2022, 113, 102693. [Google Scholar] [CrossRef]
  66. Zhou, G.; Luo, S. Higher Education Input, Technological Innovation, and Economic Growth in China. Sustainability 2018, 10, 2615. [Google Scholar] [CrossRef]
  67. Li, W.; Zheng, M. Is it Substantive Innovation or Strategic Innovation?—Impact of Macroeconomic Policies on Micro-enterprises’ Innovation. Econ. Res. J. 2016, 51, 60–73. [Google Scholar]
  68. Olley, G.S.; Pakes, A. The Dynamics of Productivity in the Telecommunications Equipment Industry. Econometrica 1996, 64, 1263–1297. [Google Scholar] [CrossRef]
  69. Duranton, G.; Ghani, E.; Goswami, A.G.; Kerr, W. The Misallocation of Land and Other Factors of Production in India; World Bank: Washington, DC, USA, 2015; p. 65. [Google Scholar]
  70. Lu, F.; Wang, H.; Jing, G. Network infrastructure construction and green high-quality development: A quasi-natural experiment from Broadband China Strategy. J. Stat. Res. 2024, 41, 112–125. [Google Scholar]
  71. Ma, L.; Xu, W.; Zhang, W.; Ma, Y. Effect and mechanism of environmental regulation improving the urban land use eco-efficiency: Evidence from China. Ecol. Indic. 2024, 159, 111602. [Google Scholar] [CrossRef]
  72. Strumpf, E.C.; Harper, S.; Kaufman, J.S. Fixed effects and difference in differences. Methods Soc. Epidemiol. 2017, 1, 341–367. [Google Scholar]
  73. Xie, S.; Fan, P.; Wan, Y. Improvement and Application of Classical PSM-DID Model. Stat. Res. 2021, 38, 146–160. [Google Scholar] [CrossRef]
  74. Fauver, L.; Hung, M.; Li, X.; Taboada, A.G. Board reforms and firm value: Worldwide evidence. J. Financ. Econ. 2017, 125, 120–142. [Google Scholar] [CrossRef]
  75. Song, Y.; Hao, X. Corporate Innovation Effects of the Digital Service Trade Network. Contemp. Financ. Econ. 2024, 01, 126–139. [Google Scholar]
  76. Xu, N.; Zhao, D.; Zhang, W.; Zhang, H.; Chen, W.; Ji, M.; Liu, M. Innovation-Driven Development and Urban Land Low-Carbon Use Efficiency: A Policy Assessment from China. Land 2022, 11, 1634. [Google Scholar] [CrossRef]
  77. Correia Sinézio Martins, E.; Lépine, J.; Corbett, J. Assessing the effectiveness of financial incentives on electric vehicle adoption in Europe: Multi-period difference-in-difference approach. Transp. Res. Part A Policy Pract. 2024, 189, 104217. [Google Scholar] [CrossRef]
  78. Qian, J.; Zhang, X.; Yan, X.-W.; Xu, N. Can Information Consumption Promote the Digital Transformation of Enterprises? Empirical Evidence from China. Sustainability 2024, 16, 11026. [Google Scholar] [CrossRef]
  79. Goodman-Bacon, A. Difference-in-differences with variation in treatment timing. J. Econom. 2021, 225, 254–277. [Google Scholar] [CrossRef]
  80. Abadie, A.; Diamond, A.; Hainmueller, J. Synthetic Control Methods for Comparative Case Studies: Estimating the Effect of California’s Tobacco Control Program. J. Am. Stat. Assoc. 2010, 105, 493–505. [Google Scholar] [CrossRef]
  81. Zhang, L.; Liang, T.; Wei, X.; Wang, H. An improved indicator standardization method for multi-indicator composite evaluation: A case study in the evaluation of ecological civilization construction in China. Environ. Impact Assess. Rev. 2024, 108, 107600. [Google Scholar] [CrossRef]
  82. Langpap, C.; Shimshack, J.P. Private citizen suits and public enforcement: Substitutes or complements? J. Environ. Econ. Manag. 2010, 59, 235–249. [Google Scholar] [CrossRef]
  83. Wang, F. The intermediary and threshold effect of green innovation in the impact of environmental regulation on economic Growth: Evidence from China. Ecol. Indic. 2023, 153, 110371. [Google Scholar] [CrossRef]
  84. Wang, B.; Liu, J. Impact of Climate Change on Green Technology Innovation—An Examination Based on Microfirm Data. Sustainability 2024, 16, 11206. [Google Scholar] [CrossRef]
  85. Chen, C. Untitled Land, Occupational Choice, and Agricultural Productivity. Am. Econ. J. Macroecon. 2017, 9, 91–121. [Google Scholar] [CrossRef]
  86. Xu, G.; Chen, Y. The influence of market segmentation on energy efficiency in electric power industry: Empirical evidence from China. Energy Rep. 2022, 8, 965–971. [Google Scholar] [CrossRef]
Figure 1. Mean UILUE trends for the treatment and control groups. The treatment group excludes Shanghai, Beijing, Shenzhen, and Guangzhou—the four cities with the highest GDP in China—to better represent the average UILUE of typical cities.
Sustainability 17 02753 g001
Figure 2. Parallel trend test.
Sustainability 17 02753 g002
Figure 3. Placebo test results.
Sustainability 17 02753 g003
Table 1. Variable definitions.
Variable TypeVariable NameSymbolsDefinition
Dependent variableUrban industrial land use efficiencyUILUEThe values are calculated using Formula (1)
Independent variableData factor
marketization
DFMIf a city establishes a data trading platform, DFM = 1 from the platform’s establishment year onward; otherwise, DFM = 0
Mediating variablesTechnological innovationTechNumber of invention patents granted per capita
land resource misallocationMisiRatio of a city’s share of industrial land use to its share of industrial output within the overall allocation framework
Control variablesEconomic
development
EDNighttime light index
Industrial structureISSecondary sector value-added/regional GDP
Openness to tradeOP(Import trade + export trade)/regional GDP
Population densityPDUrban population/built-up area
Technological
investment
TIScience and technology spending/total fiscal expenditure
Marketization of land transactionsMLRatio of land transacted via bidding, auction, and listing to total land transfers
Table 2. Descriptive statistics.
VariablesNMeanSDMinMax
UILUE48280.2310.2010.0362.457
DFM48280.0240.15301
Tech45341.2343.838061.885
Misi45441.1301.1310.00817.146
ED48287.7959.2890.09860.052
IS48280.4630. 1130.1070.910
OP48280.1920.3270.00043.499
PD48280.3390.2500.0242.009
TI48280.0150.0160.00020.207
ML47980.4660.21101
Table 3. Correlation matrix and VIF test.
VIFUILUEDFMEDISOPPDTIML
UILUE1.181.0000
DFM1.080.0612 ***1.0000
ED2.220.3633 ***0.1809 ***1.0000
IS1.060.1076 ***−0.1316 ***0.0591 ***1.0000
OP1.590.2703 ***0.0706 ***0.5960 ***0.0529 ***1.0000
PD1.03−0.0527 ***−0.0130−0.1185 ***−0.0438 ***−0.1318 ***1.0000
TI1.650.1731 ***0.2139 ***0.6057 ***0.0503 ***0.4102 ***−0.1457 ***1.0000
ML1.04−0.0528 ***−0.0382 ***0.0296 **0.1476 ***−0.0205−0.0754 ***0.0525 ***1.0000
Note: *** and ** indicate significance at the 1% and 5% levels, respectively; standard errors are in parentheses.
Table 4. Baseline regression results.
Variables(1)(2)(3)
DFM0.0366 *** (0.0128)0.0389 *** (0.0126)0.0389 ** (0.0153)
ED 0.0032 *** (0.0011)0.0032 *** (0.0009)
IS 0.4726 *** (0.0544)0.4726 *** (0.0422)
OP 0.0310 * (0.0167)0.0310 ** (0.0152)
PD 0.0330 ** (0.0134)0.0330 ** (0.0153)
TI −0.5936 *** (0.2252)−0.5936 *** (0.2173)
ML 0.0184 * (0.0109)0.0184 * (0.0105)
_cons0.2306 *** (0.0019)−0.0306 (0.0280)−0.0306 (0.0221)
Individual fixed effectYesYesYes
Time fixed effectYesYesYes
N482847984798
Adj. R20.58380.60170.6017
Note: ***, **, and * indicate significance at the 1%, 5%, and 10% levels, respectively; standard errors are in parentheses.
Table 5. Bacon decomposition results.
TypeBetaWeight
The late-treated group serves as the control group for the early-treated group−0.0360.016
The early-treated group serves as the control group for the late-treated group0.0090.005
The never-treated group serves as the control group for the treated group0.0370.979
Table 6. PSM-DID regression results.
Radius MatchingNearest Neighbor MatchingLocal Linear Regression MatchingKernel Matching
DFM0.0242 ** (0.0121)0.0316 ** (0.0129)0.0316 ** (0.0129)0.0260 ** (0.0123)
ControlsYesYesYesYes
Individual fixed effectYesYesYesYes
Time fixed effectYesYesYesYes
N4022410341034041
Adj. R20.55840.56650.56650.5581
Note: ** indicate significance at the 5% level; standard errors are in parentheses.
Table 7. Other robustness tests.
Replace the Model with SCMChange the Measurement IndexIncrease High-Dimensional Fixed EffectsExclude Other PoliciesRemove Municipal-Level Samples
(1)(2)(3)(4)(5)
DFM0.0480 *** (0.0133)0.0762 ** (0.0326)0.0360 *** (0.0126)0.0321 ** (0.0129)0.0317 ** (0.0133)
ControlsYesYesYesYesYes
Individual fixed effectYesYesYesYesYes
Time fixed effectYesYesYesYesYes
N47304798479847984730
Adj. R20.55200.37810.60720.60380.5886
Note: *** and ** indicate significance at the 1% and 5% levels, respectively; standard errors are in parentheses.
Table 8. Mechanism analysis results.
Technological InnovationLand Resource Misallocation
TechUILUEMisiUILUE
(1)(2)(3)(4)
DFM3.2069 *** (0.4584)0.0289 ** (0.0132)−0.1848 *** (0.0457)0.0376 *** (0.0127)
Tech 0.0037 ** (0.0018)
Misi −0.0174 *** (0.0044)
ControlsYesYesYesYes
Individual fixed effectYesYesYesYes
Time fixed effectYesYesYesYes
N4504450445144514
Adj. R20.80560.61740.71360.6189
Intermediary effect/total effect29.29%7.88%
Sobel Test0.0119 [0.0512]0.0032 [0.0045]
Note: *** and ** indicate significance at the 1% and 5% levels, respectively; standard errors are in parentheses.
Table 9. Heterogeneity analysis results.
Geographic LocationMarket SegmentationEnvironmental Regulation
EasternCentral-WesternSegmentation-HSegmentation-LRegulation-HRegulation-L
DFM0.0450 **0.0338 ***0.02080.0536 ***0.0605 ***0.0064
(0.0218)(0.0127)(0.0157)(0.0206)(0.0189)(0.0197)
ControlsYesYesYesYesYesYes
Individual fixed effectYesYesYesYesYesYes
Time fixed effectYesYesYesYesYesYes
N169431042579221923982392
Adj. R20.68510.51450.53490.65600.61160.6087
Note: *** and ** indicate significance at the 1% and 5% levels, respectively; standard errors are in parentheses.
Table 10. Main estimated results.
Baseline RegressionRadius MatchingNearest Neighbor MatchingLocal Linear Regression MatchingKernel MatchingSCM RegressionChange UILUEHigh-Dimensional FixedExclude Other PoliciesRemove Some Sample
(1)(2)(3)(4)(5)(6)(7)(8)(9)(10)
DFM0.0389 ***
(0.0126)
0.0242 ** (0.0121)0.0316 **
(0.0129)
0.0316 ** (0.0129)0.0260 ** (0.0123)0.0480 *** (0.0133)0.0762 ** (0.0326)0.0360 *** (0.0126)0.0321 ** (0.0129)0.0317 **
(0.0133)
ControlsYesYesYesYesYesYesYesYesYesYes
Individual fixed effectYesYesYesYesYesYesYesYesYesYes
Time fixed effectYesYesYesYesYesYesYesYesYesYes
N4828402241034103404147304798479847984730
Adj. R20.58380.55840.56650.56650.55810.55200.37810.60720.60380.5886
Note: *** and ** indicate significance at the 1% and 5% levels, respectively; standard errors are in parentheses.
Disclaimer/Publisher’s Note: The statements, opinions and data contained in all publications are solely those of the individual author(s) and contributor(s) and not of MDPI and/or the editor(s). MDPI and/or the editor(s) disclaim responsibility for any injury to people or property resulting from any ideas, methods, instructions or products referred to in the content.

