1. Introduction
The optimization of reservoir operations and the enhancement of water resource utilization efficiency fundamentally depend on comprehensive flood season staging research [
1]. Significant changes in river basin hydrological conditions have occurred as a consequence of intensifying global climate change and expanding human activities [
2]. In this new era of water resource management, conventional approaches utilizing fixed flood limit water levels have proven increasingly inadequate [
3]. Water scarcity in Xinjiang, and similar arid and semi-arid territories, has become a critical constraint on sustainable socio-economic progress. Moreover, balancing the dual necessities of flood control safety and efficient water resource utilization presents a significant challenge in these regions, where additional complications may occur due to unevenly distributed precipitation, high evaporation rates, and delicate ecological systems [
4]. By methodically segmenting flood seasons into periods, flood season staging enables more accurate representation of basin flood characteristics, thereby establishing a foundation for dynamic reservoir operation [
5]. Research efforts have disproportionately concentrated on humid regions, neglecting the hydrological patterns of arid areas [
6]. This oversight is particularly problematic in basins where snowmelt runoff predominates, and the causes of flooding are more complex. Targeted analyses into flood season staging for these specific environments have thus become urgently necessary. Beyond its theoretical significance, such research offers critical scientific backing for both regional water resource optimization and flood prevention strategies [
7].
The rapid economic development of Xinjiang faces a significant constraint due to water scarcity, necessitating key approaches such as efficient surface water utilization, optimal reservoir regulation, and rational groundwater exploitation to address these resource challenges. Most reservoirs throughout Xinjiang continue to operate under a rudimentary control protocol that maintains a fixed flood limit water level during the entire flood season—a practice inadequate for the demands of sophisticated management systems. Improving the utilization efficiency of reservoir floodwater resources demands the implementation of flood season staging technology. This advanced approach segments the flood season into different periods according to flood basin characteristics, allowing for customized reservoir flood limit water levels. By fully leveraging the regulatory capacity of reservoir systems, this methodical approach not only enhances floodwater resource utilization efficiency but also maintains essential flood control safety standards [
8,
9].
Flood season staging methods generally fall into two categories: qualitative and quantitative analysis. The qualitative approach comprises methods such as meteorological causation analysis and mathematical statistics, whereas quantitative methodologies comprise fuzzy set analysis [
10], Fisher optimal segmentation [
11], and systematic clustering [
12]. Notwithstanding the range of available methods, existing research has primarily emphasized mathematical statistics and quantitative analysis, with meteorological causation receiving comparatively limited attention. This research orientation is evidenced by numerous studies expanding the boundaries of quantitative analysis [
1,
12,
13,
14]. Particularly notable is the scarcity of research on staging methodologies in arid region basins where snowmelt runoff dominates. The complexity of snowmelt floods analysis is due to their dependence on both precipitation patterns and temperature fluctuations [
15], necessitating thorough analysis into how these two factors synergistically interact. Such research would indicate the underlying causal mechanisms and explain their collective impact on flood events. The multifaceted nature of flood causation in arid regions’ snow and ice melt basins presents significantly greater complexity than areas where precipitation represents the primary flood driver.
Drawing from these considerations, our research employs an integrated approach that combines qualitative and quantitative analysis, incorporating meteorological causation analysis, mathematical statistics, and ordered clustering methods for flood season staging. The study seeks to enhance the rationality and reliability of staging results through the comprehensive determination of flood season boundary points, utilizing a diverse range of methods and indicators. In addition to addressing a significant research gap in flood season staging for arid region basins dominated by snowmelt runoff, this work establishes a scientific foundation for improving local water resource utilization efficiency.
2. Materials and Methods
2.1. Study Area and Data Sources
Situated on the mainstream of the Yeerqiang River’s mountainous section, the Altash Hydropower Project represents the control project for the downstream section. This critical infrastructure fulfills multiple functions, including flood control, irrigation, ecological protection, and power generation [
16]. The operational effectiveness of this project directly influences flood safety, food security, and energy security throughout the Yeerqiang River Basin, proving instrumental to South Xinjiang’s sustainable development. Including a drainage area of 464,000 km
2, the project’s dam site experiences an average natural annual runoff of 641.7 million m
3. The reservoir maintains a normal water level of 1820.00 m with a regulating capacity of 1.261 billion m
3, while its dead water level stands at 1770.00 m, corresponding to a dead reservoir capacity of 869 million m
3.
This study utilizes daily precipitation and temperature records from the Kaqun station, situated 55 km upstream from the project, between 1954 and 2021. Discharge measurements from this station cover the period from 1954 to 2017. Additional data were collected from the Kulukelangan station, positioned 102 km downstream, with precipitation and temperature records extending from 1959 to 2021. For the years 2018 through 2021, project construction necessitated the interpolation and restoration of Kaqun station discharge measurements utilizing the corresponding data from the Kulukelangan station. The European Centre for Medium-Range Weather Forecasts (ECMWF) Fifth Generation Atmospheric Reanalysis Data Set (ERA5) [
17] offered the atmospheric circulation data for this research.
The flood season traditionally comprises three periods: pre-flood, main flood, and post-flood. An operational analysis of the Altash Hydropower Project between 1 June and 20 September indicates a minimal chance of surplus water generation before mid-July. This study specifically addresses the determination of the boundary point between the main flood period and the post-flood period, aiming to better resolve the conflict between flood control measures and effective water utilization toward the flood season’s conclusion.
2.2. Research Methods
To analyze trend mutations of temperature, precipitation, and runoff in the Yeerqiang River Basin, this study employs the Moving Average Method, Linear Regression Method, and Mann–Kendall (MK) [
18] trend test. In addition, Causal Analysis, Mathematical Statistics, and Ordered Clustering methods are applied for flood season segmentation [
19].
- (1)
Methods for Analyzing Hydrometeorological Elements: By smoothing short-term fluctuations, the moving average method effectively indicates long-term trends, which makes it particularly valuable for discovering evolution patterns in hydrometeorological data. With its non-parametric characteristics and robustness to outliers, the MK mutation test accurately identifies mutation points in sequences, thereby representing an ideal tool for analyzing mutation features in climate and hydrological data. The unique multi-scale capability of wavelet analysis allows simultaneous extraction of both high-frequency and low-frequency periodic variations from time series, thus offering robust support for indicating complex periodic patterns in hydrometeorological data. The integration of these three methodologies enables comprehensive analysis of trend evolution, mutation characteristics, and periodic patterns, thereby establishing a scientific foundation for hydrometeorological research.
- (2)
Causal Analysis evaluates how atmospheric circulation factors influence the dynamic conditions of temperature and precipitation in the basin throughout the different periods of the flood season. This approach also evaluates water vapor supply conditions.
- (3)
Historical observed data forms the foundation of Mathematical Statistics, which analyzes distribution and variation patterns of flow, temperature, and rainfall during the flood season.
- (4)
Ordered Clustering: The ordered clustering method represents a non-parametric statistical method that identifies optimal segmentation points (mutation points) in time or spatial series based on sequence structural characteristics. At its core, this method divides sequences into several subsequences by minimizing in-category squared deviations while maximizing between-category differences. Researchers frequently employ this approach in studies determining flood season stages.
Reservoirs typically experience three stages during the flood season. When applying this method, researchers introduce a hydrological sequence representing multi-year daily average flow (m3/s). The hydrological sequence (x1, x2, …, xn) is categorized into three segments through the identification of potential mutation points . These points must satisfy specific constraints: must be in the range (2 ≤ ≤ n − 2), while should be in the range of ( + 1 ≤ ≤ n − 1).
This segmentation process creates three portions: the first from 1~
, the second from
+ 1~
, and the third from
+ 1~
n. The sums of squared deviations for these three segments—denoted as,
, and
—are calculated accordingly.
where
,
and
represent the average values of the three segments of the sequence: 1~
+ 1~
+ 1~
n, respectively.
The total sum of squared deviations
is:
Mutation points are identified through the comparison of changes in the sum of squared deviations occurring before and after segmentation. The optimal segmentation point, which can be inferred as a mutation point, is identified when . Mutation points and correspond to specific dates that mark important seasonal boundaries. Specifically, separates the pre-flood period from the main flood period, while distinguishes the main flood period from the post-flood period.
2.3. Flood Characteristics of the Basin
Based on their causal factors, researchers have categorized the floods in the Yeerqiang River Basin into four types [
20].
(1) Snowmelt Floods: Abundant material conditions for snowmelt floods are offered by the glaciers, permanent snow, and seasonal snow found in the Yeerqiang River’s high and middle mountain regions. As temperatures increase during early summer, at the flood season’s commencement, snow and ice melt occurs, replenishing the river and primarily triggering these floods. Daily temperature fluctuations influence these floods, which typically display a unique pattern of daily peaks. Albeit represented by peaks of moderate height, these floods feature large volume and extended duration, typically persisting for 10–20 days.
(2) Rainstorm Floods: Continuous precipitation, particularly in the middle and lower mountain zones, generates basin runoff that results in these flood events. With a sharp rise and fall pattern, this flood category is represented by brief duration, restricted range, and constrained magnitude.
(3) Glacier “Dam Break” Floods: In the upper reaches of the Yeerqiang River, these floods occur when glaciers situated at nearly vertical angles to the main river suddenly release water. With a single peak with abrupt rise and fall patterns, these hydrological events typically occur between June and November throughout the region. These occurrences feature brief peak durations, rarely exceeding 1 h, while the rising water phase generally extends for only 2–5 h before subsiding.
(4) Mixed Floods: These are formed from the convergence of snowmelt floods and the other two types of floods.
In this basin, the extensive glacier reserves combined with higher summer temperatures render snowmelt floods the most frequent hydrological phenomenon. Considering the region’s limited precipitation and the unpredictable nature of glacier changes that govern “dam break” floods, these latter events occur with considerable randomness. Therefore, the temporal boundaries of the flood season are primarily dictated by the seasonal variations in snowmelt patterns rather than by other flood mechanisms.
3. Results
3.1. Meteorological and Runoff Variation Patterns
(1) Trends in annual runoff
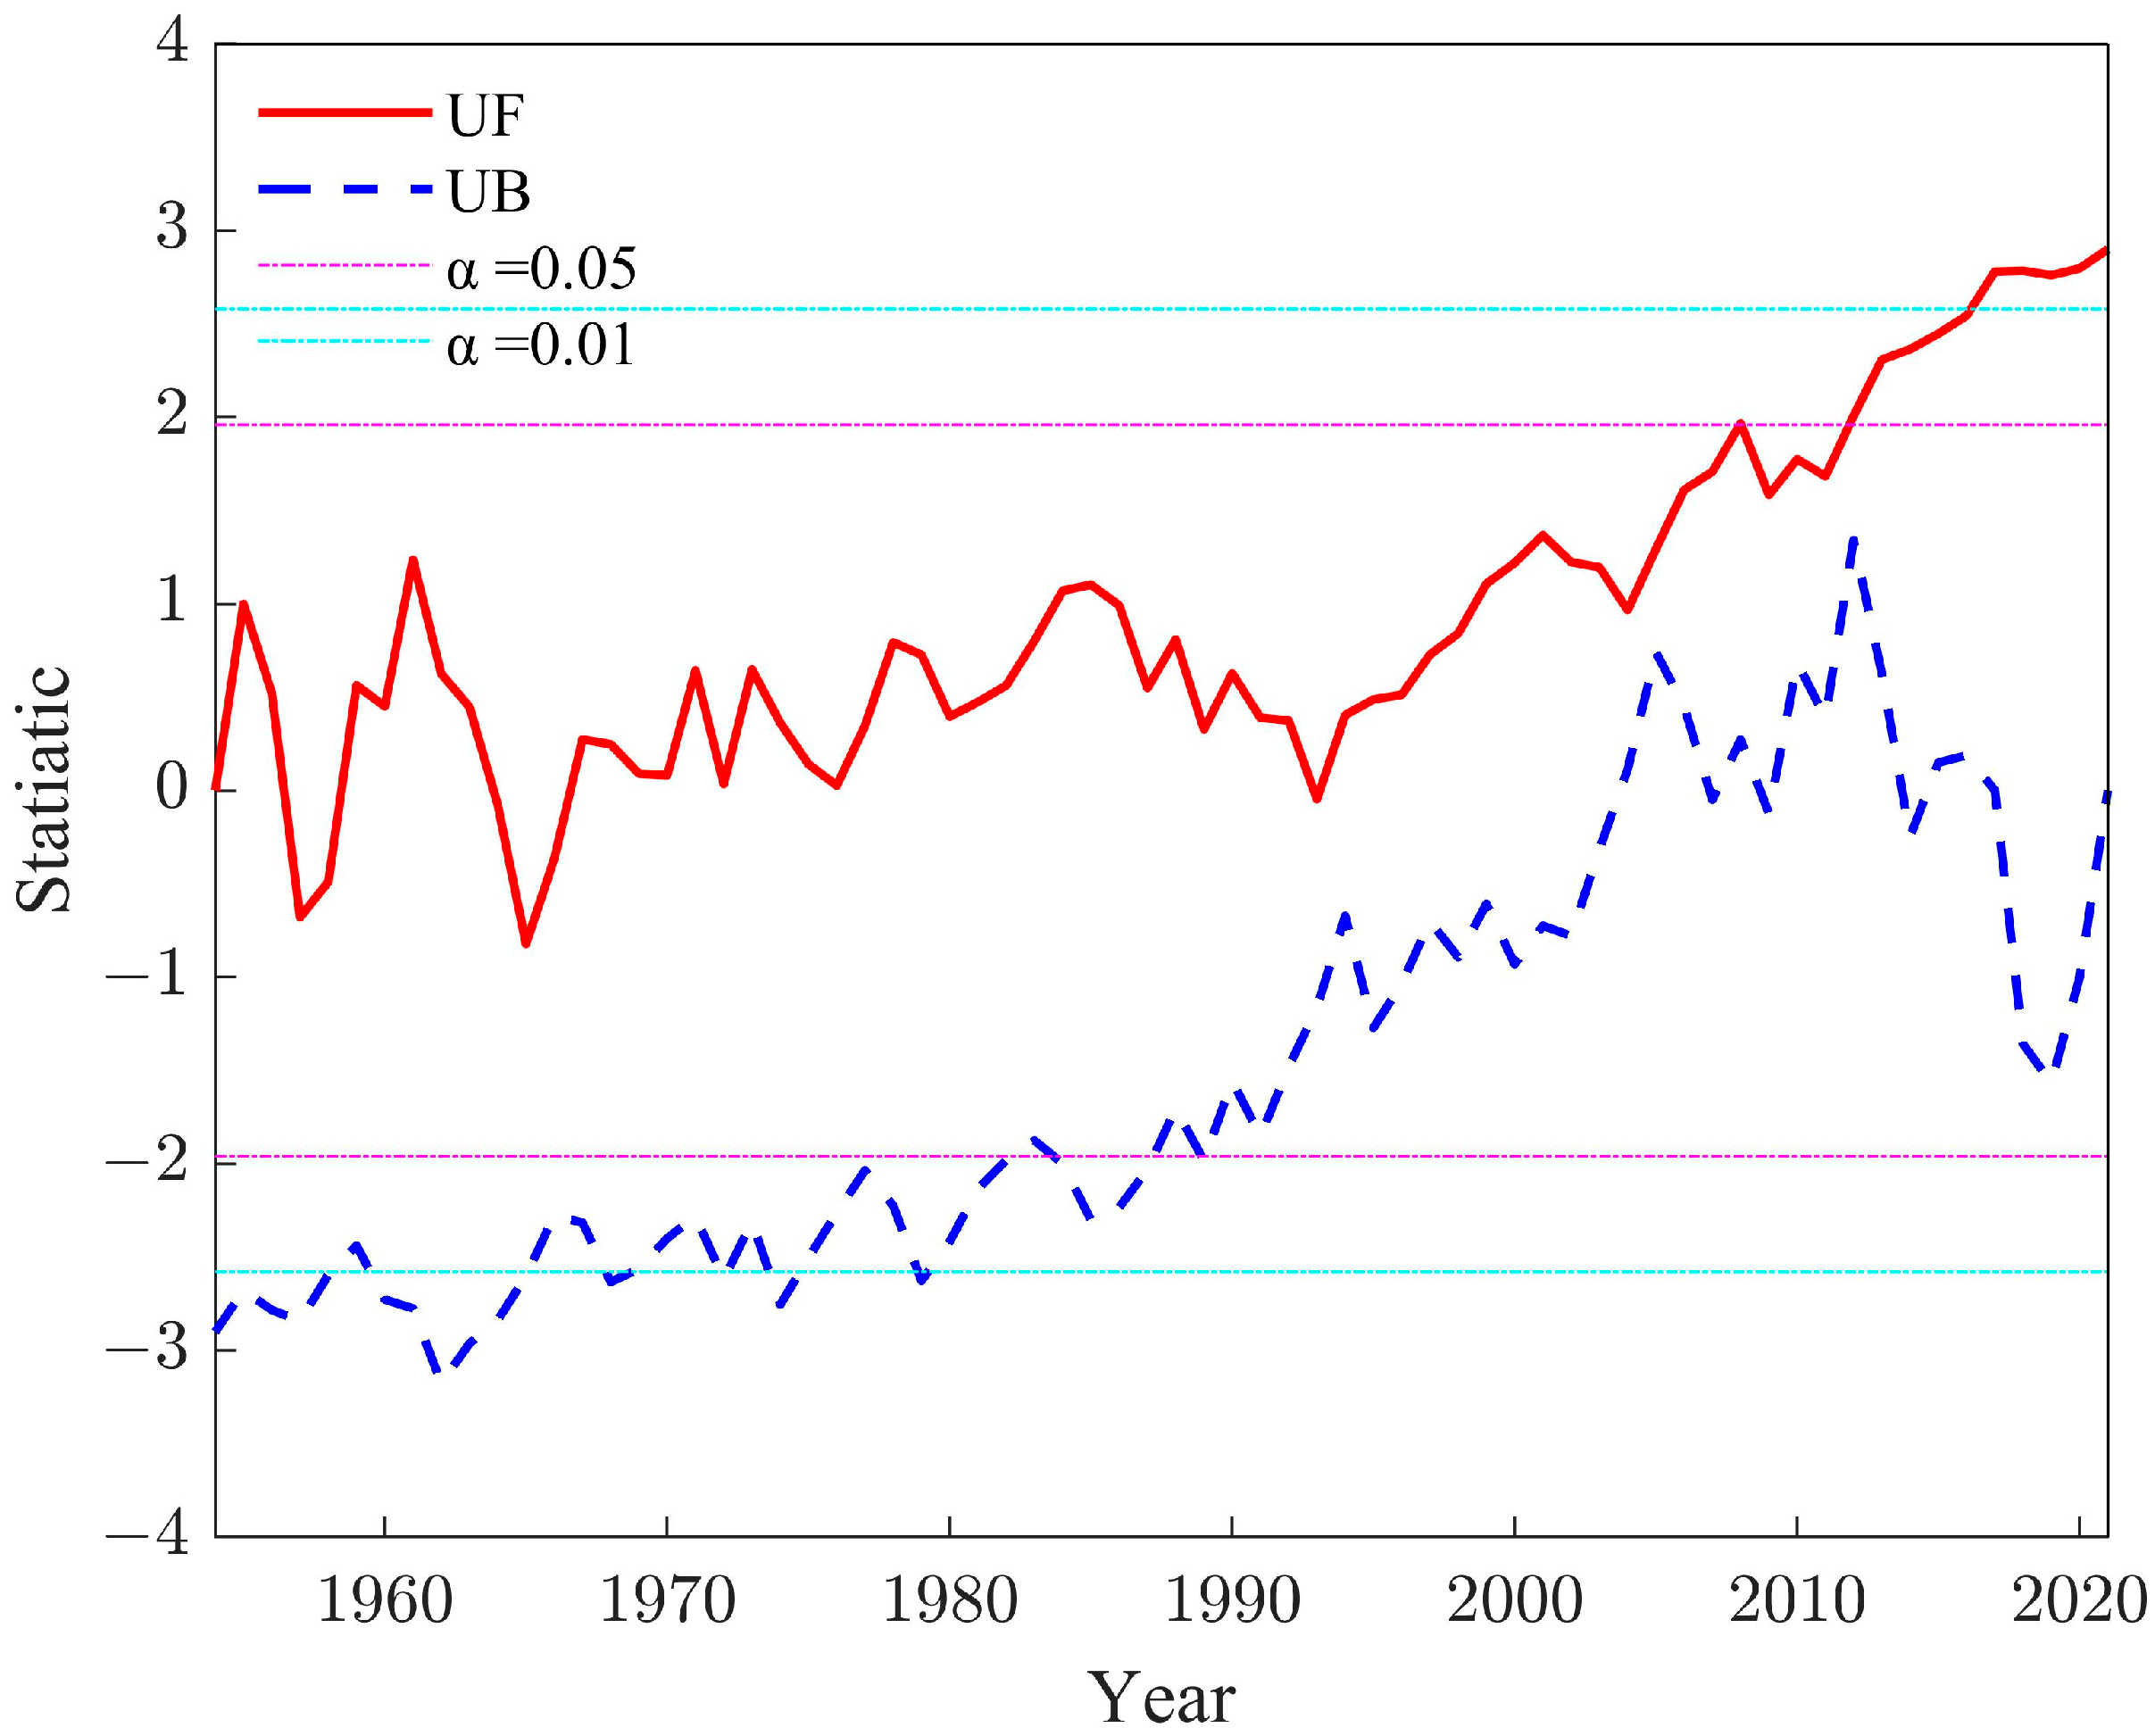
Figure 1 illustrates the annual average runoff variation trend recorded at Kaqun station, indicating significant interannual fluctuation patterns. Higher runoff measurements were documented in both 1994 and 2012, standing above typical values. When analyzed across decades, the overall runoff pattern demonstrates a clear upward trend, with this increasing tendency particularly evident between 1960 and 2000. The mutation test results presented in
Figure 2 further confirm this significant upward trend in the time series data. Following 1994, the measurements exhibit a period of relative stability, followed by intensification after 2010, though, intriguingly, no obvious mutation point could be identified throughout the analyzed timeframe.
(2) Trends in meteorological conditions
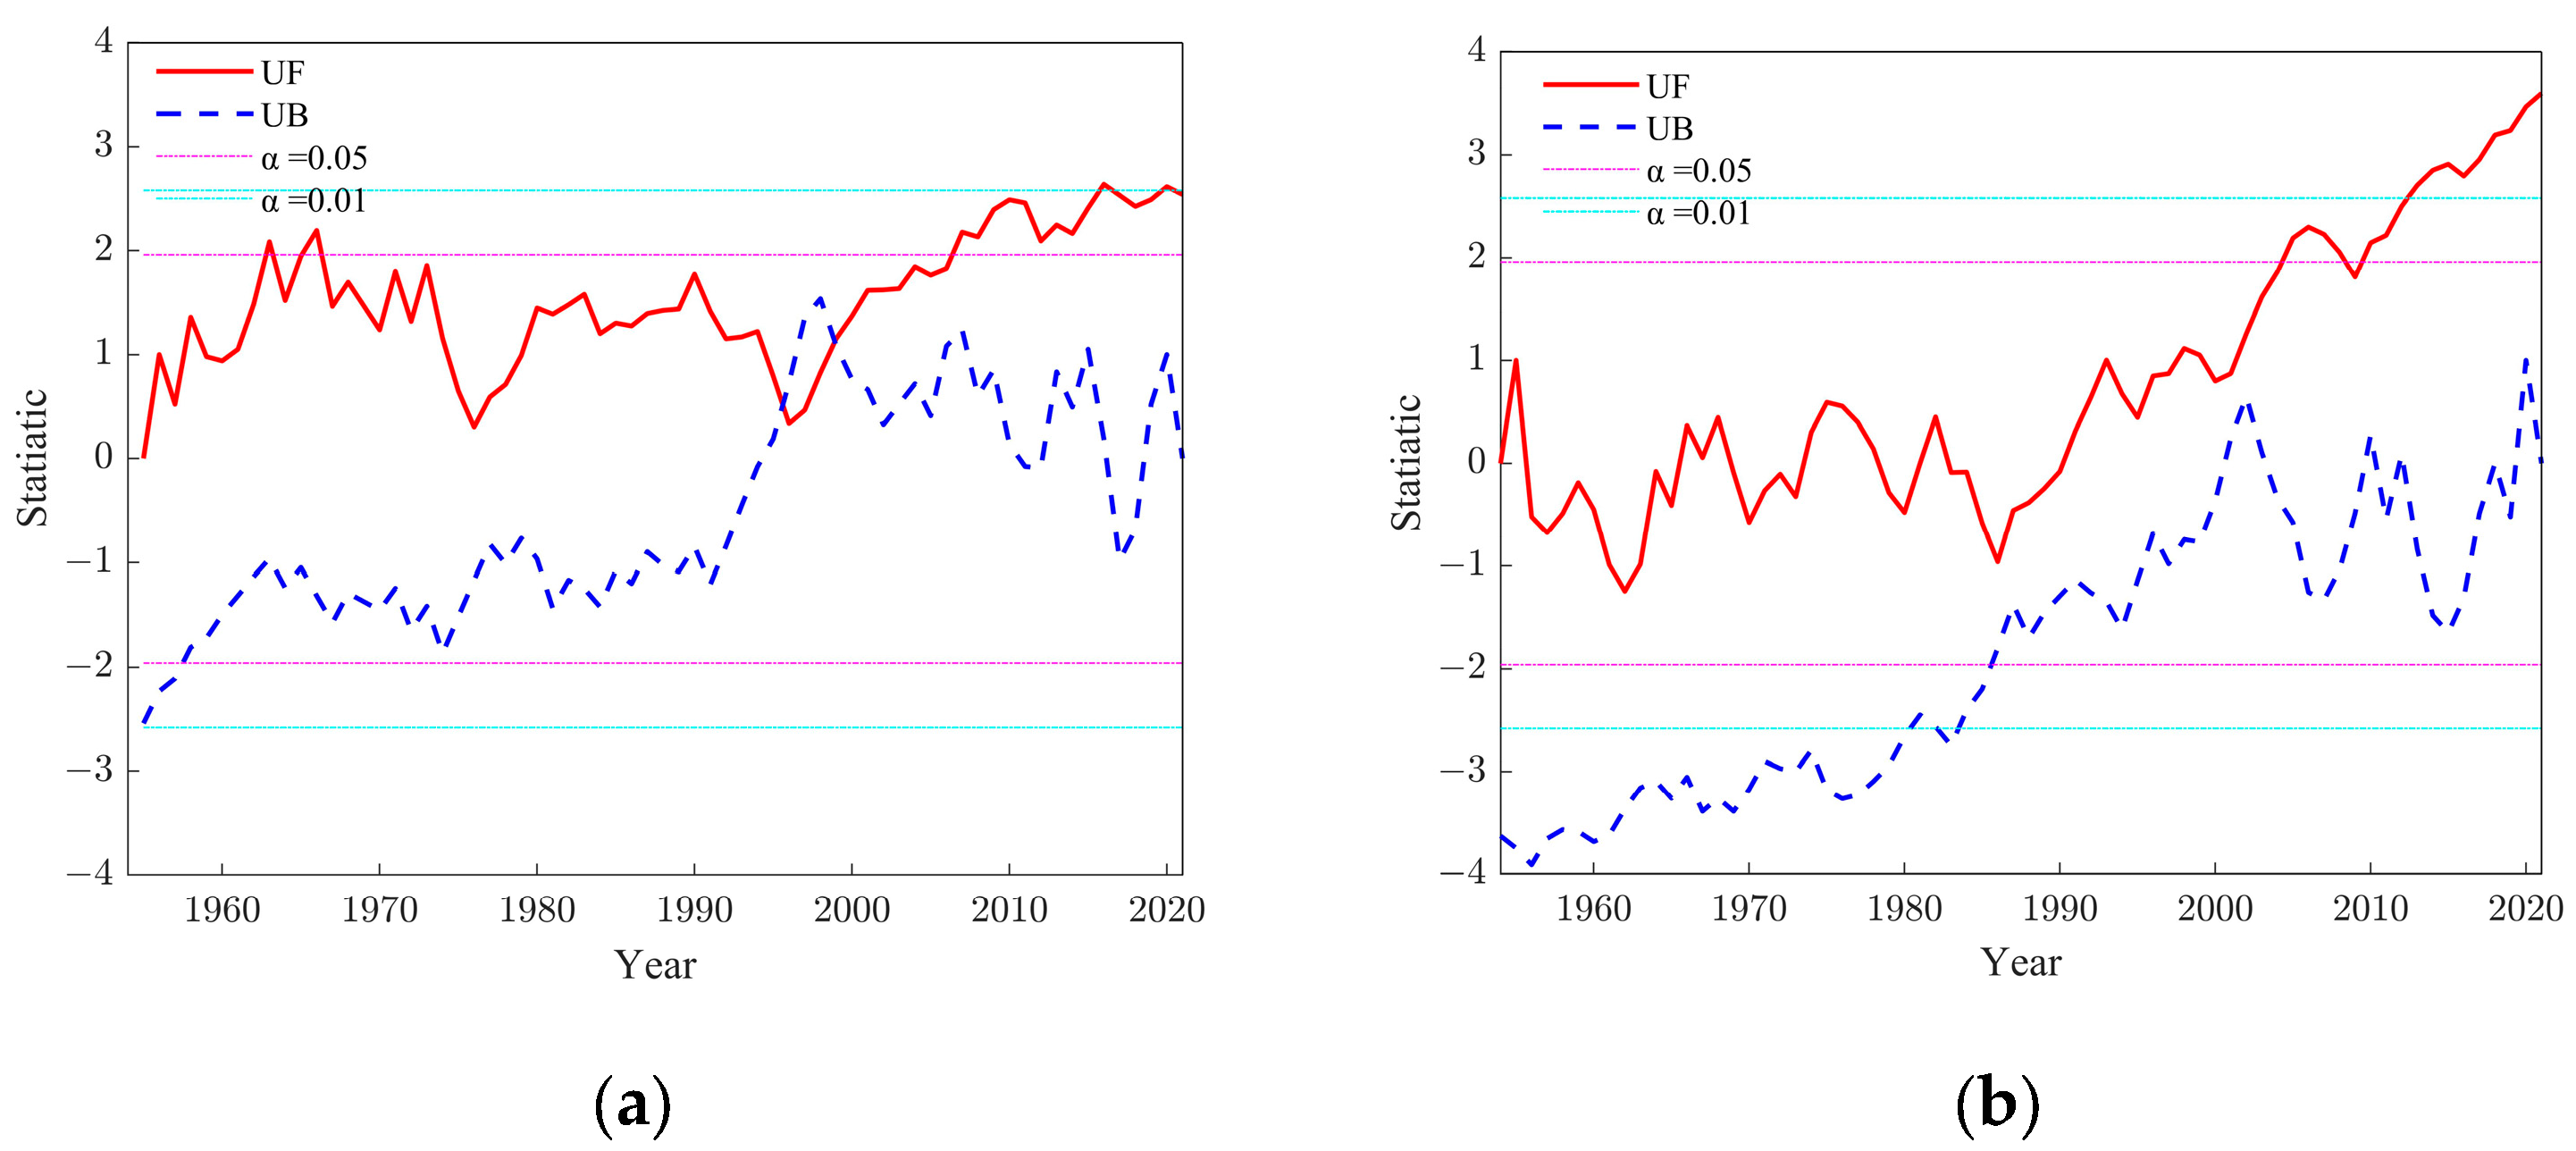
Figure 3 illustrates the meteorological variation trend observed at the Kaqun station. An upward trend characterizes both temperature and precipitation over time, though significant year-to-year fluctuations are evident. Temperature exhibited significant fluctuations prior to 2000; then, fluctuation amplitude reduced, leading to a more stable moving average trend. An upward trend generally characterizes precipitation patterns, with this tendency becoming particularly significant after 1990. Relatively insignificant fluctuations occurred between 1954 and 1980; the period from 1980 to 2000 saw gradual increases accompanied by enhanced variability; the post-2000 data indicated even greater variability.
Figure 4 presents the results of meteorological abrupt change testing conducted at the Kaqun station. A significant upward trend characterizes the overall pattern, particularly with increases occurring after 2000. Throughout the study period, temperature demonstrated an increasing trend, attaining a 0.05 significance level by 2006, after which significant increases continued to occur. The years 1996 and 1999 marked observable abrupt change points in the temperature data. Prior to 1990, precipitation exhibited minimal increases; however, a gradual upward increase appeared after 1990, eventually reaching a 0.05 significance level by 2004, followed by continued significant increases. No abrupt change points were identified in the precipitation data.
3.2. Meteorological Causal Analysis
3.2.1. Temperature Influence Factor Analysis
During summer months, the Tibetan Plateau and surrounding regions host a large anticyclonic circulation system known as the South Asian High (SAH), which operates in the upper troposphere and lower stratosphere. At 100 hPa, this system reaches its peak stability and prominence, exerting a significant effect over Asian weather patterns and the distribution of floods and droughts across China [
21]. Research indicates that when the South Asian High’s center shifts eastward, its intensity typically increases, creating conditions that favor more frequent high-temperature days in Xinjiang [
22].
An analysis indicates strong correlations between the basin’s daily average temperature from 1954–2021 and both the coverage area and center strength of the South Asian High, deriving coefficients of 0.919 and 0.934, respectively, with both values significant at the 0.01 level.
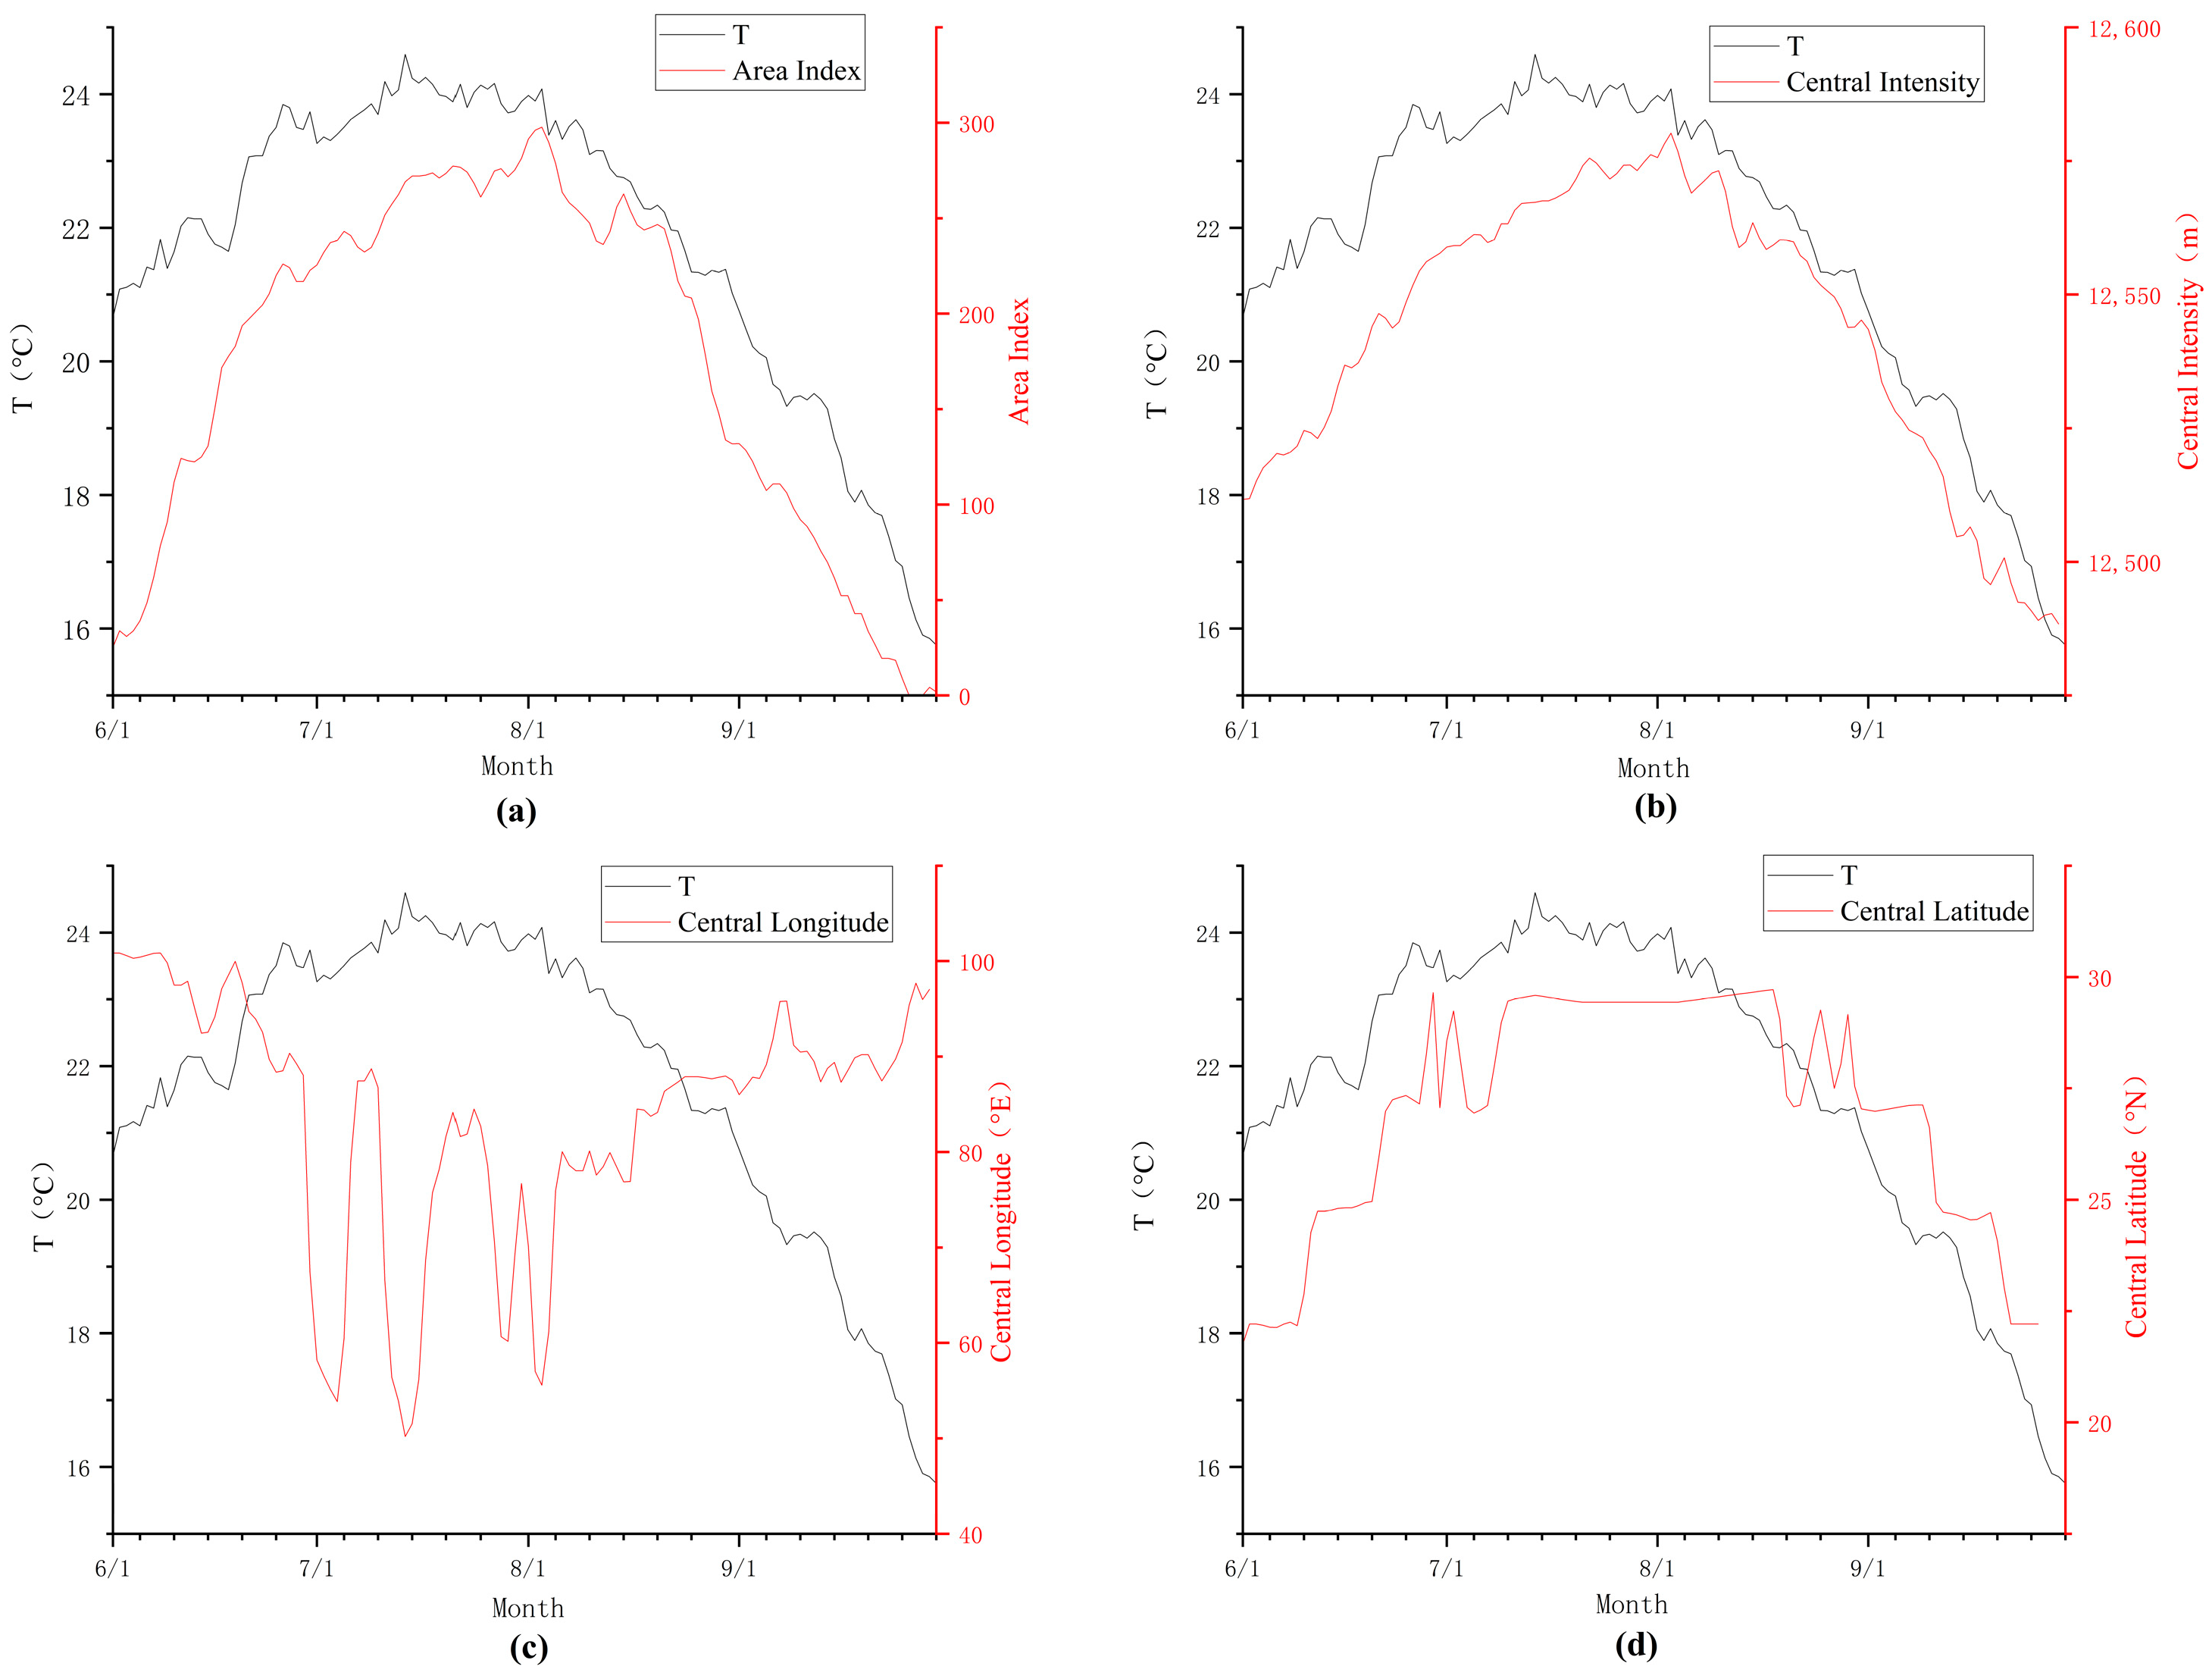
Figure 5 illustrates the comparative relationship between daily average temperatures and various characteristics of the South Asian High, including the area index, central intensity, central longitude, and central latitude. Depicted in
Figure 5a, the area index—which measures the total grid points where geopotential height surpasses 12,500 gpm—exhibits notable growth between late July and early August, suggesting the SAH becomes both stronger and more expansive during this timeframe. The peak values for central intensity, a measure of the SAH’s central pressure strength as presented in
Figure 5b, occur from late July through early August, corresponding accurately with the period when the SAH exerts its greatest influence on basin temperatures. Between July and early August, significant fluctuations characterize the central longitude (
Figure 5c), indicating dynamic shifts in the SAH’s east–west positioning. The central latitude, presented in
Figure 5d, exhibits remarkable stability, at approximately 30° N, in proximity to the basin from early July until mid-August, after which it begins a gradual southward migration. From late June through mid-August, these patterns indicate the SAH’s strong influence on basin temperature, while mid-August represents a critical transition between the main flood and post-flood periods as the SAH’s impact progressively weakens. Valuable insights regarding the relationship between the SAH and regional climate systems can be derived from this analysis, enhancing the understanding of temperature fluctuations in the basin.
3.2.2. Precipitation Causal Analysis
Heavy rainfall associated with the Tashkent Low Vortex constitutes the primary source of precipitation in the Yeerqiang River Basin [
23].
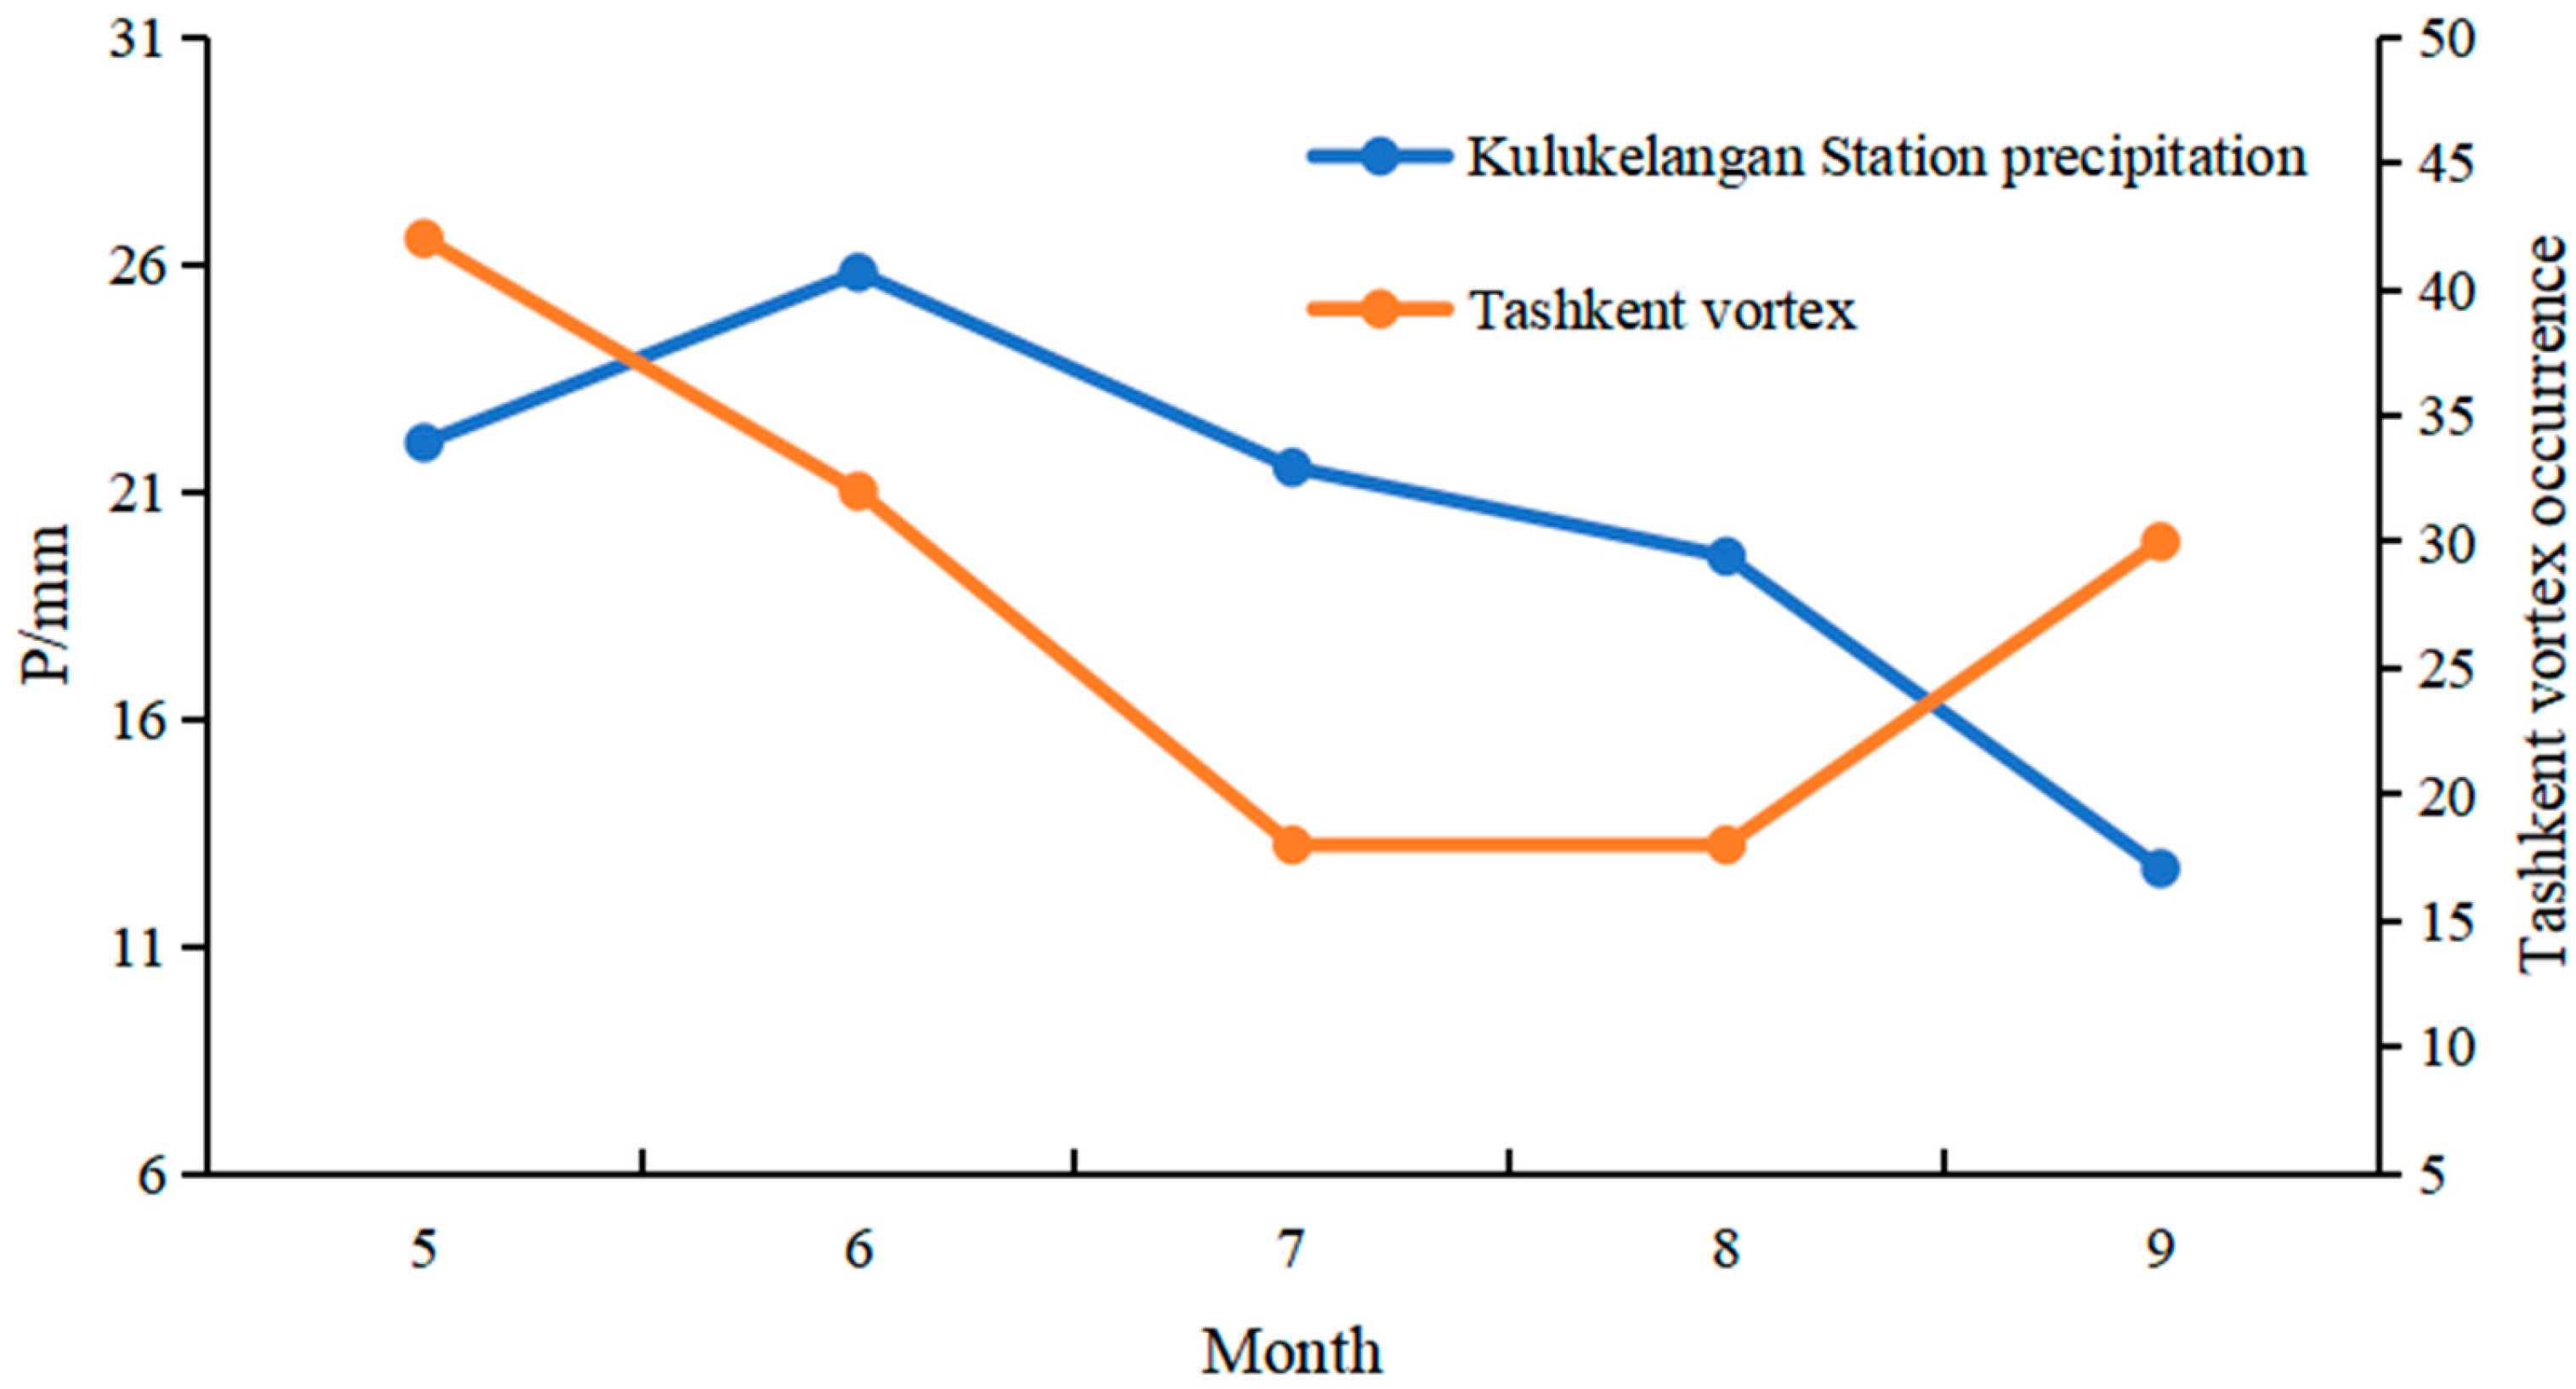
Southern Xinjiang experiences two effects from the Tashkent Low Vortex: significant precipitation events and periods of cold weather. Approximately 20% of rainfall events can be attributed to the Tashkent Low Vortex, with July exhibiting the most significant precipitation effects, while May and June follow in intensity [
24].
Figure 6 presents a comparative analysis between basin rainfall data and the frequency of Tashkent Low Vortex occurrences. The data visualization in
Figure 6 indicates that May experiences the highest frequency of Tashkent Low Vortex events, with June and September indicating the next highest occurrences. June marks the peak rainfall period, with May and July recording the second and third highest precipitation levels, respectively. A significant correlation between the Tashkent Low Vortex and rainfall patterns occurs during June and July, with June witnessing the majority of precipitation events. The region’s unique climatic profile is represented by infrequent precipitation events, making it unusual for rainfall alone to trigger significant flooding. Temperature considerations thus inform the designation of mid-August as the boundary separating the main flood season from the post-flood period.
3.3. Mathematical and Statistical Analysis
3.3.1. Flood Time Distribution Characteristics
The analytical study consisted of 68 years, from 1954 through 2021, analyzing flood data that comprised 191 instances of snowmelt floods and snowmelt–rainstorm mixed floods. In addition, 47 cases involving glacier “dam-break” floods and their combination with snowmelt–rainstorm events were included in this study.
The temporal distribution of peak flows and occurrence frequencies for the 191 documented cases of snowmelt and snowmelt–rainstorm mixed floods is illustrated in
Table 1 and
Figure 7. According to statistical analysis, 70% of these flood events concentrated in the period from early July to mid-August. On 2 August 1999, the most significant flood peak was recorded, reaching a flow rate of 3110 m
3/s. Flood peaks following mid-August exhibited unique seasonal patterns, with none exceeding a two-year recurrence interval. Based on these distribution patterns of snowmelt and snowmelt–rainstorm mixed floods, mid-August is chosen as the boundary between the main flood season and the post-flood period.
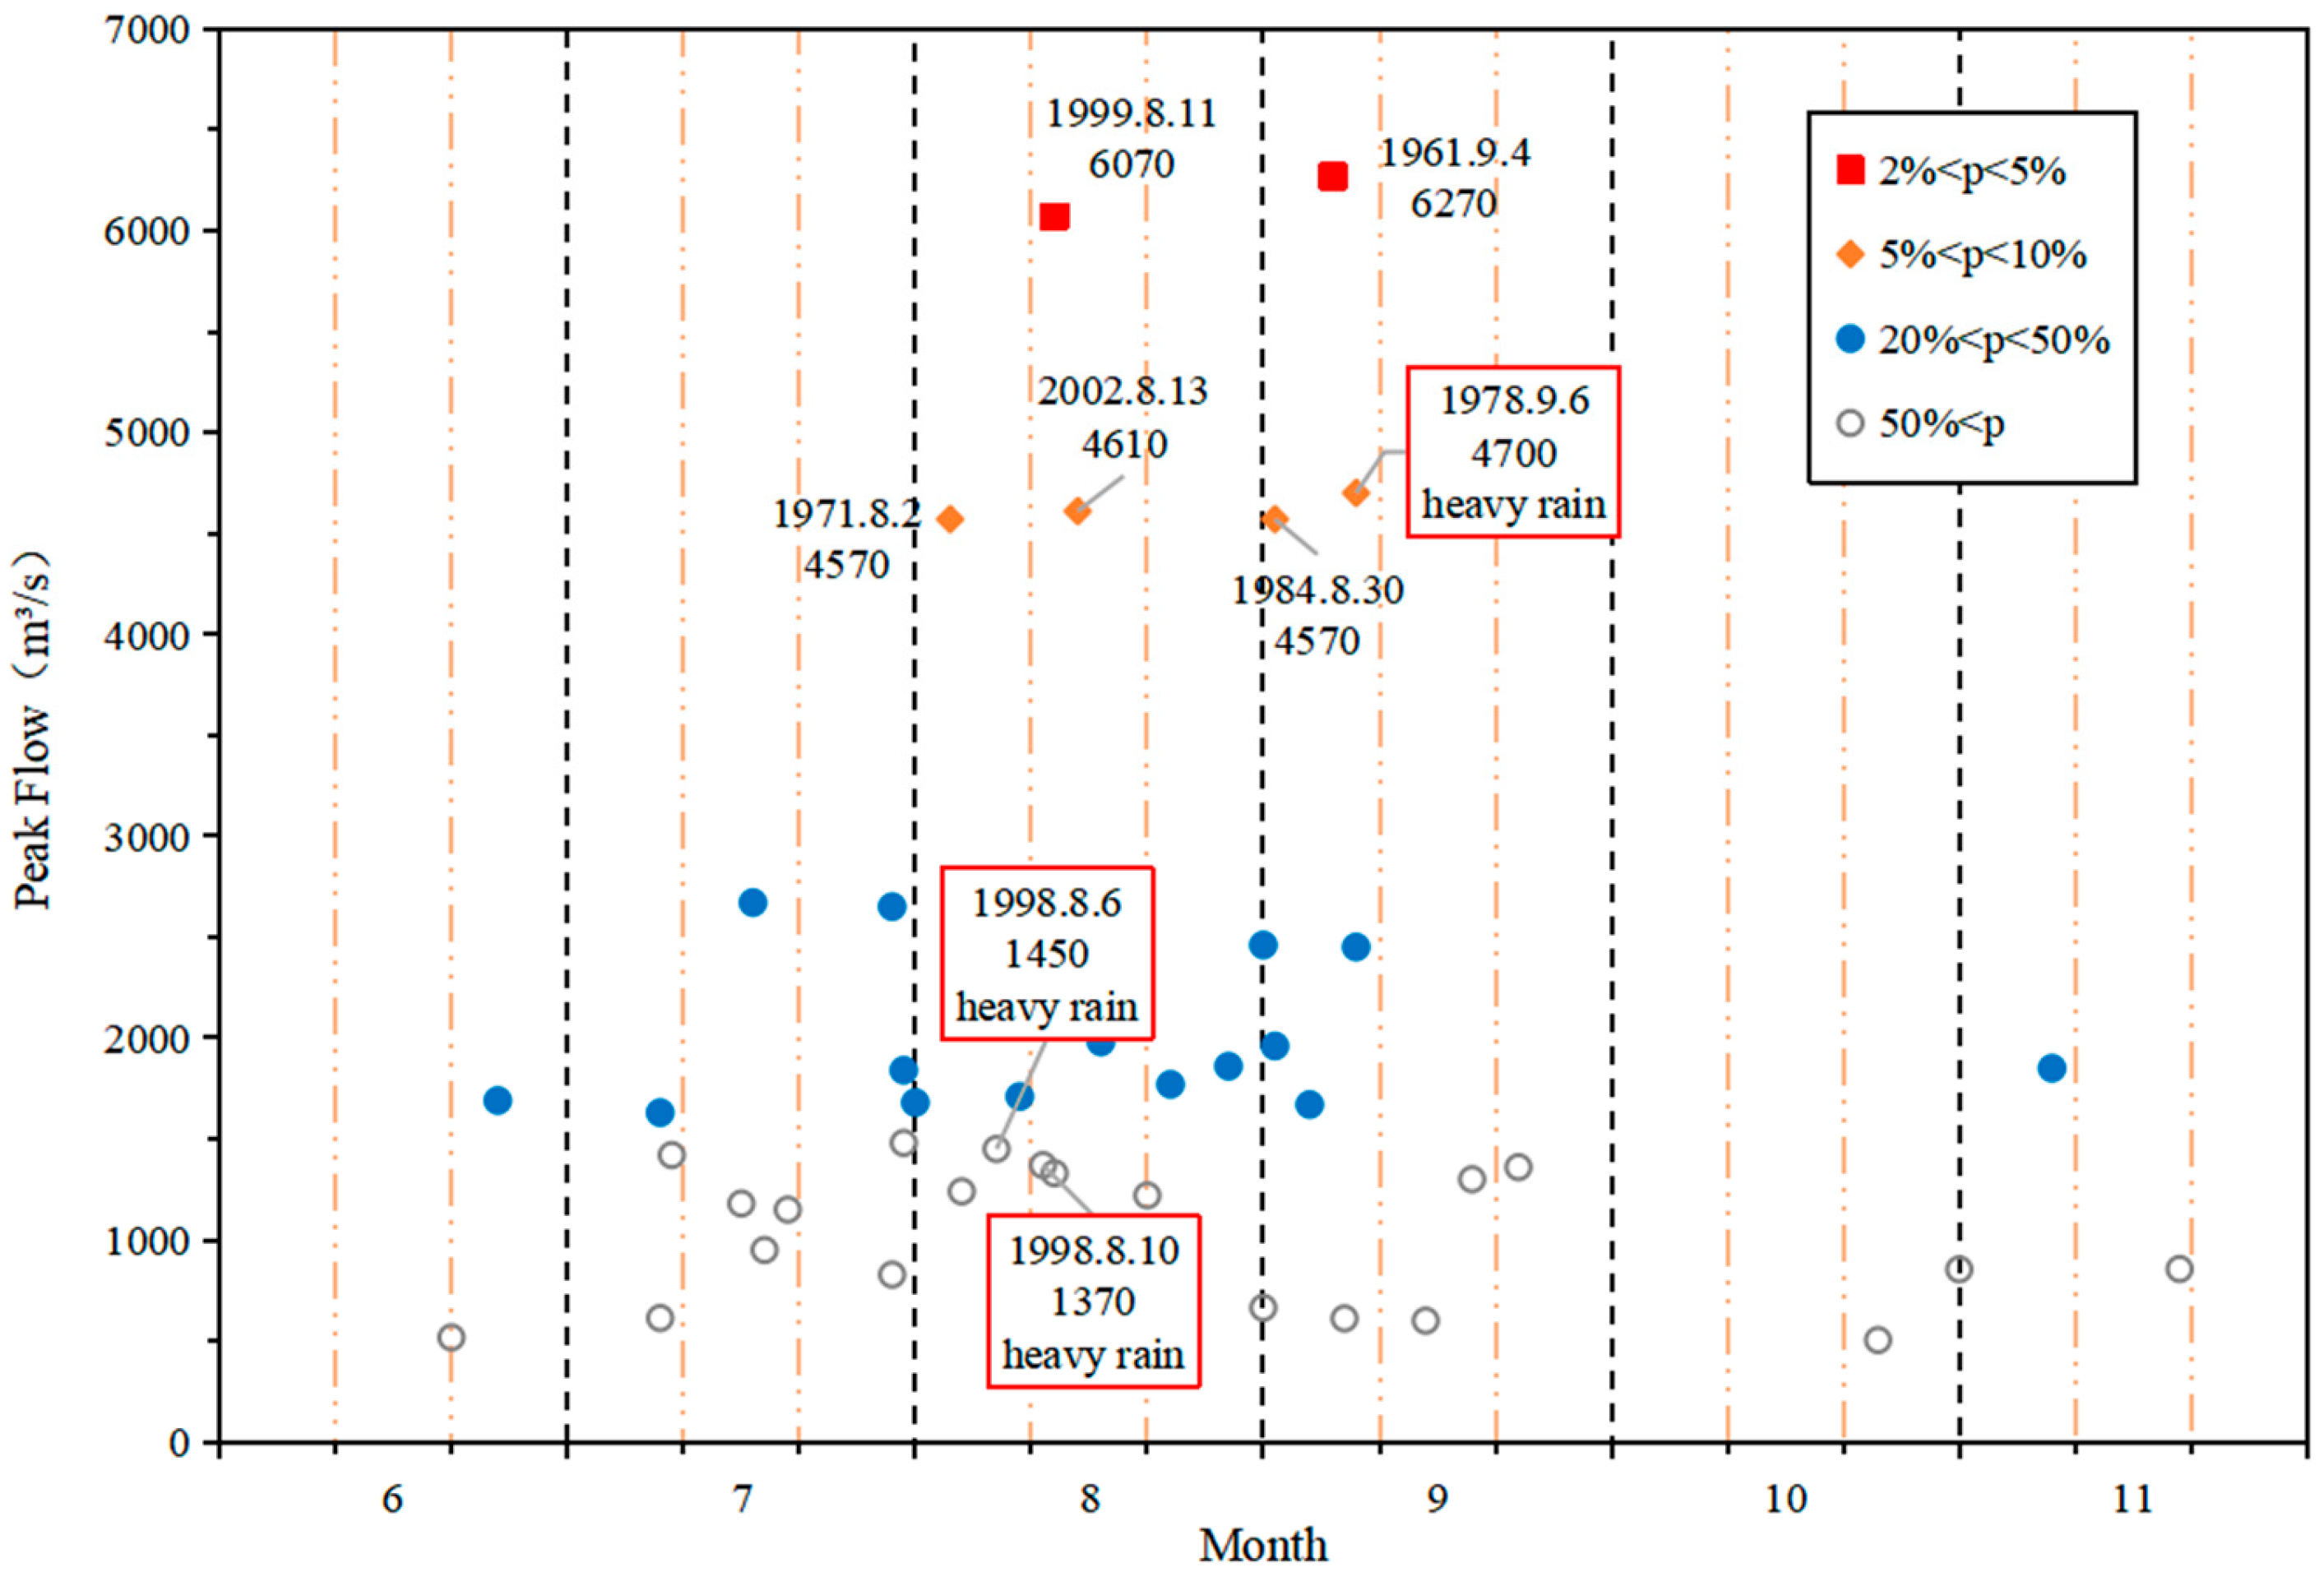
The temporal distribution of peak flows and their frequency of occurrence for 47 cases of glacier “dam-break” floods and glacier “dam-break”–snowmelt–rainstorm mixed floods are illustrated in
Table 2 and
Figure 8. Analysis indicates that 4 September 1961 marked the occurrence of the most significant flood event, which reached an extraordinary peak flow of 6270 m
3/s. Flood events with a 20–50-year return period typically occurred between mid-August and early September. During early August, mid-August, late August, and early September, peak flows corresponding to a 10–20-year return period were primarily recorded. Early August was the main timeframe for floods with a 5–10-year return period. In comparison, floods with return periods shorter than 5 years displayed a broader temporal range, occurring anytime between June and November. Therefore, these observations suggest that glacier “dam-break” and glacier “dam-break”–snowmelt–rainstorm mixed floods exhibit a relatively dispersed temporal distribution without clear patterns of regularity.
Table 3 and
Figure 9 illustrate the variations in peak flow alongside average and maximum values for multiple runoff parameters—maximum daily, three-day, five-day, seven-day, and fifteen-day measurements—for glacier “dam-break” events and glacier “dam-break”–snowmelt–rainstorm mixed floods before and after August 20. Analysis of these data indicates a significant post-August 20 decrease in runoff. Specifically, maximum daily runoff demonstrated reductions of 20.9% in the average values and 14.2% in the maximum values. More significant declines appeared in the maximum three-day runoff, with the average values dropping by 38.9% and the maximum values by 41.8%. The average values of the maximum five-day, seven-day, and fifteen-day runoff decreased by more than 29%, and their maximum values also decreased by more than 26%. These consistent declines across various runoff quantities for both glacier “dam-break” events and the mixed snowmelt–rainstorm floods demonstrate significant seasonal characteristics in the post-August 20 period.
In conclusion, at the Altash Water Conservancy Project site, snowmelt and snowmelt–rainstorm mixed floods are most prevalent between early July and mid-August. A significant decrease in both the number and magnitude of floods is observed after 16 August, indicating unique seasonal patterns. Following 20 August, a significant decrease occurs in the peak runoff over three, five, seven, and fifteen-day periods for both glacier “dam-break” floods and glacier “dam-break”–snowmelt–rainstorm mixed floods, demonstrating evident seasonal variations. Compared to the period before 20 August, both the average and maximum peak flow and runoff values exhibit a significant decline after 20 August, further highlighting the seasonal nature of these events. Therefore, based on these observations, 20 August is designated as the transition date between the main flood season and the post-flood period at the Altash Water Conservancy Project.
3.3.2. Runoff Variation Characteristics During the Flood Season
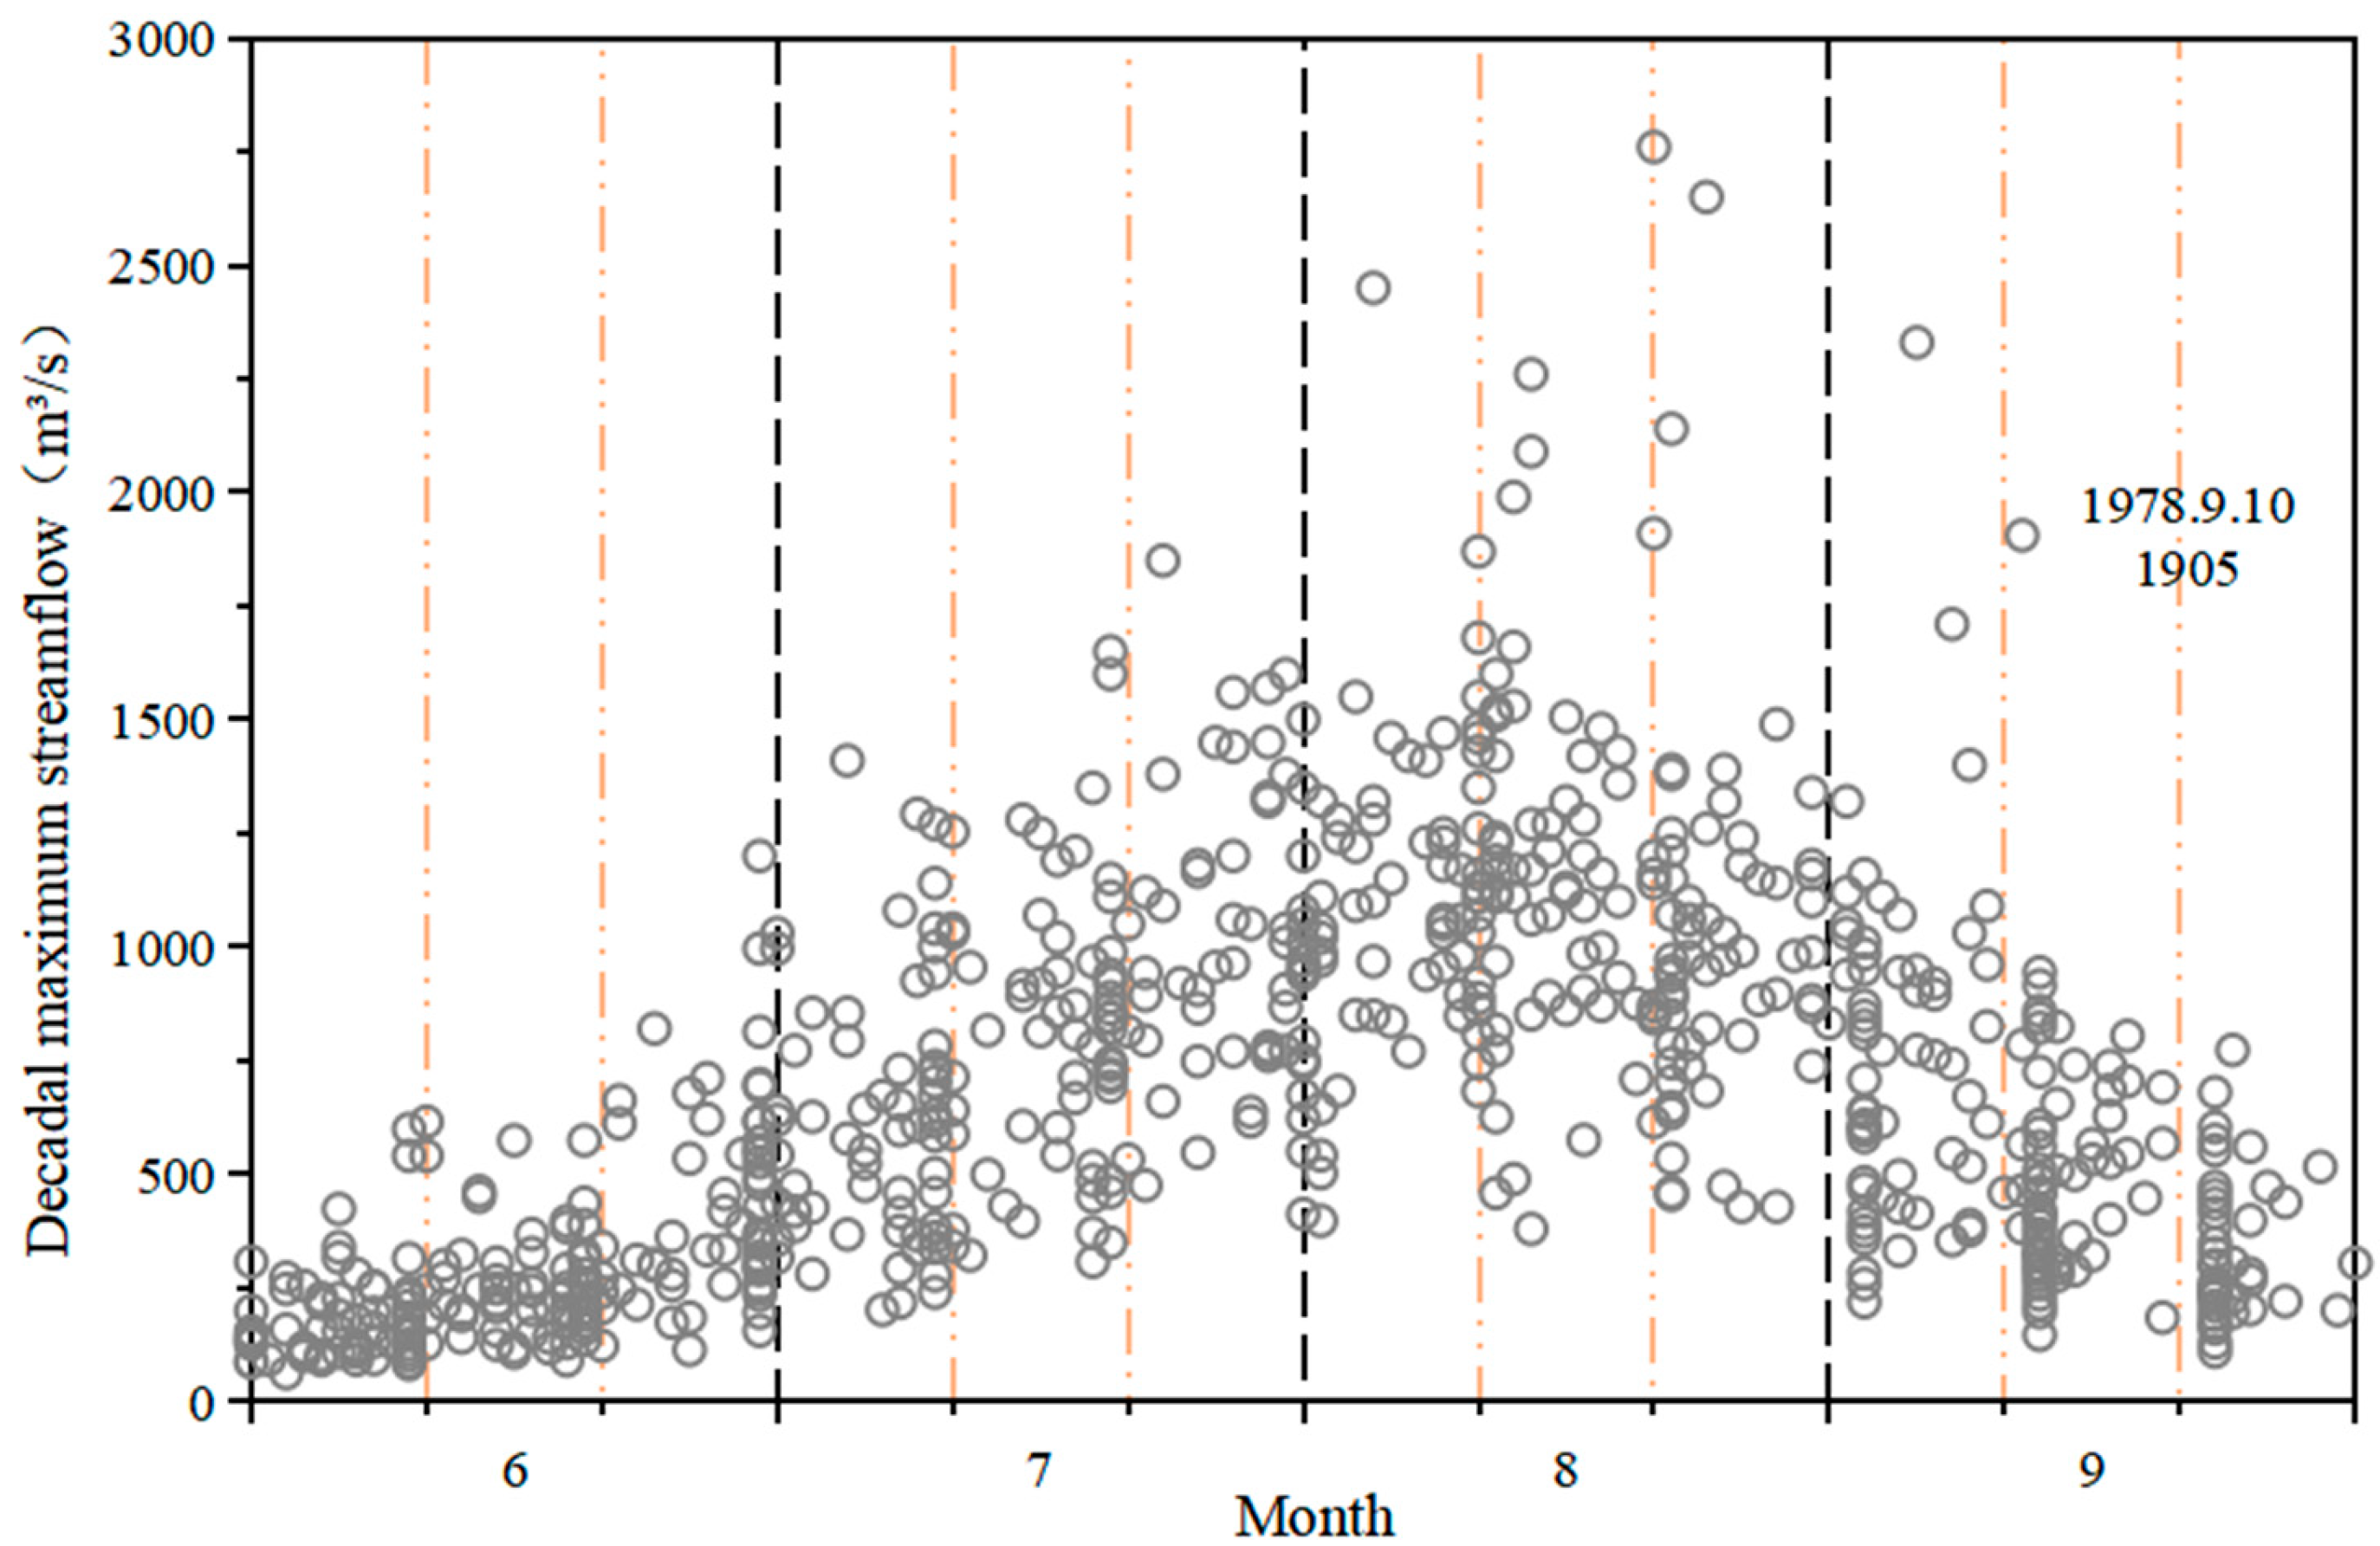
An analysis of the maximum daily and weekly average inflow for each decade was conducted utilizing the Altash Water Conservancy Project’s daily flow data from 1954 to 2021, with the results depicted in
Figure 10 and
Figure 11.
Analysis of
Figure 10 and
Figure 11 demonstrates that the maximum daily inflow reaches significantly higher values during July and August than in other periods, with peaks occurring in early August. Weekly average inflow displays a unimodal distribution pattern, cresting in mid-August before experiencing a sharp decline by the month’s conclusion. This difference in inflow before and after mid-August highlights the significant seasonal characteristics of the Altash Water Conservancy Project. Therefore, 20 August has been established as the boundary between the main flood season and the post-flood period, based on a thorough analysis of both maximum daily and weekly average inflow patterns.
3.3.3. Basin Precipitation Time Distribution Characteristics
In the basin, relatively minimal average weekly cumulative rainfall values are observed at both the Kaqun and Kulukelangan stations. Mid-June marks the period of maximum weekly cumulative rainfall at Kaqun station, reaching 4.93 mm, whereas throughout other weeks, values fluctuate between 2 mm and 5 mm. At Kueruklan station, early June experiences the peak weekly cumulative rainfall of 9.03 mm, with measurements during other weeks varying from 2 mm to 9 mm. As illustrated in
Figure 12, the analysis of rainfall primarily concentrates on instances of heavy precipitation and beyond, specifically when daily rainfall exceeds 12 mm.
Figure 12 observes that, between June and September, Kaqun station experienced five episodes of torrential rainfall alongside 38 occurrences of heavy precipitation. During the period between June and mid-September, Kueruklan station recorded three episodes of torrential downpours and 40 cases of heavy rainfall. Neither station exhibits seasonal trends regarding heavy or torrential precipitation, with both locations documenting comparatively infrequent instances of such weather events. Therefore, precipitation cannot be identified as the main factor triggering floods in the basin.
In conclusion, the basin experiences generally minimal precipitation levels, which precludes rainfall from being the principal cause for flooding events. Hence, when categorizing flood seasons, priority should be given to analyzing flood distribution patterns and runoff variations rather than precipitation data.
3.3.4. Ordered Clustering Method
Drawing from 68 years of daily average flow data between 1 June and 30 September (1954–2021) for the Altash-controlled watershed, this study analyzed hydrological patterns across seasonal variations. From these measurements, researchers sampled maximum daily average flow values to establish a daily maximum flow sequence. In this hydrological sequence, dates indicating glacier “dam-break” floods were substituted with the average flow calculated from pre- and post-flood measurements, offering more consistent data for calculation.
on the vertical Z-axis,
while horizontal coordinates X and Y correspond to mutation points
and
, respectively.
Figure 13 observes that
.
4. Discussion
In conclusion, this work establishes a scientifically robust flood season staging framework for the Yeerqiang River that sheds light on the relationship between atmospheric dynamics, temperature trends, and hydrological patterns. By proposing adaptive, climate-resilient water management approaches, our study offers a valuable template for arid regions worldwide—areas where the balance between water security and flood resilience grows increasingly critical amid global warming.
Our study combines qualitative meteorological causal analysis with quantitative statistical and clustering methods to define flood season staging for the Altash Water Control Project in Xinjiang, thereby creating a methodological framework specifically tailored to snowmelt-dominated arid basins. The staging scheme we developed identifies mid-August as the crucial transition between the main flood season and the post-flood period, coinciding with the seasonal weakening of the South Asian High (SAH) and the reducing influence of temperature-driven snowmelt processes. This observation complements broader research highlighting the significance of large-scale atmospheric dynamics in arid regions, where flooding results not solely from precipitation but also from temperature-induced ice and snow melt [
25,
26]. The strong correlation between SAH intensity and basin temperature (r = 0.934,
p < 0.01) indicates the fundamental importance of atmospheric circulation patterns in regional hydrology—a perspective frequently neglected in conventional flood studies that concentrate on humid regions. Through its synthesis of meteorological causation and hydrological statistics, our work enhances the mechanistic understanding of flood seasonality in snowmelt-dominated systems, addressing a significant knowledge gap in arid zone water management.
The alignment between the ordered clustering findings (17 August) and statistical results (20 August) demonstrates the staging scheme’s reliability. In comparison to previous research dependent on singular methodological approaches [
27], this dual-method consistency strengthens this analysis.
Seasonal temperature and precipitation patterns affect the establishment of flood season stage dates, particularly the critical transition from the main flood season to the post-flood period. This approach’s effectiveness gains further validation from prior research that has highlighted seasonal climate dynamics’ crucial role in flood behavior [
28,
29].
Results from this study emphasize the practical necessity of accurately identifying flood season stage dates for effective water level management at the Altash Reservoir. The integration of boundary points with seasonal weather system variations establishes a comprehensive foundation that enhances reservoir management while reducing potential flood risks.
The applicability of these findings may, however, be affected by various factors. Climate change impacts could transform precipitation patterns and alter runoff behavior, potentially shifting the established stage points. To improve weather prediction capabilities, future research should incorporate these evolving factors.
Moreover, water resource utilization could benefit significantly from applying this study’s methodologies to regions sharing similar climatic and hydrological characteristics. Additional research opportunities exist in the integration of real-time weather information into dynamic assessments of flood water levels, facilitating more responsive water resource management approaches.
In conclusion, this work establishes a scientifically robust framework for flood season staging in the Yeerqiang River basin by emphasizing the relationships between atmospheric dynamics, temperature trends, and hydrological variability. Through its promotion of climate-resilient water management strategies, it offers a valuable template for arid regions worldwide facing the increasingly critical challenge of balancing water security with flood resilience in our warming climate.
5. Conclusions
This study employs both qualitative and quantitative approaches to analyze flood season division for the Altash Water Conservancy Project in Xinjiang, with the aim of enhancing water resource utilization efficiency. Drawing on the project’s actual operational scheduling data, researchers primarily sought to determine the boundary separating the main flood season and the post-flood period. The specific conclusions are:
(1) In the Yeerqiang River Basin, annual runoff has presented a significant upward trend, especially since 2010, attributable to increased temperatures and precipitation. Such a trend significantly affects both flood control strategies and reservoir management practices. The acceleration of glacier- and snowmelt due to rising temperatures leads to increased river flows in flood season, while the increased precipitation contributes to more frequent extreme rainfall events. In response to these changes, water management must evolve from conventional fixed flood limit water level approaches toward dynamic control systems capable of adapting to real-time hydrological and meteorological information. Implementation of this adaptive methodology would not only enhance flood safety but also optimize water storage capabilities for supply needs and hydropower generation. In addition, to reduce the increasing risks associated with intense rainfall events, more sophisticated flood forecasting systems must be developed. When incorporated into reservoir management strategies, these trend analyses facilitate more effective responses to climate-driven hydrological shifts, thereby strengthening both flood control measures and water resource utilization.
(2) Analysis of meteorological causation indicates temperature as the critical factor influencing flood events throughout the basin. The basin’s temperature patterns primarily respond to the South Asian High’s influence. Through analysis of this high-pressure system’s location, strength, and territorial coverage, mid-August clearly appears to be the boundary separating the main flood season from the post-flood period.
(3) Statistical approaches to flood season division, focusing on both flood event distribution patterns and characteristic runoff variations, have identified 20 August as the transition point between the main flood season and the post-flood period. This date reflects the consistent patterns across multiple years of hydrological data.
(4) When applying the ordered clustering methodology for flood season division, 17 August stands out as the boundary between the main flood season and post-flood period.
After consideration of these varied division methodologies, and adopting a deliberately cautious approach, 20 August has been established as the official boundary between the main flood season and the post-flood period for the Yarkand River Altash Water Conservancy Project.
Author Contributions
Conceptualization, H.Z. and X.H.; methodology, H.Z., R.M. and X.H.; software, H.Z., R.M. and X.H.; validation, H.Z., R.M. and X.H.; formal analysis, X.H.; investigation, H.Z., R.M. and X.H.; resources, X.H.; data curation, H.Z.; writing—original draft preparation, H.Z.; writing—review and editing, H.Z. and X.H.; visualization, H.Z. and R.M.; supervision, X.H.; project administration, X.H. All authors have read and agreed to the published version of the manuscript.
Funding
This research received no external funding.
Data Availability Statement
The raw data supporting the conclusions of this article will be made available by the authors on request.
Conflicts of Interest
The authors declare no conflicts of interest.
References
- Wu, P.; Chen, G.; Wang, Y.; Li, J. Applying the Improved Set Pair Analysis Method to Flood Season Staging in Tropical Island Rivers: A Case Study of the Hainan Island Rivers in China. Water 2024, 16, 3418. [Google Scholar] [CrossRef]
- Lu, S.; Jin, J.; Zhou, J.; Li, X.; Ju, J.; Li, M.; Chen, F.; Zhu, L.; Zhao, H.; Yan, Q.; et al. Drainage basin reorganization and endorheic-exorheic transition triggered by climate change and human intervention. Glob. Planet. Change 2021, 201, 103494. [Google Scholar] [CrossRef]
- Jain, S.K.; Singh, V.P. Water Resources Systems Planning and Management; Elsevier: Amsterdam, The Netherlands, 2003. [Google Scholar]
- Han, C.; Zheng, J.; Guan, J.; Yu, D.; Lu, B. Evaluating and simulating resource and environmental carrying capacity in arid and semiarid regions: A case study of Xinjiang, China. J. Clean. Prod. 2022, 338, 130646. [Google Scholar] [CrossRef]
- Wan, X.; Xue, Y.; Hua, L.; Wu, Q. Multi-objective collaborative decision-making for flood resource utilization in a reservoir. Stoch. Environ. Res. Risk Assess. 2023, 37, 4629–4640. [Google Scholar] [CrossRef]
- Nabinejad, S.; Schüttrumpf, H. Flood risk management in arid and semi-arid areas: A comprehensive review of challenges, needs, and opportunities. Water 2023, 15, 3113. [Google Scholar] [CrossRef]
- Zhang, J.; Min, Y.; Feng, B.; Duan, W. Research and application of key technologies for dynamic control of reservoir water level in flood season. Water 2021, 13, 3576. [Google Scholar] [CrossRef]
- Li, J.; Song, S.; He, H.; Wang, X. Study on flood stage stageing based on multi-objective bi-level programming model. J. Appl. Basic Eng. Sci. 2021, 29, 807–822. [Google Scholar]
- Jia, C.; Yu, H. Hydrological stageing study and application based on fractal theory for non-flood seasons. Water Resour. Tech. Superv. 2023, 7, 150–154. [Google Scholar]
- Mo, C.; Zhu, C.; Ruan, Y.; Lei, X.; Xing, Z.; Sun, G. Study on the Staged Operation of a Multi-Purpose Reservoir in Flood Season and Its Effect Evaluation. Water 2021, 13, 2563. [Google Scholar] [CrossRef]
- Zhang, X.; Gao, M.; Ren, L.; Qi, Y.; Liu, X. Flood stage stageing and flood limit water level study for Heihe Jinpen Reservoir. Shaanxi Water Resour. 2023, 10, 69–72. [Google Scholar]
- Jun, L.I. Flood season staging based on improved fuzzy set analysis. J. Yangtze River Sci. Res. Inst. 2017, 34, 12. [Google Scholar]
- Song, Y.; Wang, H. Study on stage method of reservoir flood season. Energy Rep. 2022, 8, 138–146. [Google Scholar] [CrossRef]
- Tang, L.; Zhang, Y. Considering abrupt change in rainfall for flood season division: A case study of the Zhangjia Zhuang reservoir, based on a new model. Water 2018, 10, 1152. [Google Scholar] [CrossRef]
- Uwamahoro, S.; Liu, T.; Nzabarinda, V.; Habumugisha, J.M.; Habumugisha, T.; Harerimana, B.; Bao, A. Modifications to snow-melting and flooding processes in the hydrological model—A case study in Issyk-Kul, Kyrgyzstan. Atmosphere 2021, 12, 1580. [Google Scholar] [CrossRef]
- Nurmemet, A. Analysis of the Role of Two Reservoirs in Floodwater Utilization in the Yeerqiang River. China Water Transp. 2023, 23, 75–77. [Google Scholar]
- Copernicus Climate Change Service (C3S). ERA5: Fifth Generation of ECMWF Atmospheric Reanalyses of the Global Climate [Data Set]. Copernicus Climate Change Service Climate Data Store (CDS). 2017. Available online: https://cds.climate.copernicus.eu/ (accessed on 15 May 2024).
- Mo, S.; Zhen, X.; Chen, L.; Cheng, L.; Chen, M. Attribution analysis of dry and wet season runoff changes in the Jialu River based on the ABCD and Budyko models. J. China Inst. Water Resour. Hydropower Res. 2023, 21, 501–510, 525. [Google Scholar]
- Tan, X.; Wu, X.; Yu, H. Review of reservoir flood stage stageing and flood limit water level studies. Jiangxi Water Resour. Sci. Technol. 2017, 43, 23–26. [Google Scholar]
- Wang, J. Flood characteristics analysis of Yarkand River. Heilongjiang Water Resour. Sci. Technol. 2013, 41, 87–89. [Google Scholar]
- Wang, J.; Chen, D.; Guo, D. Impact of the South Asian high on the distribution of ozone in the adjacent UTLS region during summer. Meteorol. Sci. 2023, 43, 761–771. [Google Scholar]
- Chen, Y.; Shao, W.; Cao, M.; Lyu, X. Variation characteristics and influencing factors of high-temperature days in Xinjiang during summer. Arid Zone Res. 2020, 37, 58–66. [Google Scholar]
- Zhang, J.; Deng, Z. (Eds.) Introduction to Precipitation in Xinjiang; Meteorological Press: Beijing, China, 1987. [Google Scholar]
- Qin, H.; Yang, L.; Zhang, Y. Statistical analysis of the characteristics of Tashkent low vortex activity in the past 40 years. Plateau Meteorol. 2013, 32, 1042–1049. [Google Scholar]
- Bai, J.; Li, J.; Shi, H.; Liu, T.; Zhong, R. Snowmelt water alters the regime of runoff in the arid region of northwest China. Water 2018, 10, 902. [Google Scholar] [CrossRef]
- Yang, W.; Jin, F.; Si, Y.; Li, Z. Runoff change controlled by combined effects of multiple environmental factors in a headwater catchment with cold and arid climate in northwest China. Sci. Total Environ. 2021, 756, 143995. [Google Scholar] [CrossRef] [PubMed]
- Li, Y.; Li, Y.; Feng, K.; Sun, K.; Cheng, Z. The Influence of Time Domain on Flood Season Segmentation by the Fisher Optimal Partition Method. Water 2024, 16, 580. [Google Scholar] [CrossRef]
- Khajehali, M.; Safavi, H.R.; Nikoo, M.R.; Najafi, M.R.; Alizadeh-Sh, R. A copula-based multivariate flood frequency analysis under climate change effects. Sci. Rep. 2025, 15, 146. [Google Scholar] [CrossRef]
- Wondie, M.; Kassa, T.; Fisseha, D. Developing an efficient climate forecasting model for the spatiotemporal climate dynamics estimation and the prediction that fits the variable topography feature of the upper Blue Nile basin, Ethiopia. Heliyon 2023, 9, e22870. [Google Scholar] [CrossRef]
Figure 1.
Annual average runoff trend at Kaqun Station.
Figure 1.
Annual average runoff trend at Kaqun Station.
Figure 2.
Abrupt change detection of annual average runoff at Kaqun Station.
Figure 2.
Abrupt change detection of annual average runoff at Kaqun Station.
Figure 3.
Meteorological trend at Kaqun Station: (a) Temperature Change Trend; (b) Precipitation Change Trend.
Figure 3.
Meteorological trend at Kaqun Station: (a) Temperature Change Trend; (b) Precipitation Change Trend.
Figure 4.
Abrupt change detection of meteorological data at Kaqun Station: (a) Temperature Change Detection Test; (b) Precipitation Change Detection Test.
Figure 4.
Abrupt change detection of meteorological data at Kaqun Station: (a) Temperature Change Detection Test; (b) Precipitation Change Detection Test.
Figure 5.
Comparison chart of daily average temperature and various factors of the South Asian High in the basin from 1954 to 2021: (a) Area Index; (b) Central Intensity; (c) Central Longitude; (d) Central Latitude. (Note: Area index refers to the total grid points within the region where the potential height is greater than 12,500 gpm; center strength is the maximum potential height in the region, i.e., the potential height at the high-pressure center; center longitude index refers to the longitude of the high-pressure center; center latitude index refers to the latitude of the high-pressure center).
Figure 6.
Comparison chart of frequency of Tashkent vortex occurrence and precipitation at Kulukelangan station.
Figure 6.
Comparison chart of frequency of Tashkent vortex occurrence and precipitation at Kulukelangan station.
Figure 7.
Temporal distribution of dam-break and dam-break–snowmelt–rainfall combined flood peak.
Figure 7.
Temporal distribution of dam-break and dam-break–snowmelt–rainfall combined flood peak.
Figure 8.
Temporal distribution of glacier dam-break and glacier dam-break–snowmelt–rainfall combined flood peak volumes.
Figure 8.
Temporal distribution of glacier dam-break and glacier dam-break–snowmelt–rainfall combined flood peak volumes.
Figure 9.
The rate of change in flood peak and volume for glacier dam-break and glacier dam-break–snowmelt–rainfall combined floods around 20 August.
Figure 9.
The rate of change in flood peak and volume for glacier dam-break and glacier dam-break–snowmelt–rainfall combined floods around 20 August.
Figure 10.
Temporal distribution of ten-day maximum daily average flow rates.
Figure 10.
Temporal distribution of ten-day maximum daily average flow rates.
Figure 11.
Temporal distribution of ten-day average flow rates.
Figure 11.
Temporal distribution of ten-day average flow rates.
Figure 12.
Number of occurrences of heavy rainfall and above: (a) Kaqun station; (b) Kulukelangan station.
Figure 12.
Number of occurrences of heavy rainfall and above: (a) Kaqun station; (b) Kulukelangan station.
Figure 13.
Two breakpoints and the sum of squared deviations.
Figure 13.
Two breakpoints and the sum of squared deviations.
Table 1.
Occurrence frequencies of snowmelt and snowmelt–rainfall combined flood peak flows by ten-day period.
Table 1.
Occurrence frequencies of snowmelt and snowmelt–rainfall combined flood peak flows by ten-day period.
| Flood Frequency | June | July | August | September |
|---|
| Early | Middle | Late | Early | Middle | Late | Early | Middle | Late | Early | Middle | Late |
|---|
| 10% < p < 20% | | | | | | | 1 | | | | | |
| 20% < p < 50% | | | | 1 | 2 | 8 | 9 | 3 | | | | |
| 50% < p | | 4 | 6 | 11 | 23 | 23 | 25 | 27 | 21 | 21 | 6 | |
| Total occurrences | | 4 | 6 | 12 | 25 | 31 | 35 | 30 | 21 | 21 | 6 | |
Table 2.
Occurrence frequencies of dam-break and dam-break-snowmelt–rainfall combined flood peak flows by ten-day period.
Table 2.
Occurrence frequencies of dam-break and dam-break-snowmelt–rainfall combined flood peak flows by ten-day period.
| Flood Frequency | June | July | August | September | October | November |
|---|
| Early | Middle | Late | Early | Middle | Late | Early | Middle | Late | Early | Middle | Late | Early | Middle | Late | Early | Middle | Late |
|---|
| 2% < p < 5% | | | | | | | | 1 | | 1 | | | | | | | | |
| 5% < p < 10% | | | | | | | 1 | 1 | 1 | 1 | | | | | | | | |
| 10% < p < 20% | | | | | | | 3 | | | | | | | | | | | |
| 20% < p < 50% | | | 1 | 1 | 1 | 3 | 1 | 1 | 4 | 2 | | | | | | 1 | | |
| 50% < p | | 1 | | 3 | 3 | 2 | 3 | 3 | 1 | 1 | 3 | | | | 2 | | 1 | |
| Total occurrences | | 1 | 1 | 4 | 4 | 5 | 8 | 6 | 6 | 5 | 3 | | | | 2 | 1 | 1 | |
Table 3.
The rate of change in flood peak and volume for snowmelt and glacier dam-break–snowmelt–rainfall combined floods around August 20.
Table 3.
The rate of change in flood peak and volume for snowmelt and glacier dam-break–snowmelt–rainfall combined floods around August 20.
| Flood Factors | Peak Flow/(m3·s−1) | 1d Flood Water Volume/(106 m3) | 3d Flood Water Volume/(106 m3) |
|---|
| Average | Maximum Value | Average | Maximum Value | Average | Maximum Value |
|---|
| Before 20 August | 2043.64 | 6070 | 114.64 | 242.89 | 288.41 | 595.30 |
| After 20 August | 2017.17 | 6270 | 91.50 | 208.33 | 178.57 | 346.23 |
| Change rate | −1.30% | 3.29% | −20.19% | −14.23% | −38.09% | −41.84% |
| Flood Factors | 5d Flood Water Volume/(106 m3) | 7d Flood Water Volume/(106 m3) | 15d Flood Water Volume/(106 m3) |
| Average | Maximum value | Average | Maximum value | Average | Maximum value |
| Before 20 August | 446.04 | 832.84 | 593.45 | 1118.93 | 1077.37 | 2071.04 |
| After 20 August | 271.82 | 564.30 | 394.44 | 792.06 | 761.23 | 1517.31 |
| Change rate | −39.06% | −32.24% | −33.53% | −29.21% | −29.34% | −26.74% |
| Disclaimer/Publisher’s Note: The statements, opinions and data contained in all publications are solely those of the individual author(s) and contributor(s) and not of MDPI and/or the editor(s). MDPI and/or the editor(s) disclaim responsibility for any injury to people or property resulting from any ideas, methods, instructions or products referred to in the content. |
© 2025 by the authors. Licensee MDPI, Basel, Switzerland. This article is an open access article distributed under the terms and conditions of the Creative Commons Attribution (CC BY) license (https://creativecommons.org/licenses/by/4.0/).


