Article

Optimization of Technical Parameters for the Vacuum Preloading-Flocculation-Solidification Combined Method for Sustainable Sludge Utilization

1
State Grid Jiangsu Electric Power Co., Ltd., Construction Branch, Nanjing 210000, China
2
School of Civil Engineering, Wuhan University, Wuhan 430072, China
*
Author to whom correspondence should be addressed.
Sustainability 2025, 17(6), 2710; https://doi.org/10.3390/su17062710
Submission received: 16 February 2025 / Revised: 7 March 2025 / Accepted: 16 March 2025 / Published: 19 March 2025
(This article belongs to the Special Issue Soil Stabilization and Geotechnical Engineering Sustainability)

Abstract

:
High-water content dredged sludge from waterways, with potential for sustainable use as high-performance fillers, was effectively treated using the vacuum preloading-flocculation-solidification combined method (denoted as the VP-FSCM). This study investigated the effect of flocculant and curing agent dosages on the solidification of sludge with initially poor mechanical properties. Ground granulated blast-furnace slag (GGBS) and ordinary Portland cement (OPC) were selected as composite curing agents, while anionic polyacrylamide (APAM) and slaked lime were used as a mixed flocculant. Laboratory experiments were conducted to examine the effects of different dosages of curing agents and flocculants on deposition dehydration, strength characteristics, water content after curing, as well as the spatial distribution of them under the combined method. Additionally, the conventional sludge solidified method treated by GGBS and OPC (denoted as the GCSM) was also investigated and compared. The results indicate that increasing the dosage of curing agent from 4.5% to 10.5% enhances the shear strength of samples treated with VP-FSCM by up to 3–5 times compared to those treated with GCSM. The optimal ratio for the composite curing agent is GGBS/OPC = 1, with optimum dosages for the composite flocculant composed of APAM at 0.125% and slaked lime at 1.5%. When admixture dosage is optimal, it allows for better utilization of the advantages from coupling effects such as flocculation dehydration, vacuum preloading, and chemical curing, thereby significantly improving mechanical properties of the sludge.

1. Introduction

Urban ports and waterways construction in economic zones and coastal cities generates a significant volume of dredged sludge [1,2,3]. The physical and mechanical properties of the dredged sludge are poor due to its high-water content and large proportion of fine-grained dredged sludge [4,5,6]. However, the scarcity of high-performance fillers in engineering highlights its potential for sustainable reuse, aligning with circular economy principles through innovative treatment technologies [7]. Therefore, it is necessary to improve its physical and mechanical properties.
Currently, as one of the most common methods to improve the performance of dredged sludge, the vacuum preloading method has received a lot of attention [8,9]. However, due to the propensity of fine-grained dredged sludge with high water content to obstruct prefabricated drain [10], traditional vacuum preloading method suffers from the slow growth of dredged sludge strength and poor drainage consolidation [11,12]. The physical and chemical composite method, which combines vacuum preloading with other methods, presents novel prospects for solidifying traditional dredged sludge [13,14,15]. The role of APAM in enhancing the vacuum preloading method for dredged sludge was investigated. Studies show that the application of APAM can reduce the consolidation time of dredging sludge by 30% to 50%, accelerate excess pore water pressure dissipation, and minimize vertical transmission vacuum loss throughout the entire treatment process [16]. Research also demonstrates that curing agents under vacuum preloading conditions boost unconfined compressive strength by up to 3.5 times [17]. Additionally, experimental studies were also conducted on soil consolidation using calcium oxide as a curing agent based on vacuum preloading [18]. It was found that calcium oxide could achieve excellent sludge solidification quickly, with the optimal addition rate of 0.4%. The impact of Vacuum–Surcharge Preloading on soil settlement and pore water pressure was investigated, and it was determined that the method can influence the depth of vacuum by at least 16 m [19]. Additionally, A coupled flow-solid model using FLAC3D software for vacuum consolidation of soft subgrade was established. Numerical analysis on pore water pressure and settlement validated that the depth of vacuum influence is at least 16 m from a numerical analysis perspective [20]. Cement, retarder, and quicklime were determined as an ideal curing agent for treating waste sludge in bored pile construction through an integrated flocculation, vacuum preloading and curing method [21]. Scholars note that appropriate admixture (curing agent and flocculant) composition and ratio can better balance the efficiency and economy due to the coupling of the flocculation of the flocculant, the chemical cementation of the curing agent and the accelerated dehydration of the vacuum preloading in the physical and chemical composite method.
In recent years, the types and dosages of curing agents and flocculants have been extensively studied [22,23]. The dosage of the curing agent was a critical factor that limited the strength of dredged sludge after curing. It was found that the fly ash-based curing agent effectively improved the early strength of dredged sludge [24]. Additionally, using GGBS and ordinary Portland cement (OPC) as mixed curing agents has been shown to enhance the strength of marine dredged sludge [25]. The evolution of pore structure with curing age in OPC mortar replaced by silica fume, GGBS and fly ash was comprehensively studied [25]. Both a single activator and composite alkali activator were utilized to activate GGBS, with the conclusion that the composite activator was more effective in achieving higher-strength solidified sludge. The dosage of flocculant also affects the water content of sludge after curing [26], with APAM identified as a suitable flocculant [27]. The optimal dosage of APAM in fine tailings sludge was measured between 0.1% and 0.3% [28,29]. However, further study is needed to determine the optimum flocculant dosage for both sludge slurry and tailings slurry.
There is a gap in research regarding the curing agent dosage and flocculants in sludge, as well as related research on physical and chemical composite methods. Therefore, based on the previous studies of the research group [30,31,32], the VP-FSCM was adopted to solidify the sludge in this paper. GGBS and OPC composite curing agents, APAM and Ca(OH)2 composite flocculant were selected [25,28,29]. The effects of different dosages of curing agents and flocculants on curing were discussed. Firstly, the optimum ratio of the curing agent was determined by the unconfined compressive strength laboratory experiment. Secondly, the reasonable range of flocculant dosage was determined by the indoor vacuum preloading model laboratory experiment, and the dosage used in the experiment was determined. Finally, five groups of the VP-FSCM samples with the best flocculant dosage and different dosages of curing agents were set up, and a control group called the GGBS and OPC solidified sludge method (the GCSM) was set up. The effects of different dosages of curing agents on the deposition dehydration characteristics and strength characteristics of the sludge treated with the VP-FSCM were studied. The treatment efficiency of the VP-FSCM and the GCSM under different dosages of curing agents was compared.

2. Laboratory Experiments
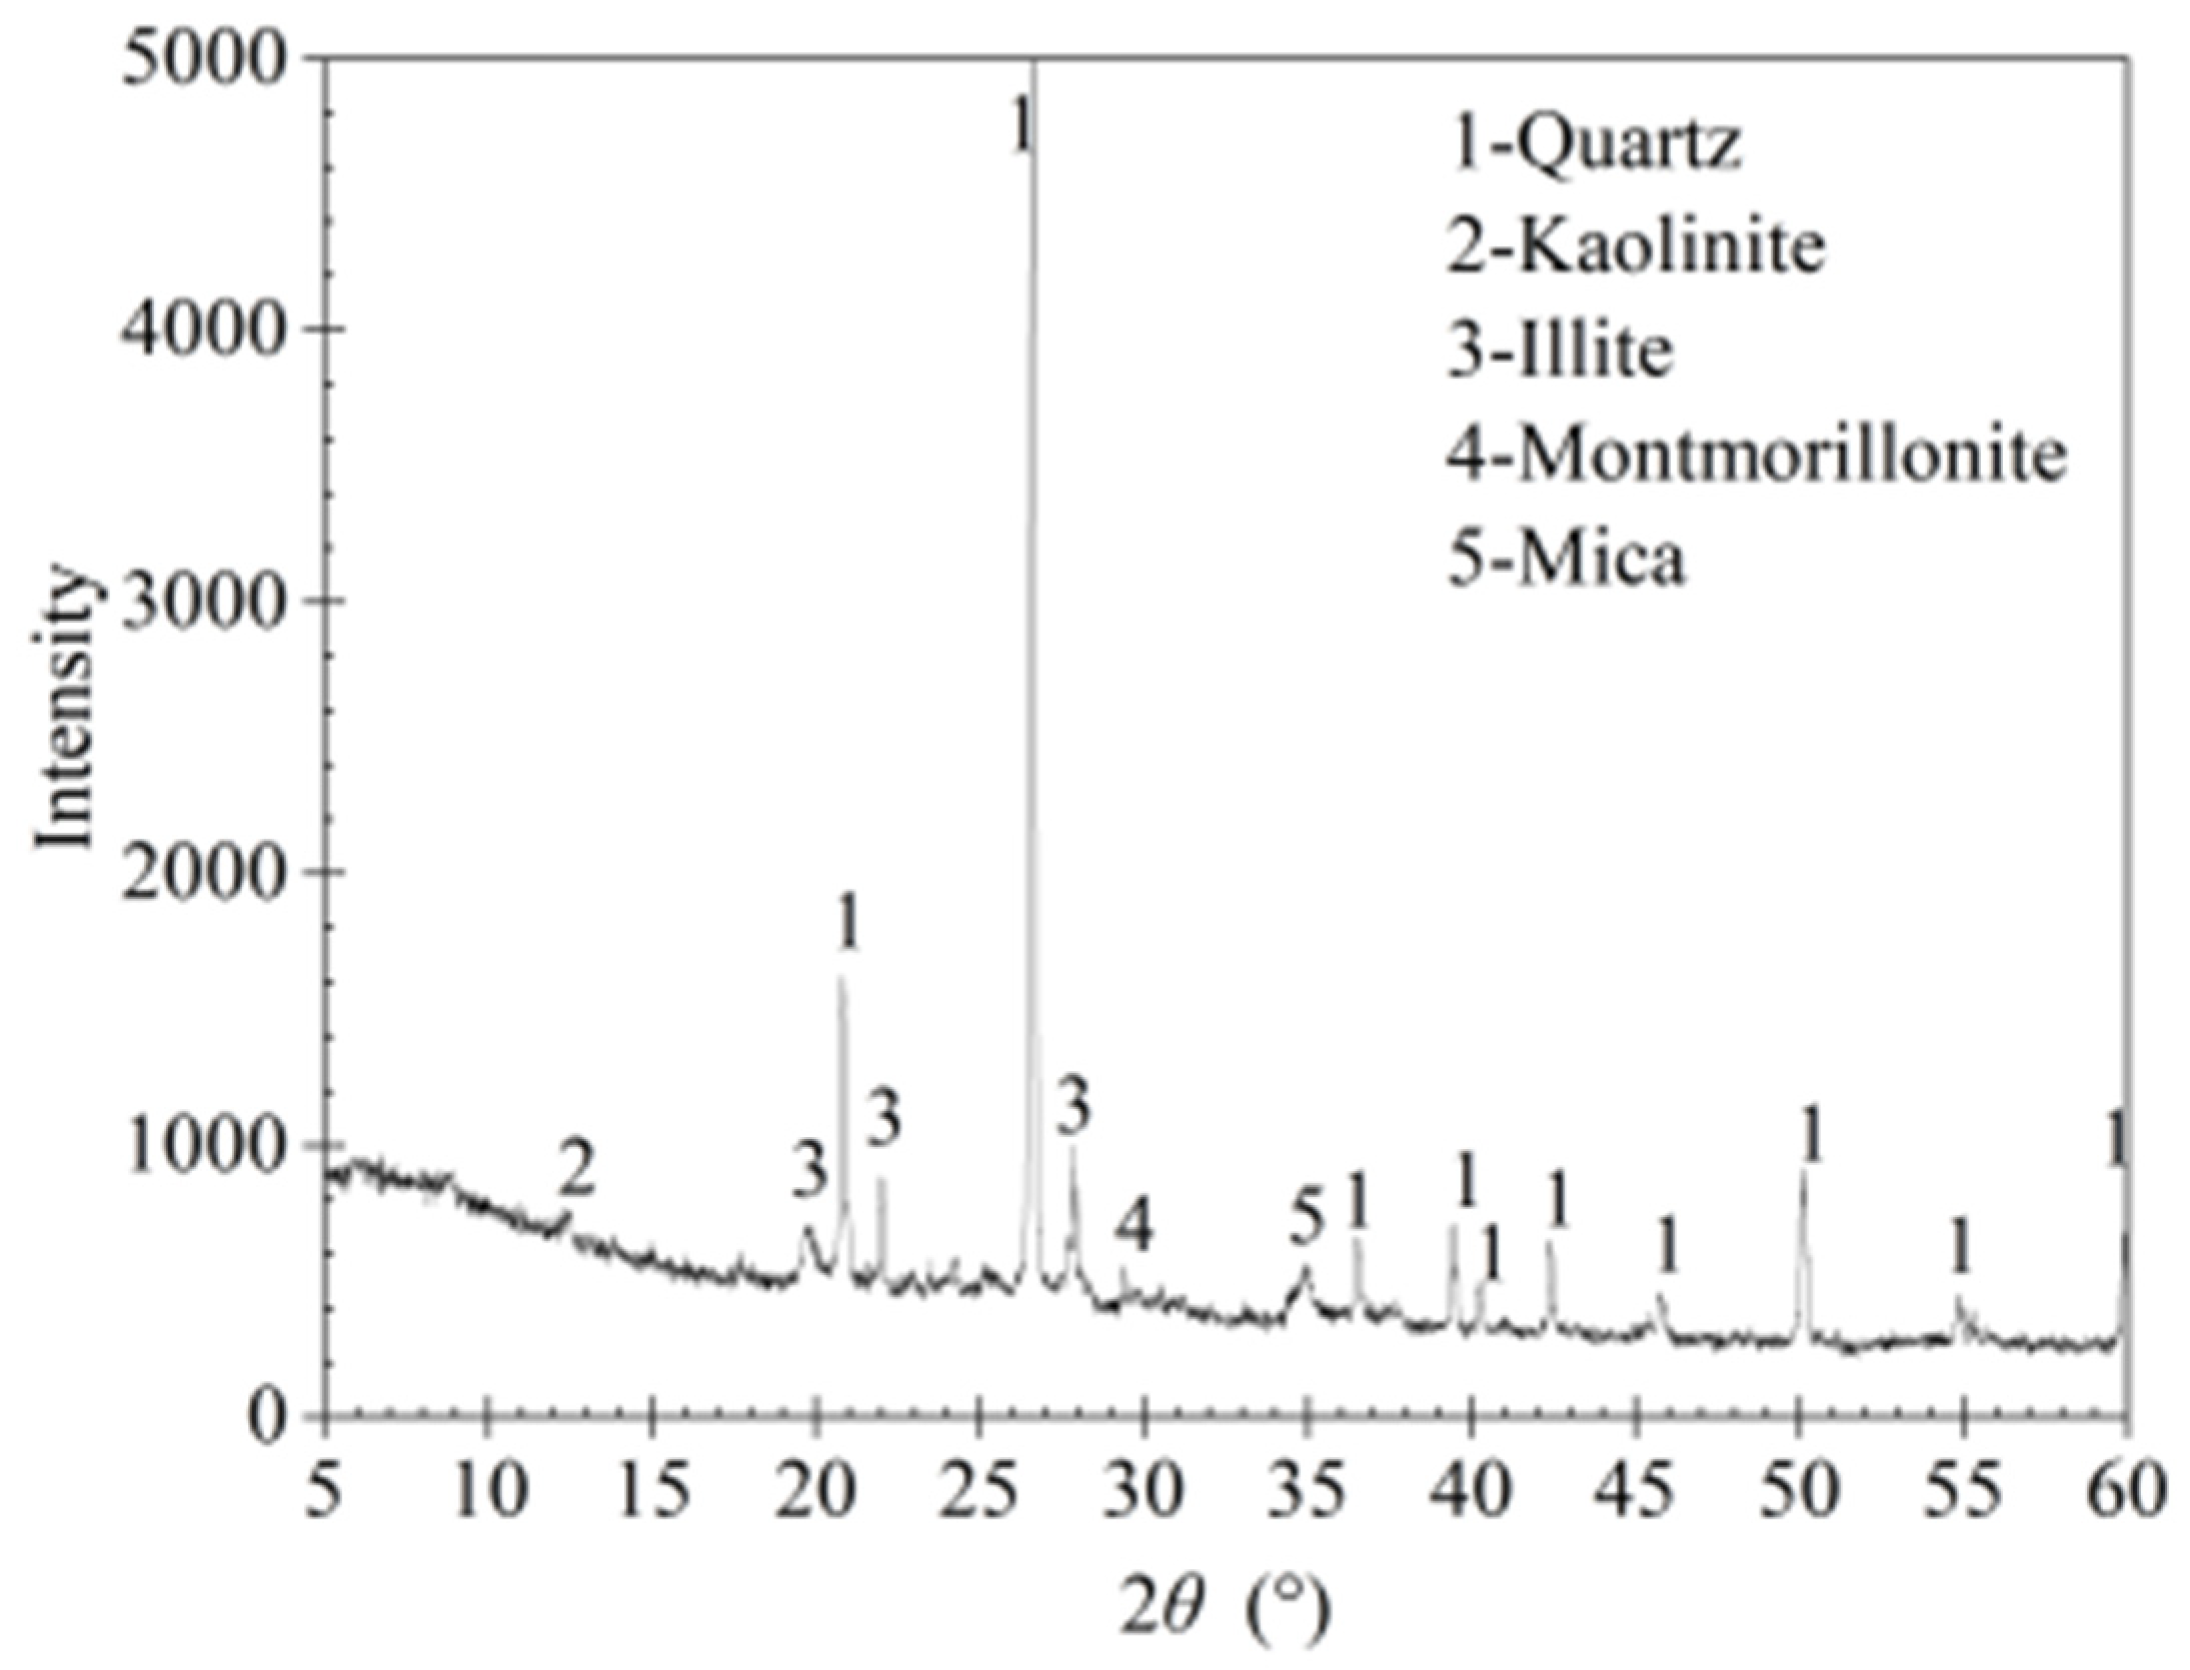
2.1. Soil Specimens

The sludge used in this study was taken from a lake in Hanyang District, Wuhan, China. The fundamental physical parameters of Hanyang lake sludge, as presented in Table 1, were determined in accordance with the Chinese Standard for Geotechnical Testing Method (GB/T 50123-2019) [33]. As shown in the table, the liquid limit wl of the sludge is 51.4% (≥50%), and the plasticity index Ip is 19.0, i.e., Ip ≤ 0.73(wl-20). According to the Chinese Standard for Engineering Classification of Soil [34], the Hanyang lake sludge is identified as high liquid limit clay. The X-ray diffraction analyze was conducted, and the results are shown in Figure 1. It indicates that the mud contains quartz, kaolinite and illite, among which quartz is the main mineral component.

2.2. Selection of the Admixture Dosage in Experimental Tests

The APAM and Ca(OH)2 are selected as composite flocculant in this study, with the dosage of Ca(OH)2 set at 1.5%, as this has been demonstrated as effective in previous studies [35,36]. The APAM can promote the aggregation of dredged sludge particles to form a large particle floc structure, thereby accelerating the self-weight deposition of the sludge [37]. When the Ca(OH)2 is further mixed with APAM, the bound water in the sludge will be converted into free water, thus promoting the coupling process of physical sedimentation/consolidation and chemical solidification. Furthermore, the water state transformation occurred inside the dredged sludge particles will effectively prevent the blockage of the drainage plate during vacuum preloading. The composite flocculant composed of APAM and Ca(OH)2 can also reduce the cost comparing to the single flocculant of APAM.
Besides, a composite curing agent composed of GGBS and OPC was used, which can achieve an excellent curing effect [25,38]. The hydration reaction of cement leads to the generation of a substantial quantity of Ca(OH)2, which provides an alkaline environment for the curing reaction. Meanwhile, the potential gel activity of GGBS can be induced by the alkaline environment [26], which produces more cementitious materials to fill the pores of the dredged sludge, thus improving the strength of the solidified dredged sludge. The chemical composition of GGBS and OPC was determined through X-ray fluorescence analysis and is presented in Table 2. SiO2 and Ca(OH)2 are the predominant oxides, constituting 82.63% and 67.52% of the total mass of GGBS and OPC, respectively.
The effect of the curing agent ratio (GGBS/OPC) on the undrained shear strength (Su) and the water content of samples after curing (wac) is shown in Figure 2. The undrained shear strength of the solidified sludge increases first and then decreases with the curing agent ratio, while the water content after curing shows an opposite tendency. This trend can be explained that when the dosage of GGBS is relatively low (0 < GGBS/OPC < 1), the dehydration degree of the samples and the strength of the solidified sludge increase with the dosage of GGBS. When GGBS/OPC > 1, the alkaline environment caused by Ca(OH)2 generated in the hydration reaction of cement is not sufficient to damage the Si-O and Al-O bonds. In this case, the hydration products such as calcium silicate hydrate and calcium aluminate hydrate cannot be formed in considerable quantities, thus leading to strength reduction [39]. The trend of the curing in Figure 2 shows that incorporating a mixed curing agent containing OPC and GGBS probability be a reasonable choice to improve the overall performance of the GGBS and OPC solidified sludge method (denoted as the GCSM). In this study, the optimal value of the curing agent ratio is about 1.0, i.e., GGBS/OPC = 1.0.

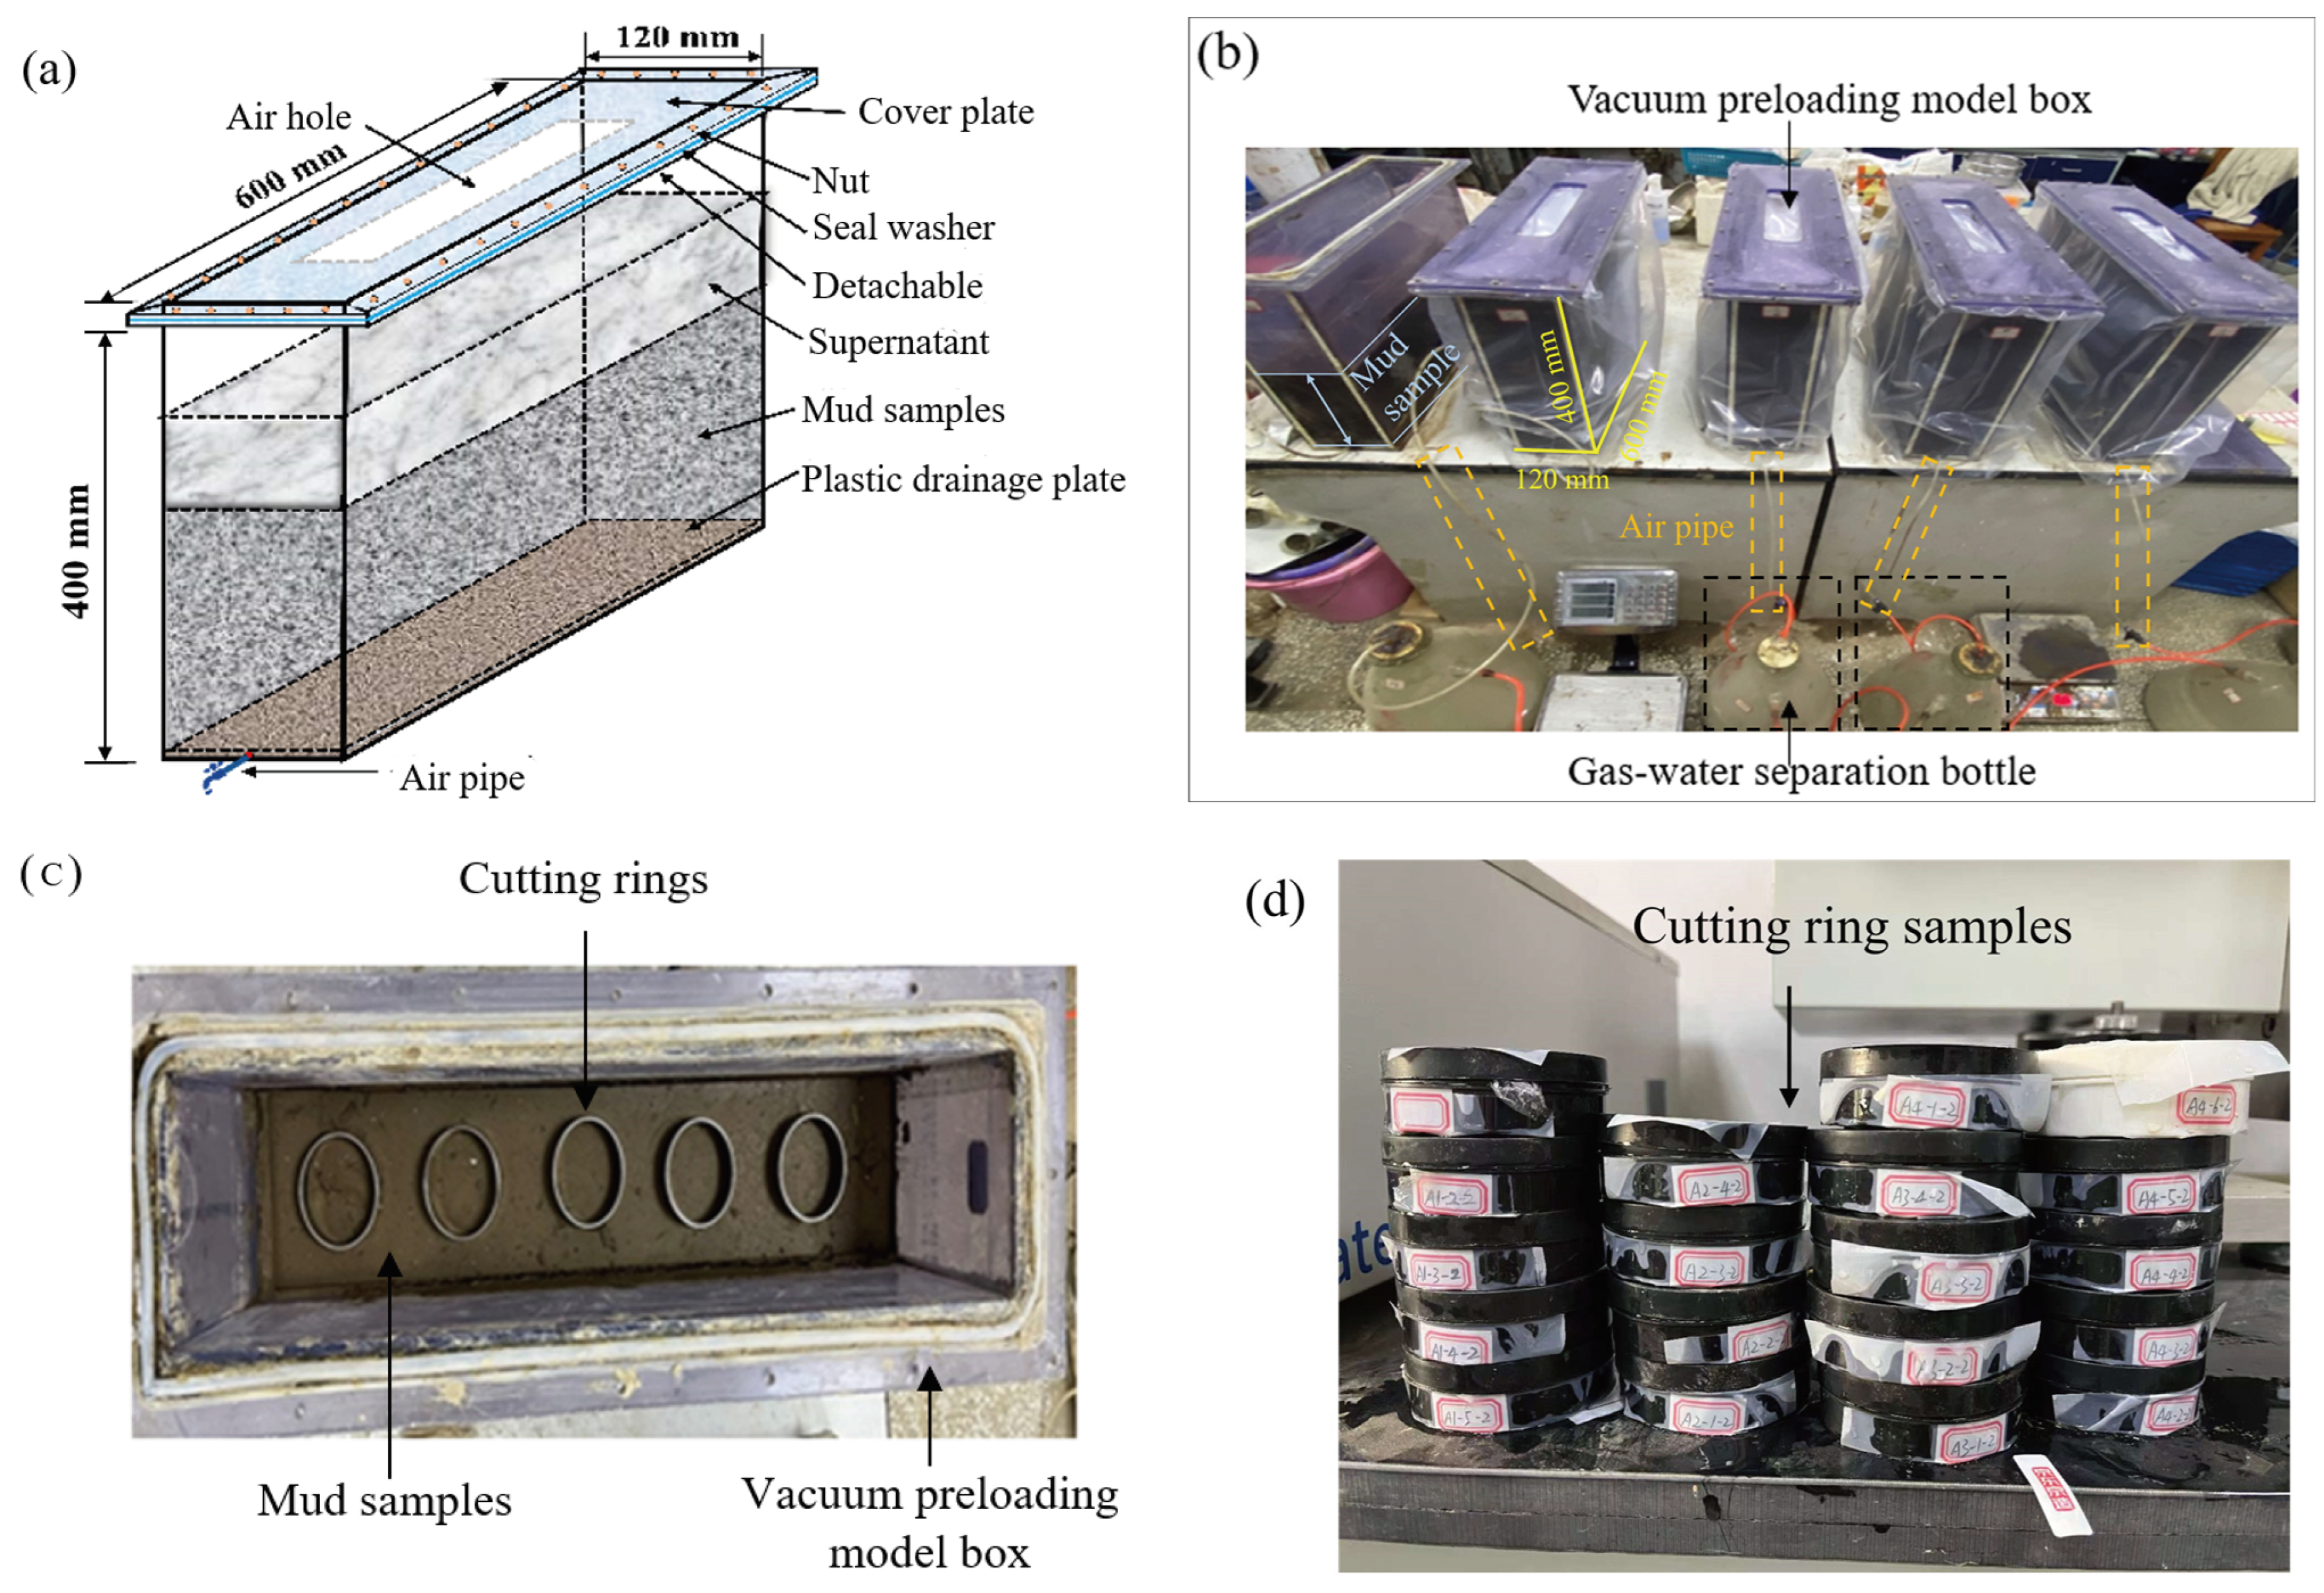
2.3. Procedures for Specimen Preparation and Testing

The experimental model box size is 600 × 120 × 400 mm, as depicted in Figure 3a. One end of the plastic drainage plate is sealed with adhesive, while the other end is tightly connected to the drainage assembly. The silicone hose connects to the filter bottle through the vacuum preloading model box, and the vacuum pump links to the exterior of the filter bottle. To conveniently monitor changes in edge settlement values during filtration, a transparent scale bar was affixed on the external surface of the model box. The experimental setup for vacuum preloading in the indoor model is illustrated in Figure 3b. The operation processes of preparing samples, curing samples, and testing the strength and water content after curing are consistent with those in literature [40]. The procedures of laboratory experiment are specified as follows:
(1) Preparation of the sludge
The impurities such as gravel, shells with large particles in the sludge were removed manually. A certain amount of wet sludge was weighed and placed in a micro-mixer (2.5 L), and additional water was added according to the specified water content. The sludge samples with a predetermined water content were prepared by mechanical uniform stirring for 3 min.
(2) Addition of additives
The composite flocculant (different dosages of APAM and 1.5% Ca(OH)2) and the composite curing agent (different dosages of OPC and GGBS) were weighed according to the mix design. Then the additives were added to the sludge slurry samples. After mechanical uniform stirring, a homogeneous sludge-additive agent mixed slurry was prepared.
(3) Molding and disposing
The uniform sludge-admixture agent sample was slowly poured into the mold, which had been coated with vaseline, by three times, each constituting 1/3 of the mold’s volume. Following each pouring, the mold was vibrated for a while to remove the tiny bubbles in the sample to avoid the influence of the internal bubble gaps on the strength of the sample. Once the molding process was finished, the draining process began with the drain switch turned on. The vacuum preloading with a vacuum pump pressure of 80 kPa was first conducted, then it was left at room temperature (25 °C) for 3 d.
(4) Sampling, curing, and testing
As shown in Figure 3c,d, the cutting ring was used to take samples. It was taken at 3 days after the treatment of vacuum preloading. Then the samples were cured with standard curing condition (20 ± 3 °C, humidity > 95%) or high temperature curing condition (40–50 °C, humidity > 95%). The undrained shear strength (su) and the water content of the samples were tested during different curing time.
Note that high temperature curing condition is used in this study to accelerate the physicochemical reactions during the treatment of the sludge, thus the period of the whole experiment time can be shortened. As stated by related literatures, the strength of cement-based materials cured at high temperature for 7 d is equivalent to the strength of ordinary standard curing for 28 d [39,41]. Therefore, the two maintenance methods have the same effect.

2.4. Testing Program

The laboratory experiments involve 14 testing cases, and they are divided into 3 groups. The details of all the cases are listed in Table 3. The vacuum pressure of case group A and B are set to 80 kPa, and the group B and C use high temperature curing.

3. Results and Discussion

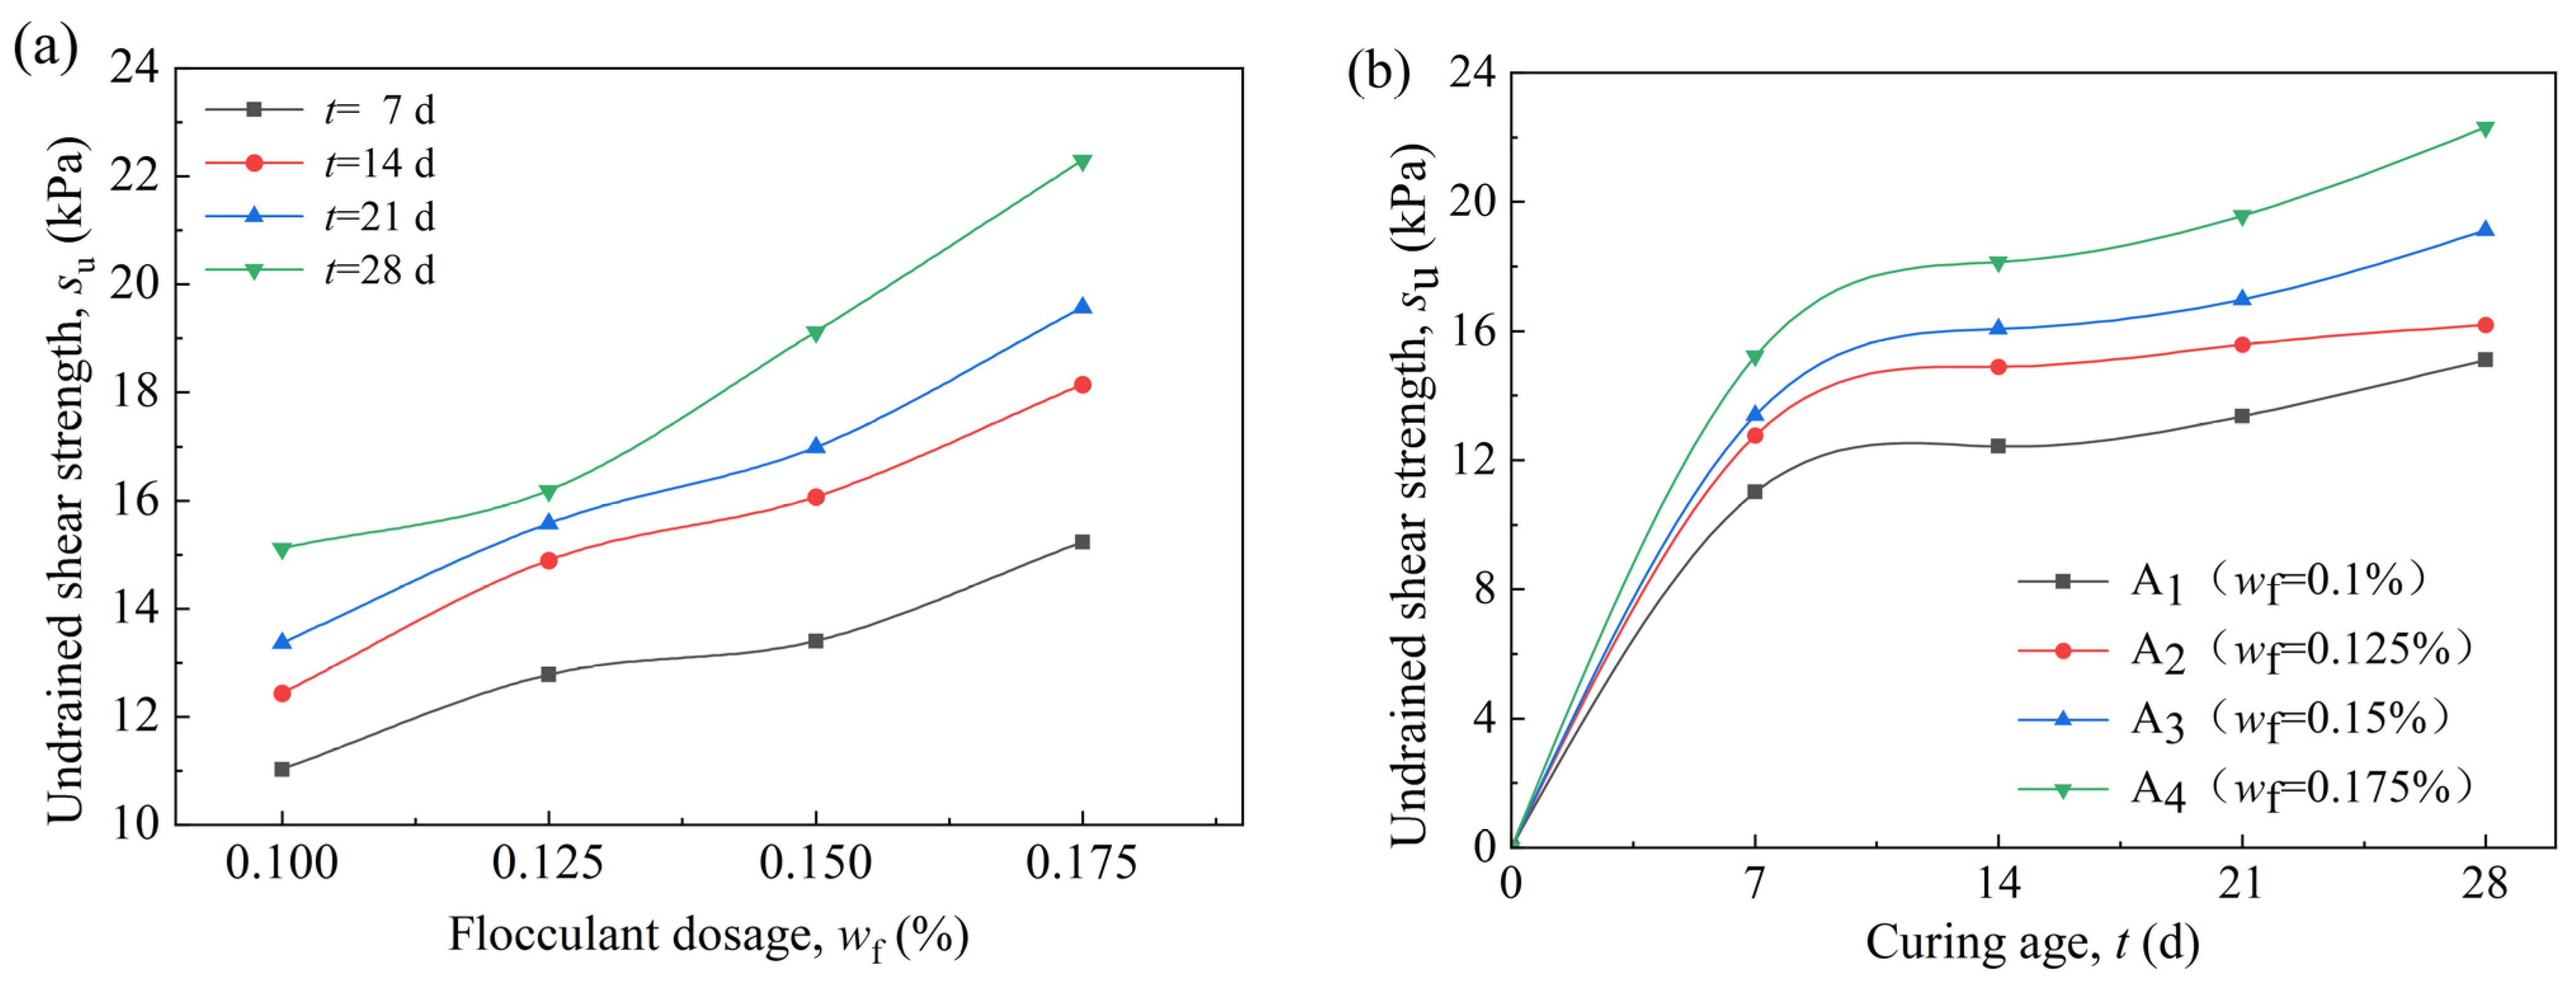
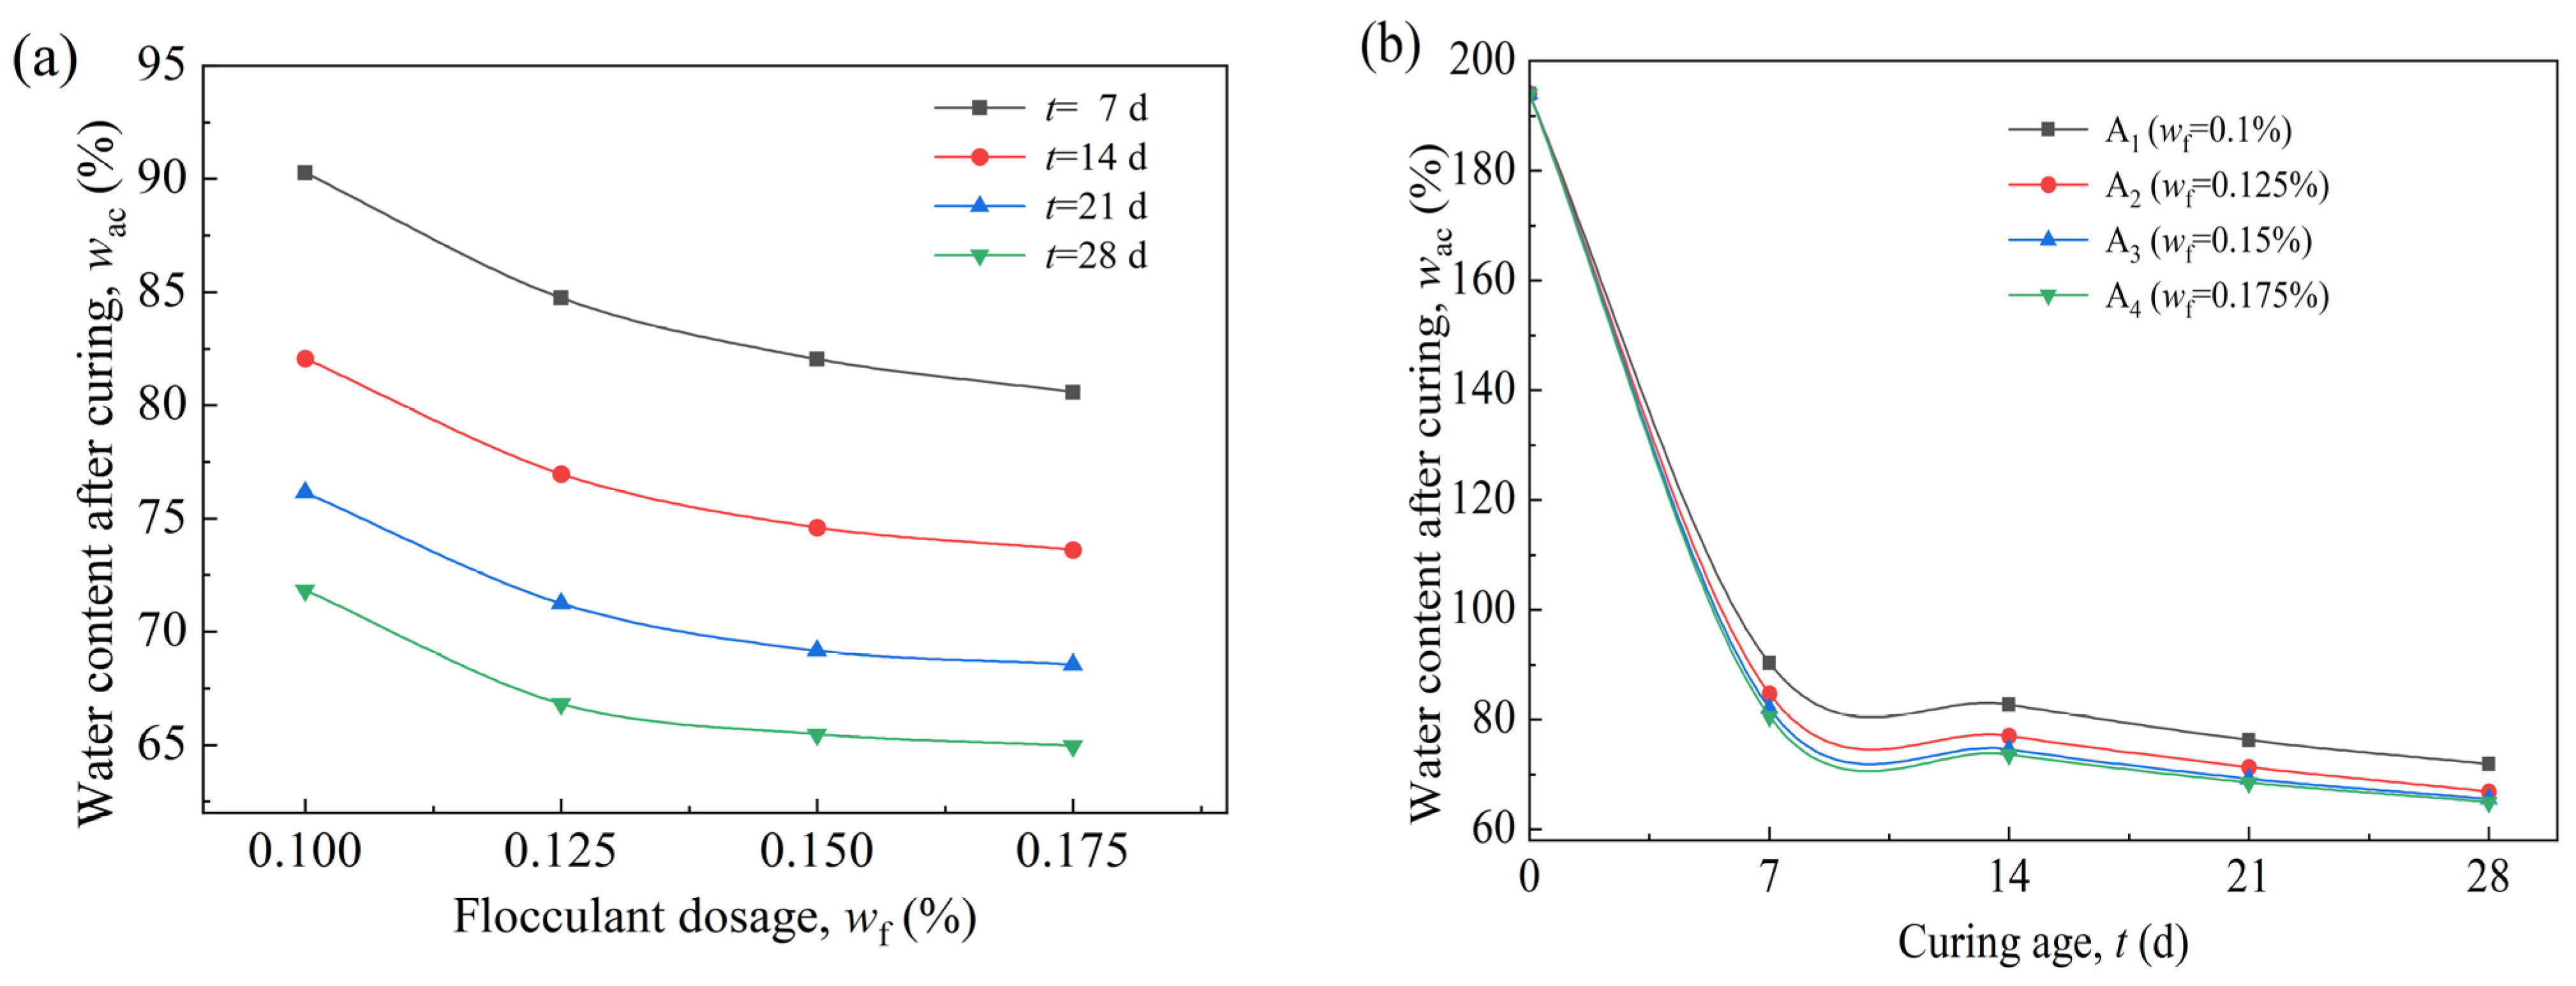
3.1. The Effect of Flocculant Dosage on the VP-FSCM

In Cases A1-A4, the dosage and the ratio of the curing agent are kept constant (the dosage of the composite curing agent C = 3%, the ratio of GGBS/OPC = 1.0), and the flocculant dosages are set to different values to investigate the optimal flocculant dosage. The results of the undrained shear strength and the water content after curing are shown in Figure 4 and Figure 5 respectively.
As shown in Figure 4a, the undrained shear strength of the samples increases with the flocculant dosage. In Figure 4b, the strength of samples increases rapidly in the early stage (0–7 d), and the growth rate slows down significantly in the middle and late stages (7–28 d). It could be speculated that the molecular chain of APAM and the skeleton of cement bind the cement hydration products to soil particles through the adsorption bridging role and form a honeycomb mesh structure. This structure can effectively improve the undrained shear strength of the solidified sludge.
The relationships between the water content and the flocculant dosage in Cases A1-A4 are shown in Figure 5. In Figure 5a, the water content of the samples decreases rapidly with the flocculant dosage after curing, and the decrease rate slows down when the flocculant dosage exceeds 0.125%. Taking the curing age of 14 d as an example, when the flocculant dosage increases from 0.1% to 0.15%, the water content curing for 14 d decreases from 82% to 75%. When the flocculant dosage rises from 0.15% to 0.175% at the same curing age, the water content decreases from 75% to 74%, which is insignificant comparing to the above one. It indicates that the flocculation effect gradually weakens when the dosage of mixed flocculant exceeds 0.15% under these experimental conditions. This phenomenon is also investigated by a similar literature, which states that the optimum dosage of the Ca(OH)2-APAM mixed flocculant ranges from 0.1% to 0.3% [29]. In this work, the range is further limited.
The variation law of the water content after curing is shown in Figure 5b. The water content of each case shows the same trend after curing: a rapid reduction at early 0–7 d and then a plateau with a small reduction at the following 7–28 d. In the early stage (0–7 d), the curing agent can consume a large amount of pore water in a short period through the hydration reaction, resulting in a rapid reduction in the water content of the samples. The hydration reaction rate decreases sharply in the later stage (7–28 d), and the water consumption effect also decreases. Therefore, the water content of the sample decreases slowly in the later stage. Meanwhile, the water content development curves of the case A3 (wf = 0.15%) and A4 (wf = 0.175%) is almost coincident (Figure 5b), which means that wf rarely influence the water content after curing when wf exceeds 0.15%. It can be investigated that larger flocculant dosage leads to lower water content after curing, which is due to the increasing drainage water under vacuum preloading. In summary, the reasonable range of flocculant dosage is 0.125–0.15%.
The optimal dosage of flocculant for improving undrained shear strength and reducing water content is determined to be between 0.125% and 0.15% by combining the data from Figure 4 and Figure 5.

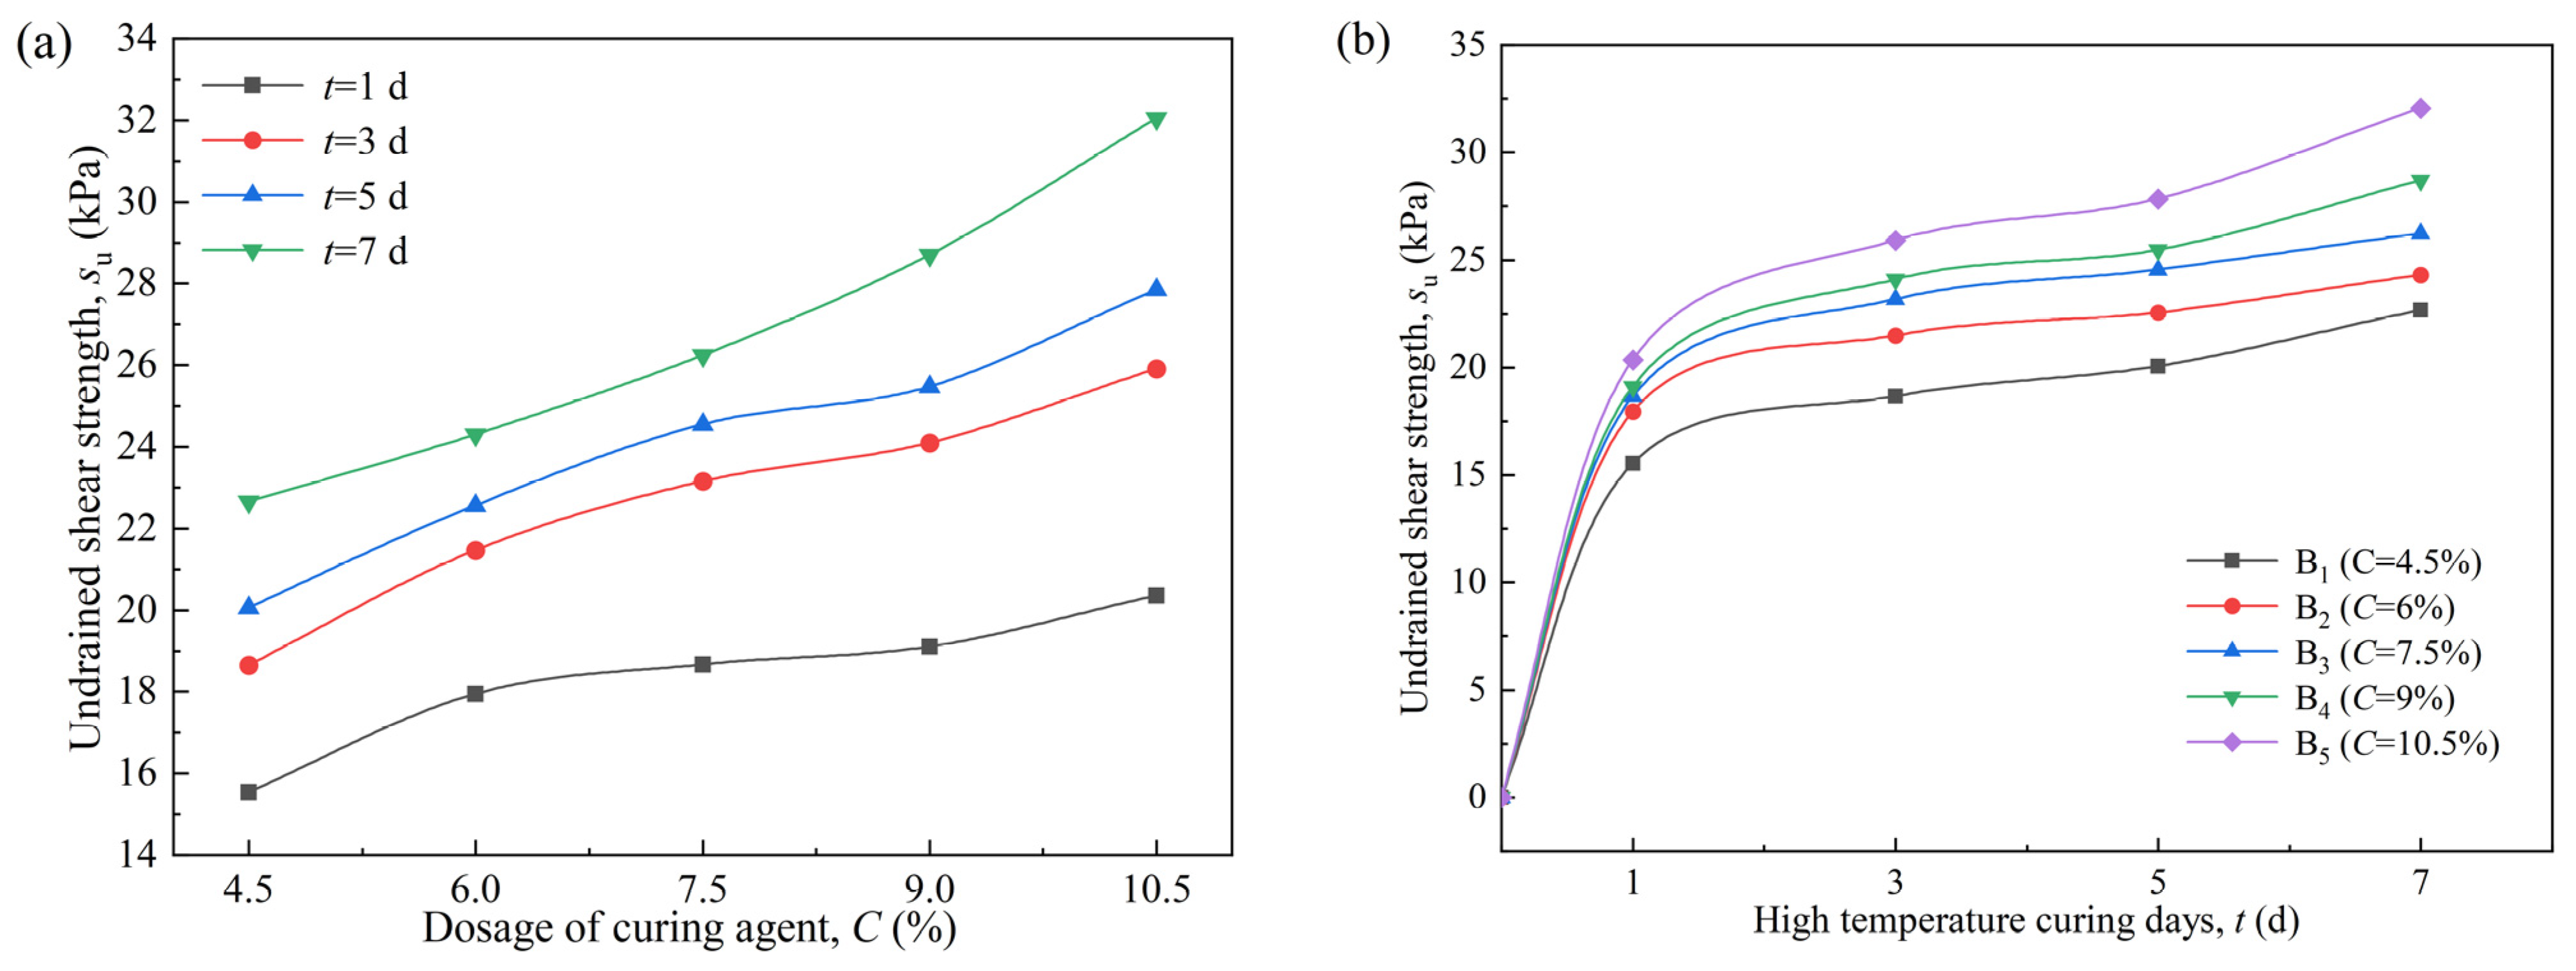
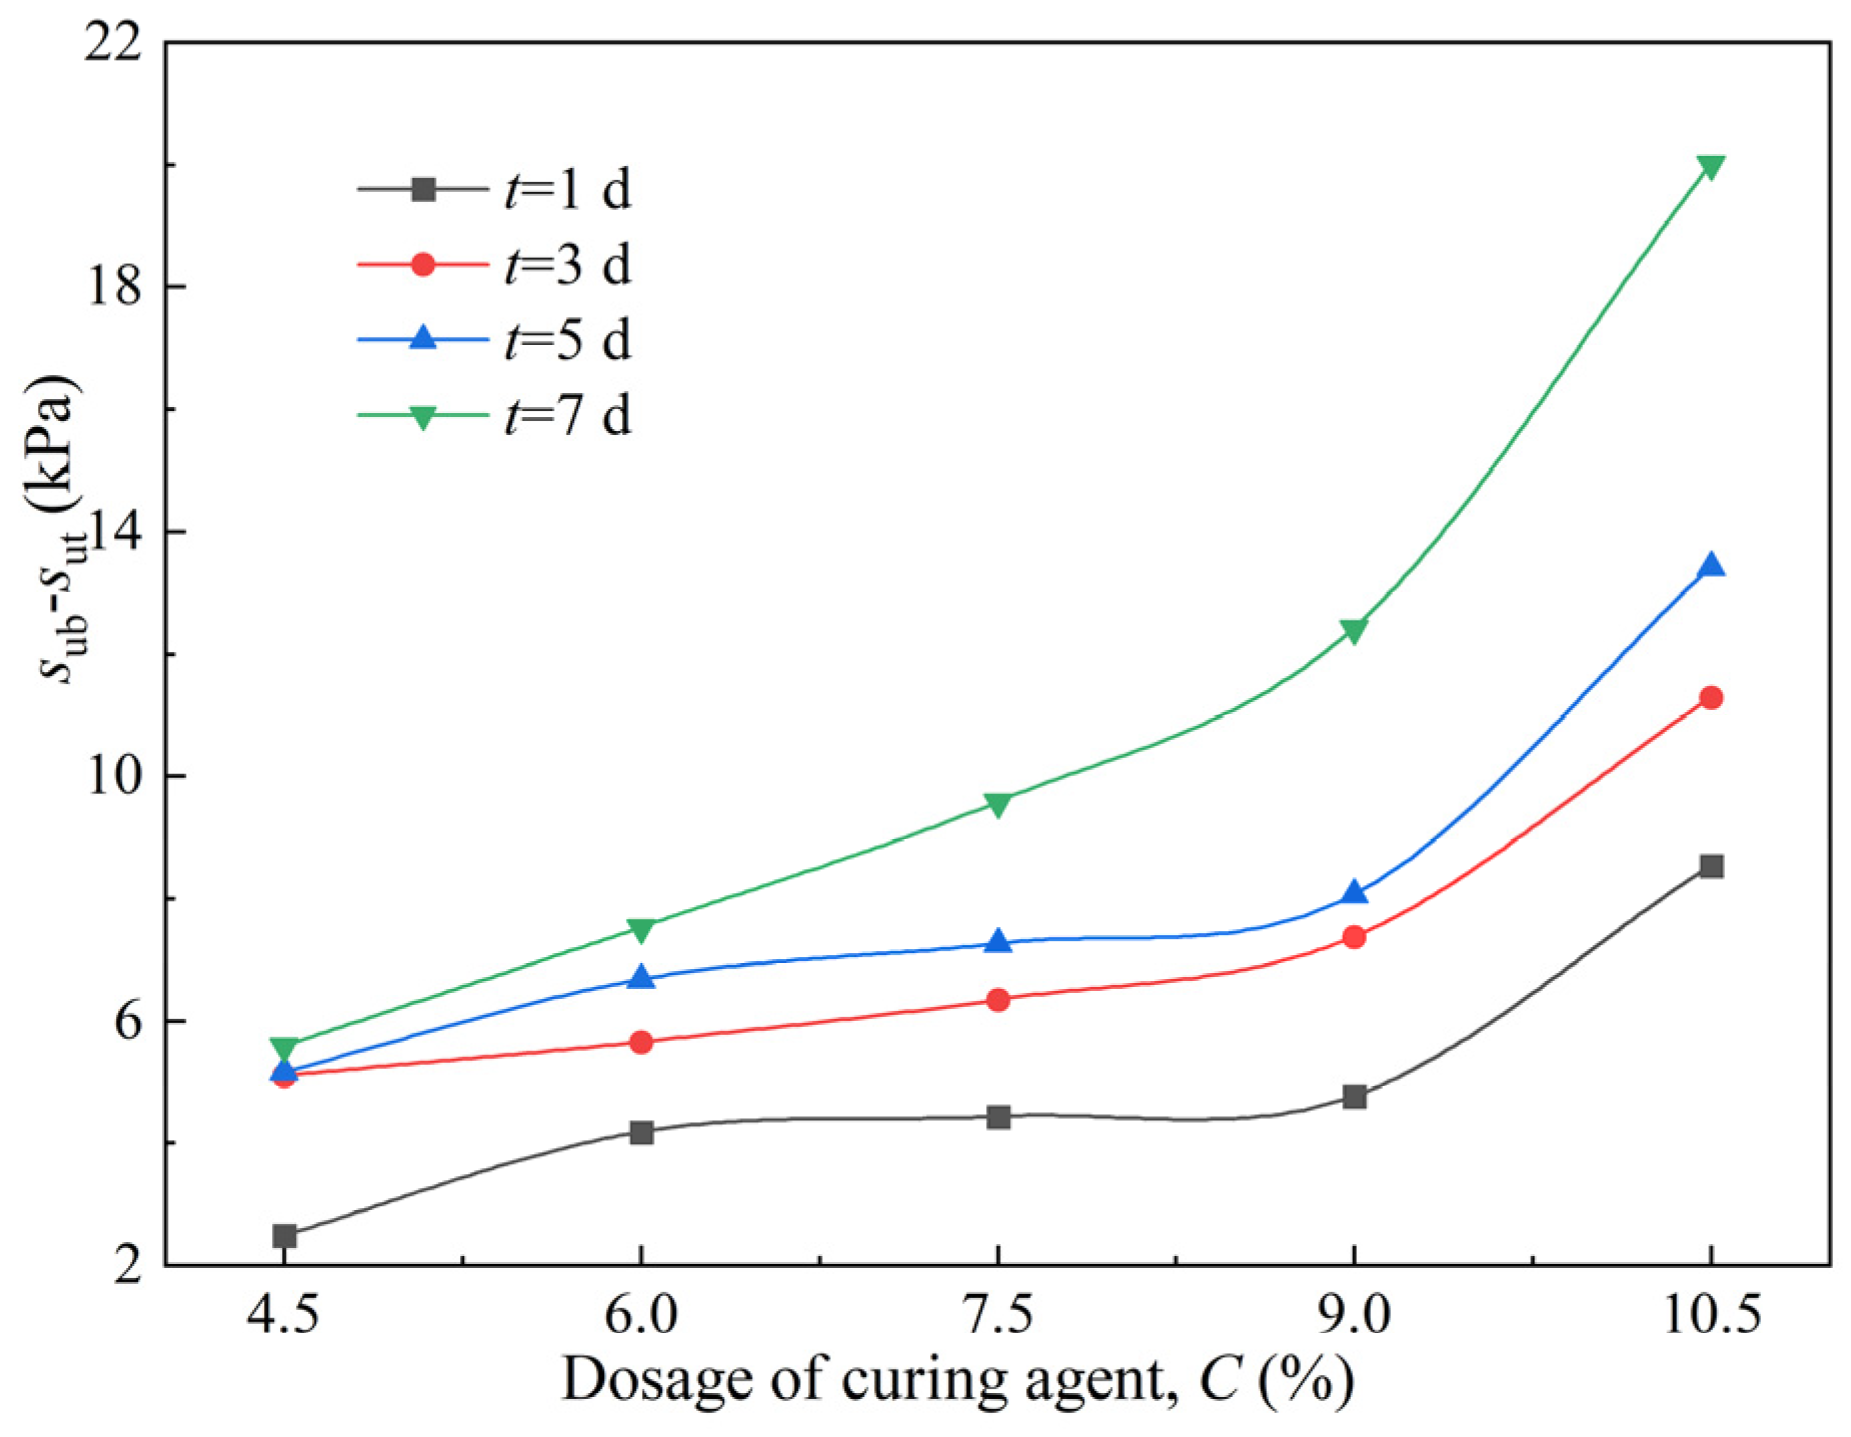
3.2. The Effect of the Curing Agent Dosages on the VP-FSCM

In Cases B1–B5, the values such as GGBS/OPC, wc and wf are kept equal to the optimal ones which are investigated in Case groups A and C, and the effects of the composite curing agent dosage (C) on the treatment method VP-FSCM are studied.
The deposition dehydration characteristics of the samples under different curing agent dosage conditions are shown in Figure 6. The variation curve of the edge deposition of the samples with different curing agents after the VP-FSCM treatment is illustrated in Figure 6a. The settling volume and rate of each condition do not differ much in the early stage (0–300 min), while some variability appears in the middle and late stages (300–1280 min). This phenomenon can be explained by the different reactions of the dredged sludge in different curing periods. The sludge sample has high water content in the early stage and still contains many unreacted curing agents. Currently, deposition dehydration is the main effect, and the sedimentation rate of each sludge sample is the same. The curing agent dosage exerts a central role in the middle and late stages. Different dosages of curing agents lead to various sludge sedimentation rates and drainage volumes. The variation curves of the drainage volume of the samples treated with the VP-FSCM under different curing agent dosage conditions are shown in Figure 6b. The drainage volume and rate of each condition are almost the same.
The variation of the samples at different curing agent dosages at each curing time is displayed in Figure 7. The undrained shear strength of the samples at different curing agent dosages at each age after the VP-FSCM treatment is shown in Figure 7a. The undrained shear strength gradually increases with the increasing curing agent dosage. It should be noticed that the strength for longer curing age seems to increase with an increasing speed with the agent dosage, while the trend turning from slow to fast when the age is short. To characterize the effect of the curing agent dosage on the strength of the VP-FSCM samples more clearly, Figure 7b shows the undrained shear strength curves of samples at different curing agent dosages after 1 d, 3 d, 5 d, and 7 d of high-temperature curing. The undrained shear strength of the samples in each condition increases with the curing age. The undrained shear strength increases significantly from 0 d to 1 d, while it shows a slowly rising trend after 1 d. Higher curing agent dosages lead to higher corresponding final undrained shear strength. When the dosage of the curing agent is 4.5%, the undrained shear strength of the sample cured at 50 °C for 7 d is 22.66 kPa [42]. When the dosage is increased to 10.5%, the sample strength increases to 32.04 kPa, an increase of 41.4%. It is speculated that the hydration reaction of OPC produces Ca(OH)2 to make the overall environment alkaline, which improves the activity and hydration reaction rate of GGBS. The hydration products produced by the GGBS hydration reaction can improve the strength of the solidified sludge. Therefore, the overall strength of GGBS solidified sludge is high after OPC activates the alkali. However, it is not easy to further enhance the curing effect by increasing the curing agent dosage in engineering. The curing agent dosage should be determined according to the actual situation.
The solidified sludge in the model box was sampled with cutting rings to further explore the spatial distribution of strength. Due to the different heights of the solidified sludge in each model box after vacuum preloading, the number of sampling layers in each model box differs. The number of sampling layers in the case group B1–B5 was 4, 4, 5, 5, and 5. Samples were taken from each layer, and the removed cutting ring samples were placed in the water bath of a cutting ring box with a constant temperature of 50 °C [42,43]. Then, samples were cured to the specified age for fast shear tests.
The undrained shear strength curves of the top and bottom layers of the samples at different curing agent dosages after high-temperature curing for 1 d, 3 d, 5 d, and 7 d are shown in Figure 8. The strength of the top and bottom layers shows an upward trend with the increasing curing agent dosage. The increasing rates of the top and bottom layers are similar when the curing agent dosage is low (4.5–6%). When the curing agent dosage is high (9–10.5%), the strength of the top layer increases slowly, while that of the bottom layer increases significantly. This result shows that the sensitivity of strength of the top and bottom layers to the curing agent dosage differs. In addition, it can be found that the strong improvement effect of the VP-FSCM is greatly affected by curing agent.
The difference between the undrained shear strength of the bottom and top layers and the curing agent dosage can be seen more intuitively in Figure 9. When the curing agent dosage is 4.5–6%, the difference in undrained shear strength between the bottom and top layers of the sample with the increasing curing age is small. When the curing agent dosage is 9–10.5%, the undrained shear strength of the bottom layer of the sample is much higher than that of the top layer with the increasing curing age. This is because the moisture content near the bottom drainage plate is lower than that at the top layer, resulting in a significant difference in the water-to-cement ratio between the two positions. When the binder content at the bottom layer exceeds 9%, the lower water-to-cement ratio begins to exert a notable impact on strength development, while the higher water-to-cement ratio at the top layer still contributes relatively little to strength enhancement.
Based on the effects of binder content and curing duration on shear strength presented in Figure 8 and Figure 9, and considering economic efficiency, a curing agent dosage of 6% and a curing duration of 3 days are identified as the optimal technical parameters for the sustainable treatment of VP-FSCM. Any further increase in curing agent dosage or curing duration results in only marginal strength gains or incurs higher costs.

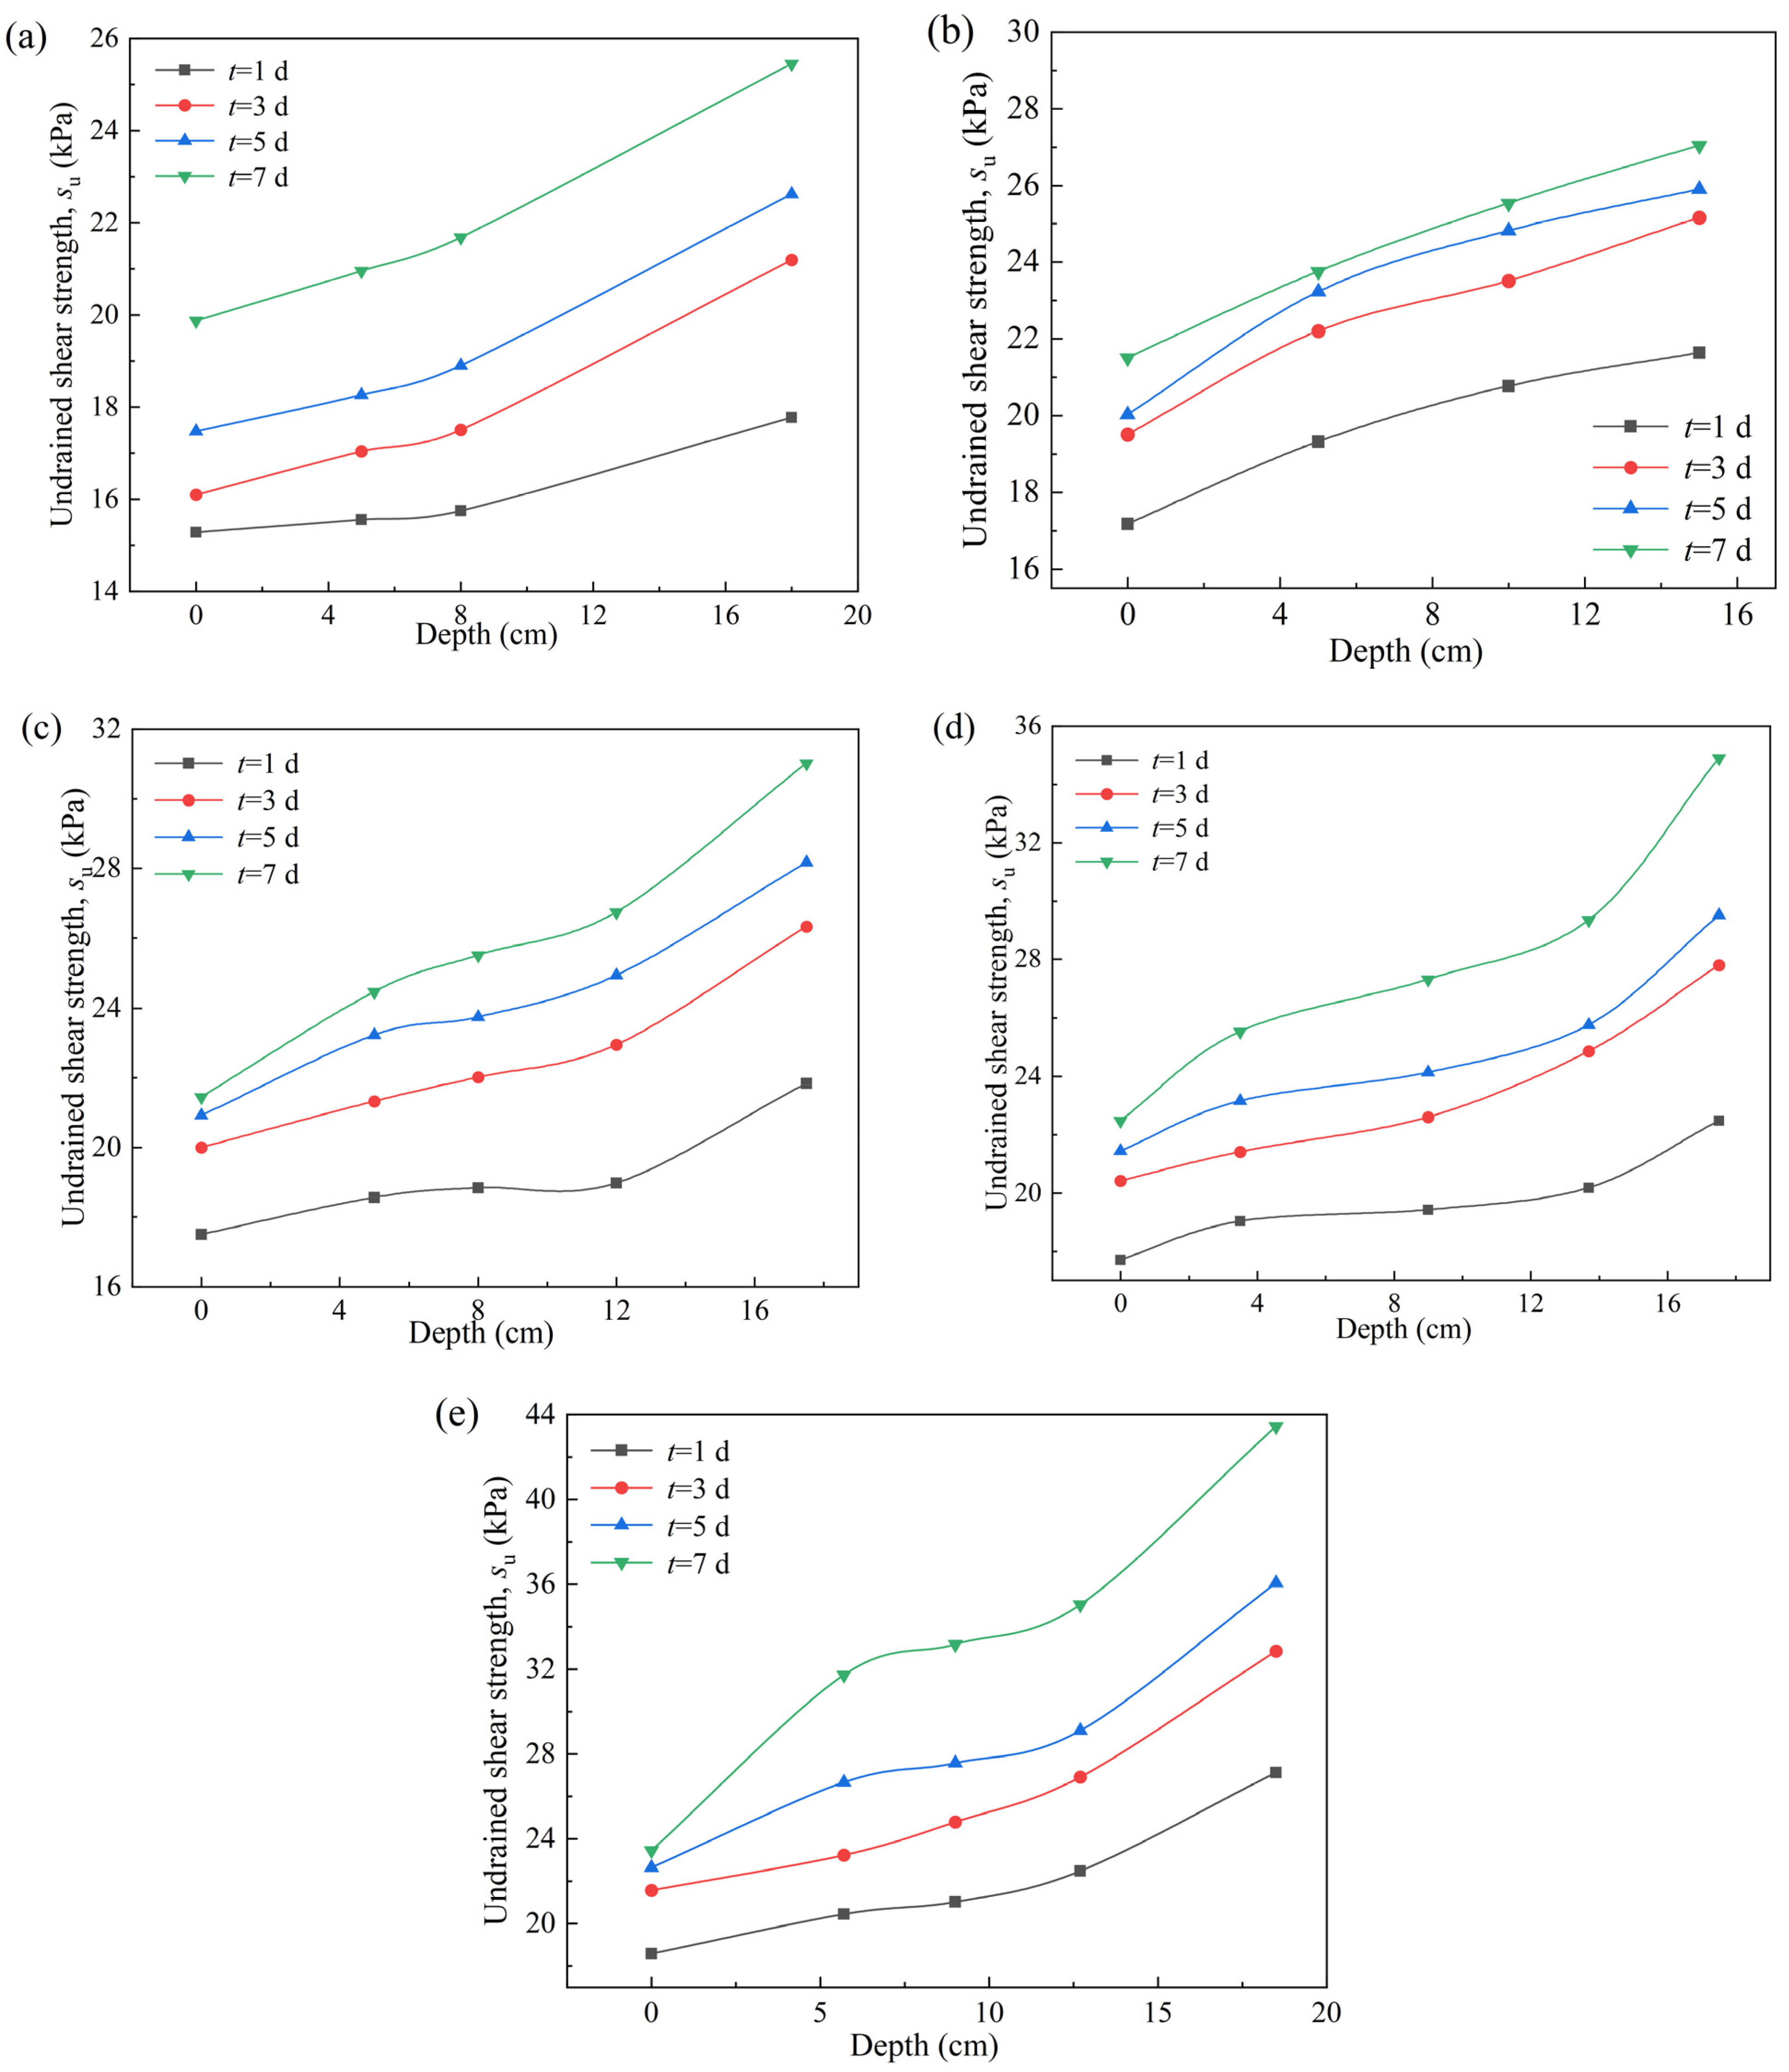
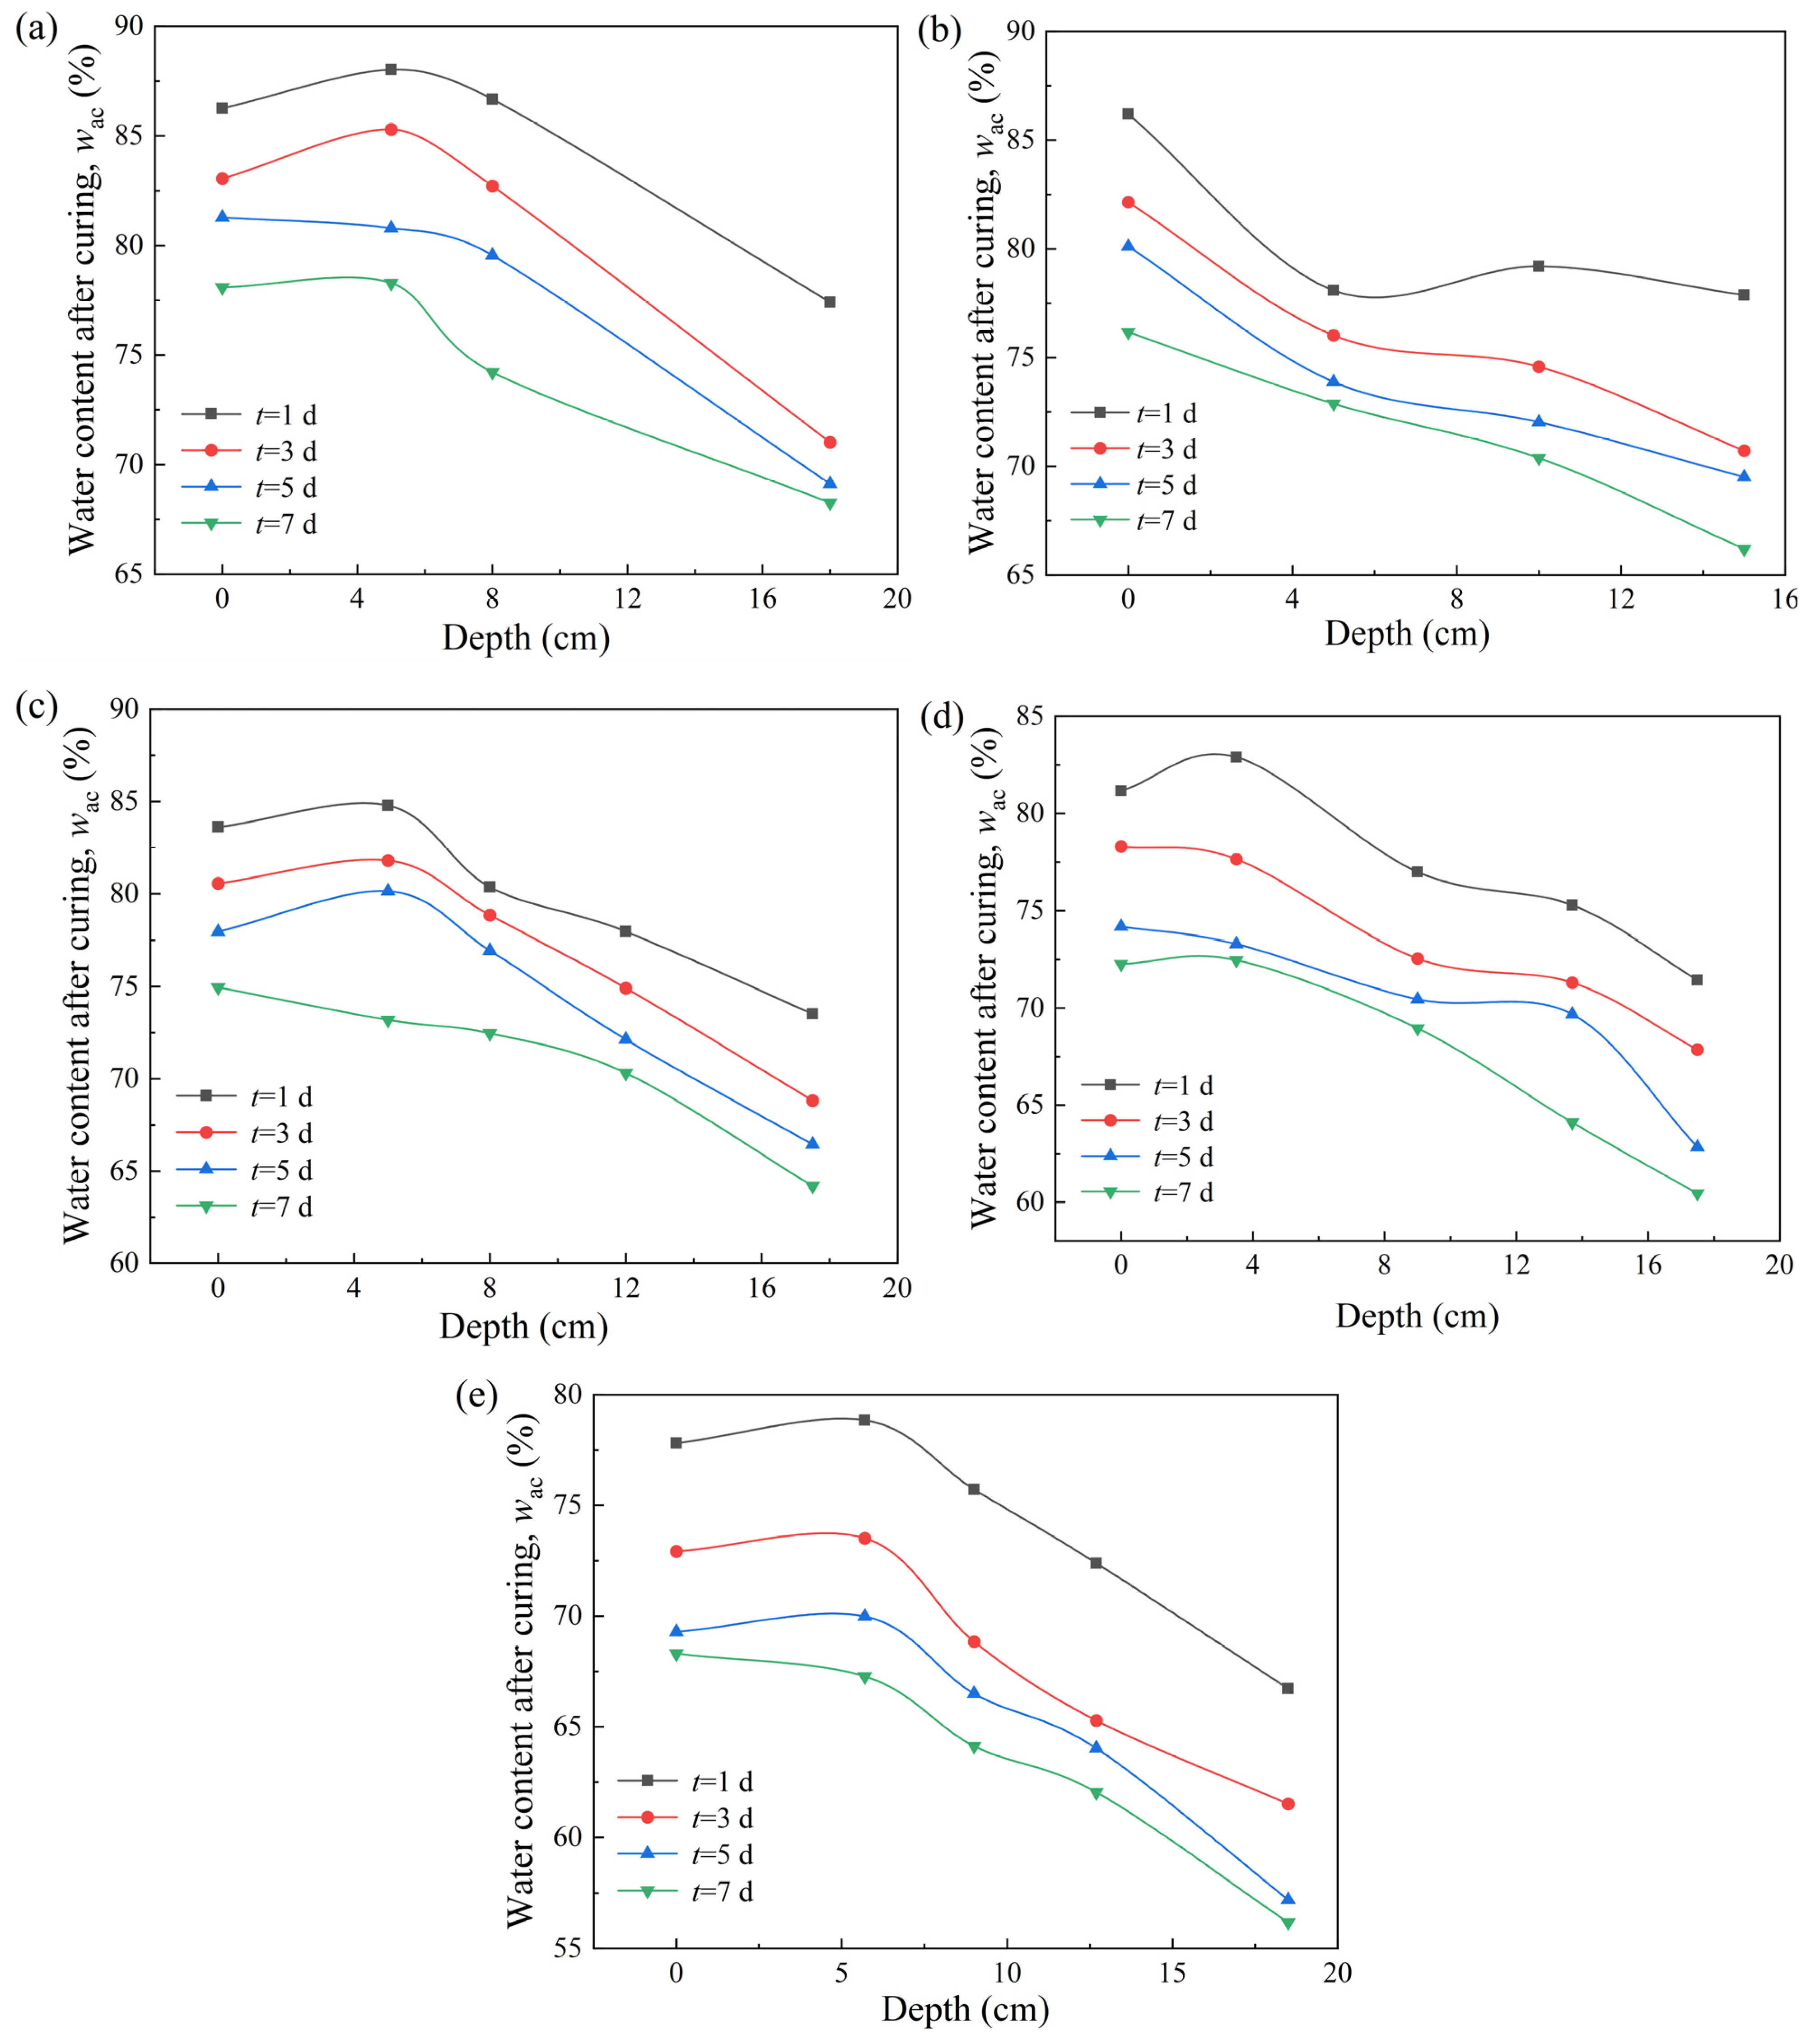
3.3. Characteristics of Strength Spatial Distribution in VP-FSCM

The curves of undrained shear strength with depth at different ages after the VP-FSCM treatment at different curing agent dosages are shown in Figure 10. When the sample is in a relatively shallow top layer area (0–12 cm), the modes of strength development are similar for each condition, all of them grow slowly. In contrast, when the sample is in a relatively deep bottom layer area (12–20 cm), the strength growth rate of each condition is significantly improved. This phenomenon indicates that the closer to the drainage plate, the higher the vacuum degree of the dredged sludge sample and the more sufficient the curing agent dosage in the reaction. The undrained shear strength of dredged sludge with the same equivalent initial water content treated by the VP-FSCM tends to increase significantly with the increase in curing agent dosage. Besides, difference of strength increases with curing time after three days.
The relationship between water content after curing, curing agent dosage and high-temperature curing age is shown in Figure 11. The water content of dredged sludge after curing at each age by the VP-FSCM treatment at different curing agent dosages is displayed in Figure 11a. The water content after curing of the VP-FSCM-treated samples at each age tends to decrease with the increasing curing agent dosage, and the decrease in water content after curing increases sequentially. Taking the cured sludge sample with a curing age of 5 d as an example, its water content after curing is reduced by 2.62% when the curing agent dosage is increased from 6.0% to 7.5%, and it is reduced by 5.26% when the curing agent dosage is increased from 9% to 10.5%. This result indicates that increasing the curing agent dosage can effectively reduce the water content of the samples after curing. In addition, the water content after curing of the cured samples is also closely related to the curing age. The water content after curing change curves of models with different curing agent dosages after 1 d, 3 d, 5 d, and 7 d of high-temperature curing are shown in Figure 11b. This figure depicts the effect of the curing agent dosage on the water content of the VP-FSCM samples after curing and the water content of samples at different curing agent dosages decreases after curing with the curing age. The early stage (0–1 d) shows a sharp decline. In the late phase (3–7 d), the water content after curing decreases slightly due to the hydration reaction and finally concentrates at 60–80%. A higher curing agent dosage leads to lower final water content after curing.
The water content after curing of the top and bottom layers of the samples after high-temperature curing for 1 d, 3 d, 5 d, and 7 d at different curing agent dosages is depicted in Figure 12. The water content after curing of the top and bottom layers decreases with increasing curing agent dosage and the decrease in water content after curing is higher in the bottom layer than that in the top layer. During the curing time from 1 d to 7 d, the average water content of the top and bottom layers is reduced by 12.3% and 16.5% as the curing agent dosage changes from 4.5% to 10.5%. This result indicates that the curing agent dosage affects the water content after curing of the top and bottom layers of the cured dredged sludge treated with the VP-FSCM. Moreover, the water content after curing of the bottom layer after curing is more affected when other conditions are the same, which is consistent with the results for undrained shear strength.
The variation curves of water content after curing with depth for samples treated with the VP-FSCM are depicted in Figure 13. The water content after curing of the cured dredged sludge samples at each depth gradually decreases with the increase in the curing agent dosage. When the sample is in the relatively shallow top layer area (0–4 cm), the water content after curing is unchanged significantly or even slightly increases regardless of the curing agent dosage. The possible reason for this phenomenon is that the change in the vacuum degree of the cured sludge tends to decay radially with the drainage board as the center. The vacuum degree of the sample in the shallow top layer area is the lowest, and the effect of vacuum dewatering is significantly weakened.
The data presented in Figure 6, Figure 7, Figure 8, Figure 9, Figure 10, Figure 11, Figure 12 and Figure 13 demonstrates that the increase of curing agent had minimal impact on the deposition, displacement, and drainage rate of the samples after VP-FSCM treatment. However, it significantly increased undrained shear strength in the early stage. The water content decreased with curing age and was higher in the bottom layer under VP-FSCM treatment.

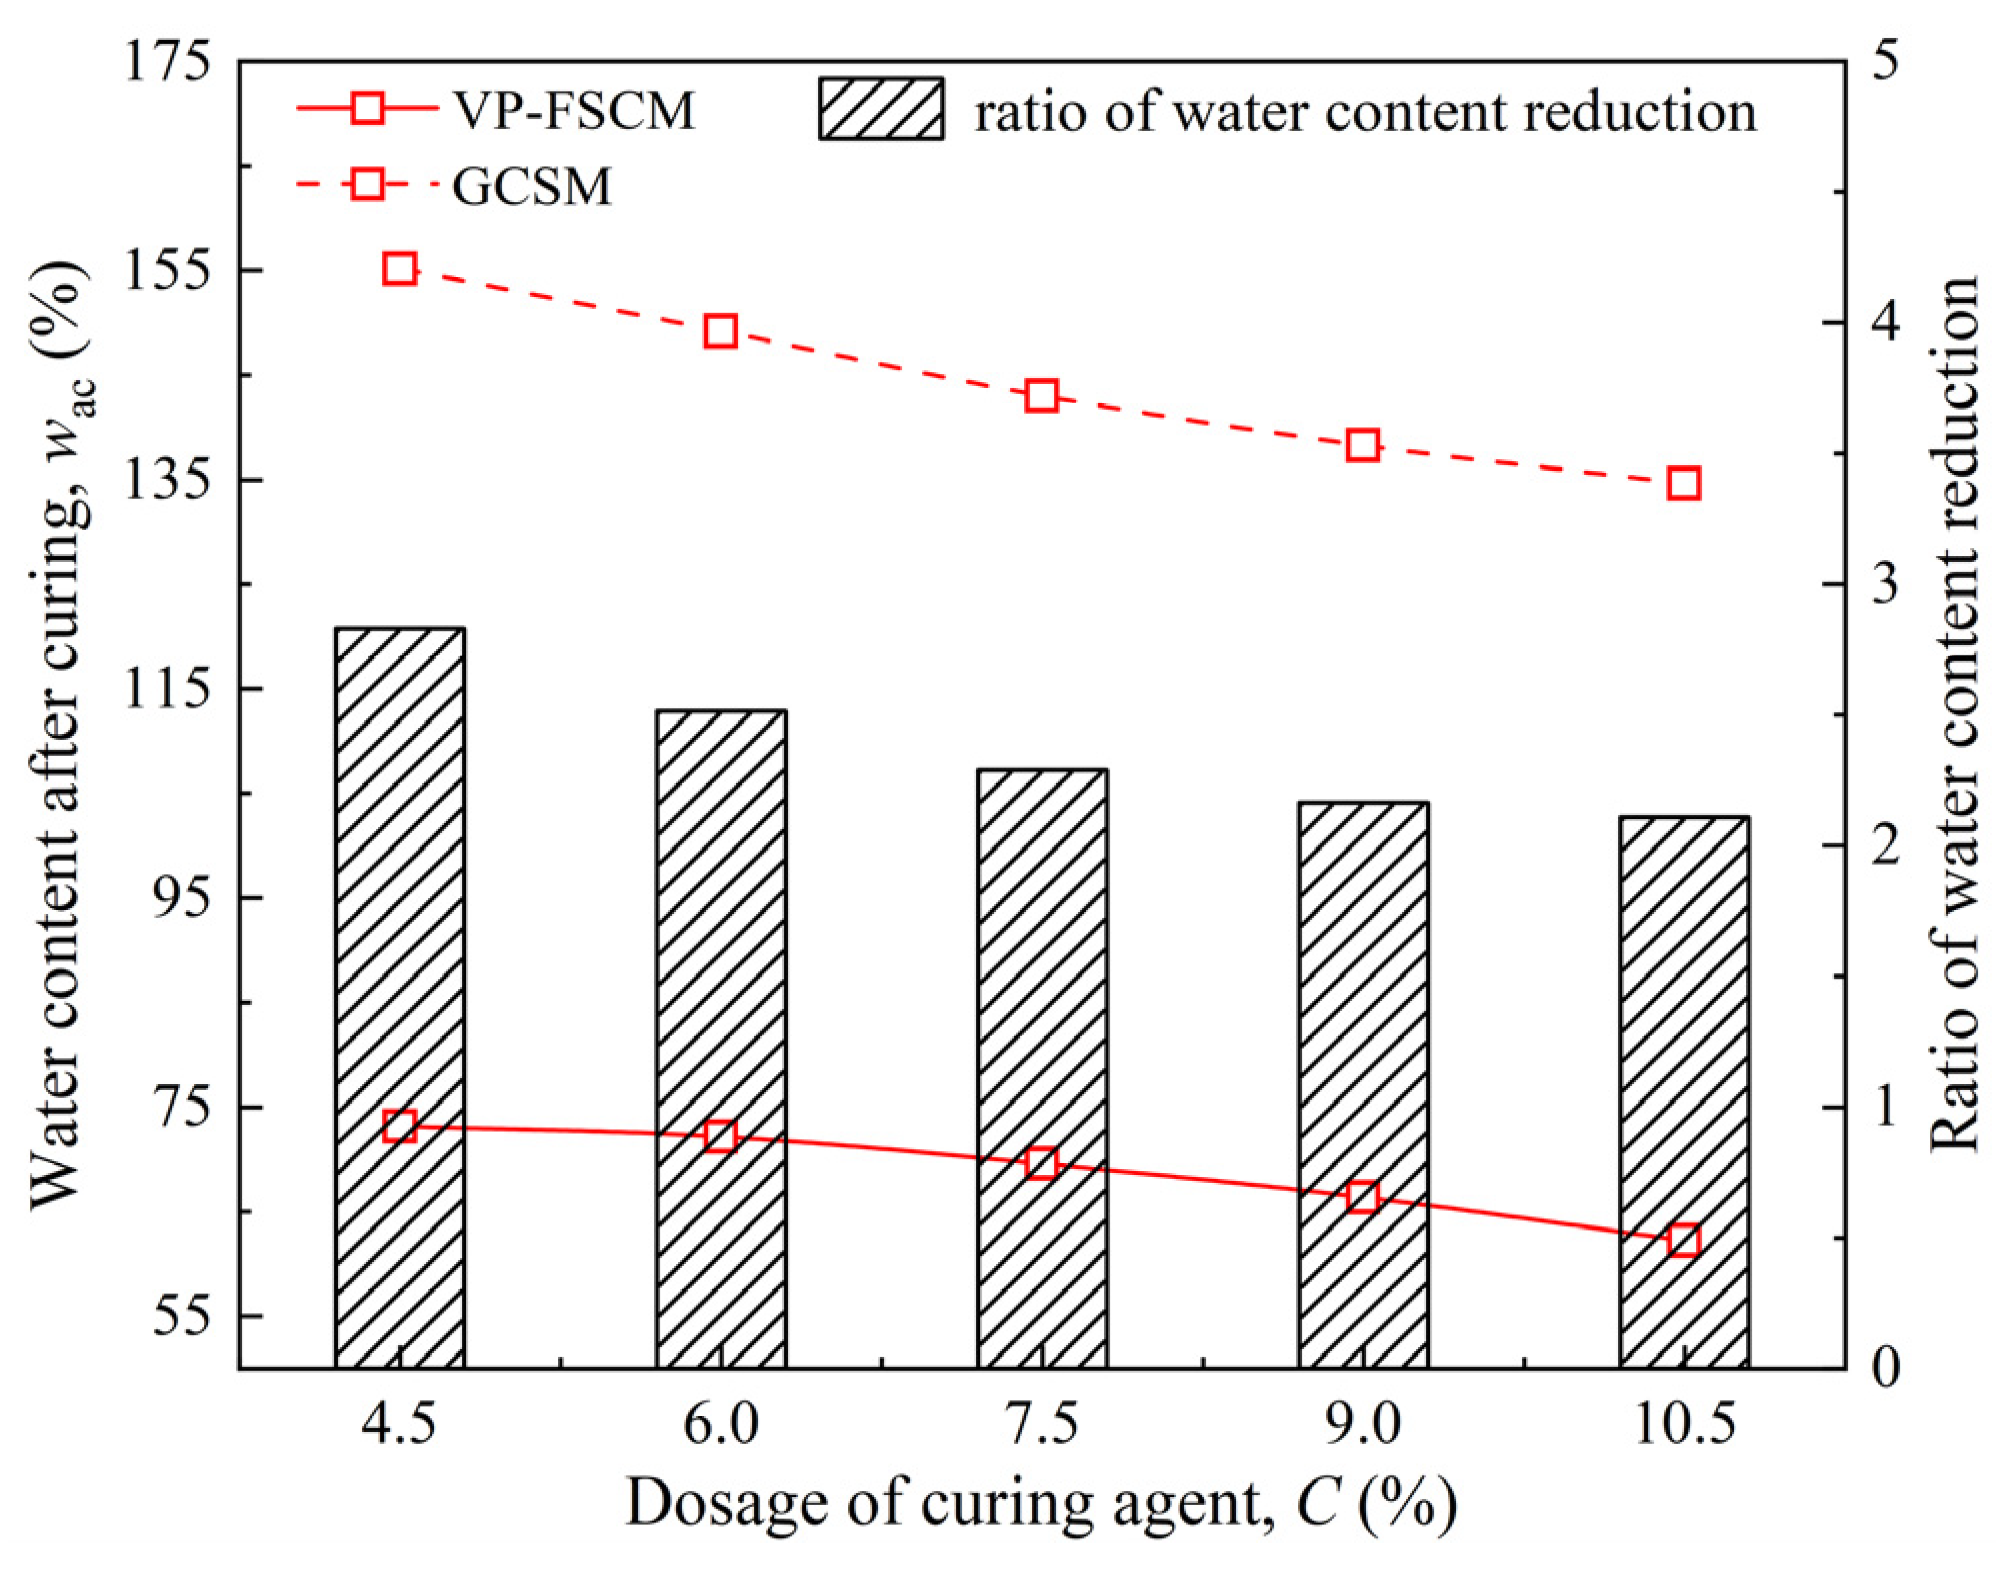
3.4. Comparison of the VP-FSCM and the GCSM

To better demonstrate the superiority of the VP-FSCM treatment, the traditional sludge treatment method GCSM is conducted, and experiments (Cases of C1–C5) without the addition of flocculant and the process of vacuum preloading are conducted as control. The undrained shear strength and the water content after curing are investigated and compared with the results of Cases of B1–B5.
Figure 14 is the undrained shear strength curves of the sludge treated with the VP-FSCM and the GCSM, and the histogram of the dominant change rule of the VP-FSCM compared with the GCSM is also illustrated in the figure. The undrained shear strength of the samples after the VP-FSCM or the GCSM treatment gradually increases with the curing agent dosage. The undrained shear strength of the models under various conditions after the VP-FSCM treatment is higher than that after the GCSM treatment, which indicates that flocculation dehydration, vacuum preloading, and chemical curing can jointly exert a coupling effect. It can also be seen from Figure 14 that with the increase in curing agent dosage, the gain effect of undrained shear strength of the VP-FSCM-treated samples gradually decreases compared with that of the GCSM-treated samples. When the curing agent dosage is 4.5%, the undrained shear strength of the VP-FSCM-treated samples is 4.13 times higher than that of the GCSM-treated samples, while it only increases by 3.03 times when the curing agent dosage reaches 10.5%. This result shows that compared with the GCSM, the VP-FSCM can achieve an excellent curing effect at a low curing agent dosage. Although the VP-FSCM shows a downward trend of the gain effect compared with the GCSM, its absolute strength improvement effect is better than the GCSM. According to the test result, when the curing agent dosage is 6%, the strength benefit is maximized. Thus, the optimum dosage of the curing agent is 6%. The strength growth law of the GCSM and the VP-FSCM at low curing agent dosage determines that the VP-FSCM has more significant strength characteristics than the GCSM for dredged sludge with low curing agent dosage.
Figure 15 shows the change curve of the water content of dredged sludge after the VP-FSCM or the GCSM treatment at different curing agent dosages and the histogram of the ratio change law of water content reduction after the VP-FSCM treatment compared with the GCSM treatment. With the increasing curing agent dosage, the water content of the samples treated with the VP-FSCM or the GCSM decreases gradually after curing, and that treated with the VP-FSCM is significantly lower than that treated with the GCSM. In addition, with the increase in curing agent dosage, the ratio of water content reduction of samples after the GCSM or the VP-FSCM treatment becomes smaller. As shown in Figure 15, the water content after curing of the VP-FSCM-treated samples decreases less significantly than that of the GCSM-treated samples with the increasing curing agent dosage. The water content after curing of the models treated with the VP-FSCM can be reduced by about 2.83 times (C = 4.5%) and 2.11 times (C = 10.5%) compared with that treated with the GCSM. This phenomenon indicates that when the equivalent initial water content of dredged sludge is the same, the curing efficiency of the GCSM is lower than that of the VP-FSCM at a low curing agent dosage.
It can be concluded from Figure 14 and Figure 15 that the unconfined shear strength of samples treated with VP-FSCM or GCSM increases with curing agent dosage, and VP-FSCM treatment results in significantly higher strength and lower water content compared to GCSM.
However, this study is limited to laboratory-scale experiments, which may not fully account for real-world complexities. Notably, the spatial variability of dredged sludge could influence the performance of VP-FSCM. Future research should address these factors to ensure its scalability and effectiveness in field applications.

4. Conclusions

This study determined the optimal proportions and dosages of curing agents and flocculants for sludge solidification through laboratory experiments, comparing the vacuum preloading-flocculation-solidification combined method (VP-FSCM) with the conventional method (GCSM). The main conclusions are as follows:
(1) The composite curing agent ratio of GGBS/OPC = 1, with a dosage of 6%, and a composite flocculant of 0.125% APAM and 1.5% Ca(OH)2, significantly enhanced sludge strength and reduced water content, achieving optimal flocculation and curing effects.
(2) Increasing curing agent dosage had limited impact on deposition, displacement, and drainage rate under VP-FSCM, but markedly increased undrained shear strength, especially in the early stage (0–1 d) and with depth near the drainage plate; water content decreased with curing age, with greater reductions at higher dosages and deeper layers due to enhanced vacuum and solidification effects.
(3) The VP-FSCM outperformed the GCSM, with maximum shear strength increases of 4.42 times and water content reductions of 2.83 times, attributed to the coupling effects of flocculation dehydration, vacuum preloading, and chemical curing.
These optimized parameters enable sustainable sludge management by transforming dredged sludge into a stable resource for applications like land reclamation, reducing waste and promoting eco-friendly utilization.

Author Contributions

Conceptualization, C.H. and H.L.; methodology, K.D. and R.Z.; validation, Y.G., K.S. and P.T.; formal analysis, C.H., H.L. and K.D.; investigation, H.L., K.D., Q.P., L.L., Y.G., K.S. and P.T.; resources, C.H., Y.G., K.S. and P.T.; data curation, Y.G., K.S. and P.T.; writing—original draft preparation, C.H., H.L. and K.D.; writing—review and editing, R.Z., Q.P. and L.L.; visualization, Q.P., L.L. and Y.G.; supervision, C.H. and R.Z.; project administration, H.L. and K.D.; funding acquisition, R.Z. All authors have read and agreed to the published version of the manuscript.

Funding

This work was funded by Science and Technology Project of State Grid Jiangsu Electric Power Co., Ltd. (grant NO. SGTYHT/21-JS-223).

Institutional Review Board Statement

Not applicable.

Informed Consent Statement

Not applicable.

Data Availability Statement

The original contributions presented in this study are included in the article. Further inquiries can be directed to the corresponding author.

Conflicts of Interest

Authors Chao Han, Hongwu Li, Qian Peng, Liang Liu, Yimu Guo, Ke Sun, and Peng Tu were employed by the company State Grid Jiangsu Electric Power Co., Ltd., Construction Branch. The remaining authors declare that the research was conducted in the absence of any commercial or financial relationships that could be construed as a potential conflict of interest.

Notations

APAMAnionic polyacrylamide
CComposite the dosage of curing agent (%)
dsRelative density
GCSMGGBS and OPC solidified sludge method
GGBSGround granulated blast-furnace slag
GGBS/OPCRatio of ground granulated blast-furnace slag to ordinary Portland cement
IPPlasticity index
OPCOrdinary Portland cement
PAMPolyacrylamide
SEdge deposition (mm)
suUndrained shear strength (kPa)
subUndrained shear strength of the bottom floor (kPa)
sutUndrained shear strength of the top floor (kPa)
tCuring time (d)
VWater discharge (kg)
VP-FSCMVacuum preloading-flocculation-solidification combined method
wacWater content after curing (%)
wcDosage of Ca(OH)2 (%)
weiEquivalent initial water content (%)
wfFlocculant dosage (%)
wLLiquid limit (%)
wPPlastic limit (%)

References

  1. Patmont, C.; LaRosa, P.; Narayanan, R.; Forrest, C. Environmental dredging residual generation and management. Integr. Environ. Asses. 2018, 14, 335–343. [Google Scholar] [CrossRef] [PubMed]
  2. Nguyen, T.T.M.; Rabbanifar, S.; Brake, N.A.; Qian, Q.; Kibodeaux, K.; Crochet, H.E.; Oruji, S.; Whitt, R.; Farrow, J.; Belaire, B.; et al. Stabilization of silty clayey dredged material. J. Mater. Civ. Eng. 2018, 30, 04018199. [Google Scholar] [CrossRef]
  3. Svensson, N.; Norén, A.; Modin, O.; Fedje, K.K.; Rauch, S.; Strömvall, A.-M.; Andersson-Sköld, Y. Integrated cost and environmental impact assessment of management options for dredged sediment. Waste Manag. 2022, 138, 30–40. [Google Scholar] [CrossRef] [PubMed]
  4. Liu, S.; Cai, Y.; Sun, H.; Geng, X.; Shi, L.; Pan, X. Consolidation considering clogging effect under uneven strain assumption. Int. J. Geomech. 2021, 21, 04020239. [Google Scholar] [CrossRef]
  5. Jiang, S.; Xu, J.; Song, Y.; Gong, W.; Wang, L.; Yu, Z.; Wang, G. Effect of calcination pretreatment on mechanical properties of alkali-activated artificial stone incorporating Yellow River silt. J. Clean Prod. 2022, 364, 132682. [Google Scholar] [CrossRef]
  6. Zhang, J.; Wang, X.; Shi, L.; Yin, Y. Enzyme-induced carbonate precipitation (EICP) combined with lignin to solidify silt in the Yellow River flood area. Constr. Build Mater. 2022, 339, 127792. [Google Scholar] [CrossRef]
  7. Giordano, V.; Castagnoli, A.; Pecorini, I.; Chiarello, F. Identifying technologies in circular economy paradigm through text mining on scientific literature. PLoS ONE 2024, 19, e0312709. [Google Scholar] [CrossRef]
  8. Lei, H.; Toma, A.; Bo, Y.; Wang, L.; Wu, H. Reinforcement effect of the stepped-alternating vacuum preloading method on dredged fills. Int. J. Geomech. 2024, 24, 04023272. [Google Scholar] [CrossRef]
  9. Lei, H.; Liu, X.; Wang, P.; Liu, J.; Hu, Y. Experimental investigation of influence of air-boost pressure and duration on air-boost vacuum preloading consolidation. Int. J. Geomech. 2021, 21, 04021088. [Google Scholar] [CrossRef]
  10. Tang, T.; Huang, J.; Guan, Y.; Chen, H.; Cheng, W. Field test study on vacuum preloading of dredger fill silt. Port. Waterw. Eng. 2010, 04, 115–122. [Google Scholar] [CrossRef]
  11. Xu, Y.; Wu, Y.; Zhang, X.; Chen, G.; Zhang, Y.; Ji, J. Anti-clogging mechanism of freeze-thaw combined with step vacuum preloading in treating landfill sludge. Environ. Res. 2023, 218, 115059. [Google Scholar] [CrossRef] [PubMed]
  12. Chen, H.; Chu, J.; Guo, W.; Wu, S. Land reclamation using the horizontal drainage enhanced geotextile sheet method. Geotext. Geomembr. 2023, 51, 131–150. [Google Scholar] [CrossRef]
  13. Ni, J.; Liu, S.; Wang, Y.; Xu, G. Synergistic influence of lime and straw on dredged sludge reinforcement under vacuum preloading. Constr. Build. Mater. 2024, 421, 135642. [Google Scholar] [CrossRef]
  14. Zhou, Y.; Chen, S.; Guo, W.; Ren, Y.; Xu, G. Recent developments in the vacuum preloading technique in china. Sustainability 2022, 14, 13897. [Google Scholar] [CrossRef]
  15. Gan, Q.; Zhou, J.; Li, C.; Zhuang, Y.; Wang, Y. Vacuum preloading combined with electroosmotic dewatering of dredger fill using the vertical-layered power technology of a novel tubular electrokinetic geosynthetics: Test and numerical simulation. Int. J. Geomech. 2022, 22, 05021004. [Google Scholar] [CrossRef]
  16. Lei, H.; Xu, Y.; Li, X.; Jiang, M.; Liu, L. Effect of polyacrylamide on improvement of dredger fill with vacuum preloading method. J. Mater. Civ. Eng. 2019, 31, 04019193. [Google Scholar] [CrossRef]
  17. Bao, S.; Dong, Z.; Mo, H.; Wu, D. Laboratory tests on new reinforcement technology of newly hydraulic reclamation mud with high clay content. Rock Soil Mech. 2015, 36, 61–67. [Google Scholar] [CrossRef]
  18. Wu, Y.; Wang, X.; Zhang, X.; Lu, Y.; Xu, J.; Tran, Q.C.; Vu, Q.V. Experimental investigation on waste slurry improvement using vacuum preloading with calcium oxide. B. Eng. Geol. Environ. 2022, 81, 293. [Google Scholar] [CrossRef]
  19. Lei, M.; Luo, S.; Chang, J.; Zhang, R.; Kuang, X.; Jiang, J. The influences of vacuum-surcharge preloading on pore water pressure and the settlement of a soft foundation. Sustainability 2023, 15, 7669. [Google Scholar] [CrossRef]
  20. Lei, M.; Luo, S.; Chang, J.; Zhang, R.; Kuang, X.; Jiang, J. Fluid-Solid coupling numerical analysis of pore water pressure and settlement in vacuum-preloaded soft foundation based on FLAC3D. Sustainability 2023, 15, 7841. [Google Scholar] [CrossRef]
  21. Cui, Y.-L.; Pan, F.-R.; Zhang, B.-B.; Wang, X.-Q.; Diao, H.-G. Laboratory test of waste mud treated by the flocculation-vacuum-curing integrated method. Constr. Build Mater. 2022, 328, 127086. [Google Scholar] [CrossRef]
  22. Liu, F.; Wu, W.; Fu, H.; Wang, J.; Hai, J.; Cai, Y.; Hu, X.; Yuan, W.; Lou, X. Application of flocculation combined with vacuum preloading to reduce river-dredged sludge. Mar. Georesour. Geotec. 2019, 38, 164–173. [Google Scholar] [CrossRef]
  23. He, J.; Shi, X.-K.; Li, Z.-X.; Zhang, L.; Feng, X.-Y.; Zhou, L.-R. Strength properties of dredged soil at high water content treated with soda residue, carbide slag, and ground granulated blast furnace slag. Constr. Build Mater. 2020, 242, 118126. [Google Scholar] [CrossRef]
  24. Yang, W.; Zhou, F.; Zhu, R.; Song, Z.; Hua, S.; Ma, Y. Strength performance of mucky silty clay modified using early-age fly ash-based curing agent. Case Stud. Constr. Mat. 2022, 17, e01595. [Google Scholar] [CrossRef]
  25. Zhang, W.-L.; Zhao, L.-Y.; McCabe, B.A.; Chen, Y.-H.; Morrison, L. Dredged marine sediments stabilized/solidified with cement and GGBS: Factors affecting mechanical behaviour and leachability. Sci. Total Environ. 2020, 733, 138551. [Google Scholar] [CrossRef]
  26. Lang, L.; Chen, B.; Chen, B. Strength evolutions of varying water content-dredged sludge stabilized with alkali-activated ground granulated blast-furnace slag. Constr. Build Mater. 2021, 275, 122111. [Google Scholar] [CrossRef]
  27. Yuan, Q.; Xie, Z.; Yao, H.; Fan, M.; Huang, T. Comparative study on the early properties of cement modified with different ionic polyacrylamides. Constr. Build Mater. 2022, 339, 127671. [Google Scholar] [CrossRef]
  28. Wu, A.; Ruan, Z.; Bürger, R.; Yin, S.; Wang, J.; Wang, Y. Optimization of flocculation and settling parameters of tailings slurry by response surface methodology. Miner. Eng. 2020, 156, 106488. [Google Scholar] [CrossRef]
  29. Yin, S.; Hou, Y.; Yang, S.; Chen, X. Study on static and dynamic flocculation settlement characteristics of fine tailings slurry and influence of flocculant on strength of fine tailings backfill. Case Stud. Constr. Mat. 2022, 17, e0525. [Google Scholar] [CrossRef]
  30. Zhang, R.-J.; Zheng, Y.-L.; Zheng, J.-J.; Dong, C.-Q.; Lu, Z. Flocculation–solidification combined method for treatment of hydraulically dredged mud at extra high water content. Acta. Geotech. 2019, 15, 1685–1698. [Google Scholar] [CrossRef]
  31. Zhang, R.-J.; Xu, Z.-H.; Zheng, J.-J.; Tu, L.-W.; Huang, Z.-F. Reasonable application range of flocculation–solidification combined method in treatment of hydraulically dredged mud slurry. Mar. Georesour. Geotec. 2021, 40, 370–383. [Google Scholar] [CrossRef]
  32. Zheng, Y.; Zhang, R.; Zheng, J.; Dong, C.; Lu, Z. Experimental study of flocculation-solidification combined treatment of hydraulically dredged mud at extra high-water content. Rock Soil Mech. 2019, 40, 3107–3114. [Google Scholar] [CrossRef]
  33. GB/T 50123-2019,717; Standard for Geotechnical Testing Method. China Renewable Energy Engineering Institute and Nanjing Hydraulic Research Institute: Nanjing, China, 2019.
  34. GB/T 50145-2007.38; Standard for Engineering Classification of Soil. Nanjing Hydraulic Research Institute: Nanjing, China, 2007.
  35. Xu, Z.-H.; Zhang, R.-J.; Zheng, J.-J.; Liu, S.-J. Laboratory and field experimental study on efficiency of vacuum preloading–flocculation–solidification combined method for slurry-like mud treatment. Acta Geotech. 2024, 19, 5417–5432. [Google Scholar] [CrossRef]
  36. Bian, X.; Yang, H.; Duan, K.; Zhang, R.; Wu, L. Study on effect of equivalent initial water content on dredged sludge treated by VP-FSCM. Transp. Geotech. 2023, 42, 101077. [Google Scholar] [CrossRef]
  37. He, J.; Chu, J.; Tan, S.K.; Vu, T.T.; Lam, K.P. Sedimentation behavior of flocculant-treated soil slurry. Mar. Georesour. Geotec. 2016, 35, 593–602. [Google Scholar] [CrossRef]
  38. Nedunuri, S.S.S.A.; Sertse, S.G.; Muhammad, S. Microstructural study of Portland cement partially replaced with fly ash, ground granulated blast furnace slag and silica fume as determined by pozzolanic activity. Constr. Build. Mater. 2020, 238, 117561. [Google Scholar] [CrossRef]
  39. Zhou, H.; Wang, X.; Wu, Y.; Zhang, X. Mechanical properties and micro-mechanisms of marine soft soil stabilized by different calcium content precursors based geopolymers. Constr. Build Mater. 2021, 305, 124722. [Google Scholar] [CrossRef]
  40. Zhang, R.-J.; Zheng, Y.-L.; Dong, C.-Q.; Zheng, J.-J. Strength behavior of dredged mud slurry treated jointly by cement, flocculant and vacuum preloading. Acta. Geotech. 2022, 17, 2581–2596. [Google Scholar] [CrossRef]
  41. Xu, M.; Zhou, W.; Zhu, Z.; Peng, C.; Peng, Y. Study on the preparation of polysilicate ferric flocculant and its treatment of high turbidity tailings water. J. Water Process. Eng. 2021, 44, 102457. [Google Scholar] [CrossRef]
  42. Zhang, R.J.; Lu, Y.T.; Tan, T.S.; Phoon, K.K.; Santoso, A.M. Long-Term effect of curing temperature on the strength behavior of cement-stabilized clay. J. Geotech. Geoenviron. Eng. 2014, 140, 01014045. [Google Scholar] [CrossRef]
  43. Zhang, R.-J.; Qiao, Y.-Q.; Zheng, J.-J.; Dong, C.-Q. A method for considering curing temperature effect in mix proportion design of mass cement-solidified mud at high water content. Acta. Geotech. 2021, 16, 279–302. [Google Scholar] [CrossRef]
Figure 1. XRD pattern of the sludge used in laboratory experiments.
Sustainability 17 02710 g001
Figure 2. Effects of the curing agent ratio on (a) su, (b) wac.
Sustainability 17 02710 g002
Figure 3. Illustration of the experiment: (a) Vacuum preloading model box; (b) Vacuum preloading model laboratory experiment samples; (c) Cutting rings and sampling; (d) Samples.
Sustainability 17 02710 g003
Figure 4. Effects of the flocculant dosage on su: (a) Variation of su versus wf at different curing; (b) Variation of su versus t at different flocculant dosages.
Sustainability 17 02710 g004
Figure 5. Effects of the flocculant dosage on wac: (a) Variation of wac versus wf at different curing ages; (b) Variation of wac versus t for case group A.
Sustainability 17 02710 g005
Figure 6. Variation of S versus V with the curing agent dosage: (a) Variation of S; (b) Variation of V.
Sustainability 17 02710 g006
Figure 7. Variation of su versus C and t: (a) Variation of su versus C at different curing ages; (b) Variation of su versus t for group B.
Sustainability 17 02710 g007
Figure 8. Variation of su versus C at different curing ages: (a) Top layer; (b) Bottom layer.
Sustainability 17 02710 g008
Figure 9. Variation of sub-sut versus C at different curing ages.
Sustainability 17 02710 g009
Figure 10. Variation of su versus depth with different curing agent dosages: (a) C = 4.5%; (b) C = 6%; (c) C = 7.5%; (d) C = 9%; (e) C = 10.5%.
Sustainability 17 02710 g010
Figure 11. Variation of wac versus C and t: (a) Variation of wac versus C; (b) Variation of wac versus t for case group B.
Sustainability 17 02710 g011
Figure 12. Variation of wac versus C at different curing ages: (a) Top layer; (b) Bottom layer.
Sustainability 17 02710 g012
Figure 13. Variation of wac versus depth with different curing agent dosages: (a) C = 4.5%; (b) C = 6.0%; (c) C = 7.5%; (d) C = 9.0%; (e) C = 10.5%.
Sustainability 17 02710 g013
Figure 14. Relationship between the ratio of su, and C.
Sustainability 17 02710 g014
Figure 15. Relationship between the ratio of water content reduction, wac and C.
Sustainability 17 02710 g015
Table 1. Basic physical properties of the sludge used in laboratory experiments.
PropertyValue
Relative density ds2.72
Liquid limit wL (%)51.4
Plastic limit wP (%)32.4
Plasticity index IP19.0
Ignition loss (%)3.79
Grit fraction (%)
(0.075 < diameter < 2 mm)
4.3
Powder particle fraction (%)
(0.005 < diameter < 0.075 mm)
62.7
Cosmid fraction (%)
(diameter < 0.005 mm)
33.0
Table 2. Chemical composition of GGBS and OPC used in laboratory experiments.
OxideOPC (%)GGBS (%)
SiO222.9230.64
Al2O36.0915.28
Fe2O33.640.33
TiO20.390.56
Ca(OH)259.7136.88
MgO0.885.84
SO32.820.04
K2O0.760.2
Na2O0.660.35
Loss on ignition2.130.06
Table 3. Program for the laboratory experiments.
Case No.Treatmentwei (%)Dosage of FlocculantDosage of Curing Agent
wc (%)wf (%)C (%)GGBS/OPC
A1VP-FCSM2001.50.13.01.0
A20.125
A30.15
A40.175
B1VP-FCSM2001.50.1254.51.0
B26.0
B37.5
B49.0
B510.5
C1GCSM200004.51.0
C26.0
C37.5
C49.0
C510.5
Note: wei denotes the equivalent initial water content; C denotes the dosage of the composite curing agent; GGBS/OPC denotes the ratio of ground granulated blast-furnace slag to ordinary Portland cement; wc and wf denote the dosage of Ca(OH)2 and APAM, respectively.
Disclaimer/Publisher’s Note: The statements, opinions and data contained in all publications are solely those of the individual author(s) and contributor(s) and not of MDPI and/or the editor(s). MDPI and/or the editor(s) disclaim responsibility for any injury to people or property resulting from any ideas, methods, instructions or products referred to in the content.

