1. Introduction
Over the last decade, technological breakthroughs and cost reductions have accelerated the global implementation of renewable energy sources. Energy generated from renewable sources is a significant player in achieving a sustainable environment. Over 80% of global energy output is reliant on fossil fuels, including coal, oil, and natural gas [
1]. Bioenergy, hydropower, geothermal energy, solar energy, wind energy, and ocean (tide and wave) energy are examples of renewable energy sources that replenish themselves naturally without depleting the Earth’s resources. In 2016, more than 82% of all Australian local governments had zero emissions objectives for their operations, with 18% having comparable targets for their communities [
2].
1.1. Renewable Energy Zone
Geographic areas known as renewable energy zones (REZs) have been identified for having plenty of natural resources with the capacity to effectively capture solar and wind energy. By aggregating massive energy-producing, storage, and transmission facilities, they create a coherent hub that enhances the resilience and dependability of the power grid [
3]. The necessity of a dedicated renewable energy zone can have a significant impact on environmental preservation and lead towards a contemporary, cohesive, and economical energy framework. A renewable energy zone (REZ) possesses high-quality renewable energy resources, appropriate topography and land-use designations, as well as evident demand from developers, all of which facilitate cost-effective renewable development [
4].
The success and sustainability of renewable energy projects depend on an appropriate location for a renewable energy zone (REZ). Many renewable energy sources, including solar and wind power, rely on site geography, including wind speed, solar irradiation, and rainfall. Proper site selection optimizes natural resource efficiency while reducing environmental repercussions by avoiding sensitive areas, such as animal habitats, wetlands, or agricultural land [
5]. Large-scale energy infrastructure may disrupt the residents; hence, selecting a site that reduces problems such as noise or visual pollution is crucial for securing community acceptability, thus fostering public support and avoiding disputes.
Economically speaking, it makes more sense to locate projects next to existing infrastructure, such as transmission lines, because this lowers the cost of transferring power, making the projects more feasible and affordable. A more streamlined approval process and fewer legal hurdles are achieved when the site is in harmony with environmental laws, design tools, and zoning rules [
6]. An ideal site promotes long-term sustainability, balances social, environmental, and financial factors, improves the output of renewable energy, and reaches climate targets, including net zero emissions. Planning REZs can progress renewable energy projects and protect community and environmental integrity by closely addressing these elements [
7].
1.2. New South Wales (NSW) Proposed Renewable Zone
NSW has moved ahead of other states because it will face multiple coal retirements over the next 15 years, commencing in 2022. There are five coal-fired generators in NSW, which produce around 80% of the electricity generated. The state government expects all but Mt Piper to retire by 2035. The closure of Eraring and Bayswater coal power stations will require significant new generation and storage capacity built across multiple REZs [
8]. NSW is centrally located within the National Energy Market (NEM), well-connected to the other states, and has the highest energy demand. Locating energy zones in NSW would provide opportunities to better match supply and demand across the NEM, minimizing transmission losses. Any new interconnections proposed for NSW could be optimized to facilitate the connection of new energy zones to increase competition in the wholesale market and make more supply available to meet NSW energy demand [
9].
Through a detailed geospatial mapping analysis, the Australian Energy Market Operator (AEMO) identified 10 potential energy zones in New South Wales (NSW) by overlaying 25 data layers that incorporate 5 key criteria, which are instrumental in pinpointing the most suitable locations for these energy zones [
9]. The criteria focus on energy resource availability and geographical factors, cost-effectiveness, environmental, heritage, and land-use considerations, contributions to a robust and diversified economy, and support from investors and the community. The heatmap analysis included various layers, such as solar photovoltaic resources, wind resources, site slope and aspect, parcel size, land use, and cover, while also accounting for protected and prohibited areas, site elevation, land zoning, biophysical strategic agricultural land, and biodiversity [
9]. Additionally, the view layers that contributed to this comprehensive assessment encompassed soil and erosion areas, geology, easements, watercourse corridors, local government areas, NSW electorates, bioenergy potential, and transmission corridors and capacity. Other significant factors included common ground mining data regarding mining tenure, heritage considerations, planned energy developments, and detailed land tenure information distinguishing between crown and private lands. This thorough mapping and analysis is a foundation for establishing energy zones that promote sustainable energy development while considering economic, environmental, and community needs.
Figure 1 shows the locations proposed by the New South Wales state government [
10] for renewable energy zones. The NSW Government is planning several renewable energy zones (REZs) across the state, including the Central-West Orana REZ (20,000 km
2) centered around Dubbo and Dunedoo, the New England REZ (15,500 km
2) centered around Armidale, the Southwest REZ (756.93 km
2) near Hay, and the Illawarra REZ (344 km
2) located in the Dharawal people’s land. The Hunter and Central Coast REZ (7468.70 km
2) is also under planning, covering lands of several Indigenous groups. These areas are integral to NSW’s clean energy strategy. The total area of all the proposed REZs is 43,069.63 km
2.
In 2017, the NSW Government proposed three priority REZs: Centra-West Orana (wind and solar), New England (pumped-hydro, solar, and wind), and South-West (solar). In 2020, when NSW passed legislation to govern REZ development, negotiations with the Labor opposition led to the addition of two new REZs: Hunter-Central Coast (which includes existing black coal generators and mines) and Illawarra (a coal mining and steel production region). These REZs were not included in the NSW Government’s original Transmission Infrastructure Strategy, nor were the ISP and EnergyCo in the early stages of planning them [
10].
The Central-West Orana is the first formally declared renewable energy zone (REZ) in Australia [
8,
11], which is prioritized for several reasons, including its proximity to transmission infrastructure, a diverse mix of energy resources, and significant interest from investors in developing new projects in the region. There is a need for consideration of Aboriginal heritage, as well as potential conflicts with agricultural and rural land use; priority should be given to crown land and Traveling Stock Reserves (TSRs) [
11], alongside maximizing the use of already disturbed land such as mining and industrial sites; the proximity of proposed projects to residential areas also warrants attention, along with a thorough examination of land owned by the NSW Government; evaluating alternative routes that would mitigate impacts on biodiversity is essential, particularly considering critically endangered species and communities; the scale of existing transmission lines should be factored into planning, as should the implications for private and agricultural land; and a comprehensive assessment of the broader biodiversity impact, alongside the preservation of heritage items from the Australian colonial period, is crucial to ensure that development in this region is both responsible and sustainable.
1.3. Classification of Renewable Energy
Renewable energy is gaining wider use for power generation around the world nowadays. This is particularly due to society’s concern about environmental issues; bioenergy, and geothermal energy have their own operation conditions and energy conversion efficiency, and are therefore associated with conventional electricity generation. The five major groups of renewable energy, solar energy, hydro energy, wind energy, bioenergy, and geothermal energy, have their own operation conditions and energy conversion efficiency. Therefore, RE technologies depend on location and condition [
7].
1.3.1. Geothermal Energy
Geothermal energy is viewed as an ecologically beneficial option, and climate change is unlikely to impact its dependability. The large-scale deployment of geothermal energy has the potential to reduce greenhouse gas emissions significantly. This energy is derived from heat produced mainly by the disintegration of naturally existing radioactive isotopes on Earth. Internal heat output is predicted to be comparable to burning 3.0 × 10
27 barrels of oil at a depth of 10 km, resulting in roughly 1.3 × 10
27 joules. Given that worldwide energy consumption is comparable to 100 million barrels of oil per day, geothermal energy has the potential to supply the world’s energy needs for around six million years [
12].
Geothermal energy may be used for a variety of applications, including heating. Specialized equipment such as a heat exchanger and heat pump convert this energy into heat for building heating. These operate together to convert cold water to warm water. The heat exchanger is a loop of pipes installed deep down, where the temperature remains constant at 54 °F. This loop links to the heat pump, which distributes water throughout the system. Cold water is injected into the ground, absorbing the Earth’s warmth before being routed into the heat pump. This process creates heat, which is circulated throughout the building using a ventilation system. Geothermal energy must be turned from heat into steam before it can be used to generate electricity, which is accomplished in geothermal power plants utilizing various technologies such as dry steam, flash steam, and binary cycle. These technologies frequently include digging deeper into the Earth to get steam for energy production [
7].
1.3.2. Wind Energy
Wind energy is another alternative to fossil fuels and is known for being a plentiful, renewable, and clean resource. Wind power converts wind energy into electrical energy. Small onshore wind farms provide electricity to isolated locations, and wind energy sources are amongst the world’s fastest-developing energy sources. The potential of a wind energy project significantly depends on the location of the project. A proper assessment before investment helps predict the project’s outcome and reduces uncertainty. Based on location, wind farms are distinguished into two categories: onshore and offshore. Wind farm locations on land are known as onshore farms. The wind farms located in lakes, rivers, and seas are known as offshore wind farms. Wind has already been proven as one of the least-cost power options. Small-scale wind turbines are sufficient to serve remote community power needs, and large-scale wind farms could be a feasible option instead of fossil fuels [
5]. Wind energy can be used to generate electricity using wind turbines. The movement of air over the blades on a wind turbine results in pressure differences and the turning of a rotor. The rotor is, in turn, connected to a generator, which converts the mechanical energy produced by the blades and the rotor into electrical energy or electricity. The electricity generated from the turbines is typically linked to the electricity network or “grid” via a transformer or substation or to off-grid applications in remote areas. Large wind farms are connected to the high-voltage transmission network, whereas individual wind turbines or smaller wind farms are often connected to the high-voltage distribution network [
13].
1.3.3. Solar Energy
The planet’s main supply of limitless, free energy, often known as solar energy, comes from the sun. Modern technologies are being used to capture and turn solar energy into power. These techniques have proven successful and are being used widely everywhere as renewable alternatives to conventional non-hydro technology. Theoretically, with the right technology for its delivery and gathering, solar energy may be able to supply the world’s energy needs. Solar energy is the process of harnessing the sun’s heat and light to generate electricity, using devices specifically made for this purpose. Commonly, two kinds of technology are employed to convert solar energy (
Figure 2). Passive technology aims to gather solar energy without converting it into other forms, including electricity. One popular application of this technology is heating homes during the winter by gathering, storing, and dispersing heat. On the other hand, active solar systems collect solar radiation and use electrical or mechanical components, such as fans and pumps, to transform solar energy into heat or power. One well-known application of active solar technology is the solar water heater. Photovoltaics and solar thermal technologies are the categories under which active solar energy systems fall. In recent years, photovoltaics—which use semiconductors to convert sunlight into electricity—have become increasingly well-liked as a desirable renewable energy source [
14].
1.3.4. Biomass
Sustainable bioenergy generation might come from fast-growing non-food crops and perennial biomass crops. Biomass is a biological substance derived from plants or living entities. This energy is among the most used in less developed and less industrialized nations. With 35% and 3% of the primary energy demands of industrialized and developing countries, biomass is the most evolved renewable energy source available [
15]. Either directly combustible to generate heat or indirectly following conversion to several kinds of biofuel, biomass may be a source of energy. From forest waste, including dead trees, branches, and steam, biomass may be transformed into different usable forms, including methane gas or transportation fuels such as ethanol or biodiesel. Other regions use biomass differently. Commonly utilized in the United States, agricultural waste is employed in Mauritius and Southeast Asia; animal husbandry residue is prevalent in the United Kingdom, as is wood residue. Although quantification is necessary to identify the available capacity in planning biomass power plants, forests play a vital role in the carbon cycle of the globe and are also the cheapest and most readily available renewable energy source for human beings compared to solar [
15].
1.4. Sustainable Development Goal
The United Nations Sustainable Development Goals (SDGs) are 17 goals with 169 targets that all 191 UN members have agreed to try to achieve by the year 2030 [
16,
17]. The 17 SDGs are integrated; they recognize that action in one will affect outcomes in others and that development must balance social, economic, and environmental sustainability. The SDGs aim to improve the welfare of a sustainable, prosperous, peaceful, and just life on earth for all the people for now and in the future. The SDGs are designed in a participatory manner involving all development actors in the focus and principles of the SDGs; the principles have been well-known as “Leave no one behind”. The SDGs consist of 17 goals and 169 target points, and under the target points, there are some indicators to measure the changes and developments [
9,
16]. Generating renewable energy is covered profoundly under SDG 7.
Ensuring access to reasonably priced, dependable, sustainable, modern energy is the main emphasis of SDG 7. Achieving universal access to energy services, raising the amount of renewable energy sources in the whole energy mix, and improving energy efficiency are the three primary aims. Promoting international collaboration and investment and enhancing infrastructure and technology in underdeveloped nations is a top priority for applying SDG 7. Although SDG 7 has a low number of objectives compared to other SDGs, it is nevertheless a top development issue. Human progress depends on modern energy, which has been the engine behind economic expansion for over two centuries [
18]. All stakeholders should consider the possibilities and consequences of SDG 7 action, integrating the consideration of energy’s interlinkages at all levels in policy, legislation, planning, implementation, and management, thus attaining these co-benefits and minimizing trade-offs. Strengthening the basis for evidence-based decision-making requires tracking and quantifying the interactions of energy with other SDGs. Investing in SDG 7 action can have several advantages, accelerating global climate objectives, encompassing both reduction and adaptation, and improving development on other SDGs [
17].
The multiple advantages of SDG7 action can help other SDGs progress. Decisive action on sustainable energy will propel advancement towards all the other SDGs, including global climate objectives, mitigation, and adaptation. SDG7 can help address other challenges in climate change, such as water safety and availability, food security, human health, and poverty reduction. Therefore, energy access projects under the SDG 7 banner (
Figure 3) have received increased support from governments, industry, and civil society organizations, with funding and investments directed toward renewable and clean energy.
Access to modern, dependable, and affordable energy services is crucial for alleviating poverty (SDG 1) and is intertwined with various Sustainable Development Goals (SDGs). Encouraging renewable energy sources and efficiency improvements can foster innovation and support industrial and employment goals (SDG 8), while also promoting sustainable consumption and production patterns (SDG 12) [
19]. High-quality education (SDG 4) is essential for understanding and implementing sustainable energy solutions, which in turn supports energy access and efficiency (SDG 7). Strong infrastructure and sustainable industrial growth (SDG 9) are critical for achieving energy goals, and efficient, clean energy systems are vital for sustainable urban development (SDG 11) [
17]. Additionally, integrating climate change policies into national planning and improving education about climate challenges are necessary to meet the Paris Agreement targets and support SDG 13. By leveraging local renewable resources, especially in impoverished areas, we can generate income and reduce poverty while advancing towards a low-carbon economy [
20].
1.5. Importance of Renewable Energy for the Future Generation
The reality in which we live cannot change; the daily need for energy by all inhabitants worldwide is gradually turning the planet into a global community. Growing demand for energy and associated services is driven by welfare, health, and social and economic progress. Two overriding issues facing the energy industry on its way to a sustainable future are securing energy supplies and reducing the energy contribution to climate change [
21]. Growing energy demand combined with a rising population has resulted in the continuous use of fossil fuel-based energy sources (coal, oil, and gas), which have become problematic by generating several challenges, including the depletion of fossil fuel reserves, greenhouse gas emissions, and other environmental concerns, geopolitical and military conflicts, and continuous fuel price fluctuations. These issues will lead to unsustainable conditions that will ultimately cause permanent harm to human civilizations. Still, the most fantastic substitute, and the only way to solve mounting problems, is to use renewable energy sources. Not conceivable 10 years ago, renewable energy sources accounted for 22% of all world energy output in 2012 [
22].
One of the most significant advantages of renewable energy is its minimal carbon emissions, which help combat climate change. A great deal of greenhouse gases are released into the air when fossil fuels such as coal and oil are burned. These gases cause global warming and damage the environment. Renewable energy, on the other hand, does not produce much or any dangerous pollution, which makes it a much better way to make electricity [
23]. Getting and using fossil fuels also does a great deal of damage to the environment, such as polluting the air, water, and land with toxic trash. When coal is mined, harmful toxins, such as mercury, lead, and sulfur dioxide, are released. When oil is extracted, huge spills, such as the BP oil spill in the Gulf of Mexico in 2010, which was extremely bad for marine environments, can happen [
24]. Dependency on resources that cannot be replaced has its limits. Fossil fuel supplies are limited, and as they run out, it gets more expensive and riskier to find new sources. Some sources, such as oil sands, need methods that use a great deal of energy and make more waste. Renewable energy sources, on the other hand, such as sunshine, wind, and geothermal heat, are naturally occurring and will never run out. Over time, this makes them much more secure and less reliant on the dangerous and environmentally damaging methods used to obtain fossil fuels [
25]. The economic advantages represent a significant facet of renewable energy. Renewable energy mitigates the market volatility associated with coal, oil, and natural gas by stabilizing power costs.
Fossil fuel supply networks are often influenced by political disputes, pricing manipulation, and other international issues. Conversely, renewable energy may be generated locally, making it less susceptible to external interruptions. This capacity to create energy locally increases national security and minimizes the likelihood of energy crises caused by political or economic turbulence in other areas of the globe. Safety is another area where renewable energy has clear advantages. The extraction, transportation, and burning of fossil fuels come with significant safety risks. Accidents such as explosions on oil platforms, coal mine collapses, and pipeline leaks have resulted in loss of life, environmental disasters, and long-term health consequences for affected communities. Renewable energy technologies do not pose these dangers. Wind farms, solar panels, and geothermal plants operate with far fewer risks, providing safer alternatives for energy production without the threat of catastrophic accidents [
26].
Renewable energy offers a cleaner, safer, and more sustainable alternative to fossil fuels. It minimizes environmental harm, reduces carbon emissions, and helps combat climate change. Economically, it stabilizes electricity prices, creates jobs, and contributes to the growth of new industries, particularly in developing countries. It also strengthens energy security by reducing dependence on imported fuels and minimizing exposure to political instability. As the world moves toward cleaner energy solutions, renewable energy holds immense potential to reshape the global energy landscape and pave the way for a more sustainable future [
27].
1.6. Research Gap
A major gap exists between the criteria employed by the New South Wales (NSW) Government and the Australian Energy Market Operator (AEMO) for identifying renewable energy zones (REZs) and the concerns expressed by local communities impacted by these initiatives [
9].
Government reports emphasize criteria such as energy resource potential, cost-effectiveness, and proximity to transmission networks. In contrast, community submissions underscore neglected factors, including Aboriginal heritage, conflicts with agricultural and rural land use, and the prioritization of crown land and previously disturbed land for project development [
9]. The disjunction between top-down planning methods and local community priorities has resulted in protests and opposition.
1.7. Project Aim
This research aims to bridge this gap by incorporating community concerns into GIS-based site suitability analysis to select optimal locations for REZs that align with both government and community expectations.
Six objectives have been identified regarding the project aim and project gap.
Table 1 shows the research question aligning with each objective.
2. Materials and Methods
2.1. Research Methodology
Figure 4 illustrates the research methodology. The figure consists of six major steps: (1) criteria selection based on the literature review; (2) identification of criteria and restrictions based on the scenario; (3) allocation of criteria weight based on the contextual scenario; (4) formation of criteria maps and restriction maps; (5) reclassification; and (6) formation of suitability maps through weighted overlay.
2.2. Case Study Reviews
A variety of international case studies have been analyzed to determine the criteria for the multi-criteria evaluation (MCE) process. These studies indicate that each country’s goals and context shape the MCE technique. Due to different nations’ diverse obstacles and aims in renewable energy projects, economic, environmental, social, and technological factors impact criterion selection. Countries with abundant natural resources may prioritize wind speed or sun exposure, whereas those with limited land may prioritize minimizing conflicts with present land uses such as farming or urban areas. National policies, stakeholder interests, and environmental variables influence whether criteria are critical during the review. An analysis of these global examples illustrates that a systematic approach to MCE not only aids in identifying appropriate sites for renewable energy initiatives but also guarantees that the decision-making process incorporates with a variety of viewpoints and aligns with local needs. This customized strategy increases the relevance and effectiveness of the MCE framework in promoting sustainable energy development across diverse regions.
Table 2 looks at eight worldwide case studies, including Thailand, India, Iran, the USA, Saudi Arabia, the UK, and portions of Europe. Every area prioritizes site-specific elements, including slope, height, sun irradiation, and wind speed. For instance, with main factors, including visual effect, ecological disturbance, and human health issues, South Central England emphasizes environmental and social implications. Limited suitable land means the careful balance of conflicting uses, including agriculture and conservation.
On the other hand, studies from Mexico and the USA stress logistical and financial restrictions, such as road accessibility and feeder line building costs. These areas overlay spatial limitations using GIS-multi-criteria decision-making technologies to rank locations depending on economic feasibility and net present value. Thailand has a similar all-encompassing strategy combining geography, wind speed, sun irradiation, land use, physiographic, environmental, and financial aspects. Expert counsel guarantees that certain sites are ideal for the growth of solar and wind energy, therefore addressing the nation’s various topography and climatic conditions. These illustrations highlight how dynamically renewable energy site selection responds to local regulations, objectives, and environmental reality.
A review of GIS-MCDM methods by Watson and Hudson [
28] emphasized the critical role of expert consultation in developing constraints and factor layers in the South Central England context. This approach allows experts to provide context-sensitive insights that guide the weighting process, highlighting high-priority criteria such as environmental and social impacts, including visual impact, ecological disruption, and human health effects. The review underscores the importance of addressing land availability and competing uses, particularly in areas with limited viable land, where minimizing conflicts with food production and conservation is essential. Technological and economic viability are central to site selection, with factors such as wind speed and solar insolation prioritized to optimize renewable energy potential.
Table 2.
Site selection criteria (international case studies).
Table 2.
Site selection criteria (international case studies).
| | Saudi Arabia [4] | Spain [29] | Iran [30] | South Central England
[28] | Songkhla, Thailand
[31] | Chihuahua, Mexico [32] | New York, USA
[33] | India [34] |
|---|
| Water bodies | | | | | ✓ | ✓ | ✓ | ✓ |
| Natural protected area | ✓ | ✓ | ✓ | | ✓ | ✓ | ✓ | |
| Major roads | ✓ | ✓ | ✓ | | ✓ | ✓ | ✓ | ✓ |
| Slope | ✓ | ✓ | ✓ | ✓ | ✓ | ✓ | ✓ | ✓ |
| Elevation | ✓ | | ✓ | | ✓ | ✓ | ✓ | ✓ |
| Aspect | | | | | | | | ✓ |
| Residential areas | ✓ | ✓ | | ✓ | ✓ | ✓ | ✓ | ✓ |
| Wind speed | | | | ✓ | | | ✓ | ✓ |
| Solar radiation | | ✓ | ✓ | ✓ | | | | ✓ |
| Transmission line | ✓ | ✓ | ✓ | ✓ | ✓ | | ✓ | ✓ |
| Transport links | | | ✓ | ✓ | | | | |
| Solar irradiation potential | ✓ | | | | | | | |
| Air temperature | ✓ | ✓ | | | | | | |
| Annual mean temperature | | | | | | ✓ | | |
| Heritage | | ✓ | | ✓ | | | | |
| Distance to substations | | ✓ | | | | | | ✓ |
| Agricultural land | | ✓ | ✓ | ✓ | | | | |
| Airports | | | | | ✓ | | ✓ | ✓ |
| Wild life designations | | | | ✓ | | | ✓ | ✓ |
| Visual impact | | | | | | | ✓ | |
| Distance from the coastlines | | | | | | | | ✓ |
One of the most comprehensive reviews of GIS-MCDM approaches was carried out by Van Haaren and Fthenakis [
33]. They focused on how spatially dependent economic, planning, physical, and ecological factors might drive optimal wind turbine siting in Mexico, United States of America. Their research emphasized the significance of geographical limits, such as federal lands and metropolitan zones, and cost factors, including feeder line development and access road charges. They sought to improve decision-making processes for sustainable wind energy production by using a multi-criteria method that rates locations based on net present value, wind resources, and mitigating requirements.
In Thailand, a detailed set of criteria was created [
31] for site selection of solar and wind farms that focused on the physiographic, environmental, and economic aspects deliberately. This systematic approach was generated from a vast literature review and assurance from experts with their opinions.
Key physiographic factors, such as climate (wind speed and solar irradiance), topography, and land use, are crucial for energy generation viability.
Table 3 turns the emphasis to Australian case studies, looking at sites for renewable energy in Queensland, Western Australia, and New South Wales. With an eye towards water bodies and natural protected areas to conserve ecosystems and guarantee adherence to conservation plans, the criteria reflect Australia’s distinct geography and policy interests. Administrative limits and cultural preservation underline the need to follow jurisdictional rules and safeguard historical assets. Given Australia’s great solar potential and large dry zones, slope and solar radiation are crucial factors in the nation’s choice of renewable energy sites. These elements maximize resource efficiency by helping optimize solar farm location, thus reducing environmental effects. The Australian case studies provide a fair mix of global best practices with region-specific issues, therefore fostering sustainable development in many different local settings.
Table 4 compares site selection criteria, thereby stressing variations in buffer lengths and thresholds over various areas. For instance, water body buffers show different environmental protection problems and hydrological effects ranging from 400 m in England to 7 km in Mexico. Residential area buffers also vary greatly, with differences between rural and urban areas considered in Thailand (e.g., 500 m for rural and 1000 m for urban areas). At the same time, some places choose bigger buffers of up to 10 km to lower noise and visual disruptions. Slope thresholds show even more regional adaptation as solar farms prefer slopes below 10° while wind farms can handle steeper gradients. These variations underline the adaptability of MCE models, which consider geographical restrictions and resource potential to maximize site choice for renewable energy projects.
Table 4 summarizes thresholds and limits from several case studies, consolidating the decision criteria values. These ideals capture local tastes for juggling technological, environmental, and financial considerations. For instance, prioritizing resource efficiency, wind speed limits differ from 4 m/s in England at 100 m above ground to 8 m/s in Mexico. Mexico is found to have “suitable” solar radiation levels of 5.0–5.6 kWh/m
2/day, which offers standards for assessing solar energy potential. A prominent requirement is closeness to substations and transmission lines, usually within 10 km, which emphasizes the need to lower transmission losses and expenses.
2.3. Justification for Criteria Selection in Site Suitability for Renewable Energy Zones (REZ)
Choosing suitable locations for renewable energy production necessitates evaluating many aspects that reconcile technological viability, environmental consequences, and socioeconomic circumstances. The selected criteria (demonstrated in
Figure 5) correspond with worldwide case studies and data-driven approaches to identify the most efficient and sustainable renewable energy zone that adheres to legal standards. Wind loads are crucial for the longevity of photovoltaic (PV) panels and wind turbines; hence, the analysis of wind speed data is vital for mitigating long-term operating hazard risk [
34].
Culturally significant or heritage-listed locations must also be evaluated to conserve historical and Indigenous values, consistent with government policy. Agricultural land is essential for food security and rural livelihoods, necessitating the avoidance of high-value agricultural areas to mitigate conflicts between renewable energy development and agricultural productivity; marginal or underutilized agricultural land may still be appropriate for solar farms [
30]. Employing government-owned crown property facilitates a more efficient clearance procedure, minimizing complexities associated with private property disputes and enhancing alignment with renewable energy goals. Areas with less vegetation are favored for solar farms since they lower site preparation expenses and diminish ecological disturbance; conversely, thickly wooded regions incur expensive removal and pose risks of environmental deterioration. Proximity to transportation networks and primary thoroughfares guarantees logistical efficiency for development and maintenance, minimizing time and expenses while enhancing long-term operational risks [
34]. Regions with elevated sun irradiation are optimal for maximizing energy production. The data set for sun irradiation rates can directly affect the efficiency and prospective output of solar farms [
32]. Safeguarding ecologically sensitive regions, including national parks and protected forests, is essential for preserving biodiversity and adhering to environmental standards, ensuring that locations do not disrupt conservation zones [
32]. Proximity to transportation networks and primary thoroughfares guarantees logistical efficiency for development and maintenance, minimizing time and expenses while enhancing long-term operations. Locations adjacent to the current electrical transmission infrastructure are prioritized to save expenses and decrease power losses, hence improving the project’s overall economic viability [
36]. Expansive tracts of land are crucial for hosting substantial solar panel arrays or wind turbines, enabling more design flexibility and optimization of energy production. Level terrain facilitates installation and enhances energy output. However, inclined surfaces may lead to supplementary expenses; south-facing inclines are especially beneficial because of heightened solar irradiation. The proximity of airports is essential to avert disturbances to air traffic control and radar systems [
30]. The proximity to water bodies might influence environmental approvals, requiring a meticulous evaluation to prevent disruption of aquatic ecosystems, yet it may be advantageous for cooling functions or hybrid initiatives. By circumventing regions of significant wildlife conservation importance, one mitigates adverse effects on biodiversity and adheres to legislation safeguarding endangered species and their ecosystems. Concurrently, leveraging government property can accelerate the approval process and guarantee conformity with overarching public policy objectives. Safeguarding Aboriginal sites and promoting respect for Indigenous land rights is crucial for preserving social and cultural integrity, underscoring the necessity of thorough evaluation to prevent violations of Aboriginal heritage and cultivate community support. Managing the visual effect of renewable energy installations, particularly wind turbines and big solar farms is crucial for maintaining the aesthetics of surrounding landscapes while fostering renewable energy development [
28].
2.4. Geographic Information System
Most of the environmental impacts of renewable energy technologies are directly related to the geographic location of the renewable energy systems and can be reduced by proper site selection. To reduce negative environmental and social impacts, proper site selection analysis must be conducted before adopting renewable energy systems. Identification of environmentally and geographically favorable locations that are associated with the highest potential is, at the same time, a complex decision-making process. GIS provides a wide range of spatial analysis capabilities for site selection problems; thus, alternative locations can be evaluated using GIS tools.
2.5. Multi-Criteria Evaluation Technique
Geographic Information System (GIS) helps display and analyze various types of data to support the decision-making process. Decision-making can involve choosing between alternatives based on different actions, locations, and objectives. This can be classified into two broad categories: decisions related to direct resource use, known as resource allocation decisions, and decisions focused on establishing legislative instruments, known as policy decisions.
Multi-criteria evaluation (MCE) is a methodology by which the relative merits of different options (e.g., solar radio, wind speed) can be compared using a range of quantitative and qualitative criteria [
6]. However, it is used here in a more precise sense [
37]. An objective is understood here to imply a perspective, philosophy, or motive that guides the construction of a specific multi-criteria decision rule. For example, to find a suitable site for a renewable zone, the state government’s objective might be maximizing the usage of natural resources for net zero carbon emissions, while that of a community action group might be rescuing agricultural land for local farmers. The resolution of these different perspectives into a single solution is known as multi-objective decision-making. MCE can support analyzing data based on priority [
6].
MCE is the resolution of differing perspectives into a single solution. Spatial problems typically involve feasible alternatives and multiple, conflicting, and incommensurate evaluation criteria. Using a GIS-MCDA is a process that transforms and combines geographical data and value judgments to solve spatial problems. To do this, it considers geographical data models, the spatial dimension of the evaluation criteria, and decision alternatives in evaluating the criteria.
The GIS-based multi-criteria evaluation (GIS-MCE) process has several critical steps that work together to solve complex spatial decision-making issues. First, it is essential to clearly define the problem, goal, or aim. Next, expert opinions, related books, and historical data are examined to develop standards and limits [
13]. The values for each criterion are then transformed onto a relative scale to facilitate comparison and quantify expert judgments meaningfully. Following this, the importance of each criterion is weighed based on its relevance to the objective and in relation to other criteria. The next step is to combine all criteria layers to develop a study that makes sense. The last step is to analyze and confirm the results to ensure they are solid and accurate. This lets people make smart decisions about space planning.
The integration of GIS-MCE produces advanced overlay approaches to select the most suitable site. The decision rules can be divided into multi-objective and multi-attribute decision-making methods. In the multi-objective method, the alternatives are generated by taking the factors and constraints into consideration. Criteria are commonly measured by a numerical scale, which is continuous (slopes, distance, altitudes, climatic factors) or discontinuous (land use, physical or administrative boundaries) [
28]. The relative importance of the criteria is represented by using weights and the performance of the land use under consideration for each criterion, represented as a score or suitability class. Weights can be assigned subjectively or objectively by using expert opinion in a pairwise comparison method or a fundamental component analysis of yield-determining factors.
2.6. Data Collection and Preparation of Geo-Database
Figure 6 represents the functional flow of the data collection and data processing method used in this study. The various steps of geoprocessing functionalities, such as data collection, data conversion, criteria proximity, raster classification, weightage assignment, and weighted overlay analysis, are used in a systematic approach. There are two different types of data: secondary data and collateral data. The collateral data are primarily climatic data, such as solar irradiation, wind speed, and annual mean temperature. The secondary data are the spatial data, such as land use and land cover, transportation network, digital elevation model, existing transmission line, and the energy generation and storage system. Different types of data have been collected from various data sources, such as governmental resources, international databases, and satellite images. The data sources have been digitally converted and geographically referenced to the EPSG:4326—WGS 84 projection and coordinate system following the state boundary dataset collected from the government data website.
Table 5 outlines the data type, data sources, and parameters used in the MCA: weighted overlay analysis in QGIS. The solar radiation, annual mean temperature, and wind speed data were collected from the Australian Bureau of Meteorology. The digital Evaluation Model was derived from SRTM NASA Earth data. The land use and land cover data were collected from the NSW SEED data portal. All the transport network data were collected from the TfNSW open data portal. The criteria values, shown in one of the columns of
Table 5, were meticulously determined from the case studies considered in the literature review, ensuring their validity and relevance to the Australian geographical context.
The data sources used in this study closely align with those utilized by the NSW state government in their site selection process [
9]. The majority of the datasets used in this study were sourced from government repositories and other acknowledged websites. Utilizing these authoritative sources enhances the credibility of the analysis and provides a robust framework for evaluating site suitability in line with existing governmental practices.
2.7. Software Used for This Study
GIS software is a specialized program designed to help users capture, manage, analyze, model, and visualize spatially referenced data to address complex planning and management issues. In this study, QGIS 3.34.0 has been utilized to analyze various spatial datasets to identify potential zones for renewable energy and determine appropriate sites. QGIS offers a range of geoprocessing tools, including georeferencing, digitization, layer creation, attribute tables, spatial analysis, 3D analysis, interpolation, query tools, and data management capabilities. This software may be used for almost any geoprocessing activity. To guarantee accurate and dependable results, QGIS, for instance, may be trusted to generate thematic layers that include geometry, topology, and characteristics for possible zones [
37].
2.8. Weighted Overlay Analysis
The weighted overlay analysis is a valuable decision-making tool involving multiple criteria. This study uses raster weighted overlay analysis to integrate various environmental factors to determine zones with potential for renewable energy generation. Each factor is assigned a weight based on its suitability for energy generation. The weighted layers may require a series of geoprocessing tasks and data format conversions to facilitate the analysis. In raster overlay analysis, each cell in the layers must correspond to the exact geographic location, effectively combining multiple layers into a single output layer. In this analysis, numeric weight values are assigned to a specific thematic layer’s cells, allowing for mathematical combinations to generate new values for the corresponding output layer pixels. The weighted overlay analysis uses a standardized scale to evaluate the multiple thematic layers, producing a single output layer [
25]. Weights are defined on a scale from 1 to 3, where classes with the highest potential are given a weight of 3, and those with the least influence receive a weight of 1. All the feature classes have been assigned individual weights based on suitability, contributing to an overall ranking for each cell. Total weighted index values are calculated by multiplying the scale weight by the percentage of influencing weight assigned to each parameter using a raster calculator tool. The percentage of influencing weight for each parameter is determined by its direct or indirect impact on energy generation [
29]. The total of these percentage values across all parameters in the weighted overlay analysis must equal 100%. Each layer is assigned scale weight values for creating a weighted raster layer. Preference values are assigned also to feature classes within individual layers and across layers with similar influences. For instance, a larger scale weight is allocated to the feature class with more significant influence in one layer, while another layer’s most influential feature class also receives a higher weight. Consequently, a greater percentage of influencing weight is designated to the primary contributing layer among all other layers [
37].
2.9. Assigning Weights and Weighted Overlay Analysis
The methodology of the criteria weighting was followed by the assessment submission report published by the Department of Planning, Housing, and Infrastructure in June 2024 [
11,
38]. This report summarizes a public exhibition presented by the Department of Planning, Housing, and Infrastructure for the local community; 374 public submissions were received, with 366 unique submissions and 21 submissions from special interest groups. Among the submissions, 351 people objected, 13 gave comments, and 2 supported. The key matters raised in submissions are summarized in
Table 6.
The geographic database of the feature class within a layer serves as the primary key for determining the appropriate scale weight based on its impact on the rate and success of renewable energy generation. Following this, each thematic layer is assigned a corresponding weight based on its contribution to socioeconomic renewable energy projects and socioeconomic and environmental impacts (see
Table 7).
This study’s criteria have been weighted by integrating insights from the government report and international case studies. The government report provided specific weights for some criteria used directly. For criteria without explicit weights, their importance was inferred based on the emphasis and discussion within the report. Additionally, case studies were analyzed to determine the frequency and significance of each criterion mentioned. Criteria frequently highlighted as critical were assigned higher weights. Two methods were considered to combine the weights from both sources: averaging the weights and assigning a higher weight to the more reliable source. For example, if the government report assigned a 20% weight to “wind speed” and case studies suggested 10%, the combined weight would be 15%. Alternatively, if the government report was deemed more reliable, it might be given 70% influence and the case studies 30%, resulting in a combined weight calculated as follows:
This comprehensive approach ensures a balanced consideration of local community feedback and international best practices, providing a robust foundation for the multi-criteria evaluation analysis.
The GIS platform is effectively used to demarcate the potential renewable energy zone by integrating multiple weighted parameters [
37]. In this study, various parameters and their related feature classes are allocated suitable scale weights and percentages of influence, reflecting their potential impact on renewable energy zones. This is described as the range of scale weight assigned to the feature class from 1 to 3, in which the maximum scale weight value (3) is assigned to the feature class that represents as highly suitable for contributing to the potentiality of a renewable energy zone, and the minimum scale weight value 3 is assigned to the feature class as the least suitable one (
Table 8). The different feature classes within a thematic layer are allocated distinct scale weight values based on their potential impact on energy generation. Afterward, each thematic layer is given a percentage of influencing weight value that reflects its direct or indirect effects on the energy generation rate. Residential, agricultural, and farmland land use are given high influence factors based on their distance from the renewable energy zone considering their social effects. On the other hand, transport networks are given less importance regarding their economic effect on investors.
3. Results
This study has identified the optimal location for renewable energy zones using GIS and multi-criteria evaluation (MCE) methods by applying weighted overlay analysis. Selection criteria weighting is prioritized based on the community session report published for the Central Orana renewable energy zone and the literature review, following the best practices in international and local contexts. The rasterized layers of the selected criteria are shown in
Figure 7 and
Figure 8. Each layer was reclassified based on values shown in
Table 7 and weighted according to its social, environmental, and economic impacts found in the literature review. Using QGIS geoprocessing tools, such as the raster calculator, influence values were assigned to each criterion, and a final suitability map was generated.
Figure 9 shows the completed suitability map, which splits the land into three groups: Highly Suitable, Moderately Suitable, and Not Suitable. According to the study, “Highly Suitable” areas cover about 175,025,973.76 square meters, which makes them a great place for targeted green energy growth.
Table 9 shows that “Not Suitable” areas cover 55,749,335.75 square meters, and “Moderately Suitable” areas cover about 11,709,879.76 square meters. These numbers show the limits that environmental and community worries put on development. The total area that this study says is good for REZ growth is smaller than what the New South Wales Government says it should be. This distinction can be attributable to a few important factors:
This study focuses more on social and environmental restrictions, such as proximity to residential areas, agricultural land, and historical landmarks. While the NSW Government considered these variables, it may prioritize them differently or use larger standards to maximize the REZ area. In contrast, the criteria for this research are more stringent, with the goal of minimizing potential disputes with residents while also preserving environmentally important places. This research weighed underrepresented elements, such as visual impact, noise pollution, and effects on agricultural land, more seriously than the state’s broader criteria. As a result, places that might theoretically sustain renewable infrastructure were eliminated from our research if they caused significant socio-environmental conflicts, limiting the total area categorized as appropriate.
The methodology used in this study relies on more resilient buffers to preserve residential, heritage, and conservation areas, resulting in a smaller REZ area. The NSW Government’s designations may imply that technological and operational changes may control or minimize certain concerns, such as noise and visual effects.
This research, however, limits the appropriateness in sensitive regions to prevent post-development problems and community opposition, resulting in a smaller but perhaps less problematic REZ.
In essence, whereas both strategies aim to support sustainable energy targets, this study’s appropriateness evaluation results in a smaller REZ area by prioritizing social and environmental compatibility over technological viability. The modified criteria, designed to combine energy development with local values, highlight the necessity of a community-centered approach to site selection in ensuring long-term project success.
Comparison of NSW Proposed REZs and GIS-Resulted Suitable Sites
This study emphasized social criteria based on the Australian Energy Market Operator’s (AEMO) submission report. Adjusting the influence percentage of each criterion has led to the identification of more suitable locations for renewable energy production. For instance, as mentioned, in Thailand [
31] (
Table 7), the focus was on economic benefits, assigning the highest weight to proximity to roads to reduce construction and amenity costs. Similarly, in Mexico [
32], greater emphasis was placed on geographical aspects to enhance energy generation and profitability. The renewable energy zone in the Central-West Orana district [
37] aimed for similar objectives but faced local opposition due to concerns about environmental and social impacts. This study addresses these concerns by incorporating social and environmental benefits, such as agricultural land use, residential areas, visual impact, and natural conservation, thereby validating our approach.
NSW’s renewable energy zones (REZs) are deliberately positioned across varied geographical landscapes, utilizing locations with significant natural resource potential and considering present infrastructure and land use patterns. The Illawarra renewable energy zone (REZ) is in a distinct location that combines marine and industrial characteristics with urban and rural surroundings (
Figure 10). This strategy focuses on modernizing industrial locations and exploiting existing transportation and port infrastructure to position them for green hydrogen generation and efficient port connections. Being close to the HumeLink transmission project provides significant advantages, particularly in energy distribution to essential load areas. Meanwhile, the New England REZ, positioned in a hilly and elevated region, offers excellent wind resources and opportunities for pumped hydro development. The area features notable elevation variations and is near crucial transmission lines linking New South Wales and Queensland, which has drawn considerable interest from investors. The Southwest REZ stands out with its flat land, wide-open views, and abundant wind and solar resources, which make it a prime location for large-scale projects. These geographical characteristics allow for easier development, with few topographical obstacles and a strong connection to current and future high-voltage transmission networks. The Central-West Orana REZ, Australia’s first renewable energy zone, has semi-arid plains and rolling hills. This location offers abundant open areas appropriate for the construction of solar and wind energy projects, while also promoting economic benefits for local communities.
The findings of this study specifically concentrate on the Far West region of NSW, along with other areas that have been prioritized for their socio-environmental compatibility. The Far West features arid and semi-arid landscapes marked by sparse vegetation and flat terrain. While these conditions are not ideal for intensive agriculture, they present significant opportunities for solar and wind energy development, as there are minimal land-use conflicts to consider. The area has low precipitation levels and features several significant rivers, including the Darling and Murray, which are located far from many possible development sites. The study has identified additional suitable areas, which are mainly crown lands characterized by low topographical variation and minimal ecological constraints. The selected areas are characterized by gentle terrain and a considerable distance from urban centers, which helps mitigate visual and auditory disturbances while preserving ecological integrity.
4. Discussion
This study demonstrates how well GIS-based multi-criteria evaluation (MCE) works to determine the best renewable energy zones (REZs) in New South Wales by weighing environmental priorities, community interests, and technical viability. The suitability map produced by this study shows that a more sophisticated, weighted method can greatly improve REZ planning in line with Sustainable Development Goal 7 (SDG 7) for affordable and clean energy. However, like any spatial assessment study, the approach taken brings up significant issues that could affect how the findings are interpreted and applied.
4.1. Relation of Selected Criteria with SDG’s
A balance between technological efficiency, environmental protection, and socioeconomic sustainability is ensured by the criteria chosen for selecting renewable energy sites, which strongly correlate with numerous Sustainable Development Goals (SDGs). Increasing energy output, improving the efficiency of renewable energy projects, hastening the switch to cleaner energy sources, and emphasizing the ideal wind speeds and solar irradiance help address SDG 7 (Affordable and Clean Energy) [
39]. Preserving ecosystems and reducing adverse effects on animal habitats, protecting environmentally sensitive areas—such as national parks and biodiversity hotspots—assist in addressing SDG 15 (Life on Land). Similarly, using marginal or underutilized land guarantees responsible land use, while avoiding high-value agricultural land supports SDG 2 (Zero Hunger) by protecting fertile regions necessary for food production.
Protecting Indigenous and historical values, promoting social inclusion, assisting in sustainable urban and rural development, and respecting culturally significant and heritage-listed places assist in achieving SDG 11 (Sustainable Cities and Communities). Project approvals are accelerated by using crown land, which supports SDG 9 (Industry, Innovation, and Infrastructure) and SDG 17 (Partnerships for the Goals), encouraging cooperation between the government and renewable energy providers. SDGs 7 and 9 are addressed by strategically placing existing transportation linkages and transmission infrastructure close by, which lowers costs and improves system resilience [
40]. SDG 10 (Reduced Inequalities) and SDG 16 (Peace, Justice, and Strong Institutions) support equity and inclusion by safeguarding Aboriginal history and promoting respect for Indigenous land rights.
SDGs 11 and 15 are advanced by controlling visual effects and avoiding heavily wooded regions, which also promote community acceptance and environmental integrity. Including these components guarantees that renewable energy zones are not only financially and technically possible but also ecologically sustainable and socially inclusive, directly supporting the worldwide sustainable development aim.
4.2. Social, Environmental, and Economic Criteria Relevant to Community Concerns
In New South Wales, the social, environmental, and economic factors that represent community goals and concerns are organically linked to selecting locations for renewable energy zones (REZs). Building public trust and support for governmental initiatives requires careful study of social factors. Protecting culturally important and heritage-listed places is essential for keeping Indigenous and historical values alive, supporting Aboriginal land rights, and avoiding cultural disagreements. Taking care of the visual effects of green energy projects such as wind turbines and huge solar farms is also helpful for keeping the beauty of nearby areas. This step is important for maintaining community support and lowering the reluctance to see things differently.
Environmental concerns try to lower biological effects by staying away from areas that touch national parks, protected woods, or other areas with lots of different kinds of plants and animals. While choosing sparsely vegetated terrain helps decrease the requirement for land preparation, decrease costs, and limit ecological damage, protecting water bodies and aquatic ecosystems is essential to ensure environmental sustainability. Crown land is a better choice for REZ development because of its less complicated regulations and environmental compatibility. In addition, providing south-facing slopes and flat terrain as a priority maximizes energy output and lowers land modification, ensuring the efficient and sustainable use of the land. The absence of significant agricultural land highlights the need to find a balance between the expansion of renewable energy, and rural livelihoods and food security.
The viability and effectiveness of REZ planning depend heavily on economic factors. Being close to existing electrical transmission infrastructure and transportation linkages minimizes power losses and construction and maintenance expenses. Government-owned property streamlines approval procedures and removes the hassles associated with private land disputes, while large land tracts permit design flexibility and energy production optimization. When taken as a whole, these standards provide a thorough method for matching technical, environmental, and community-focused concerns with REZ site selection.
4.3. Geo-Design Framework and Stakeholder Engagement
Geo-design is an emerging method of designing and making decisions in urban and regional planning that comes from the geographical sciences. Steinitz [
20,
41] came up with an operational framework for geo-design (GDF). The goal is to understand how the territory changes over time, as well as the opportunities and risks of development. This information then guides the design of possible future states or courses of action. The framework also includes a look at the possible effects of change, which should help with negotiations while decisions are being made in a joint and dynamic way [
42]. Different collaborative planning models use different types of involvement, such as building, working together, sharing values and interests, mediating, negotiating, and reaching an agreement, to identify what parts of participation should be included [
41].
Because real-life situations are so complicated, we need to use interdisciplinary and transdisciplinary methods that bring together experts from different areas to help us make better decisions. The ideas and tools of geo-design might work well for these complex, diverse projects [
20].
We recommend using a geo-design framework in New South Wales’s REZ planning for future projects and studies that could lead to a more open and inclusive process, which would be especially helpful for dealing with political and social problems. To maybe calm down NIMBY [
38] concerns, this method encourages ongoing stakeholder participation and gives the freedom to change site selection criteria based on comments from the community and policymakers. By letting everyone have a say in the decisions, this approach might encourage more people to support renewable energy projects and make the switch from traditional to green energy sources easier.
Carl Steinitz’s model six-level geo-design framework [
20,
41] includes crucial phases that complement technical analysis and community values, resulting in a thorough method for choosing locations for renewable energy zones (REZs). To provide an accurate representation of the research region, the first step is the Representation Model, where pertinent geographical data is gathered, including solar irradiance, wind patterns, transmission line locations, population density, and land-use classifications. The basis for the examination of possible REZ locations can be provided by Geographic Information Systems (GISs), which enable the integration of spatial data layers that represent social and physical elements. We adapted a geo-design framework for REZ planning, as seen in
Figure 11, and propose this for future studies/projects.
The Process Model subsequently employs multi-criteria evaluation (MCE) approaches to analyze the processes that affect site appropriateness. This model evaluates the effects of several factors regarding site appropriateness, including transmission infrastructure, environmental impact, and proximity to residential areas. To balance social, environmental, technological, and economic considerations throughout the decision-making process, the Analytical Hierarchy Process (AHP) [
4,
30] can be utilized to assign relative significance to each criterion. The Evaluation Model then combines the weighted layers from the Process Model to provide a suitability map that shows regions that are either highly appropriate, moderately suitable, or unsuitable for the growth of renewable energy. This approach facilitates stakeholder interaction, supports scenario-based planning, and permits flexibility in modifying criterion weights by offering a visual depiction of possible REZ locations.
The Change Model allows for incremental modifications to the decision-making process in response to new information or changing priorities. For example, the model might give aesthetic concerns more weight in later assessments if new rules place an emphasis on reducing visual effects. This flexibility guarantees that the geo-design framework will continue to be responsive to shifting community concerns as well as policy changes. Each REZ scenario’s possible social, economic, and environmental effects are forecasted in the Impact Model. This phase provides a thorough grasp of the possible advantages and difficulties for each location by assessing the wider effects of renewable energy development, such as the creation of jobs, the reduction of emissions, and possible land-use disputes.
Comparison with Existing Framework
The Renewable Energy Planning Framework consists of various policies aimed at improving how we plan and evaluate renewable energy projects. Its objectives include offering more transparent assessment processes, helping the industry make well-informed investment choices, and ensuring that communities impacted by these projects can engage in meaningful discussions. The framework also establishes clear guidelines regarding setbacks and impact criteria, clarifies the costs associated with decommissioning solar and wind projects, and offers support to applicants and landowners who wish to host energy infrastructure. Ultimately, it seeks to guarantee that the benefits of energy development are felt directly by the local areas and regions that accommodate these initiatives.
Although the NSW Renewable Energy Zone (REZ) [
43] Framework emphasizes the need for community involvement as an essential concept, it lacks specific approaches or precise processes to operationalize this commitment. The framework emphasizes the need to consult affected populations and fair distribution of benefits. However, it does not provide a clear road map or tools for allowing notable participation. This absence leaves a void in ensuring that community issues such as effects on agricultural land, biodiversity, or visual aesthetics are sufficiently addressed during the planning and development stages.
By contrast, the geo-design framework emphasizes the need for community involvement and offers specific means to reach it. GIS-based spatial analysis, participatory planning instruments, and scenario modeling help communities see effects, evaluate development options, and actively engage in shaping project outcomes. The geo-design framework allows users to assess different options for benefit-sharing techniques, changes to REZ borders, or routing of transmission lines, making the engagement process more transparent and practical. This capacity fills the void in the NSW REZ Framework [
43] by providing a methodical, data-driven means of community consultation that builds confidence and cooperation while making sure projects complement local goals and environmental sustainability.
4.4. Political and Institutional Barriers to Renewable Energy Development
Partisan politics can have a big effect on the process of choosing where to put green energy projects in countries such as Australia, where government is split into complicated federal, state, and local areas. Creating a unified energy strategy can be hard because different levels of government have shared tasks, different political views, and goals that are at odds with each other. Different motivations and the fact that some states can not receive future funds, can lead to policy goals that are at odds with each other at the federal and state levels. This can delay or change the licensing of green energy projects. Policy changes that impact site selection can also result from political discourse, including discussions about environmental effects, economic growth, and energy security. For example, federal governments may put national energy security ahead of local interests, while local communities and regional governments may oppose projects because of worries about land usage, aesthetic effects, or social acceptance [
39]. These political conflicts may lead to less-than-ideal choices, such as the postponement, obstruction, or relocation of renewable energy projects to less advantageous sites. Countries such as Germany have been able to move past these problems with the help of the European Union (EU) and coordinating policy frameworks, even though their government systems are similar. This has made the switch to green energy smoother than Australia’s.
4.5. Relevance of Findings to Emerging Policy
The NSW Department of Planning, Housing, and Infrastructure published its Renewable Energy Planning Framework (2024), which fits several important facets of this study as it approaches completion. The framework emphasizes the need for visual impact studies, a suggestion our research has shown to be highly essential in reducing community resistance to renewable energy projects [
43]. Furthermore, even if this study underlined the limitations of agricultural land usage, the framework presents a reasonable view as grazing and cropping may go beneath transmission lines, thereby reducing the hazards to agricultural output. A major tenet of the geo-design method suggested in this research, early and proactive community involvement is also stressed in the framework. This relevant policy direction validates the requirement of creative approaches to renewable energy zone (REZ) development and supports the significance of participatory and spatially informed planning methodologies. These advances show how NSW’s renewable energy strategy is always changing and helps close the gaps between research and application.
Table 7 comprehensively summarizes the criteria layers, their references, combined weights, and influence percentages. By analyzing this table, we can demonstrate how altering the weights of specific criteria affects the site selection outcomes.
For example, consider the criterion “solar radiation”, which has a combined weight of 26.75 and an influence percentage of 13.14%. If we increase the weight of “solar radiation” by 20%, the new combined weight would be as follows:
This increase would result in a higher influence percentage for “solar radiation”, thereby prioritizing sites with higher solar radiation in the suitability analysis. Conversely, decreasing the weight would reduce its influence, potentially altering the ranking of suitable sites.
By adjusting the weights of specific criteria, the model can be tailored to reflect different policy goals, demonstrating its adaptability to changing priorities.
4.6. Future Recommendations
This study has conducted a generalized analysis of environmental factors, such as wildlife conservation and natural heritage, in the site suitability evaluation for renewable energy zones (REZs). While it highlights key considerations, future research could focus on detailed case studies to explore specific ecological trade-offs, such as the impact of wind farms on bird species or habitat fragmentation caused by solar farms. Investigating mitigation strategies for these trade-offs would provide a more comprehensive understanding of how to balance renewable energy development with ecosystem preservation.
Furthermore, this study focuses on mapping two renewable energy sources, solar and wind, due to their abundance in New South Wales, as identified in the AEMO Integrated Plan. While other renewable energy sources, such as water, bioenergy, and geothermal energy, are also recognized for their potential, they are beyond the scope of this study. We acknowledge the importance of these additional sources, particularly geothermal energy, which holds promise for applications such as home heating and power generation from the Earth’s mantle heat. Future research could expand to include these other renewable energy sources, providing a more comprehensive assessment of New South Wales’ green energy potential.
5. Limitations
While this study provides interesting data on the socioeconomic and environmental impacts of planned renewable energy zones (REZs) in New South Wales, extra investigation can increase the study’s comprehensiveness in several areas.
The primary drawback influencing the study’s scope was the lack of specific datasets. Although the study considered the geographical data on land use, environmental variables, and socioeconomic indicators that were easily accessible, more specific information—such as real-time land-use changes, infrastructure capacity, and finer-scale environmental hazards—was not available. More accurate outcomes would have been feasible with the inclusion of such data, particularly about the integration of renewable energy zones into networks of current infrastructure.
Furthermore, the limited computing power for this study meant that it was not possible to look at extremely large amounts of data at a greater level. As a result, tech limitations made it hard to do some complex studies, especially those that needed a lot of regional models. To help people make better decisions, the study might have looked at more complex, higher-resolution models or used more advanced computer tools to investigate a wider range of possible places.
Another important issue that was not considered was how areas that are likely to flood and burn down would affect the site selection process. These natural factors are necessary to judge how strong and safe new green energy technologies are in the long run. These requirements would guarantee that REZs are situated in regions that reduce possible threats to energy production and infrastructure, better supporting environmental sustainability and public safety objectives.
Future research is still needed to determine the economic feasibility of smaller renewable energy facilities. The research did not evaluate how the size of a planned REZ may affect energy production capacity, investment feasibility, and cost-effectiveness, despite its focus on environmental and socioeconomic concerns. Smaller sites would have trouble attracting investment or realizing economies of scale, which might affect their ability to reach long-term energy production targets and remain financially viable.
This research did not thoroughly examine how renewable energy projects, especially smaller REZs, would fit into the current electricity grid architecture in New South Wales. Examining aspects such as grid capacity, transmission efficiency, and required infrastructure upgrades would help one better appreciate the technical feasibility and long-term sustainability of these initiatives.
Despite these negative aspects, the research offers interesting data on the geographical elements needed to expand community-owned renewable energy projects in New South Wales. If future studies have access to additional information and more computational capability, they may build on this work to provide a more complete framework for the efficient deployment of renewable energy zones.
6. Conclusions
The New South Wales Government’s proposed renewable energy zone (REZ) site selection process has emphasized the economic benefits and technical aspects considering the government and investors’ profits. However, many sensitive elements, such as socioeconomic and environmental concerns, have been overlooked. Factors such as Aboriginal heritage, land use conflicts, and community acceptance are essential for the long-term success of renewable energy generation projects. The gap created by aspect prioritization has led to challenges in aligning renewable energy planning with both government targets and community expectations.
This study aimed to bridge the gap by integrating underrepresented social and environmental criteria into a GIS-based multi-criteria evaluation (MCE) framework to identify optimal REZ locations that balance technical, social, and environmental priorities, such as agricultural land use, heritage preservation, visual impact, and biodiversity protection. For flexibility in prioritizing, weighted overlay analysis was employed to evaluate site suitability and balance government benefits and community concerns.
This study reveals that prioritizing social and environmental criteria may reduce the size of suitable areas compared to NSW’s proposed areas. The “Highly Suitable” areas are in the far west of NSW, covering 55,029.76 square kilometers. Due to their proximity to infrastructure, these areas may not be economically viable, but they can bring significant advantages to the community. The study recommends adopting a collaborative geo-design framework to incorporate stakeholder input and refine REZ planning. Using the geo-design framework, which merges GIS with participatory planning tools, might improve community involvement and decision-making processes. This approach minimizes conflicts, ensures environmental conservation, and fosters community acceptance.
The implementation of a GIS-based and stakeholder-inclusive planning process can enhance the site selection process for a renewable energy zone by addressing socioeconomic factors alongside technical feasibility. This strategy aligns with the Sustainable Development Goals, especially SDG 7, and promotes a balanced transition to renewable energy, contributing to NSW’s net zero emissions target while preserving community and ecological integrity.


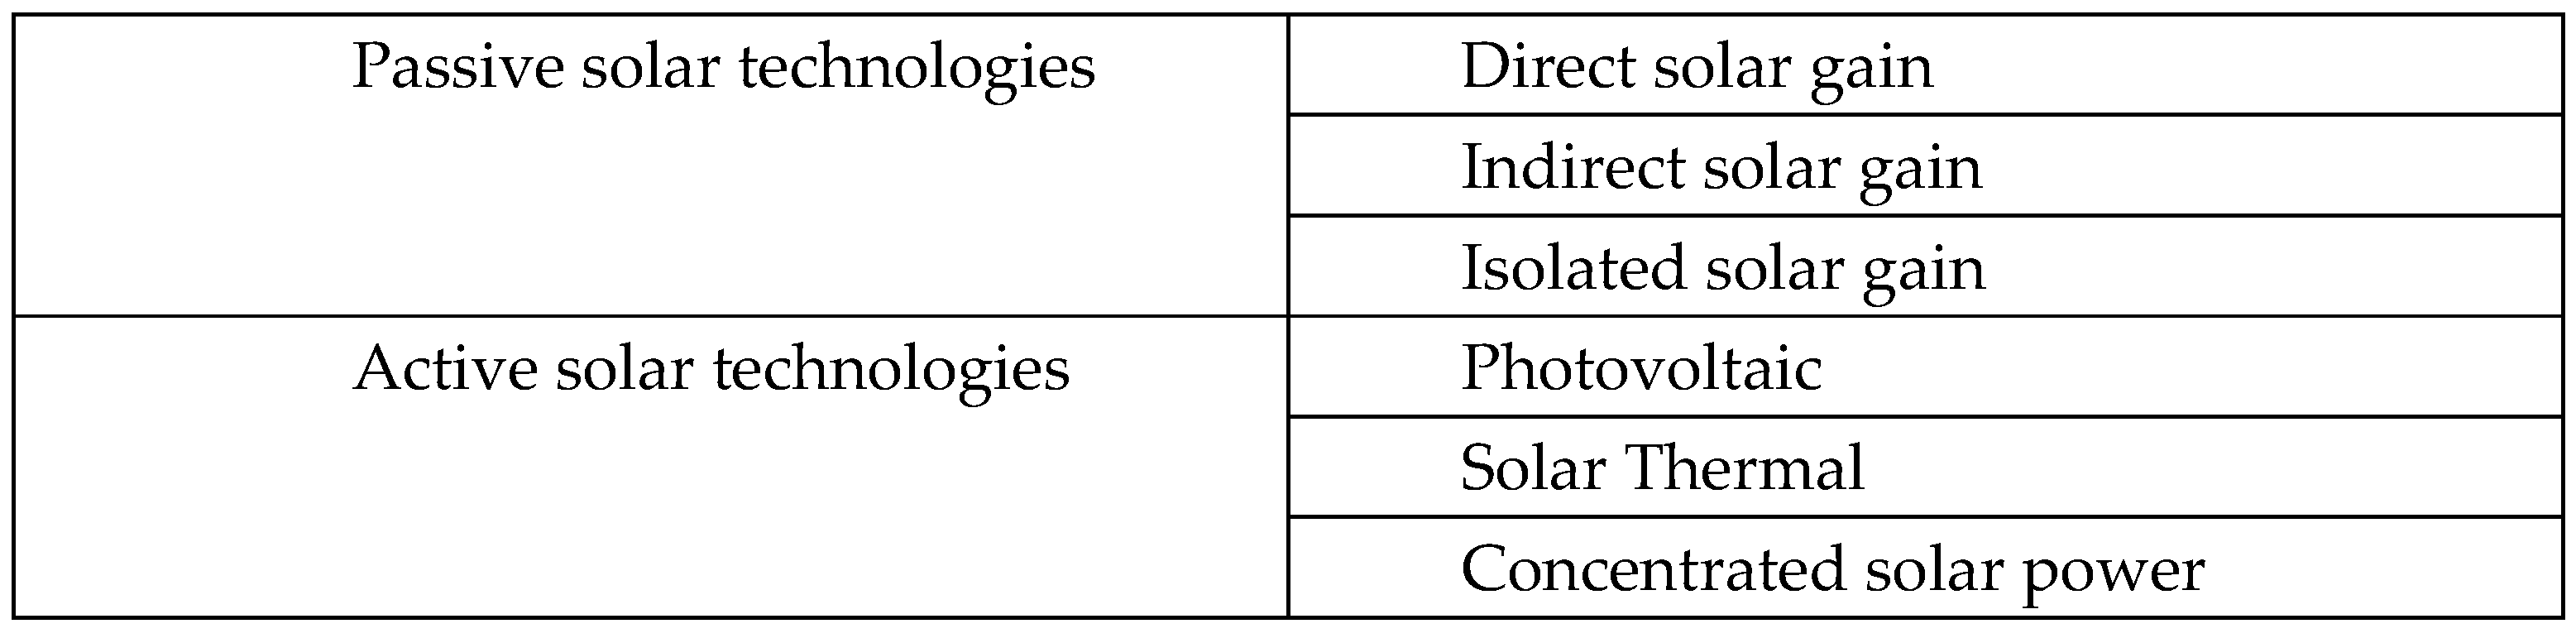
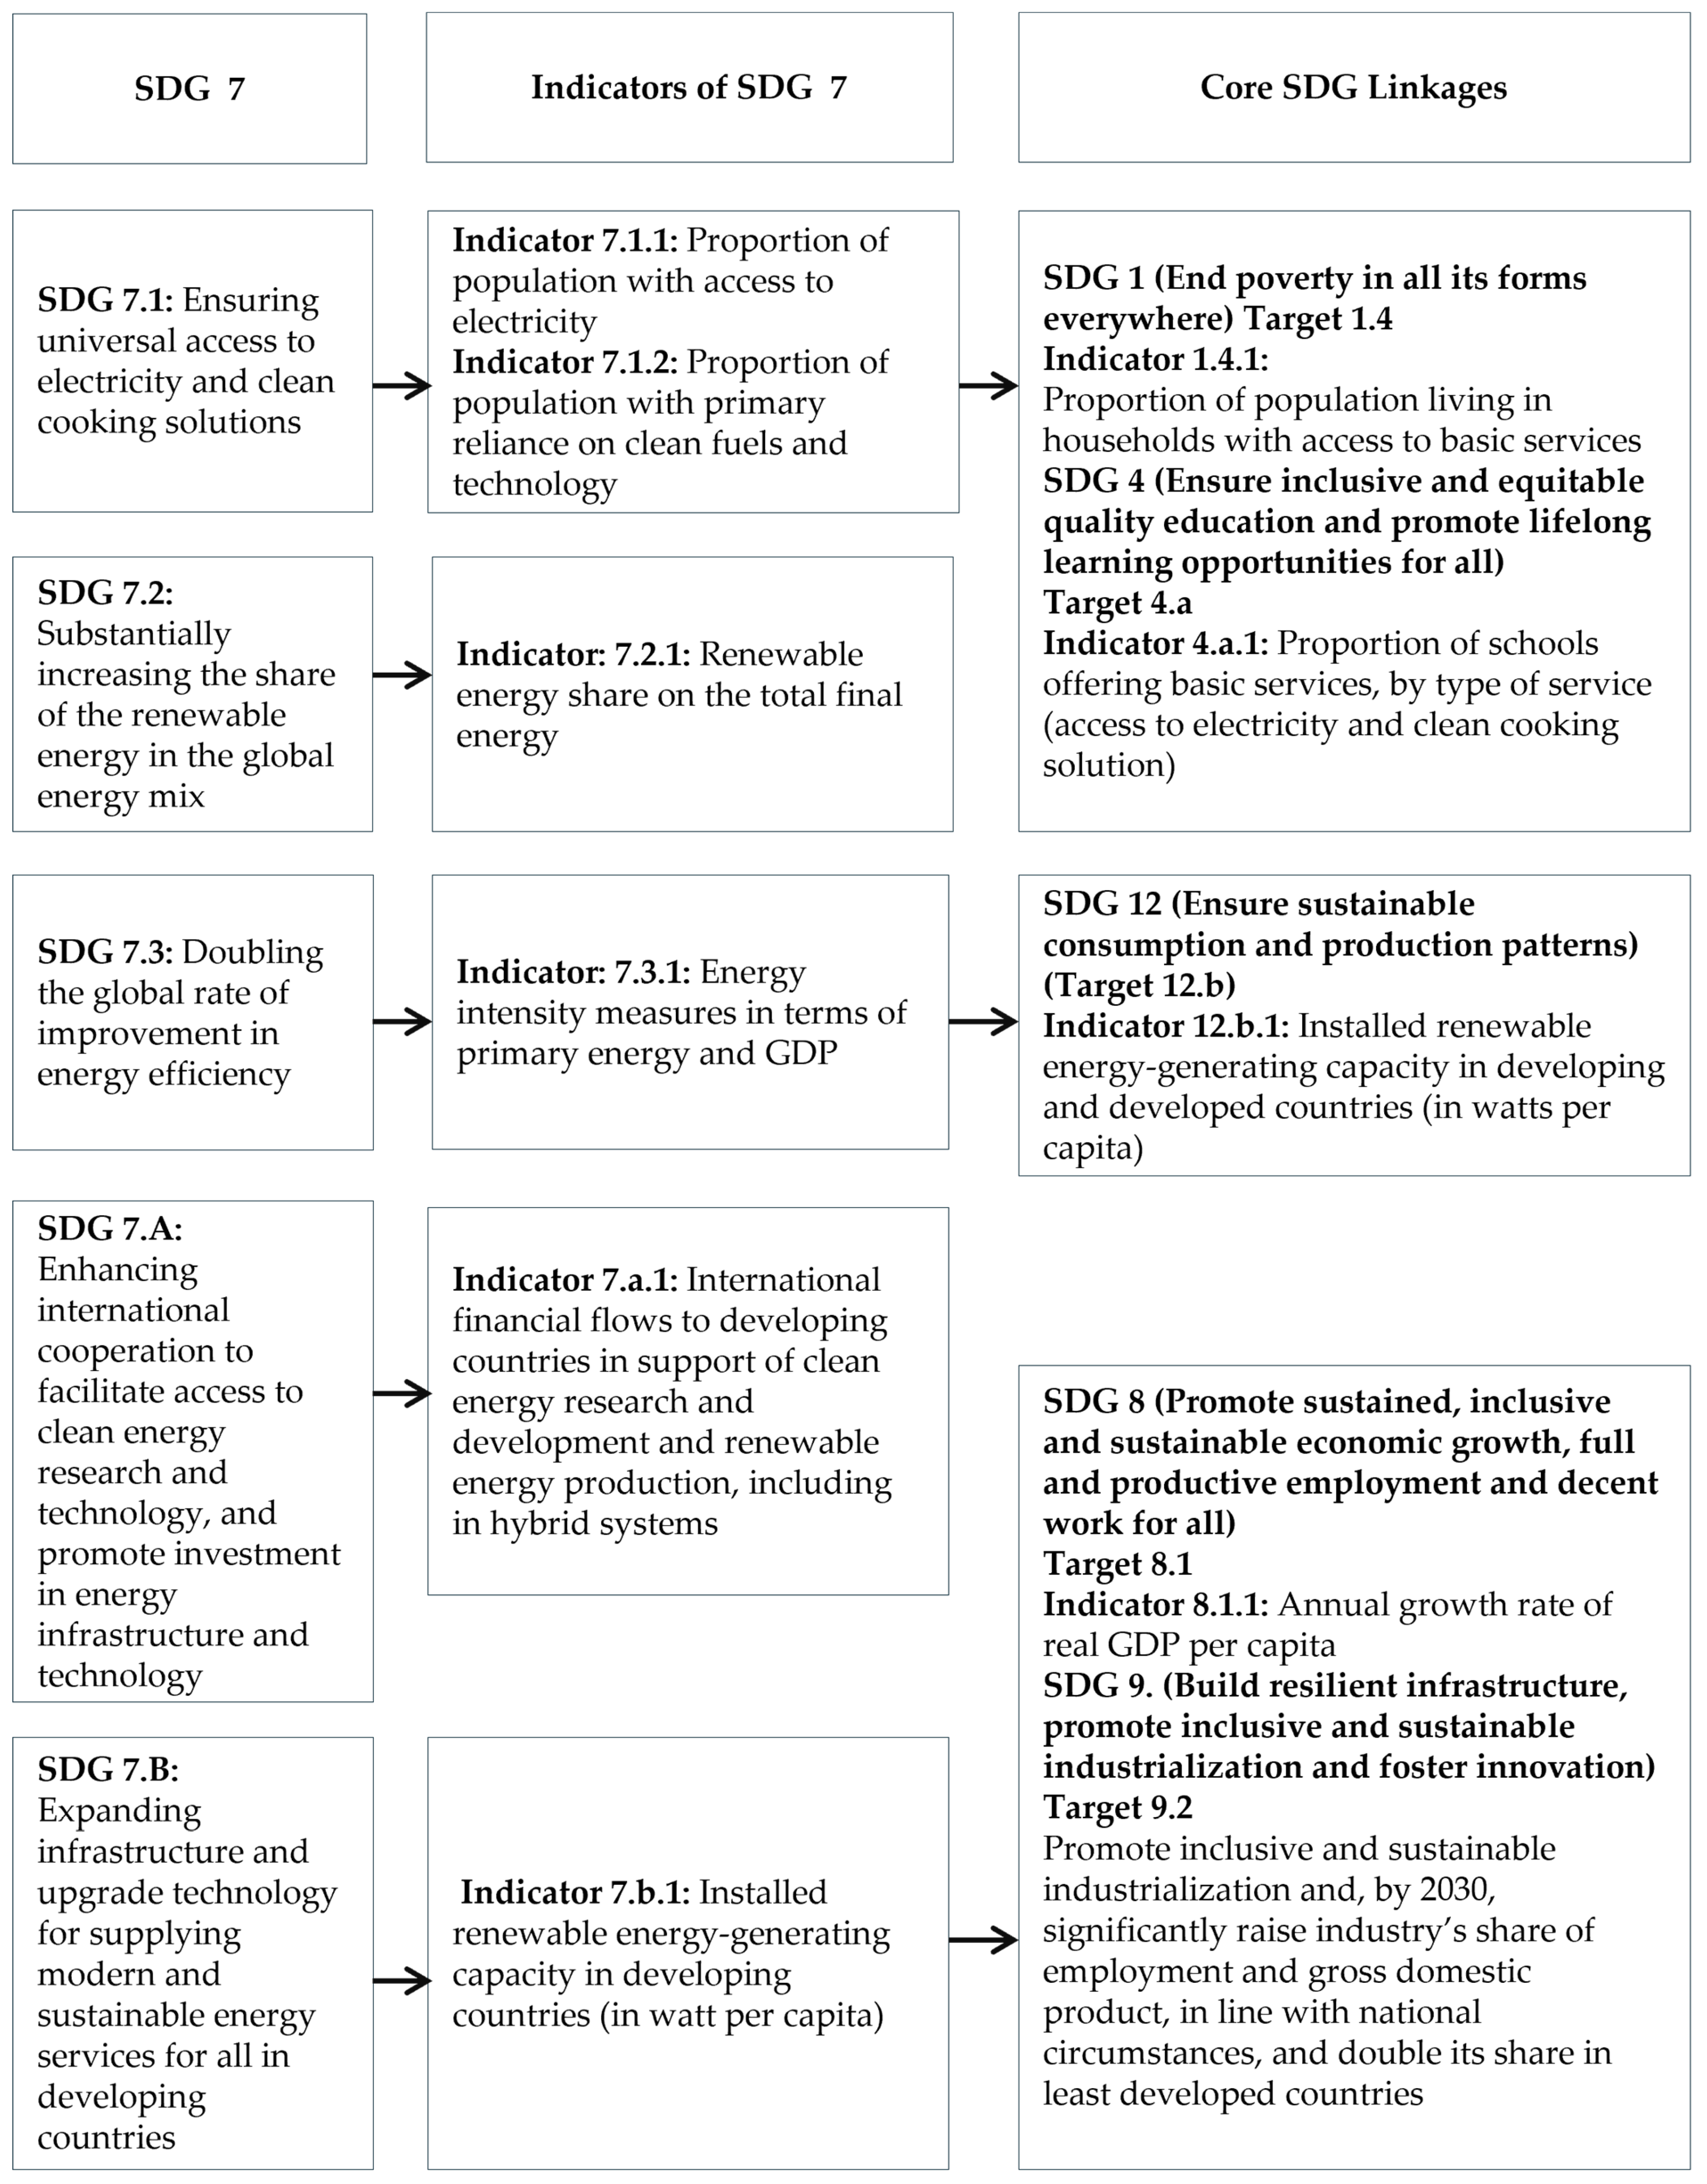
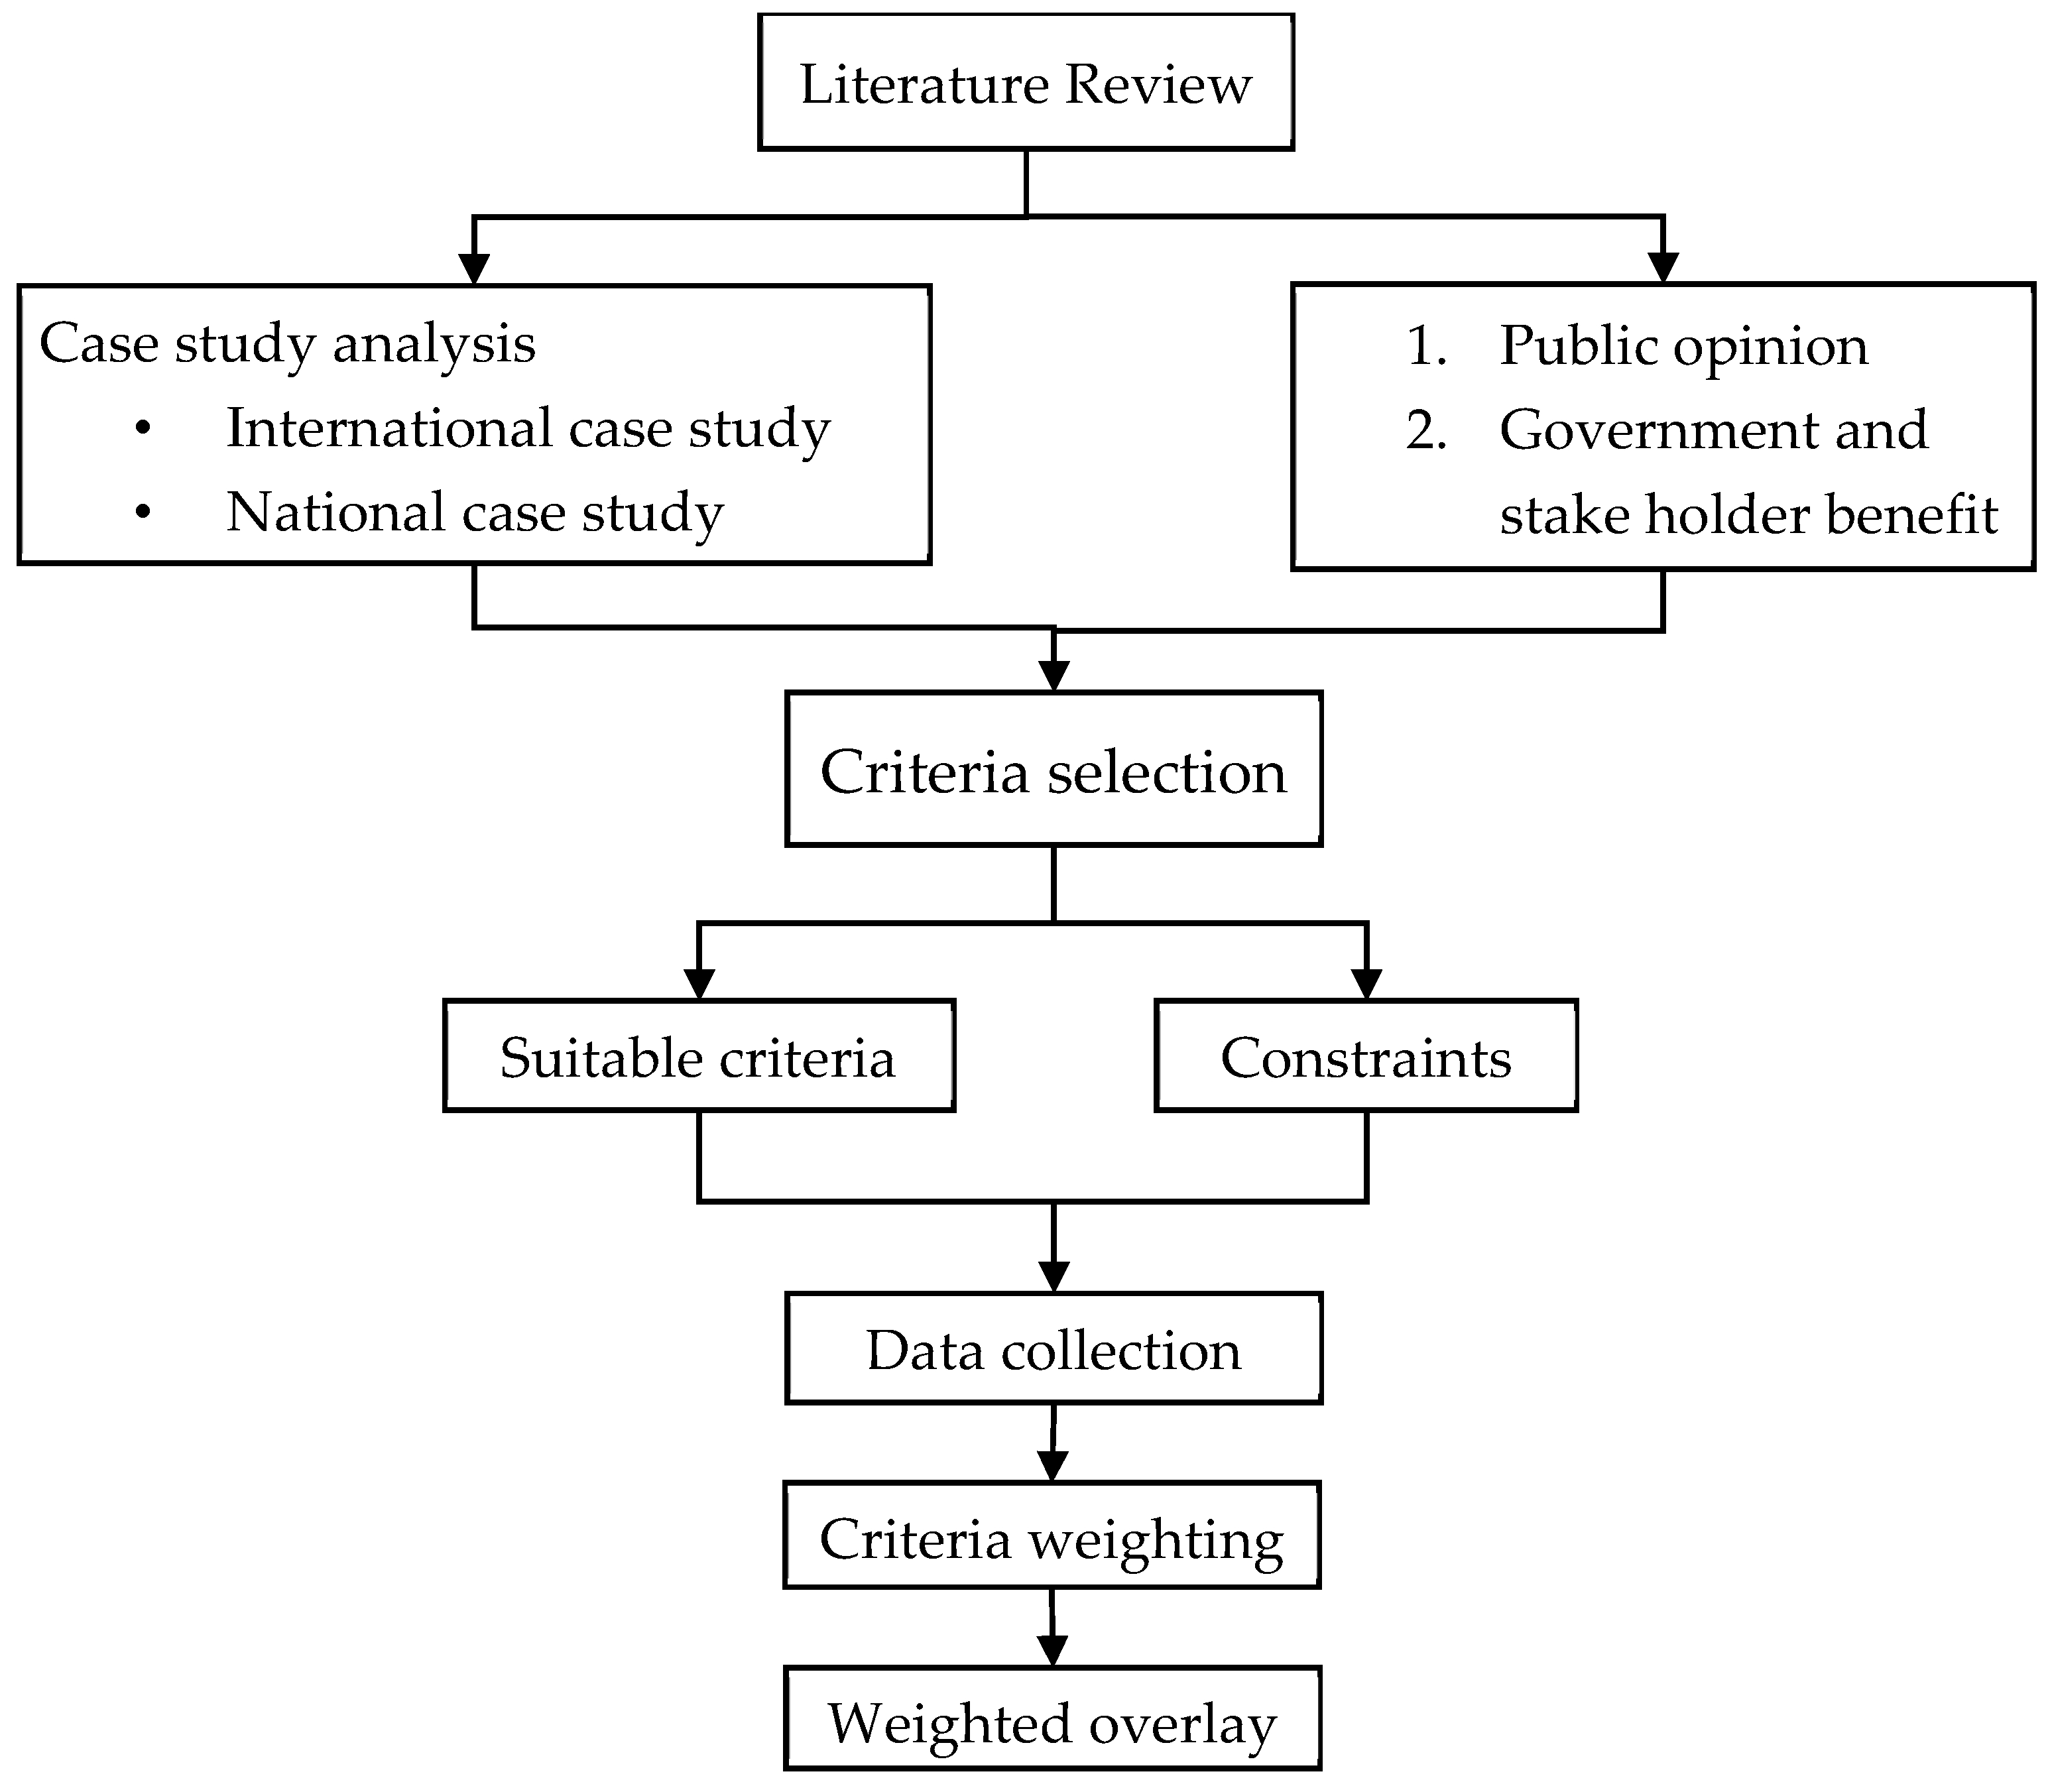
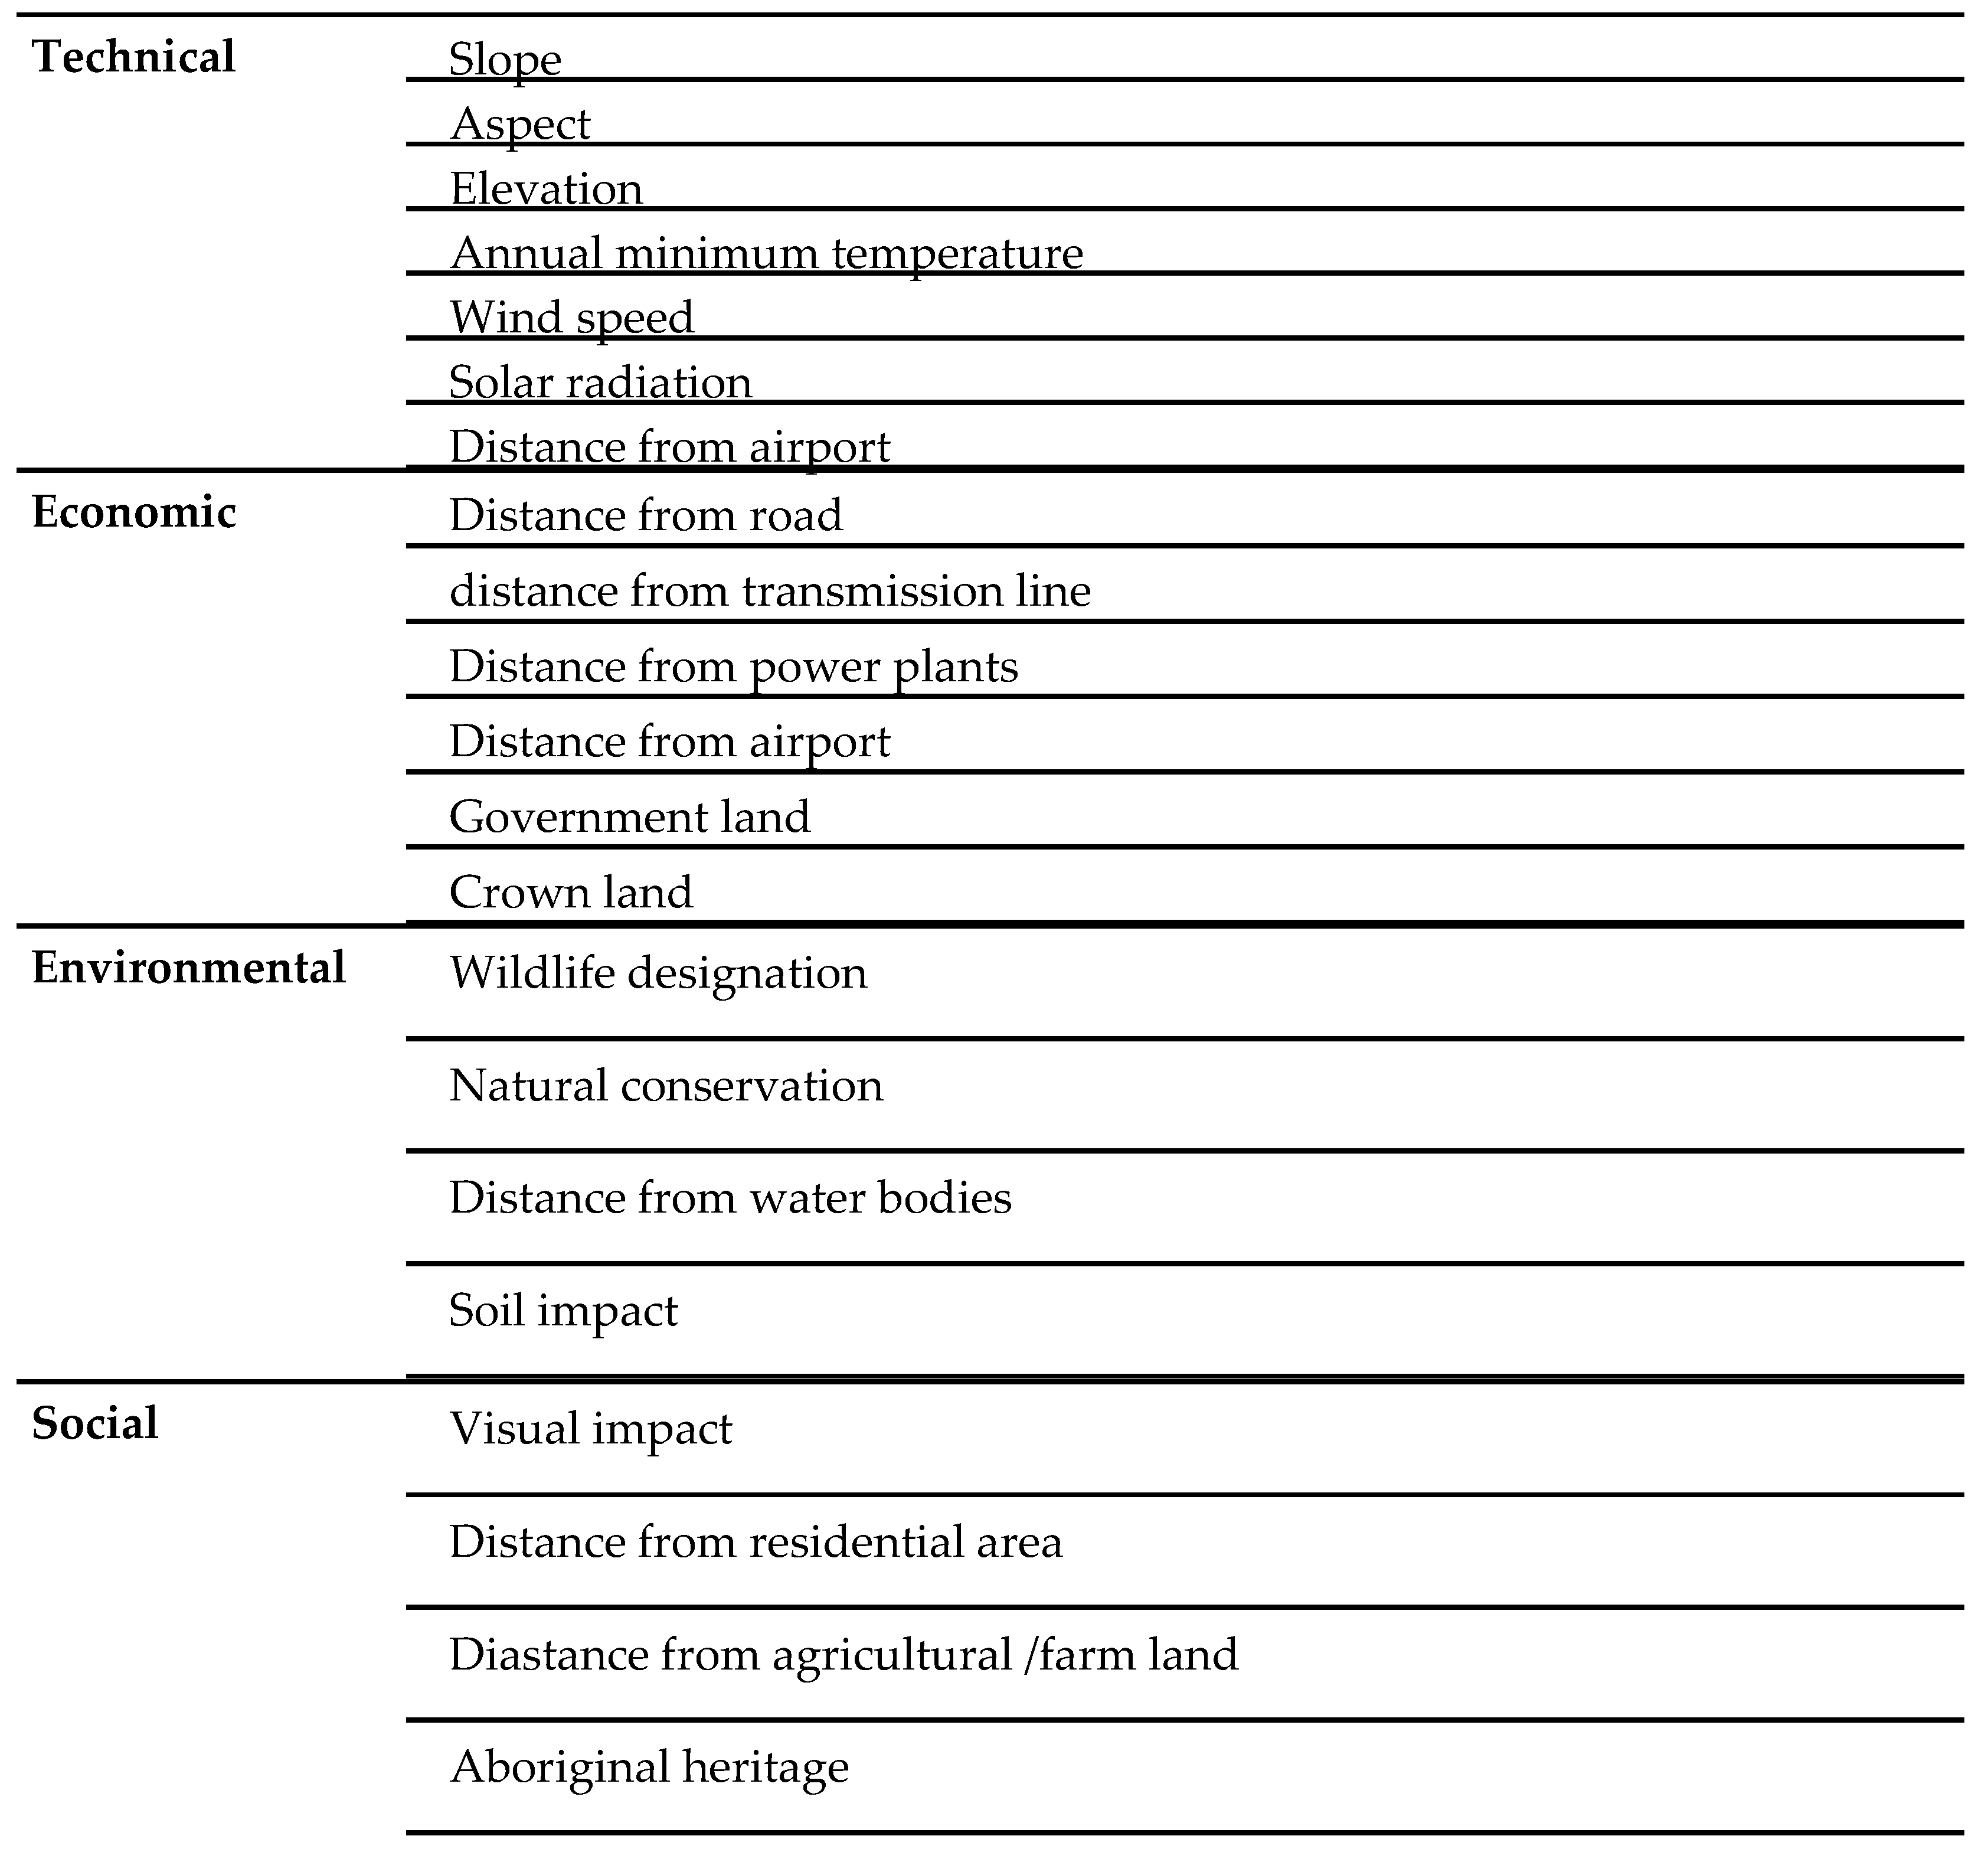

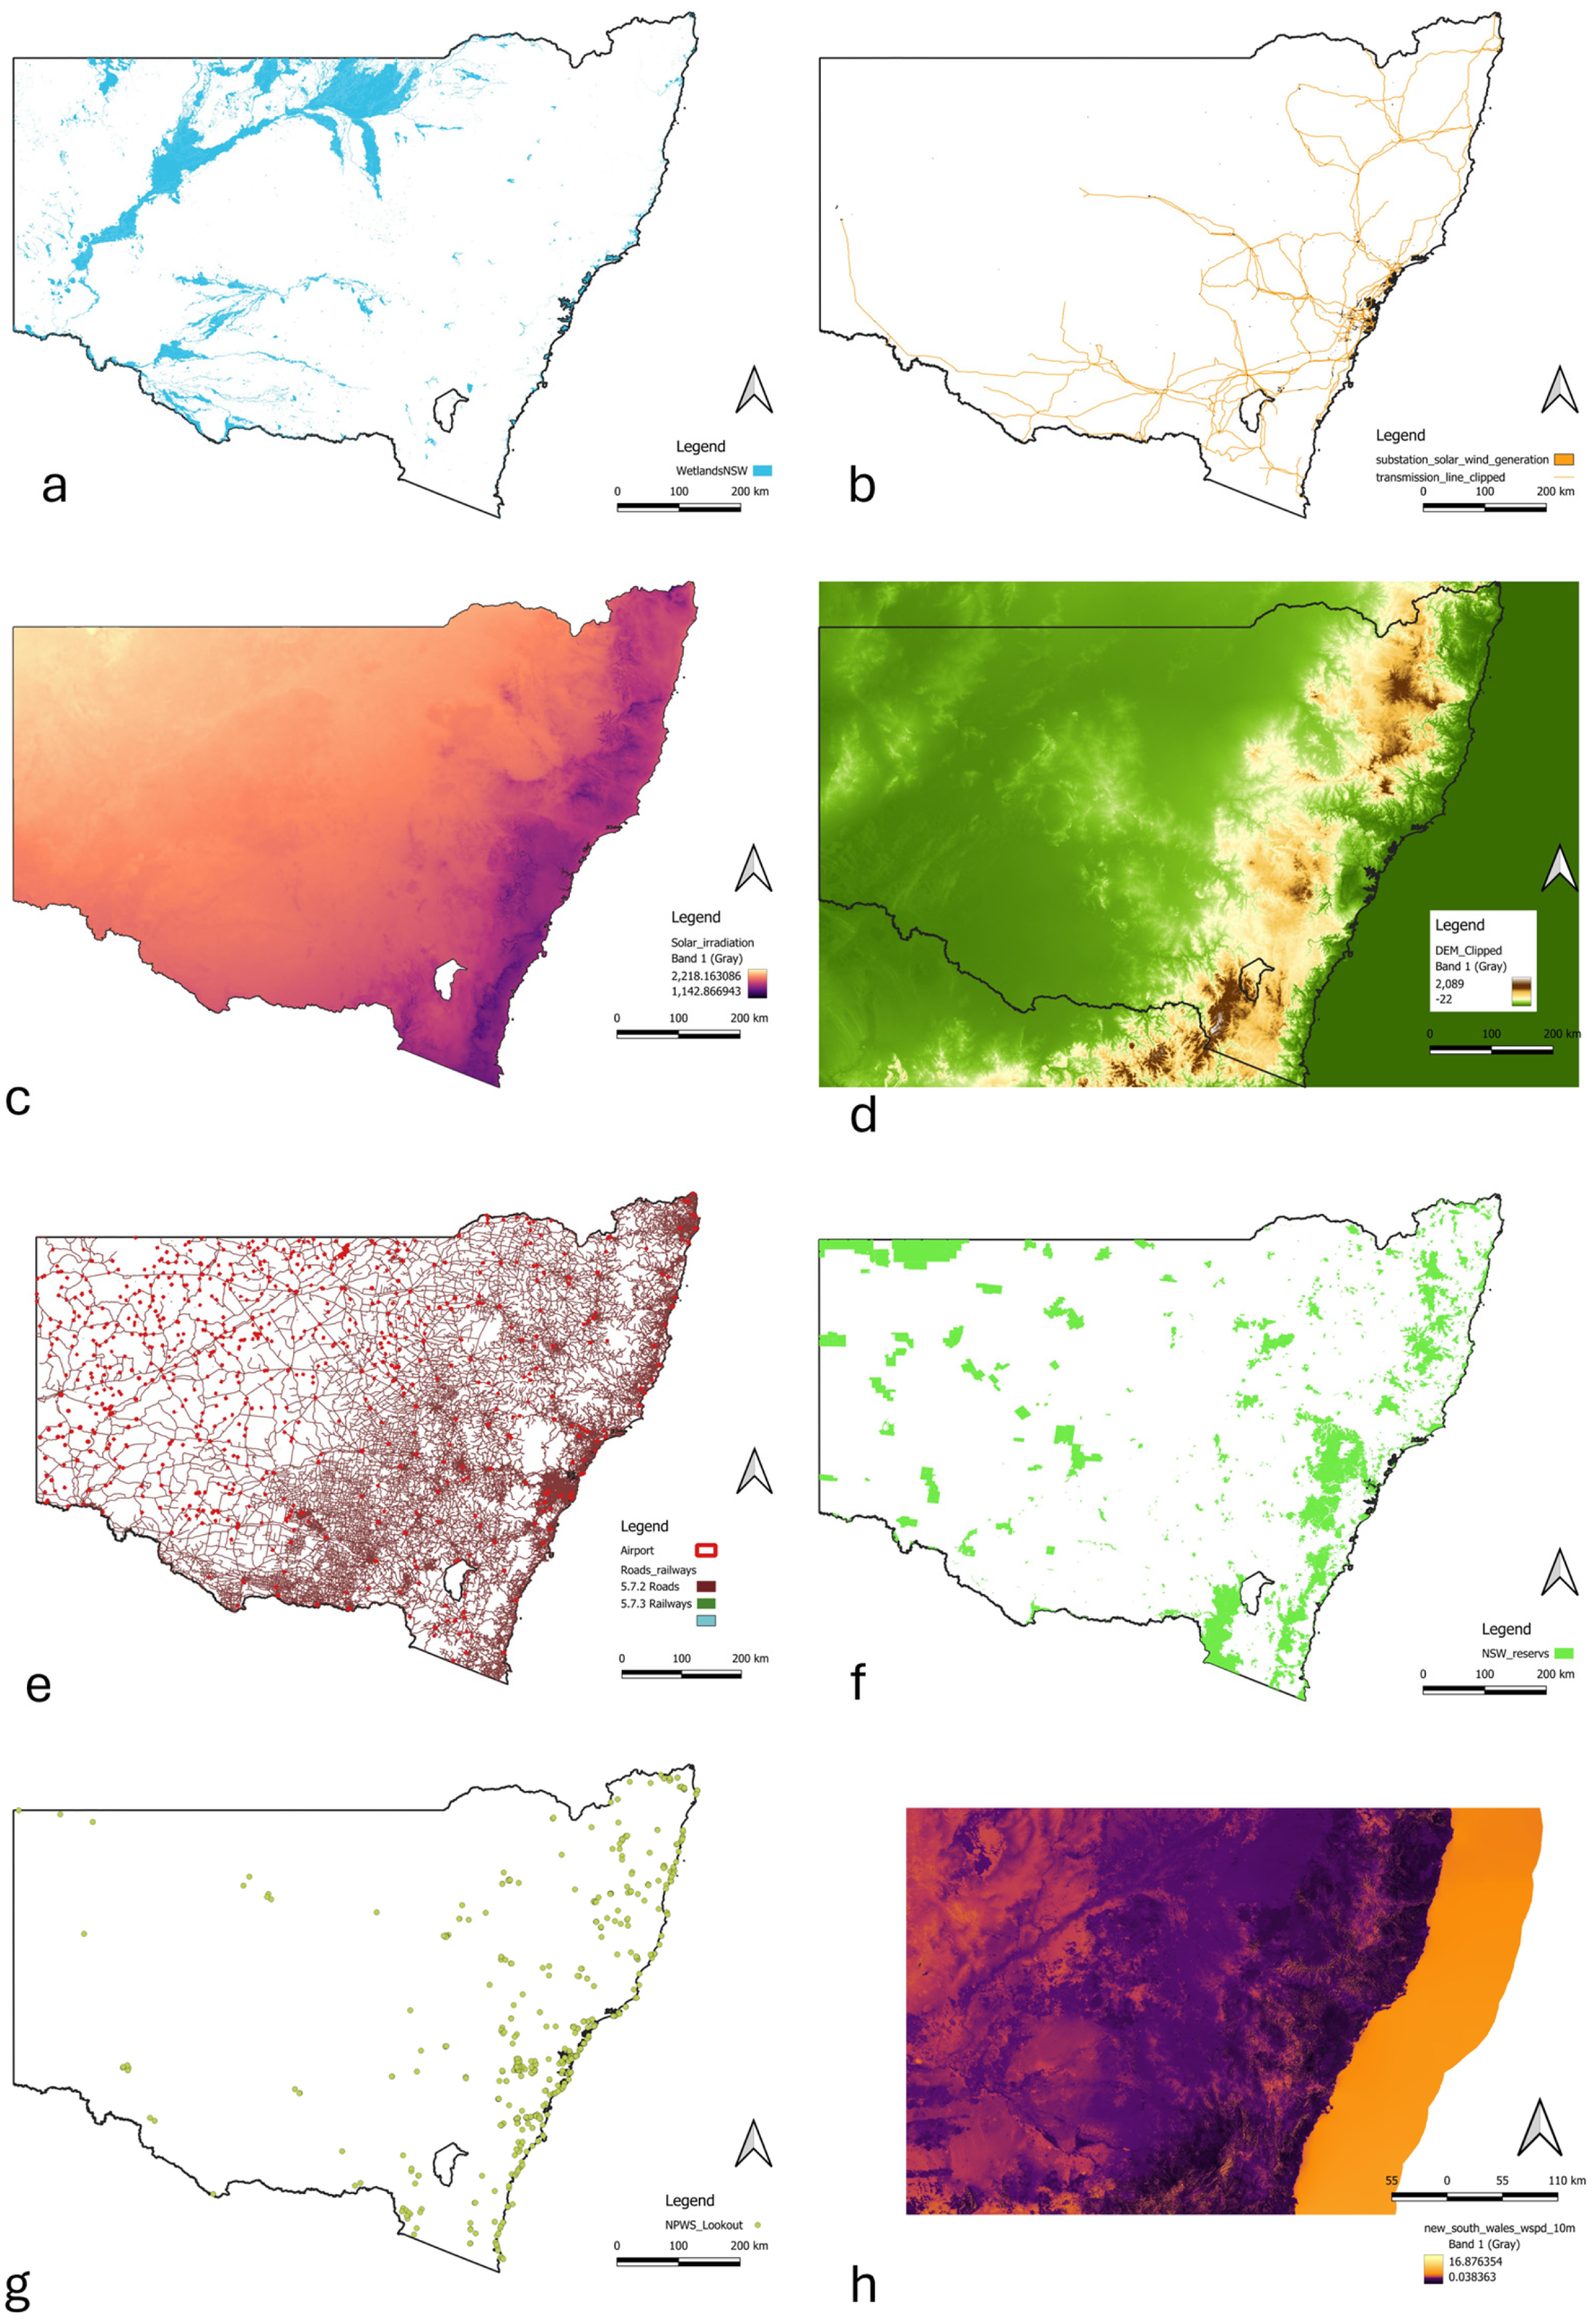
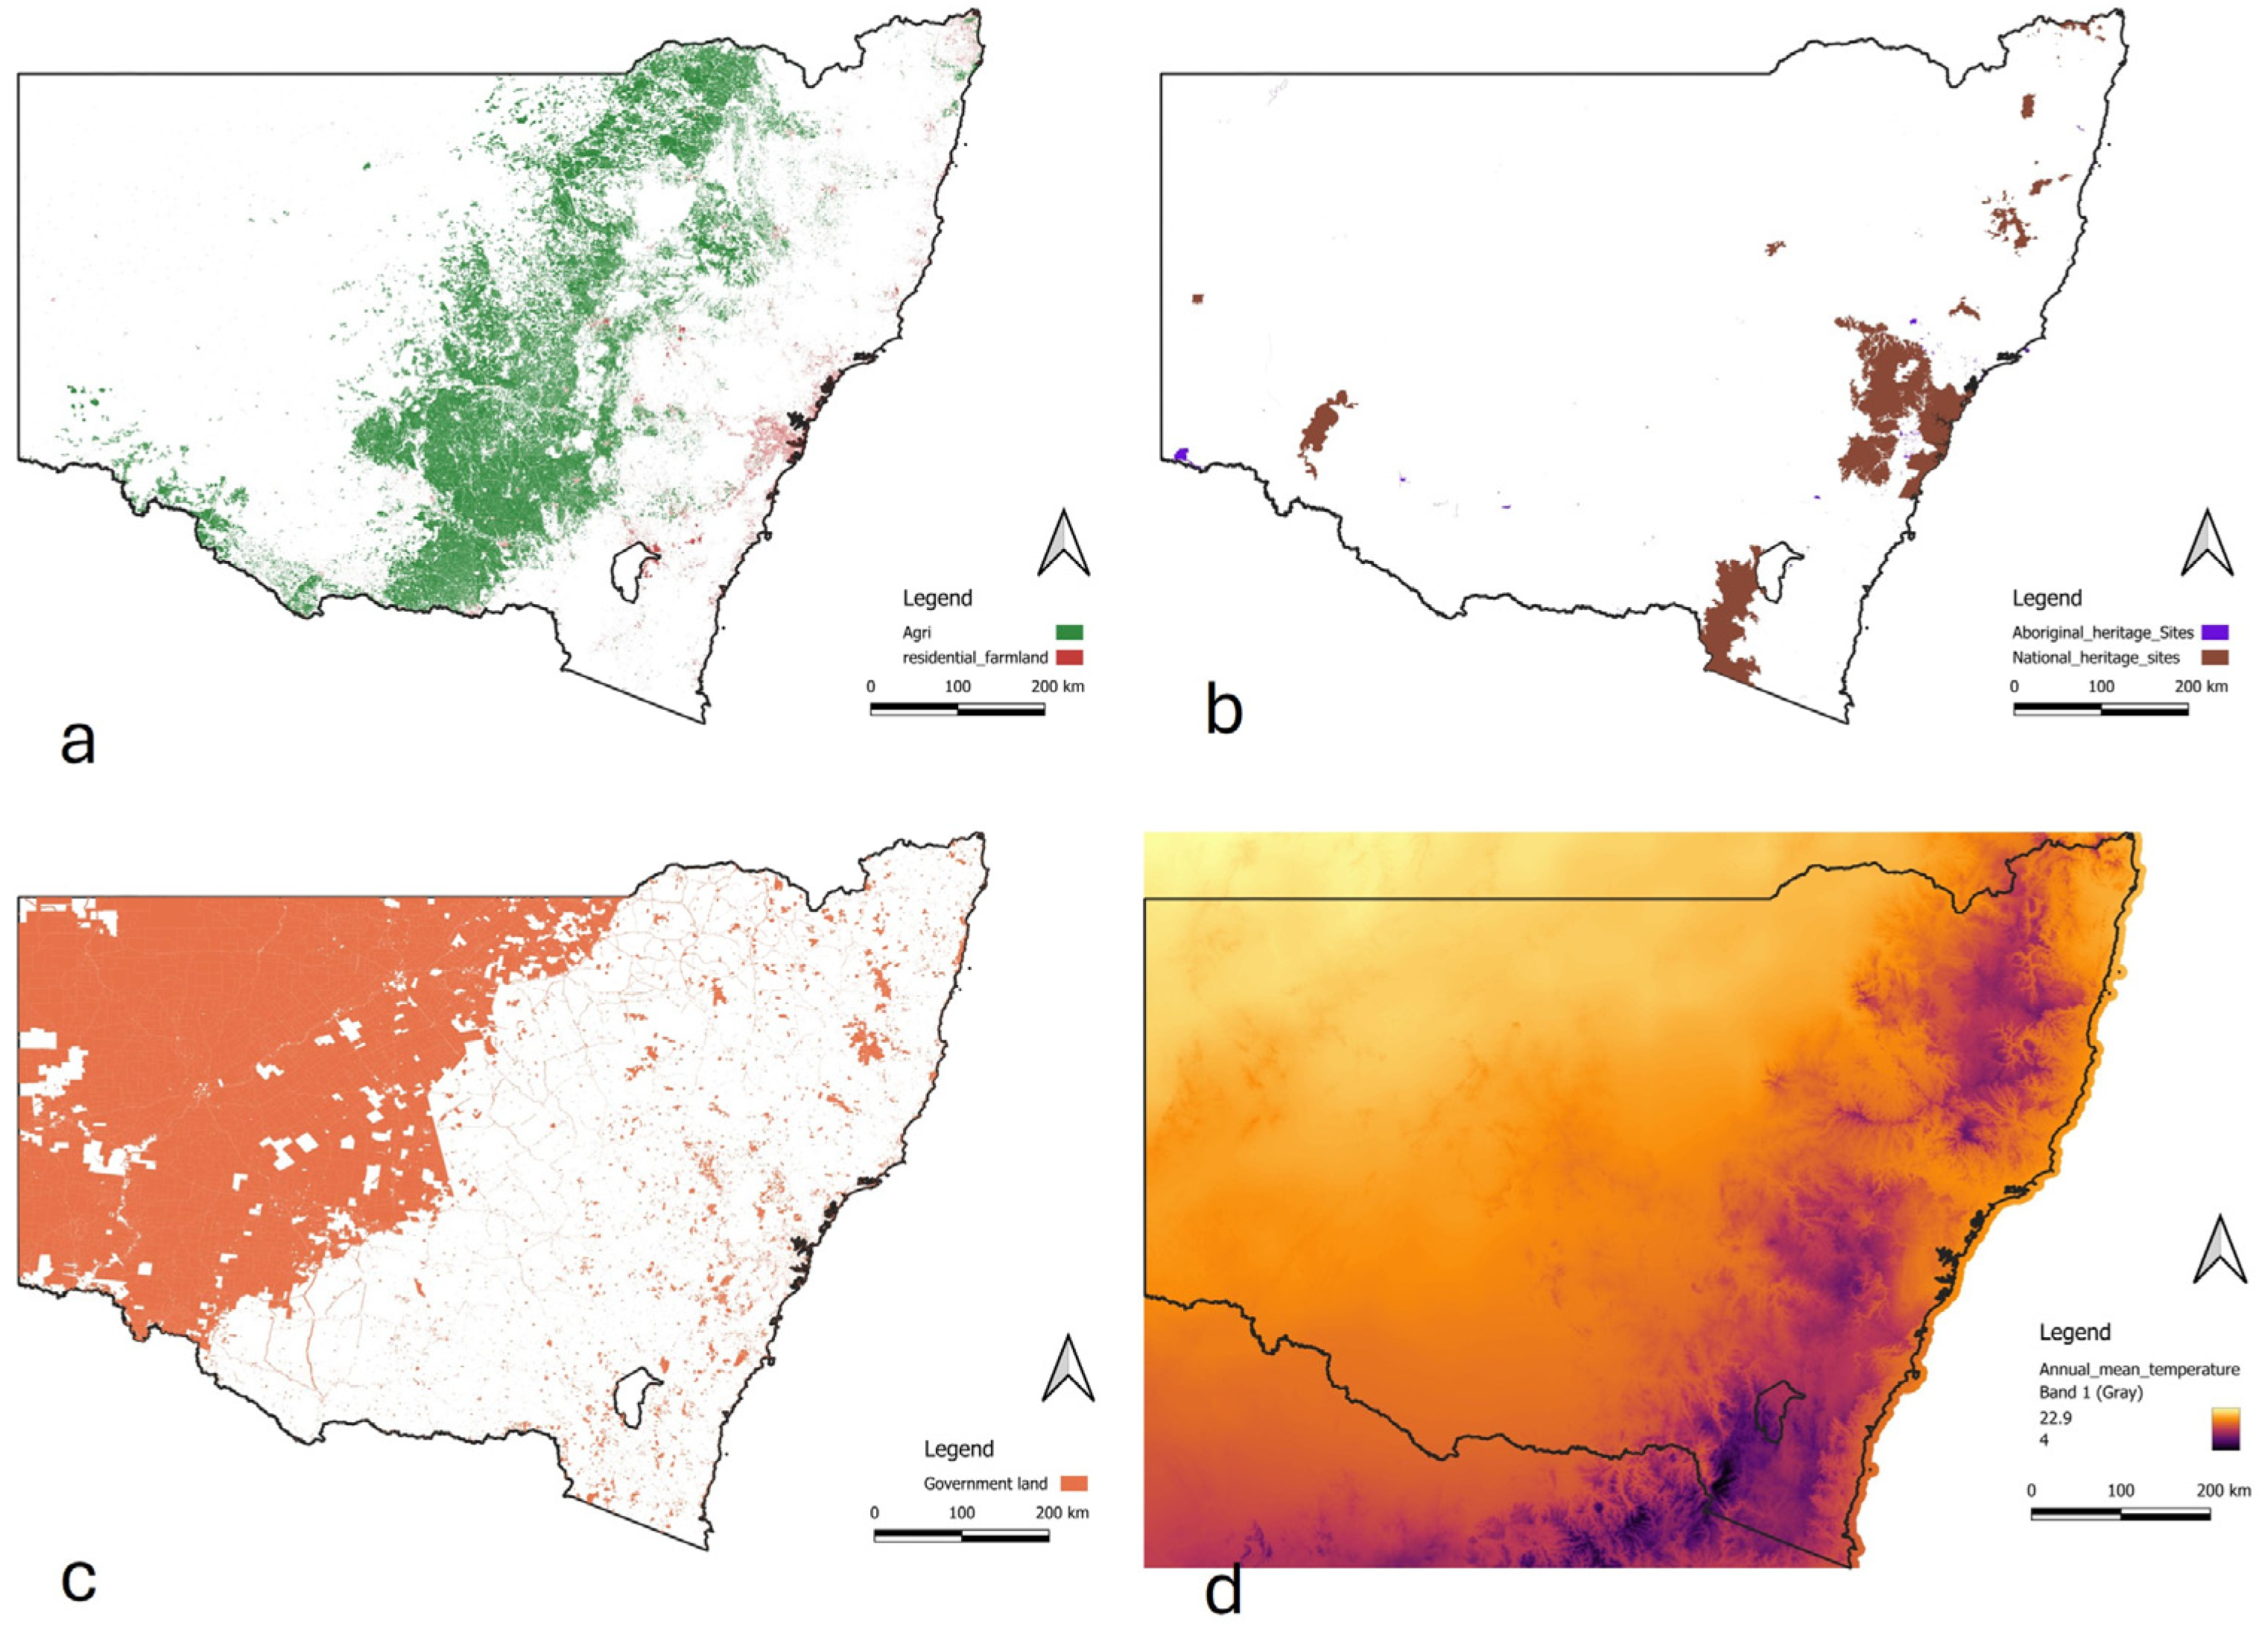
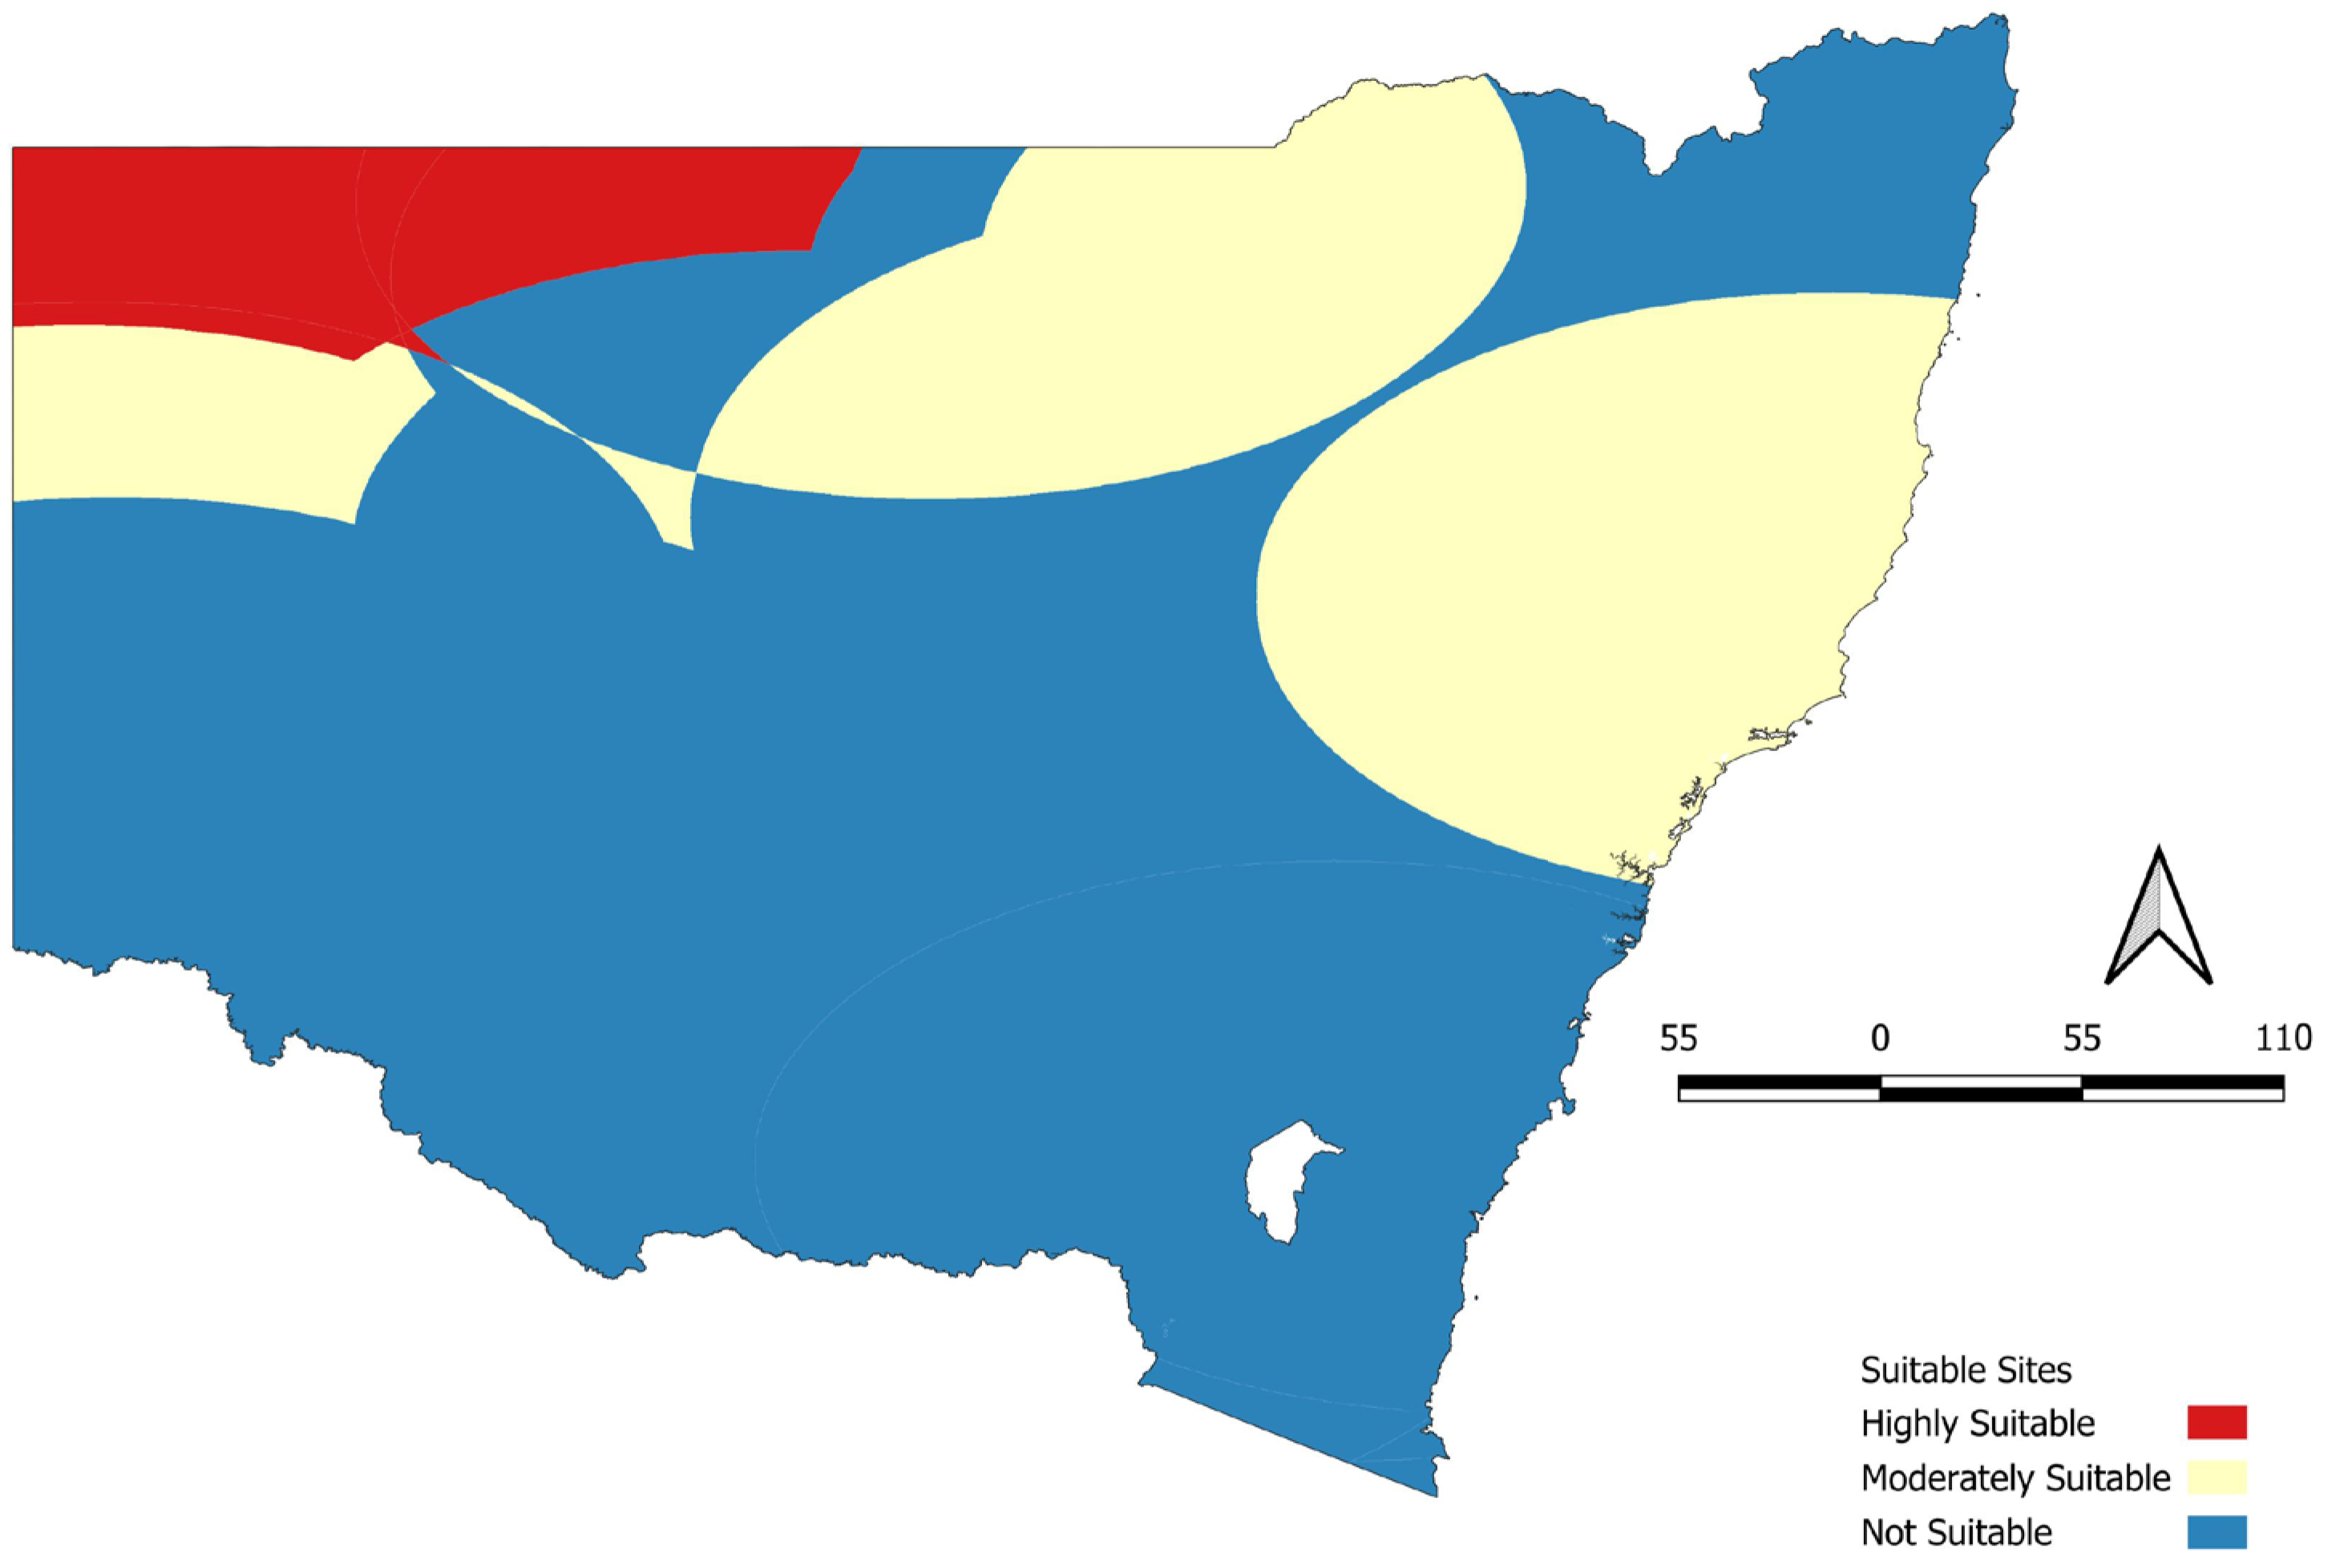

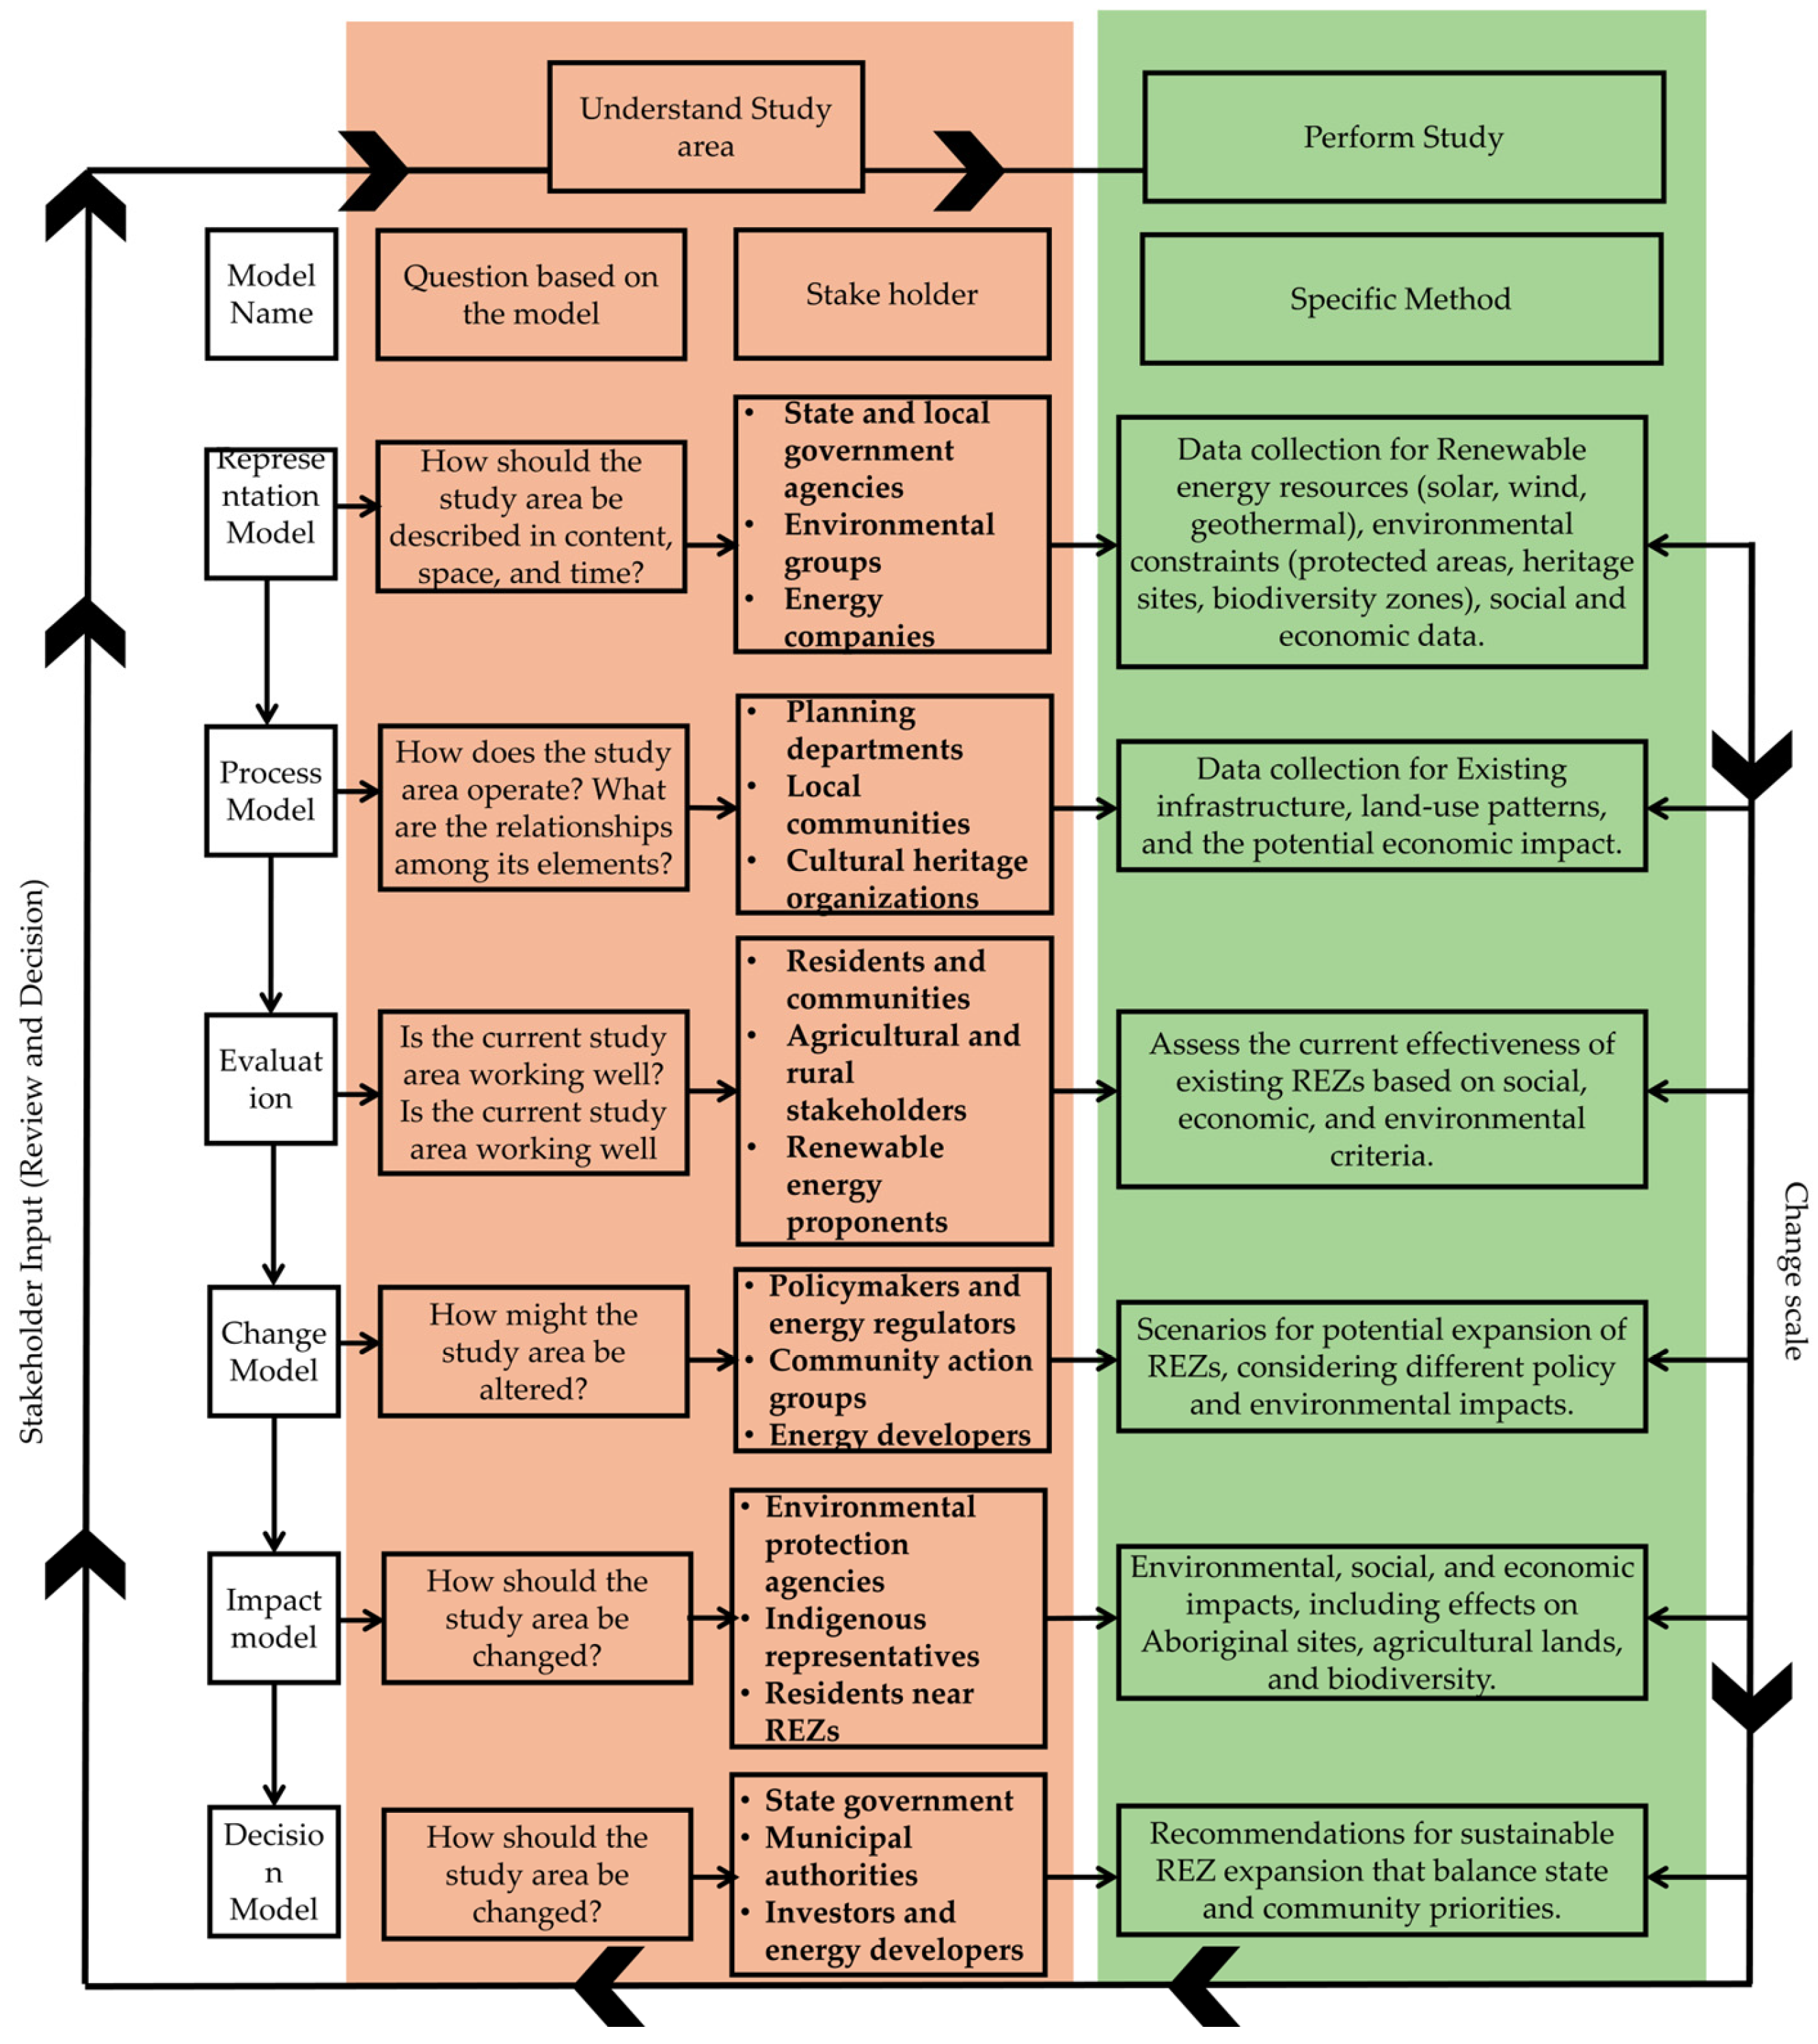