Article

Analysis of the Quality of Typical Acidic Groundwater of the Guangwang Mining Area and Its Associated Human Health Risks

1
State Key Laboratory of Geohazard Prevention and Geoenvironment Protection, Chengdu University of Technology, Chengdu 610059, China
2
State Environmental Protection Key Laboratory of Synergetic Control and Joint Remediation & Water Pollution, College of Ecology and Environment, Chengdu University of Technology, Chengdu 610059, China
3
College of Ecology and Environment, Chengdu University of Technology, Chengdu 610059, China
4
College of Environment and Civil Engineering, Chengdu University of Technology, Chengdu 610059, China
*
Author to whom correspondence should be addressed.
Sustainability 2025, 17(6), 2677; https://doi.org/10.3390/su17062677
Submission received: 18 January 2025 / Revised: 18 February 2025 / Accepted: 26 February 2025 / Published: 18 March 2025

Abstract

:
This study determined the hydro-chemical properties of groundwater in a typical mining area and its associated human health risks, focusing on the Guangwang mining area. Groundwater samples were analyzed for toxic metals, after which analysis of principal components, the entropy-weighted water quality index, and Spearman analysis of correlation were applied to the collected data. The Environmental Protection Agency of the United States’s health hazard appraisal was utilized to assess the hazards of toxic metals in the local water supply to the health of both grownups and juveniles. HCO3-Na and SO4⋅Cl-Ca⋅Mg were found to be the predominant groundwater hydro-chemical types. The eastern section of the area of study showed the greatest average total dissolved solids (16,347.00 mg/L) and SO42− (8980.00 mg/L) levels. It was determined that the groundwater hydro-chemical type was Ca-HCO3 and that limestone leeching and the evaporative level in the coal seam aquifer were the predominant factors regulating groundwater hydrochemistry. Six of the ten assessed metals exceeded the World Health Organization’s safe water for drinking standards, with particularly high Al (66.97 mg/L) and Cd (194.53 μg/L). Spearman correlation analysis showed significant correlations between Mn, Al, Cu, and Zn, which could be attributed to bauxite minerals associated with the coal mine. Release of metal ions was attributed to the oxidation of metal sulfide minerals, which is driven by mining-induced water–rock interaction. The intake of water for drinking was shown to be the predominant route of hazard to human health. The hazard index decreased from east to west due to the level of abandoned coal mines in the eastern region, along with well-developed fissures. The total carcinogenic hazard for grownups exceeded that of juveniles due to the greater quantity of water for drinking consumed and higher surface area of skin amongst grownups. The results can guide groundwater pollution regulation activities in mining areas to minimize potential hazards of groundwater quality to the health of humans.

1. Introduction

Water resources, predominantly surface and groundwater, are essential requirements for human survival [1]. Groundwater is an crucial source of water in many regions and sustains human socio-economic development and agriculture [2,3,4,5,6]. The advantages of groundwater as a water resource include its widespread and stable flow and water quality. Groundwater meets 70% of the water needs of urban and rural residents in China, and over 95% of the rural population in China utilize groundwater as a source of water for drinking [7]. Since groundwater quality can pose hazards to human and environmental health [3,8], there is a need for monitoring of the hydro-chemical properties of groundwater and the appraisal of its associated hazards [4].
China contains extensive coal resources. However, mining of coal alters the characteristics of groundwater flow and the water balance, which in turn break down the structure of the rock surrounding the coal seam and influence groundwater circulation and the relationships between recharge, runoff, and discharge. Complex water–rock interactions can develop due to changes in the reduction environment of sulfide deposits, including oxidation and dissolution [9,10]. These processes can lead to the acidification of groundwater and formation of acid mine drainage (AMD). AMD is characterized by extreme acidity and elevated levels of various elements and compounds, including Fe, SO42−, Pb, Cr, and As [11], thereby posing considerable hazards to human and environmental health.
There has been recent increasing attention of the effects of the mining of coal on groundwater flow and water chemistry. Elijah et al. [12] determined the hydrogeochemical characteristics and change in groundwater in a coal mining area in northern Malawi; Jiang et al. [13] and Luo et al. [14] revealed the impacts of mining activities on the spread, movement, and transformation of toxic metals in regional groundwater; Zhang et al. [1] described the hydro-chemical characteristics of nitrate-rich groundwater in the Nanchong area and the associated to human health risks. Mohammadpour et al. [15] found that chromium and arsenic were the main causes of cancer risk in a chromite mining area in Iran, and the health risk index for children was 4.48. Olivares et al. [16] studied a mining area in Latin America and found that Fe, Co and As contributed the most to the total risk and cancer risk. However, there remain few related studies on the Guangwang mining areas in Guangyuan, Wangcang, and Nanjiang in northern Sichuan [17].
The current study aimed to determine the hydro-chemical characteristics of groundwater in a typical mining area and its associated human health risks, focusing on the Guangwang mining area. The objectives of the current study were to: (1) analyze the hydrogeochemical characteristics of the Guangwang mining area and identify the associated regulating factors; (2) evaluate and the predominant sources of toxic metals in AMD in the area of study; and (3) assess the hazards of groundwater in the area of study to the health of humans. The results of the current study can guide future management of groundwater resources in the Guangwang region and in similar mining of coal areas.

2. Methods and Materials

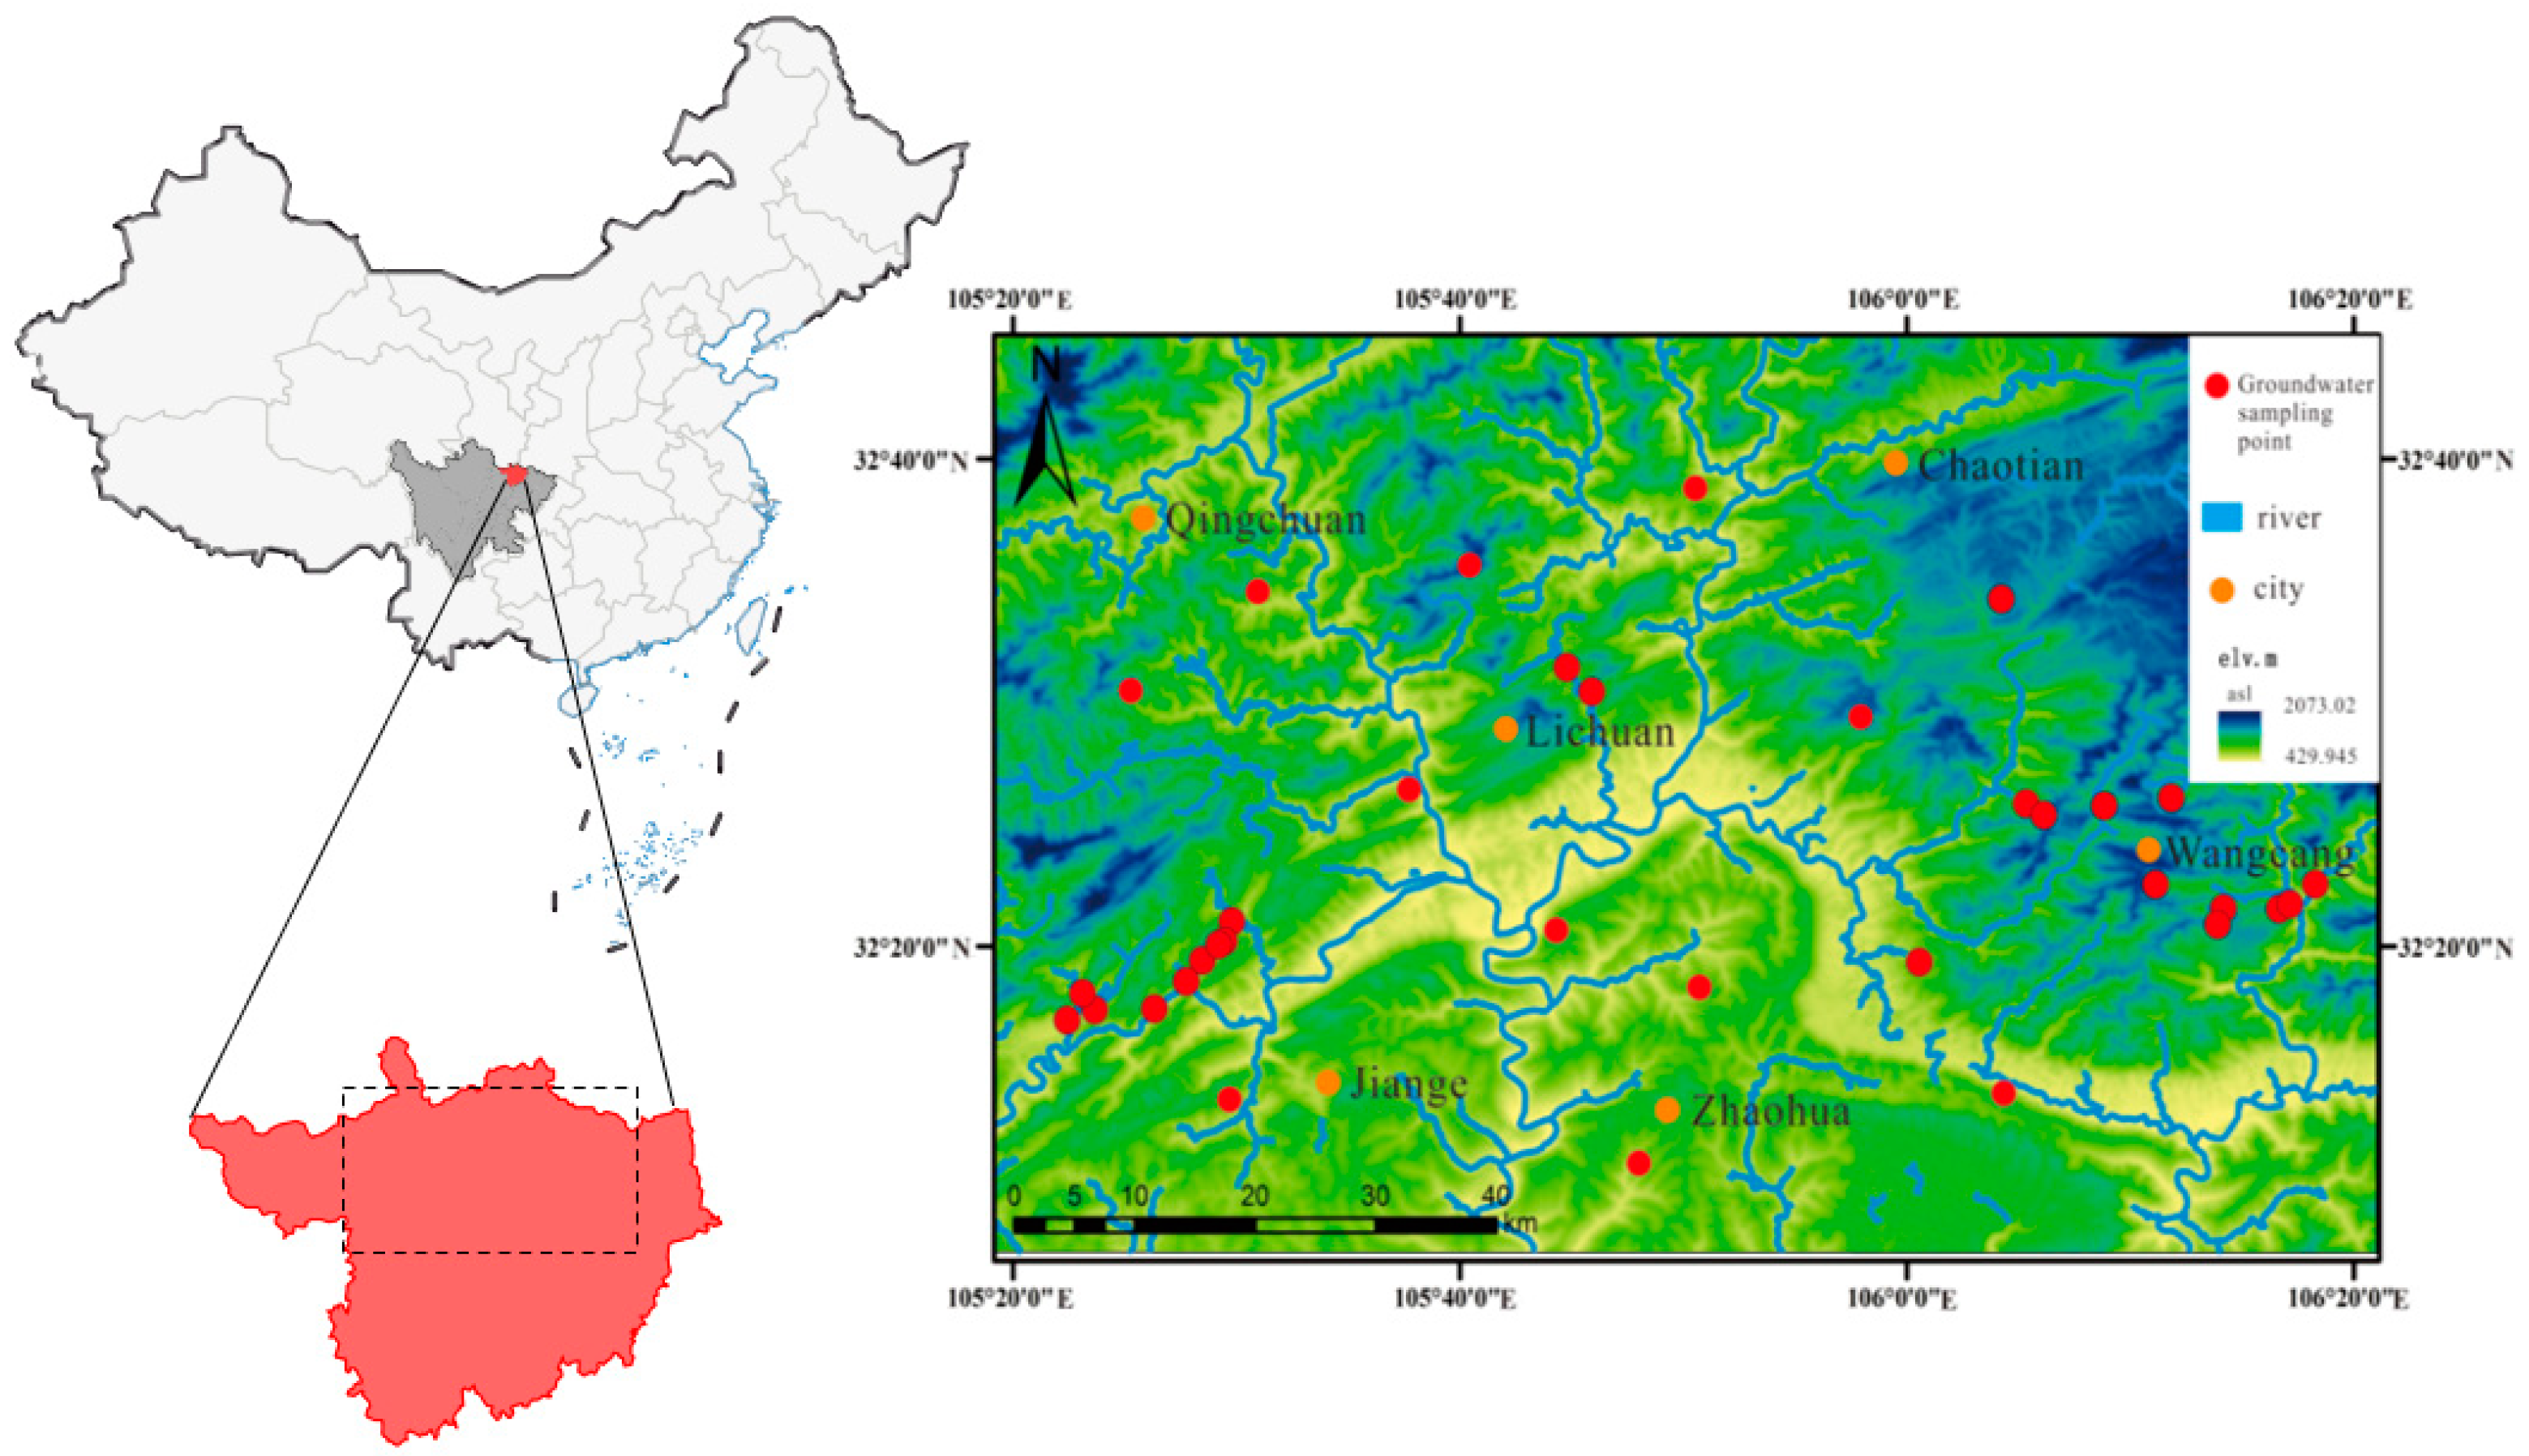
2.1. Area of Study and Sample Positions

Most of the Guangwang mining area is in Guangyuan City, northern Sichuan Province, with only the Nanjiang Coal Mine in Nanjiang County, Bazhong City. The mining area has an elongated spread with a length of 200 km from west to east, covering an area of 230 km2 and spanning the districts of Lizhou and Yuanba and Wangcang and Nanjiang in Guangyuan City and Bazhong City, respectively.
Guangyuan (31°31′–32°56′ N, 104°36′–106°45′ E) is in northern Sichuan Province and represents a region of transition between the Northwest Plateau and the Sichuan Basin, with a seasonal climate typical of an inland basin. Yearly mean temperature is 17 °C, with the maximum temperature of 40 °C occurring between July and September. Yearly mean precipitation is 973 mm, with a peak rainfall of 1518 mm in 1961. The area of study experiences seasonal rainfall, with 75% of annual rainfall occurring between June and September. Rivers flowing through the area of study form part of the Yangtze River. The Jialing River constitutes the main river, into which 75 tributary rivers flow, including the Qingshui, Bailong, Mumen, and Donghe rivers from east to west.
The elevation of the area of study decreases from north (1200 m) to south (600 m). The river valley in the area of study is deep and V-shaped, with a relative height difference of 200–500 m. The area of study has a well-developed topography. Coal strata in the area of study originate from the Permian, Jurassic, and Triassic periods. The study area is primarily dominated by the dark gray of Wujiaping group (P2w). Four categories of clastic-rock-fissure-pore water and carbonate-rock-karst-fissure water exist in the area of study. Groundwater in the area of study is relatively abundant and is recharged by infiltration of water at the surface and atmospheric precipitation. The predominant outflows of groundwater are karst springs and underground rivers, followed by evaporation and artificial mining and drainage. Figure 1 shows a map of the area of study, including the positions of the points of sampling.

2.2. Collection, Preparation, and Analysis of Samples

The current study collected groundwater samples from 34 sites in the area, including from 10, 3, 4, 10, and 2 sample positions in Wangcang, Chaotian, Lizhou, Jiange, and Qingchuan, respectively. Field sampling was performed using a HACH portable water quality analyzer at each sample position. During the collection of water samples, in-situ pH, temperature, reduction–oxidation (REDOX) oxidation–reduction potential (ORP), and electrical conductivity (EC) were measured using field meters. Collected water samples were filtered through a 0.45-μm filter membrane and kept in a polyethylene plastic bottle under a low temperature until analysis. Samples for analysis of cations were acidified to a pH < 2 using nitric acid and kept in organic sampling bottles for transportation to the laboratory. Once reaching the laboratory, the samples bottles were kept in a refrigerator until analysis. Water samples for the determination of metal elements (Fe, Cu, Mn, Al, Zn, Cd, Pb, Cr, Hg, and As) were acidified with HNO3 (1:1) to a HNO3 level of 1%. Mass levels of cations and anions in water samples were calculated using the IRIS Intrepid II XSP (Thermo Electron, Airport City, IL, USA) instrument and ion chromatography (ICS-1100, Dionex, Sunnyvale, CA, USA), respectively. Inductively coupled plasma mass spectrometry (iCAP Q, Thermo Fisher, Waltham, MA, USA) was utilized to measure the metal levels in the water samples. Quality control of testing showed a variation in test results of <5%.

2.3. Data Analysis

Inverse distance weighting interpolation in ArcGIS 10.2 was utilized to produce a spread of general and metal elements in shallow groundwater in the area of study. Pearson analysis of correlation was utilized to examine the relationships between the various metals identified in the water samples. Analysis of principal components (PCA) was utilized to identify the sources of toxic metals in groundwater in the area of study.

2.4. Entropy-Weighted Water Quality Index (EWQI)

The EWQI represents a single combined water quality indicator. The predominant benefit of the EWQI approach relates to the removal of human subjectivity by including information entropy in quantitative evaluation of water quality indices. The current study followed the steps outlined below to calculate the EWQI [18,19,20]:
(1) The eigenvalue matrix “X” was estimated using Equation (1), incorporating all hydro-chemical parameters as follows:
X = x 11 x 12 x 1 n x 21 x 22 x 2 n x m 1 x m 2 x m n ,
where m and n represent the number of groundwater samples and hydro-chemical parameters of each sample, respectively.
(2) The standard matrix Y was calculated according to Equations (2) and (3). Given the differences in scales among the different parameter units, standardization of the data before performing EWQI calculations was required.
y i j = x i j ( x i j ) m i n ( x i j ) m a x ( x i j ) m i n ,
Y = y 11 y 12 y 1 n y 21 y 22 y 2 n y m 1 y m 2 y m n ,
where xij is the initial matrix and (xij) min and (xij) max represent the minimum and maximum values of the hydro-chemical parameters of the samples, respectively.
(3) Entropy ej and entropy weight wj were calculated according to Equations (6)–(8). The index j value for sample i is shown as Pij.
e j = 1 l n m i = 1 m ( P i j × l n P i j ) ,
P i j = y i j i m y i j ,
w j = 1 e j i = 1 n ( 1 e j ) ,
(4) The quality rating scale qj of the jth parameter was calculated as follows:
q j = C j S j × 100 ,
where qj is the quantitative scale of categorization for hydro-chemical indices, as calculated by the hydro-chemical levels (Cj) and the World Health Organization’s (WHO) drinking standards (Sj).
(5) The EWQI was calculated as follows:
EWQI = j = 1 m ( w j × q j ) ,
Table 1 summarizes the classification of the EWQI and shows that first- and second-grade groundwater adheres to the water for drinking standard.

2.5. Appraisal of Human Exposure and the Hazards to Health

The appraisal of human health examines the hazards posed by environmental contamination to health of humans [21]. Humans are exposed to metal elements in water predominantly through dermal contact or ingestion of water for drinking [22,23]. The current study applied the health hazard appraisal model of the Environmental Protection Agency of the United States (USEPA) [24,25]. Hazards to the health of both grownups and juveniles were assessed.

2.5.1. Model of Exposure

Chronic daily intake (CDI; mg·kg−1·d−1) is utilized as a measure of exposure to toxic metals and is calculated as follows:
C D I o r a l = C W × I R × E F × E D B W × A T ,
C D I d e r = C W × S A × P C × E T × E F × E D × I R B W × A T ,
where CDIoral and CDIder are the average daily doses through ingestion of water for drinking and dermal contact, respectively; CW represents the average groundwater pollutants level; IR is average daily groundwater intake; EF represents the frequency of exposure; ED is the duration of exposure; BW represents body weight; AT denotes average time; SA is the total surface area of skin contact to groundwater; PC represents the skin permeability constant for groundwater heavy metal elements; ET is the exposure duration; and CF is a factor of conversion. Table 2 provides a summary of the exposure parameter values applied in the current study.

2.5.2. Characterization of the Hazards

Chemical substances can be classed as either chemical carcinogens (e.g., Cd, Cr, and As) or chemical non-carcinogens (e.g., Fe, Mn, Cu, Zn, Hg, and Pb). Indicators of carcinomic hazards include the index of lifetime carcinogenic hazard (ILCR), whereas those of non-carcinogenic hazards include the non-carcinogenic hazard entropy (HQ) and non-carcinogenic hazard index (HI).
(1)
Carcinogenic hazards
The carcinogenic hazard of a chemical can be calculated as follows:
L C R = C D I × S F L ( R 0.01 ) ,
I L C R = 1 exp C D I × S F L ( R > 0.01 ) ,
where ILCR represents the average carcinogenic health hazard to an individual posed by a given metal under two exposure pathways; SF denotes the metal slope factor; and L is average lifespan. The USEPA thresholds for maximum acceptable hazard and ICLR for chemical carcinogens are 1 × 10⁻⁴ and >1 × 10⁻⁴, respectively. Therefore, metals in water are considered a potential carcinogenic hazard, with an ICLR < 1 × 10⁻⁴ considered to pose negligible hazard. No interactions between chemicals were assumed during the evaluation of the carcinogenic hazards posed by various chemicals. Under this assumption, the total carcinogenic hazard can be calculated by simply adding up the individual carcinogenic hazard for each chemical.
(2)
Non-carcinogenic hazards
The non-carcinogenic hazard to the health of humans for a given chemical was calculated as follows:
H Q = C D I R f D ,
H I = H Q = H Q o r a l + H Q d e r
where HQ represents non-carcinogenic hazards posed to the health of humans; RfD denotes the daily reference doses of non-carcinogenic substances under different exposure routes; and HI is harmful intake of contaminated water by a specific individual under two pathways of exposure. The USEPA classification indicates HI < 1 and HI > 1 to be representative of acceptable and unacceptable non-carcinogenic hazards of exposure to individuals, respectively [25]. Table 3 shows the RfD values of the health hazard appraisal model parameters of toxic metals.

3. Conclusions and Discussion

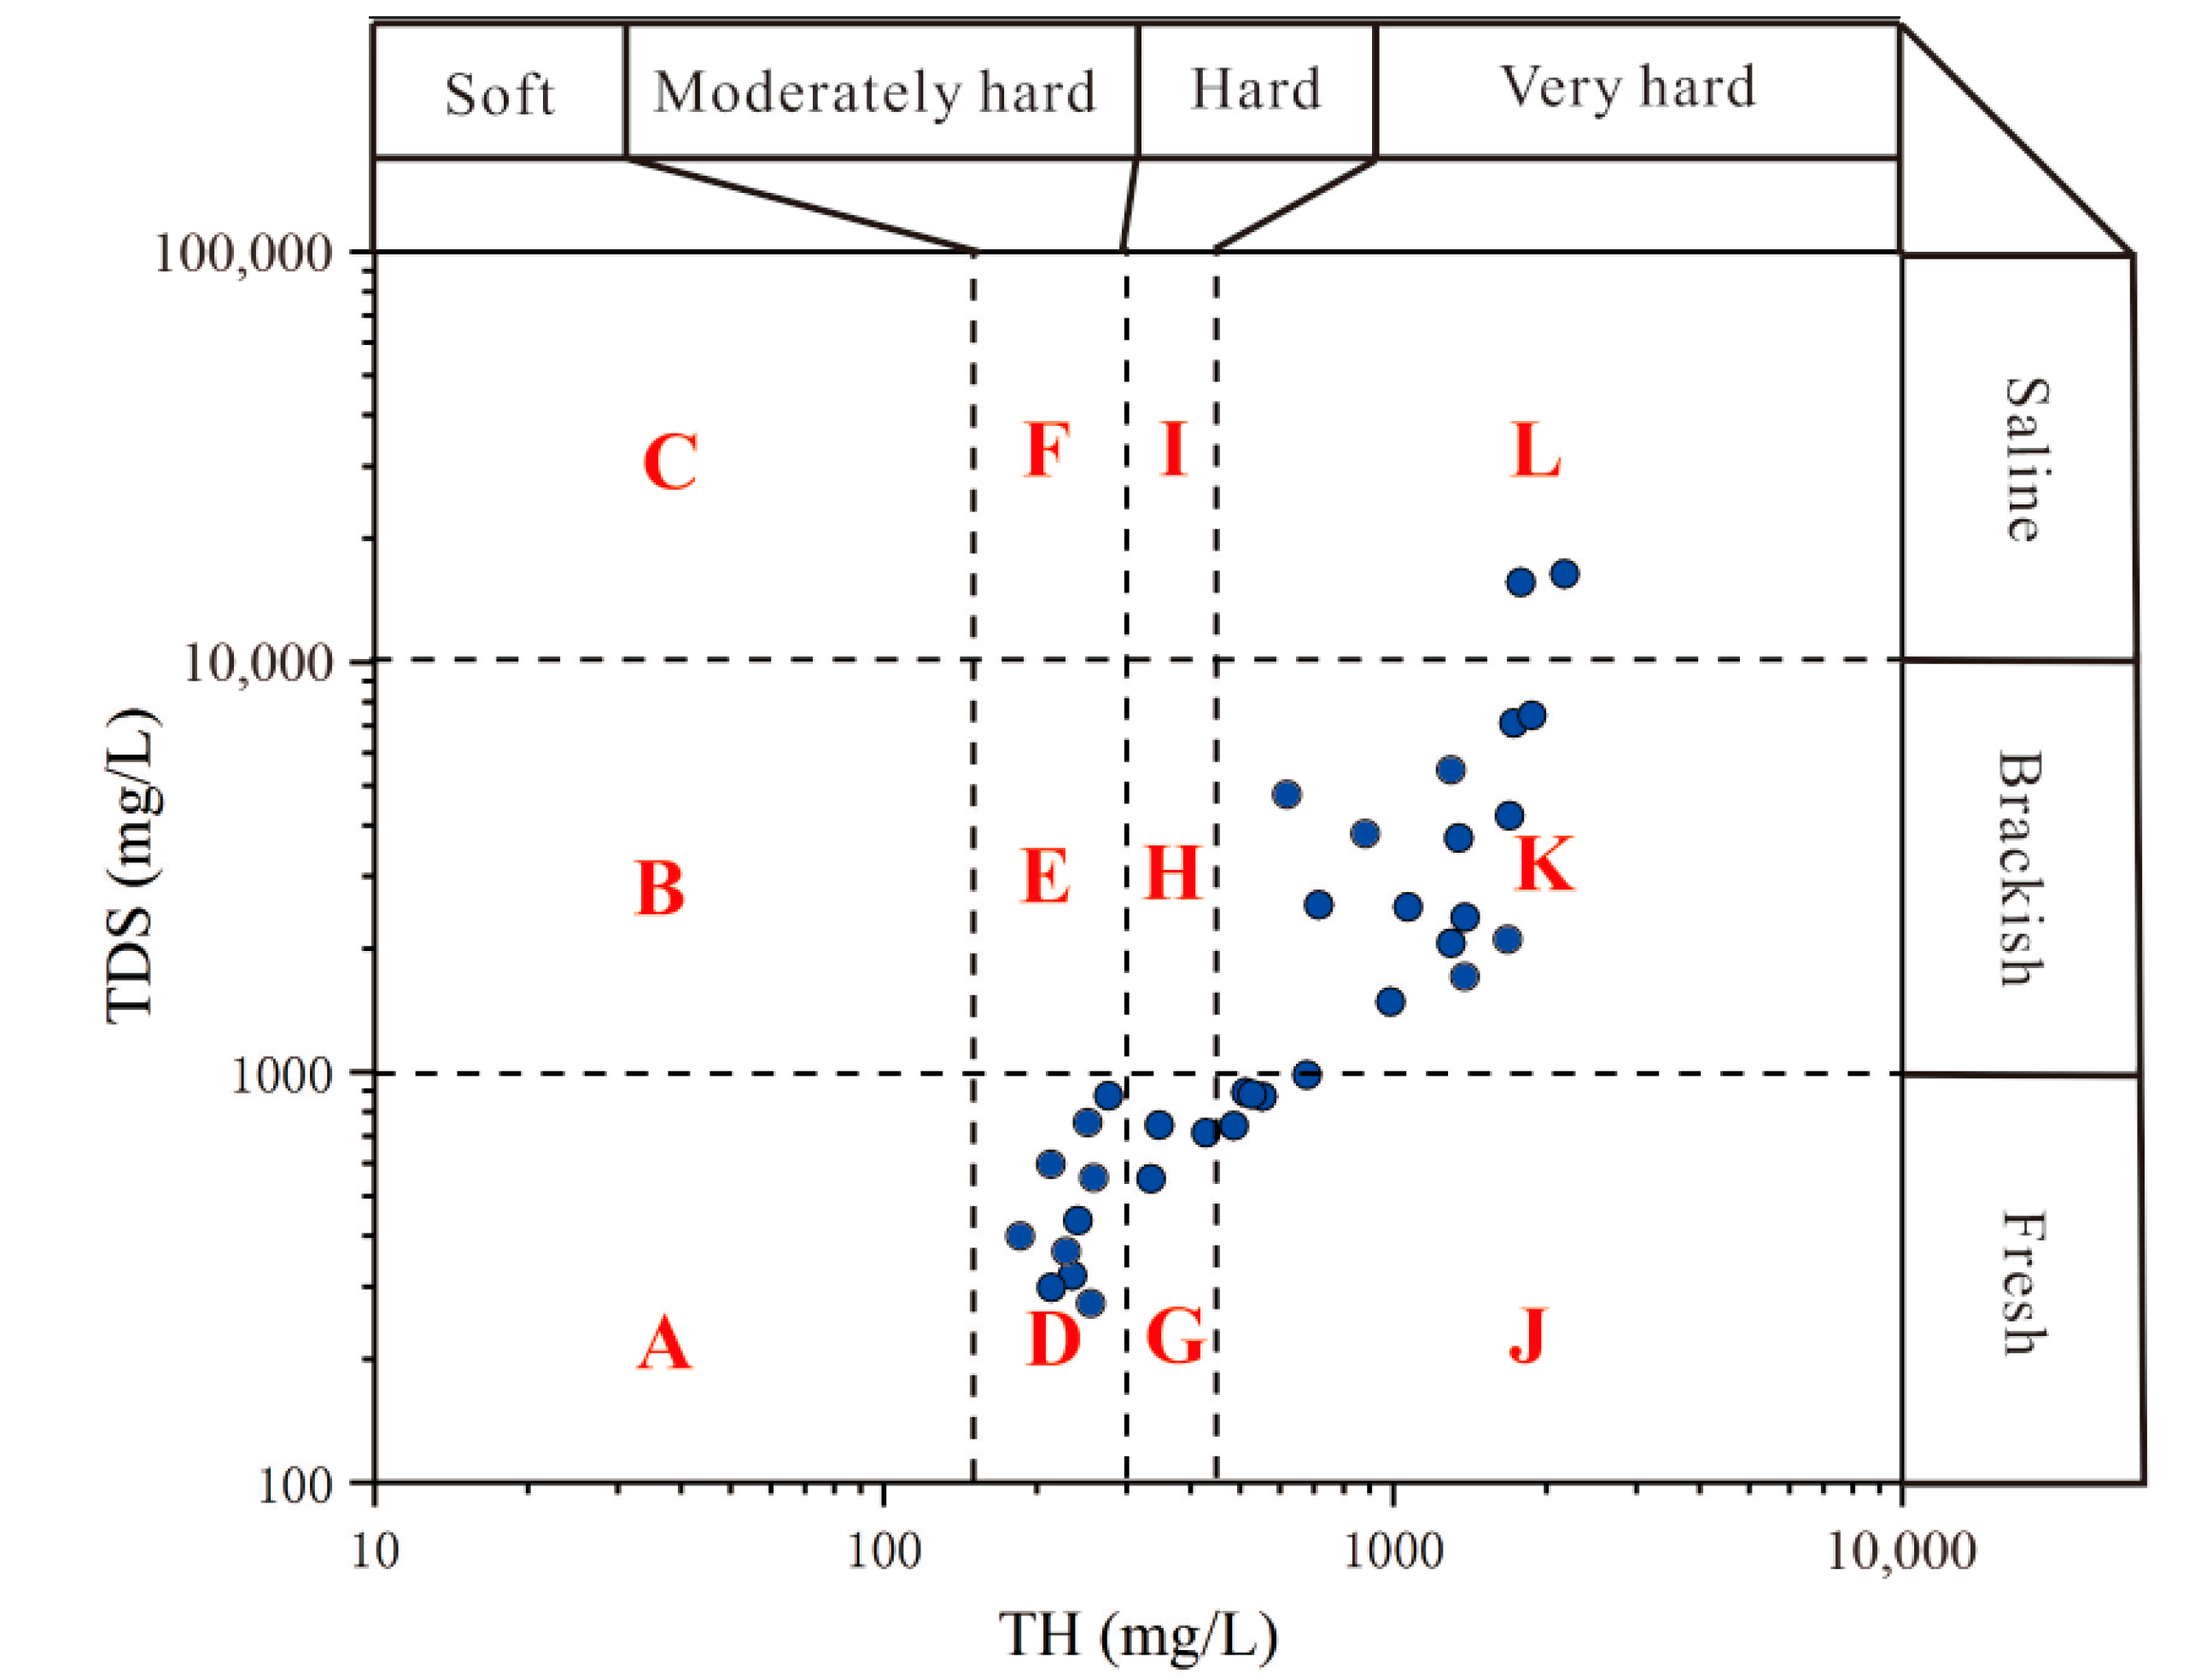
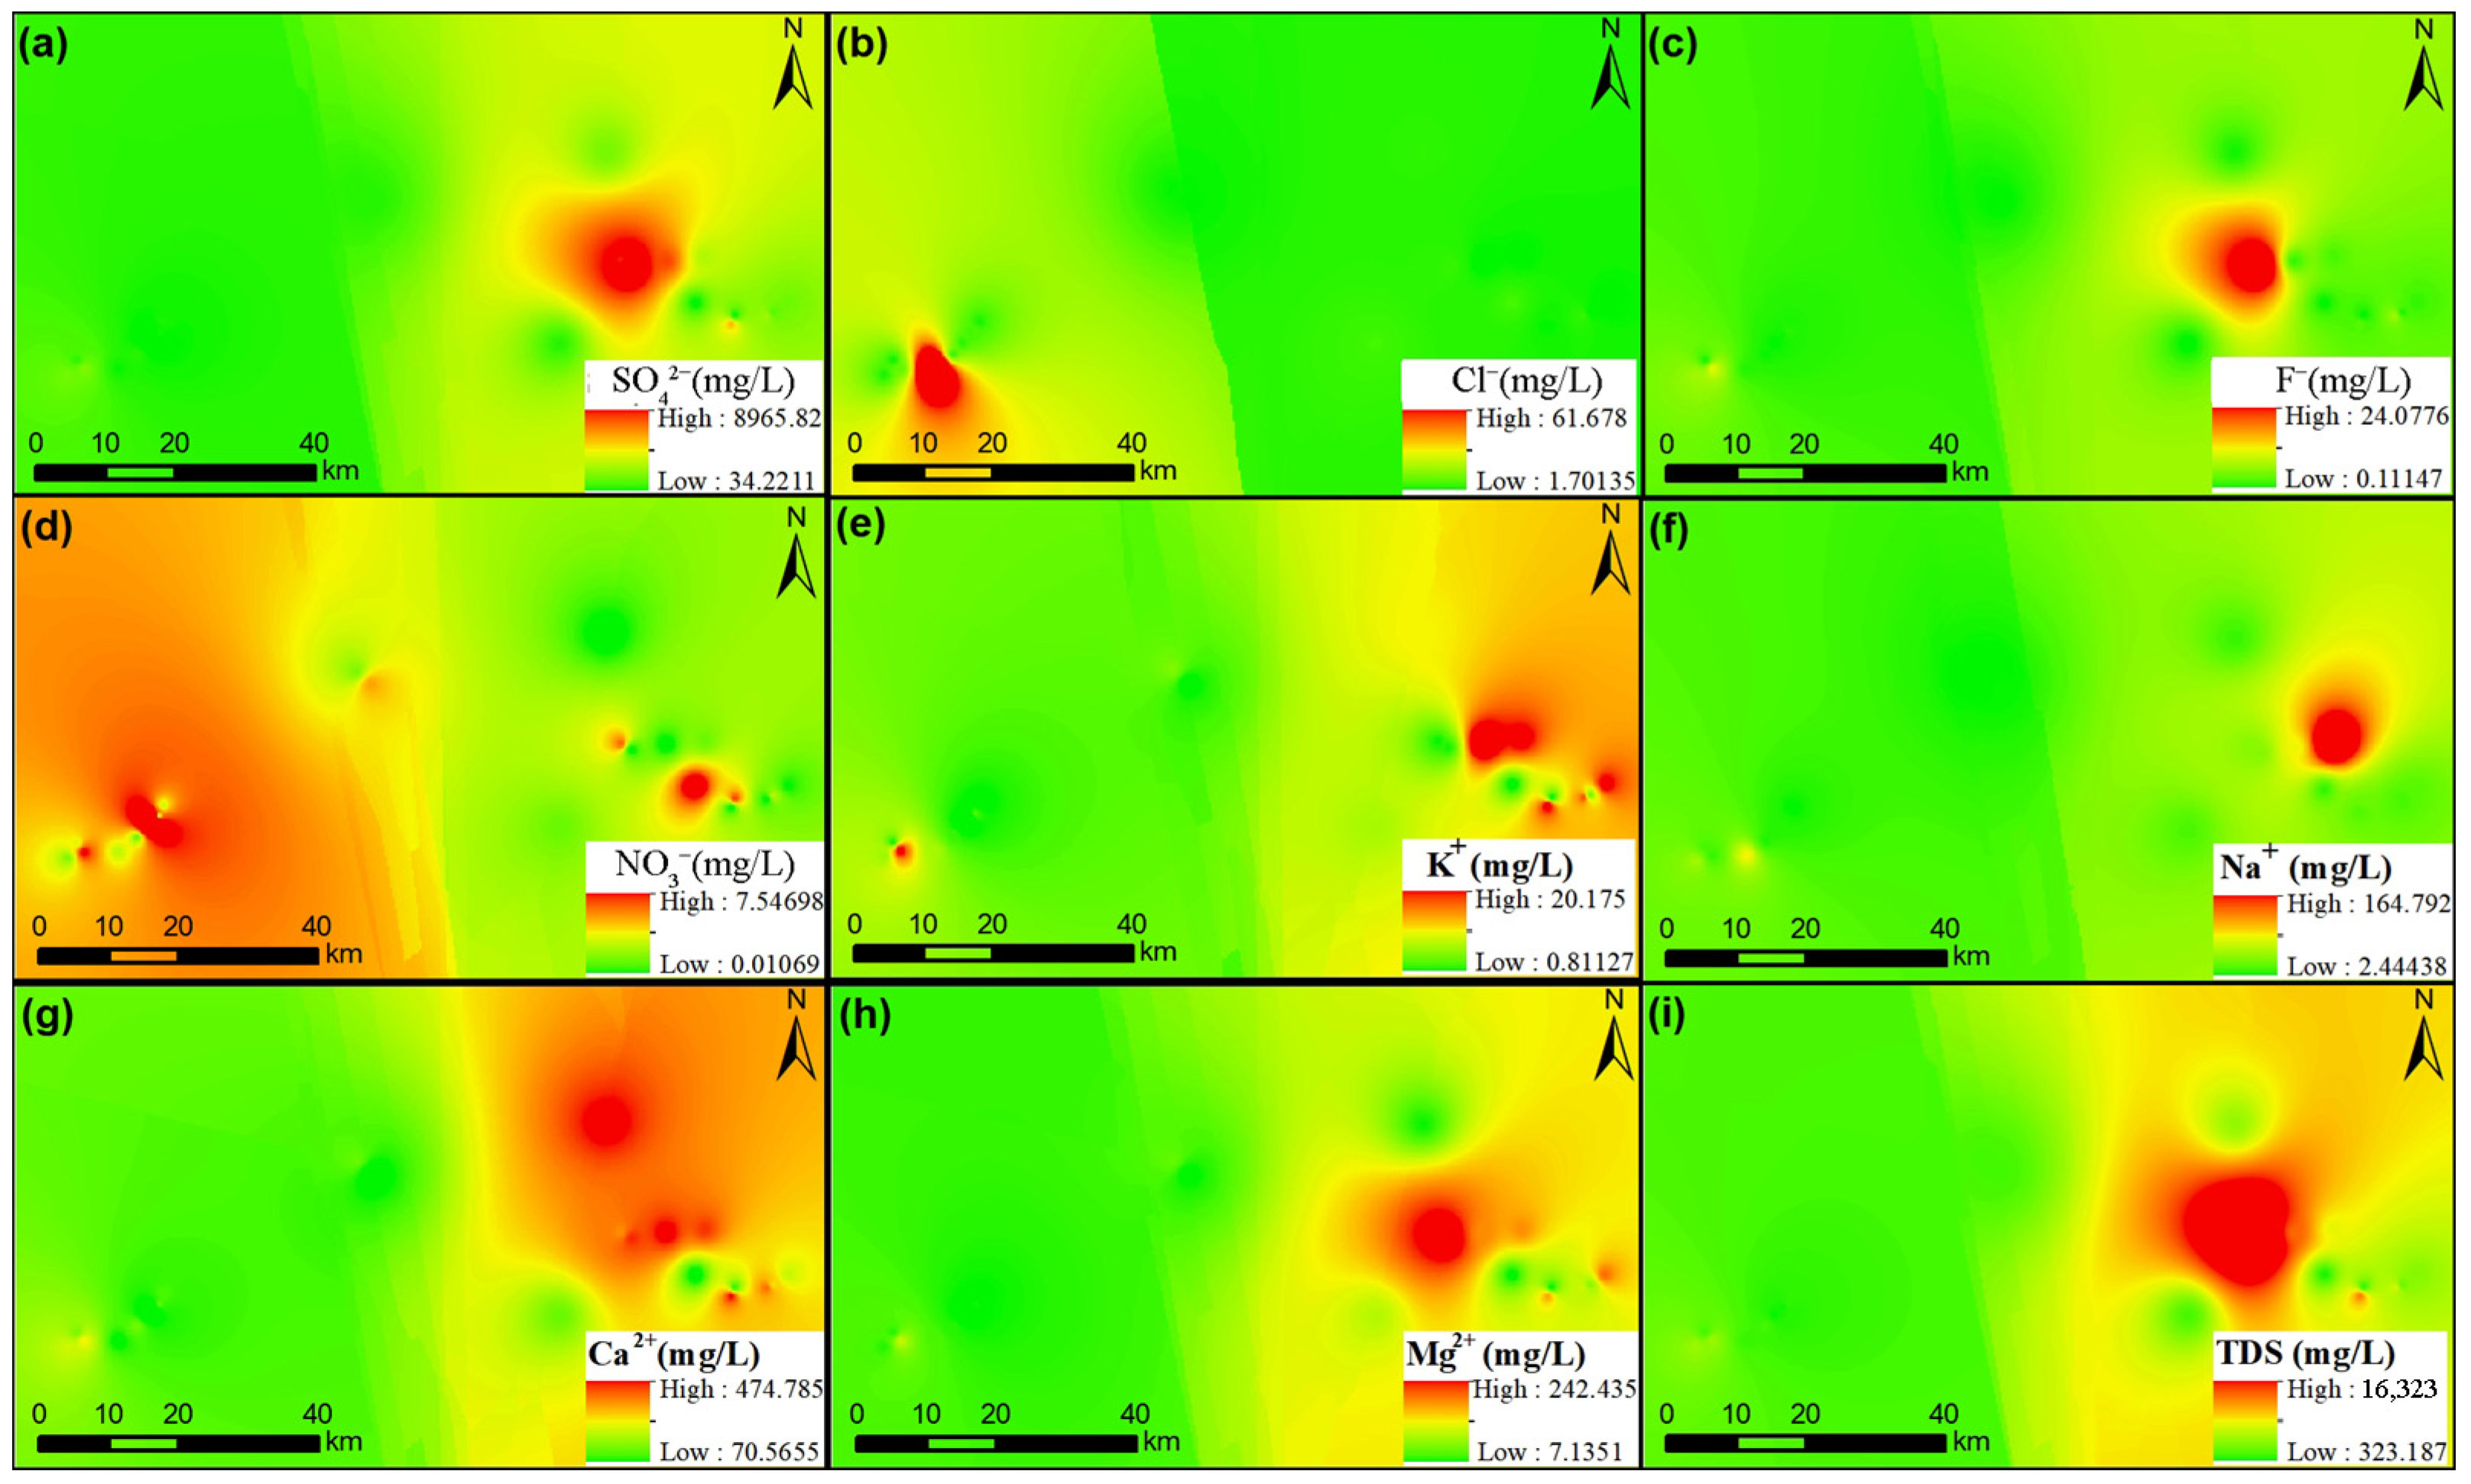
3.1. Hydro-Geochemical Properties of Groundwater

The current study applied a Piper tri-linear diagram to identify the hydro-geochemical facies of the groundwater [26]. As depicted in Figure 2, water hydrochemistry can be categorized into four hydro-chemical facies [27]: (1) SO4⋅Cl–Ca⋅Mg; (2) HCO3–Na; (3) HCO3–Ca⋅Mg; and (4) SO4⋅Cl–Na. Projection of the samples of groundwater from the area of study into the Piper diagram showed groundwater to be predominantly of the SO4⋅Cl–Ca⋅Mg (51.8%) and HCO3–Na (48.2%) types.
Statistical analysis is commonly utilized to analyze the hydro-geochemistry of water [28,29]. Table 4 provides a summary of variation in hydro-chemical parameters of the groundwater samples. Groundwater samples were acidic to neutral, with a pH of 2.49–8.06. TDS of the groundwater samples ranged between 299 mg/L and 16,347 mg/L, with 16 of 34 samples surpassing the water for drinking limit of 1000 mg/L [30]. The highest TDS levels in the groundwater were found in the eastern regions, mainly related to anthropogenic sources (drainage waste, septic tank leaks, irrigation-rerun-flows, etc. [31,32]). The hardness of the groundwater samples ranged between moderate and extreme, with total hardness (TH) ranging between 214 mg/L and 2175 mg/L (Figure 3).
As shown in Figure 4, K+ and Cl were predominantly concentrated in Wangcang and Jiange, with a spread consistent with that of NO3. This result indicated a common anthropogenic source amongst these ions. NO3 ranged between 0.01 mg/L and 7.99 mg/L, far below the standard for water for drinking of 45 mg/L [30]. It mainly comes from agricultural nitrogen-containing wastewater, landfill leachate, and compost [33,34,35]. Levels of Na+ in the groundwater ranged between 2.41 and 165.00 mg/L, with the highest levels found in Wangcang. The eastern region of the area of study showed enrichment in Ca2+ (64–475 mg/L) and Mg2+ (7–243 mg/L). F ranged between 0.11 and 24.20 mg/L. Weathering and dissolution of fluoride-containing minerals (apatite, biotite, and hornblende) and phosphate fertilization are the main source of F content in groundwater under alkaline conditions [36,37]. SO42− levels ranged between 34.20 and 8980.00 mg/L, with the highest levels in Wangcang, surpassing the standard for water for drinking by a factor of 35.96. Analysis of the data and a field survey indicated the presence of 118 coal mines in Wangcang. Consequently, groundwater quality in this region was poor because of the seepage of mine water into the groundwater table.
The high groundwater levels of SO42−, TDS, Mg2+, and Ca2+ in the study region could be attributed to the influences of the mines. The high levels of TDS and SO42− were due to the presence of sulfur coal in the form of pyrite (FeS2) and other metal sulfide minerals. Mining of coal exposes metal sulfides to oxygen. Following abandonment, water accumulates in the mine and high levels of SO42− are released into this mine water due to water–rock reactions and oxidation. Under these processes, AMD is produced, which poses a serious hazard to local groundwater.

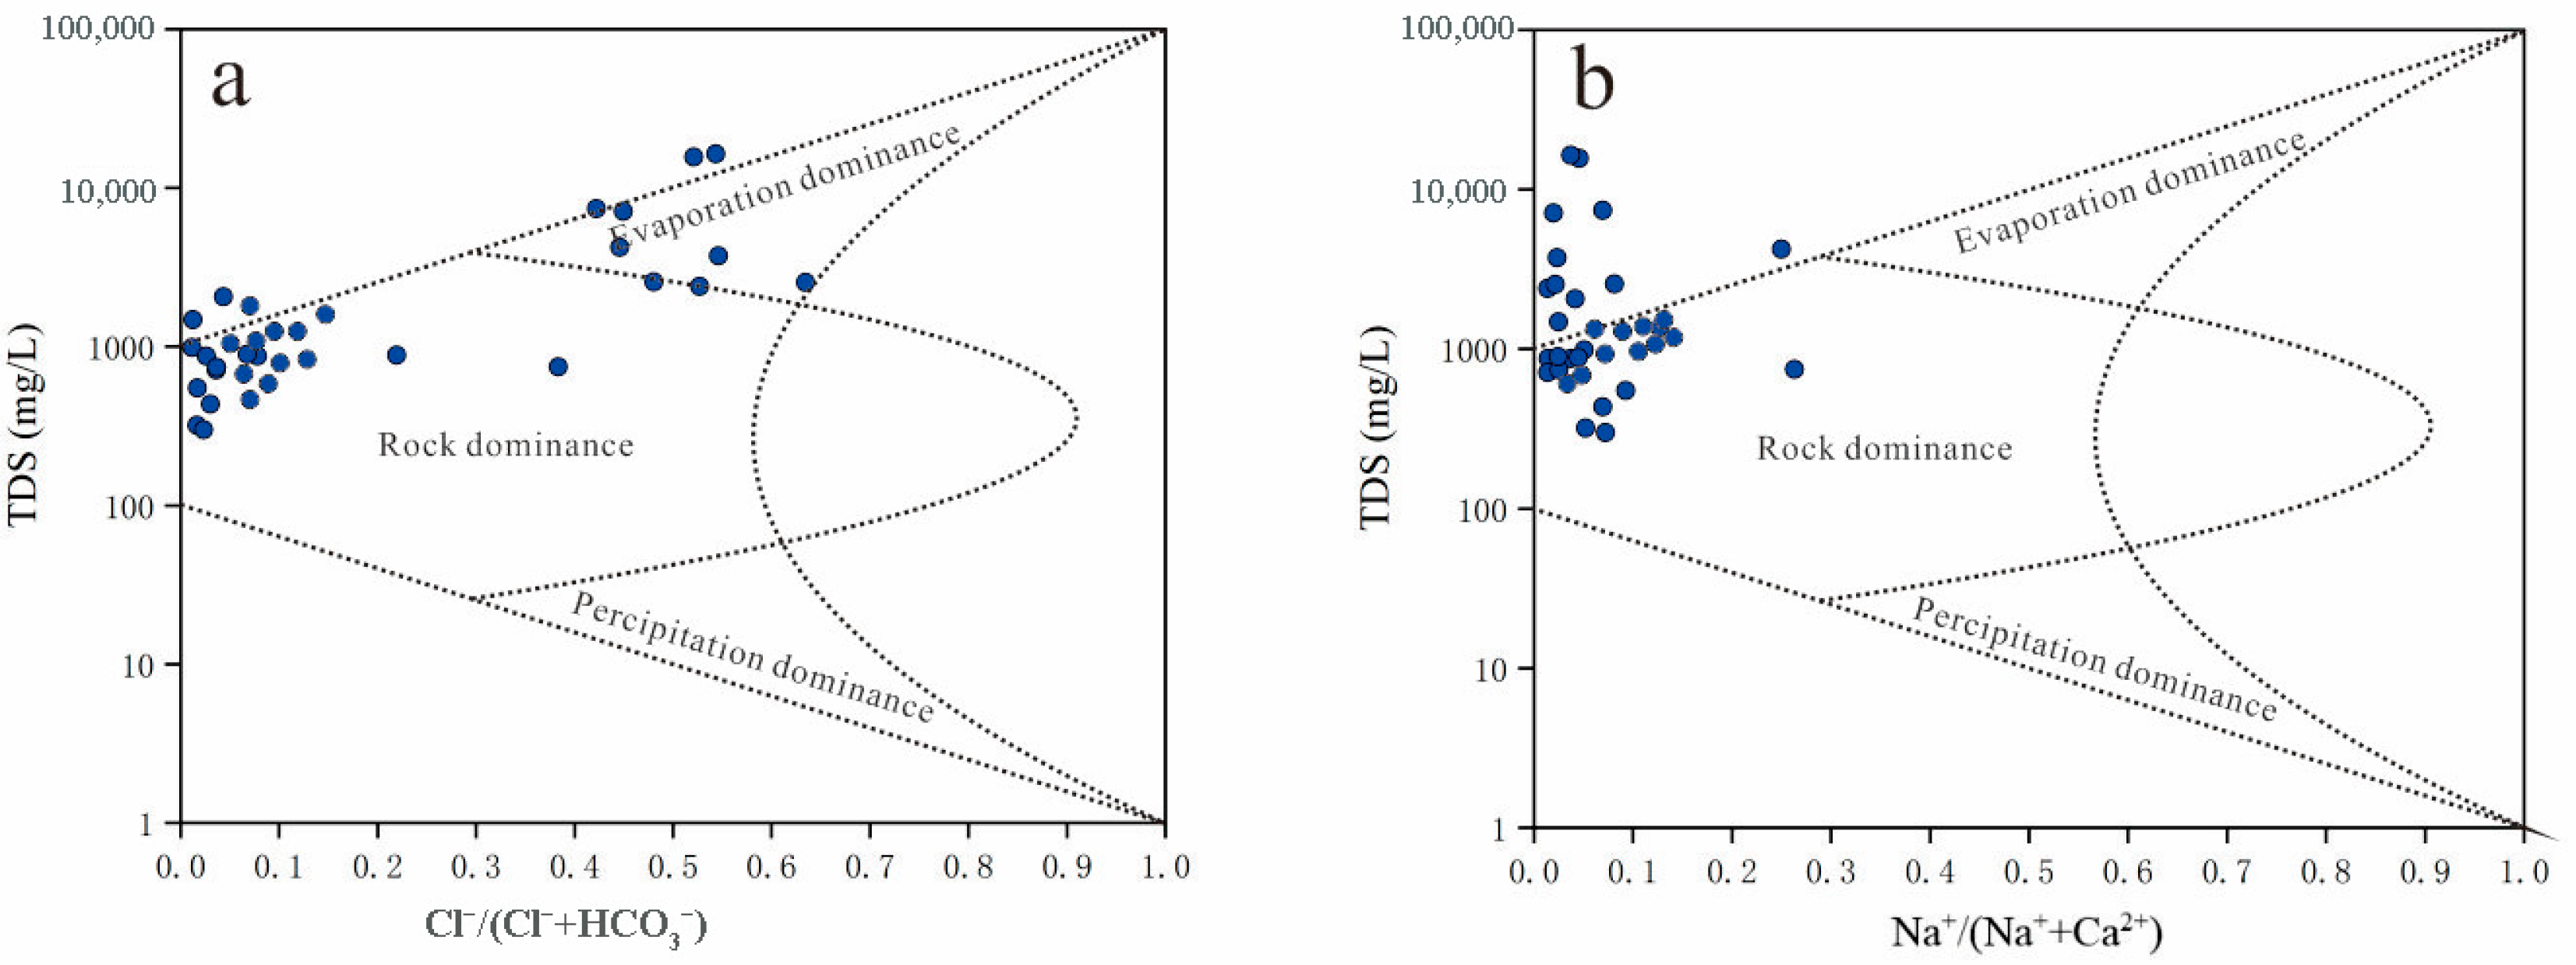
3.2. Factors Regulating Groundwater Chemistry in the Study Region

The Gibbs diagram can be utilized to identify the origins of different ions in groundwater. The sources of groundwater ionic components can generally be classed into the evaporation dominance, rock dominance, and precipitation dominance categories [38]. The area of study contains widely distributed limestone and abundant karst water. The aquifer group in the area of study predominantly consists of limestone. Coal strata are also widely found in the area of study. Therefore, dissolution and erosion of minerals in the area of study play a crucial role in the hydrochemistry of the groundwater. Within the Gibbs diagram, most of the sample points plotted on the area of rock weathering, followed by evaporative level, indicating that these two process classes explained the majority of groundwater Ca2+ and HCO3 (Figure 3). Among all samples, the Na+/(Na+ + Ca2+) ratio was < 0.5, with Na+ as the dominant cation (Figure 5b). The ratio of Cl/(Cl + HCO3) was < 0.5, with HCO3 being dominant (Figure 5a). The inconsistency between groundwater anions and cations could be attributed to alternating cationic adsorption regions driven by spatially varying water–rock interactions. Consequently, some water samples plotted outside the box in the Gibbs diagram.
In Figure 6a, all of the groundwater samples were distributed below the y = x line, indicating that Na+ comes from silicate dissolution or ion exchange. Combined with Figure 6b,c, it is shown that the dominance of Ca2+ and Na+ in the groundwater indicated the dissolution of limestone to be a major factor regulating groundwater chemistry. In the bivariate diagram of (Ca2+ + Mg2+) and (HCO3 + SO42−), most groundwater samples were plotted along or above the y = x line, indicating that the cation exchange process has an obvious impact on the groundwater chemistry (Figure 6d). Most of samples were plotted in the transition between silicate rocks and carbonate rocks (Figure 6e,f). Moreover, the existence of cation exchange was supported by the weight ratios of (Na+ + K+ − Cl) against (Ca2+ + Mg2+) − (HCO3 + SO42−) (Figure 6g). Meanwhile, NO3 concentrations were affected by agriculture activities to a certain extent, as shown in Figure 6h. Figure 6i shows that the SI values of Aragonite were higher than zero, while the SI values of anhydrite, calcite, dolomite, gypsum, Halite were lower than zero. These results could be attributed mining-driven increases in groundwater TDS and Na+. The results also indicated that evaporative crystallization impacts groundwater chemistry in the area of study.

3.3. Characterization of Groundwater Toxic Metals

Levels of Groundwater Toxic Metals

Table 5 shows the properties and spread of the ten groundwater metals examined in the current study. The order of metals in groundwater according to their levels was: Fe > Al > Pb > Zn > Mn > Cu > Cr > Cd > As > Hg. Fe, Mn, Al, Pb, Cd, and Cr exceeded their respective water for drinking guidelines [30]. The average levels of groundwater Fe, Al, and Cd all significantly exceeded their respective WHO [30] guidelines for water for drinking with values of 303.24 mg/L, 66.97 mg/L, and 194.53 g/L, respectively. It can be seen from Figure 7 that the areas with a high concentration of heavy metals are mainly concentrated in Wangcang.

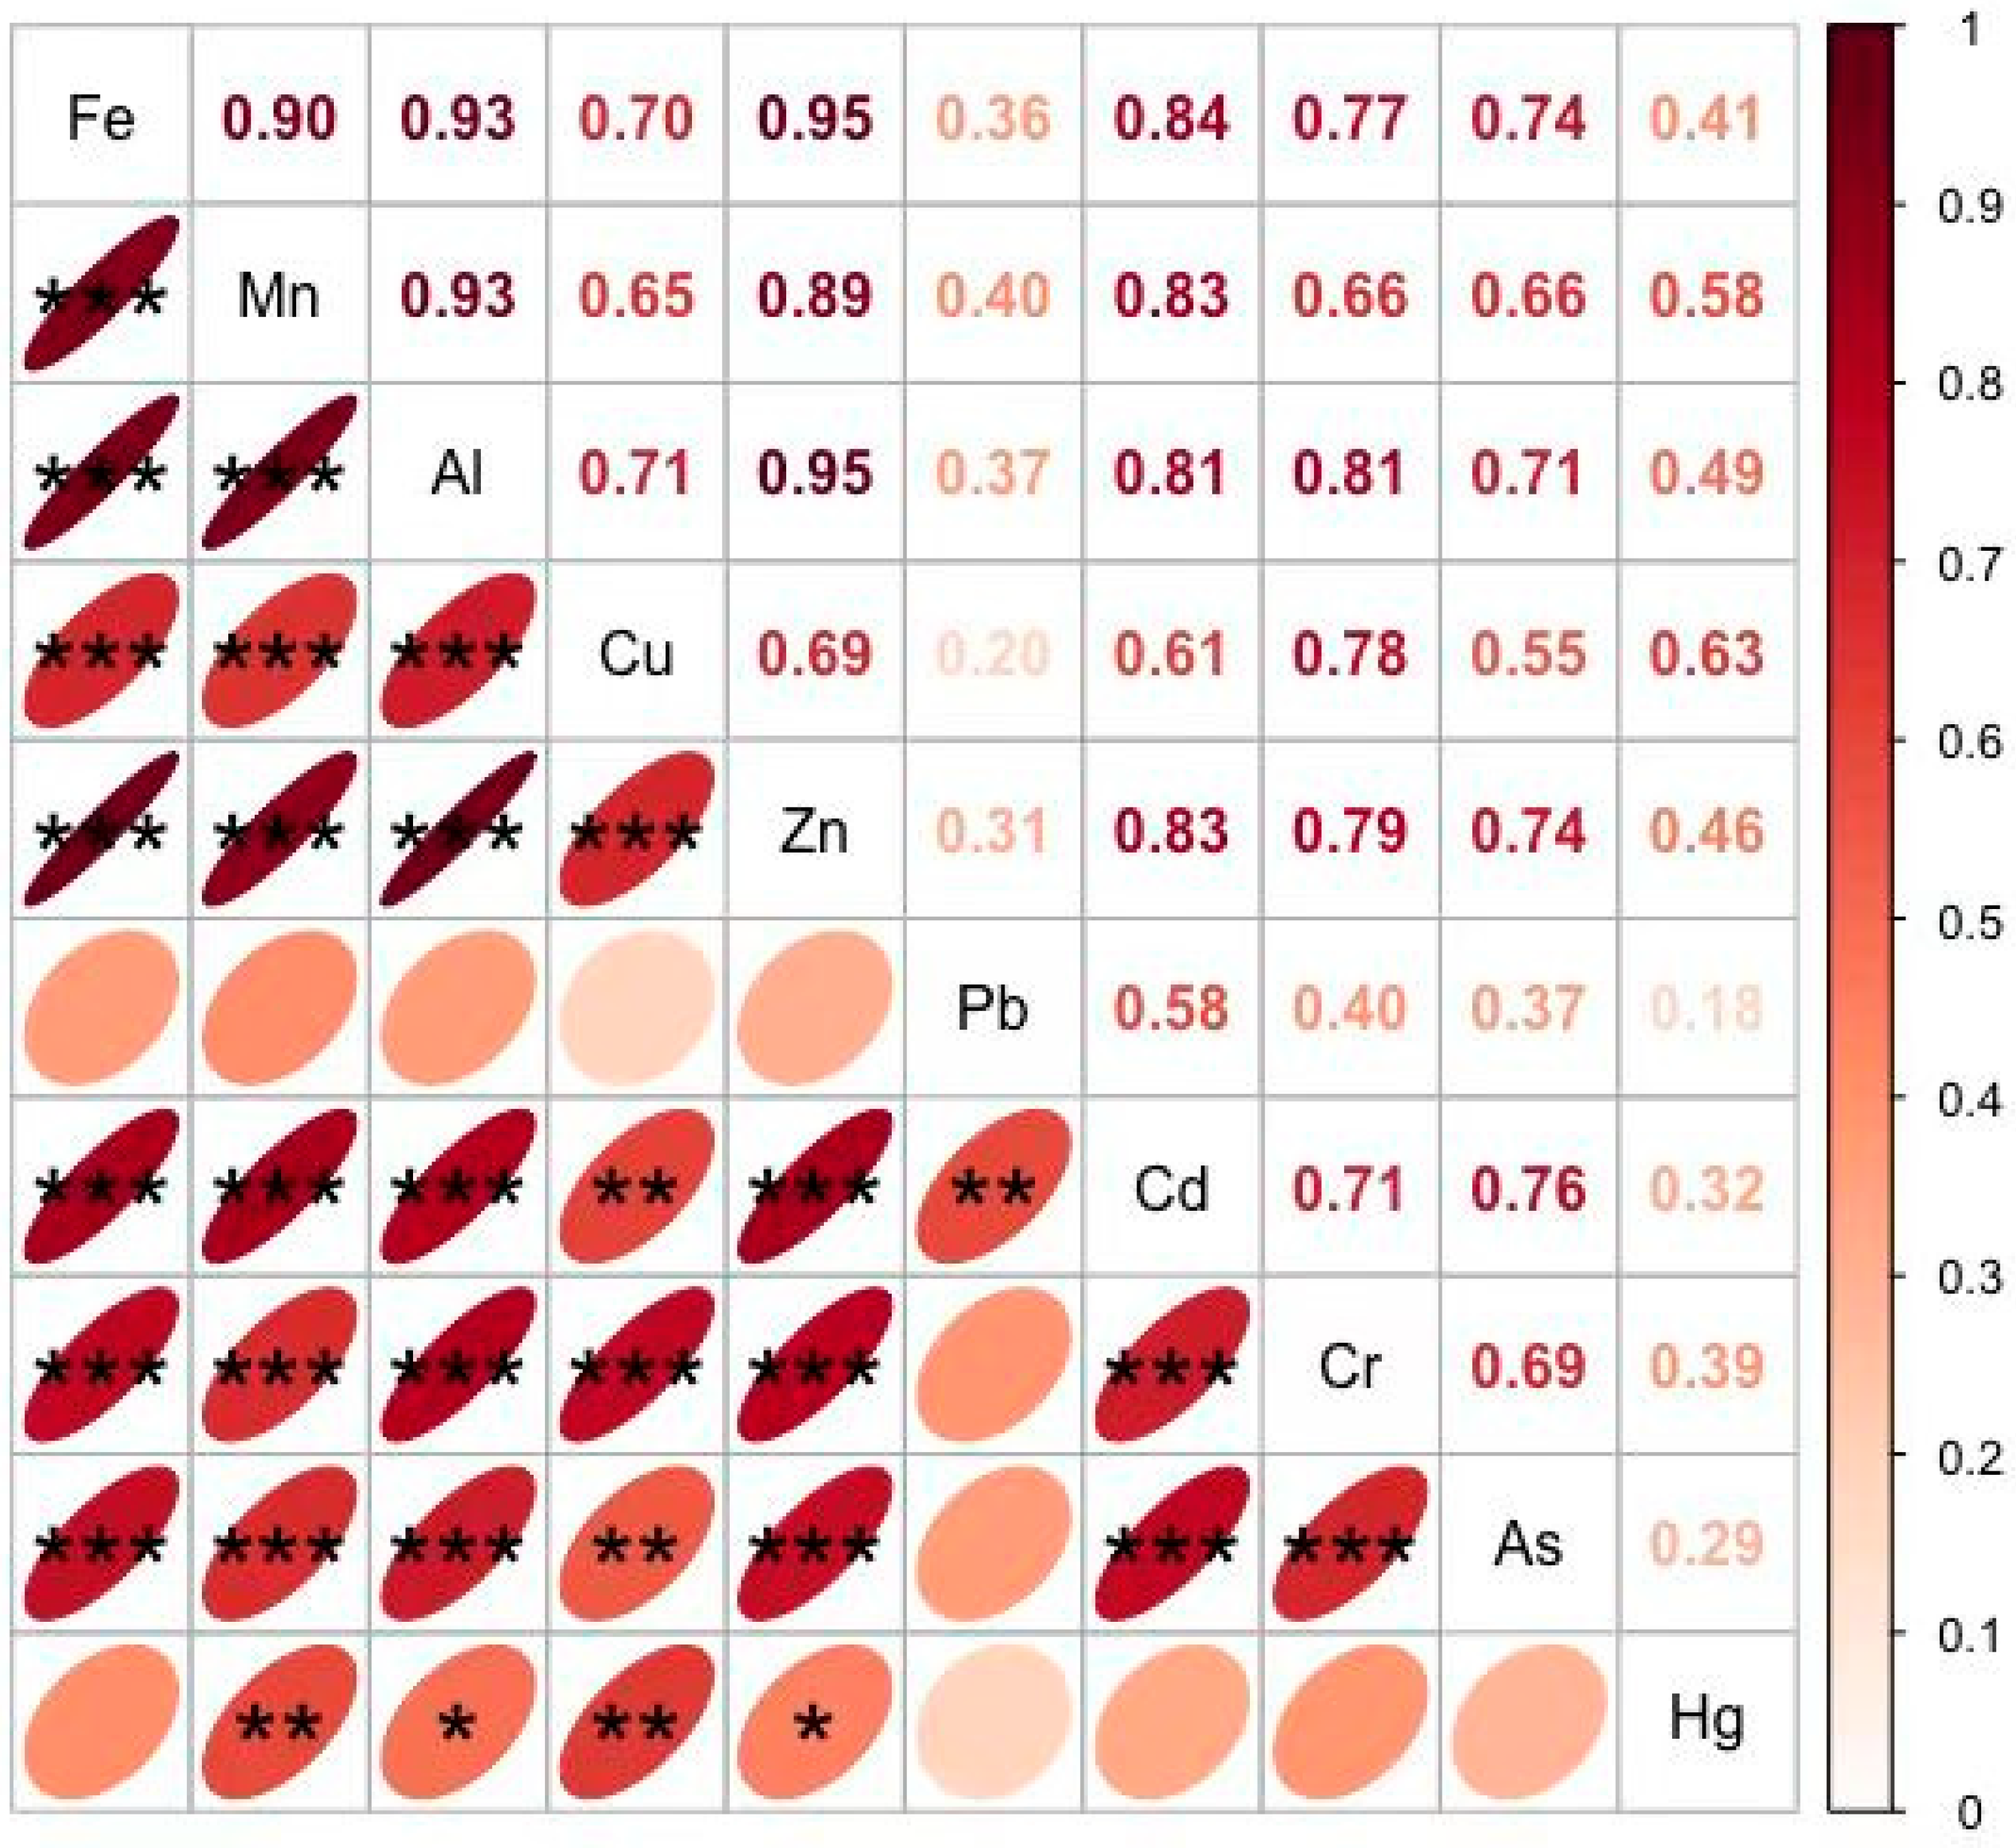
3.4. 2 Relationships Between Metals in the Groundwater Samples

The current study applied Spearman correlation to analyze the relationships between groundwater metals. As shown in Figure 8, there were significant correlations between Mn, Al, Cu, and Zn. These results could be predominantly attributed to the impacts of the sedimentary environment, coal and bauxite layers, metal sulfides, and generation of AMD containing metal ions. There were also weak correlations between Pb, Cd, Cr, As, Hg, Fe, Mn, Cu, and Zn.

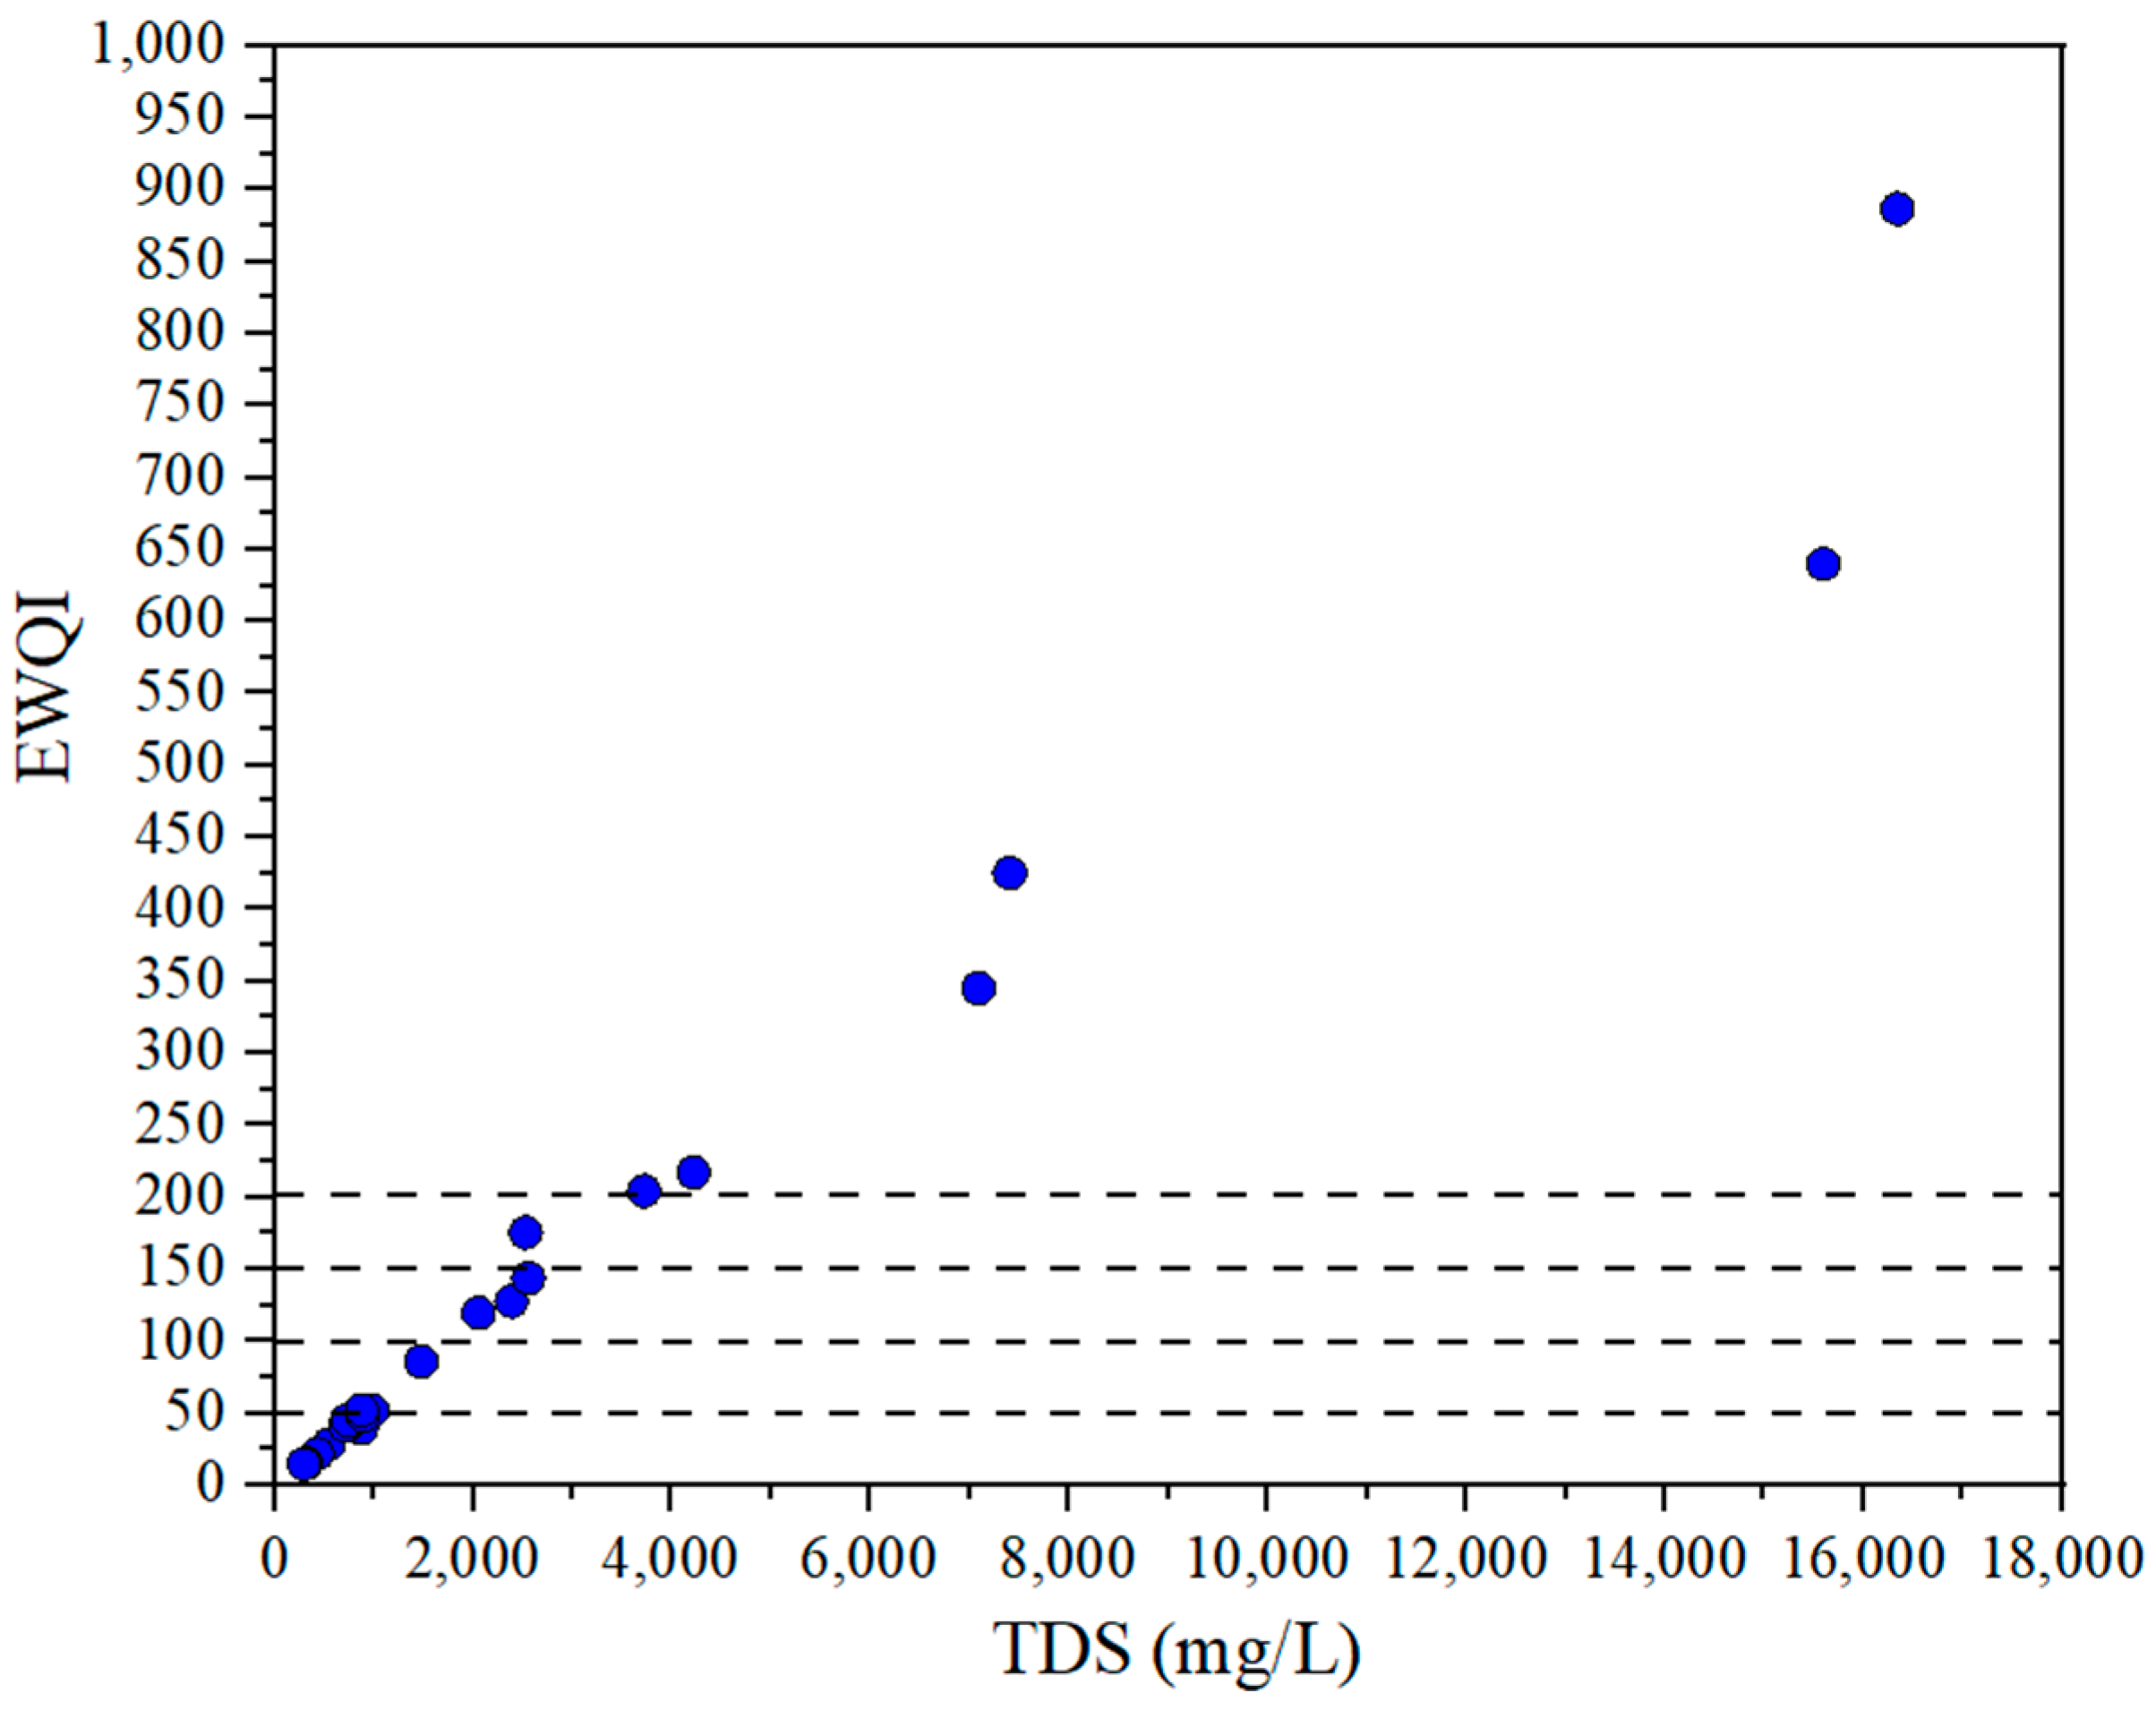
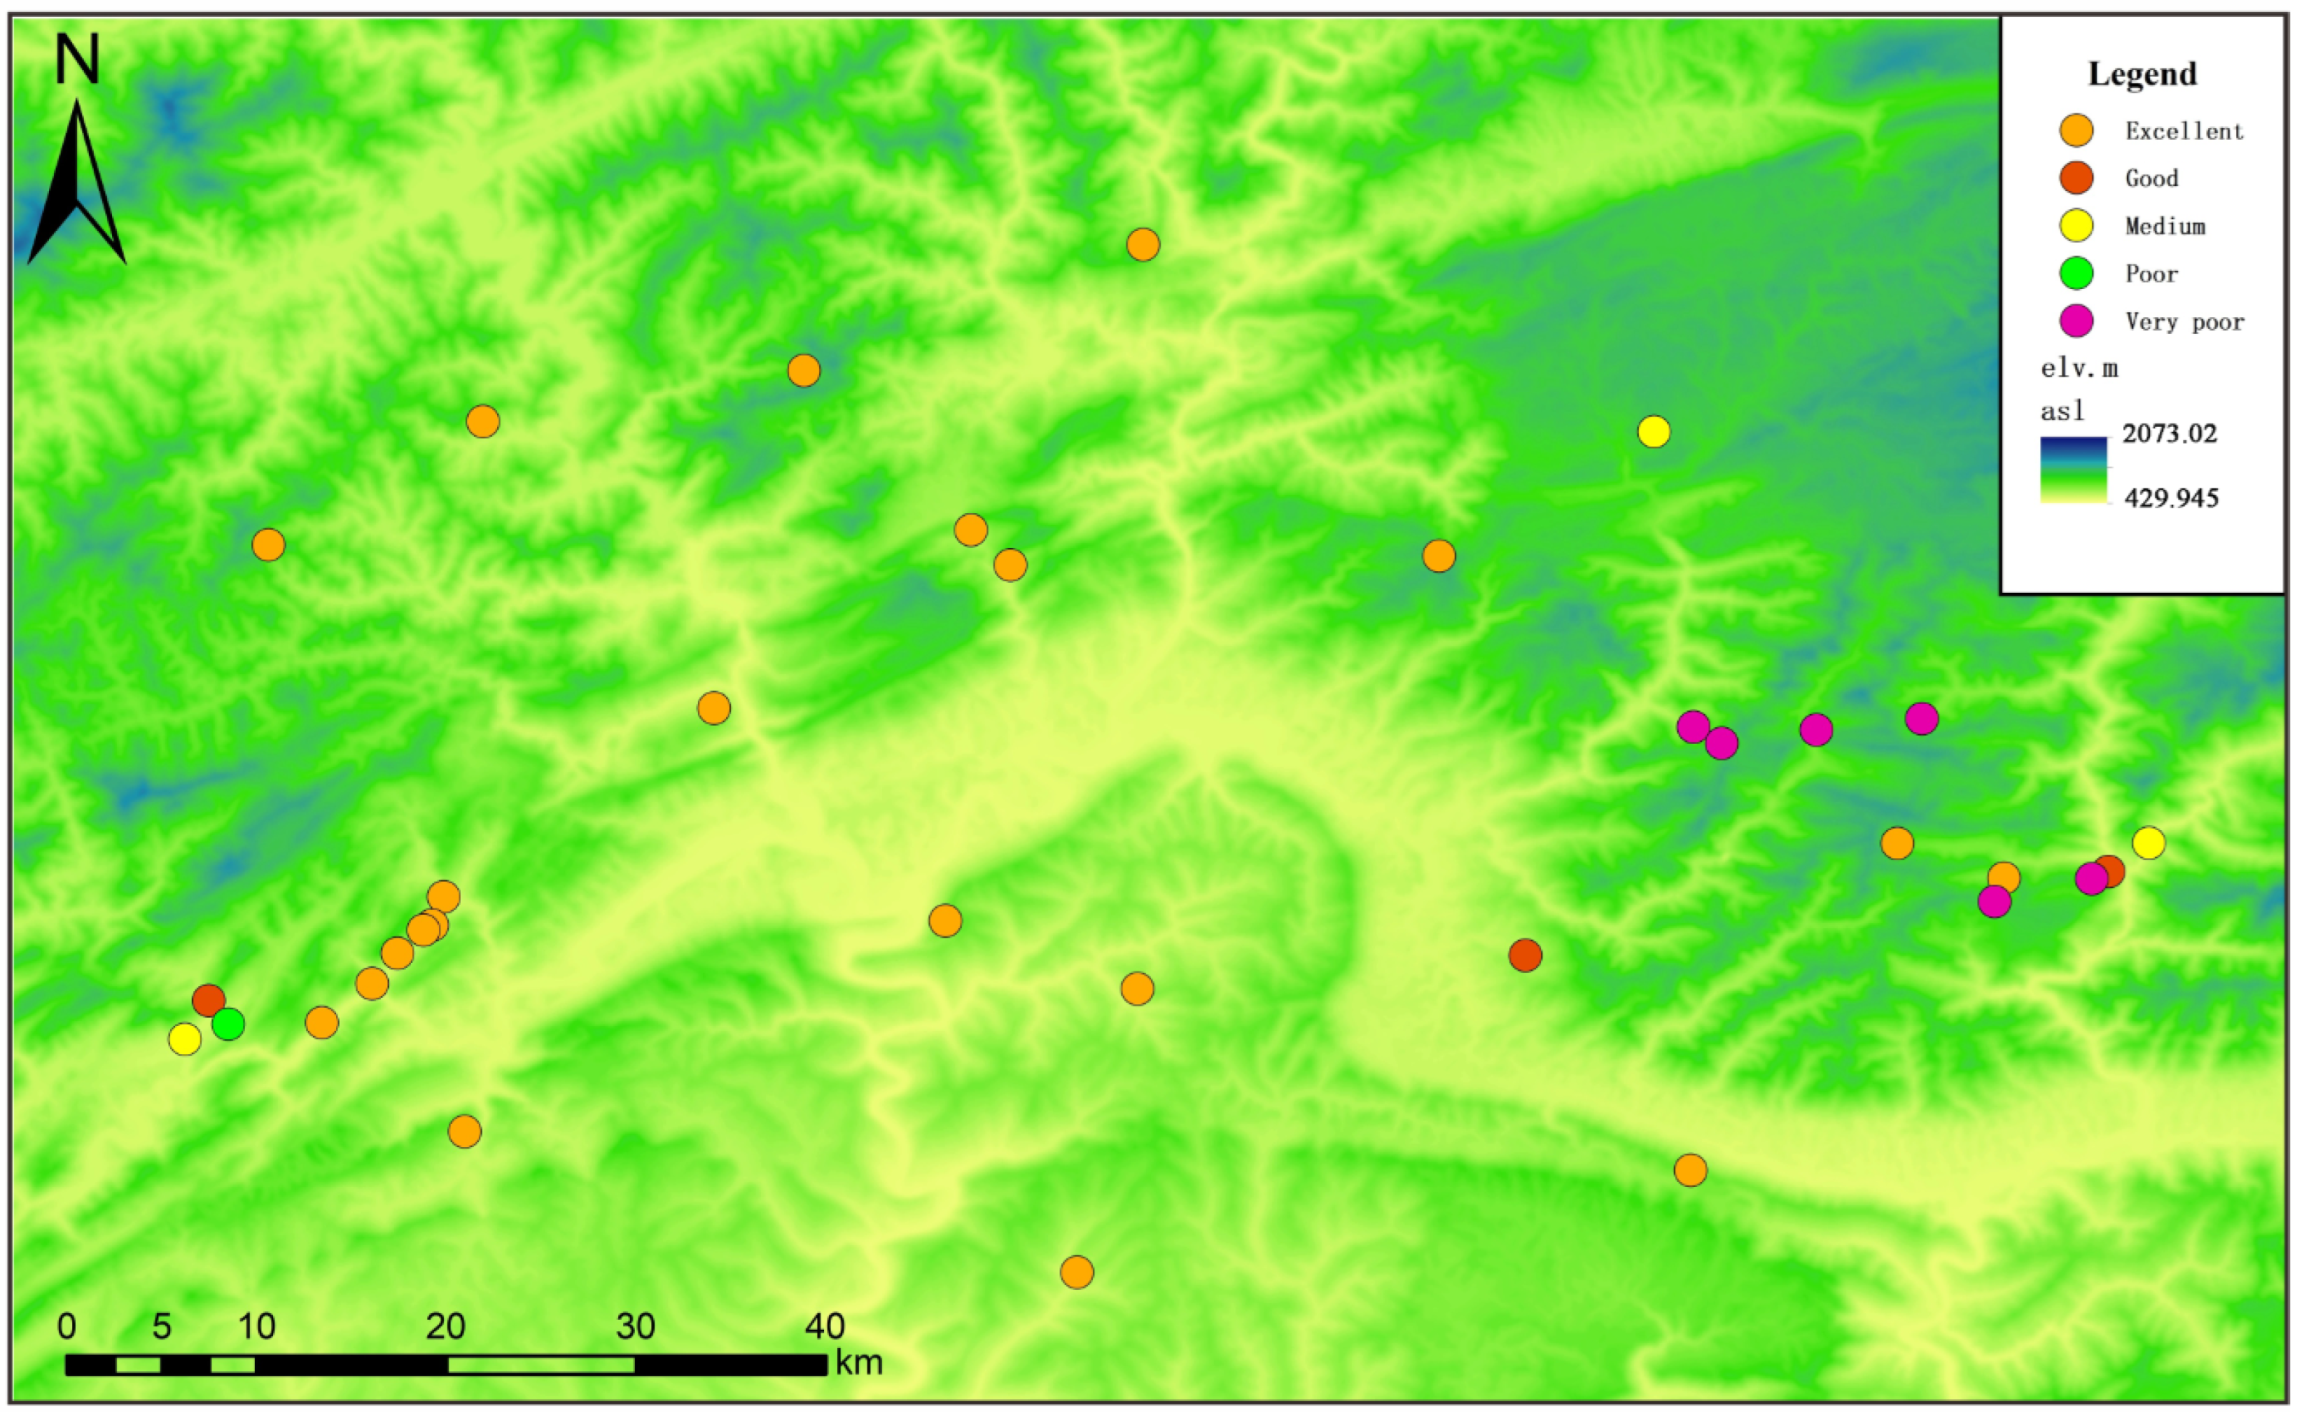
3.5. EWQI Assessment of Groundwater Quality

The EWQI has been utilized in previous studies to comprehensively assess the impacts of hydro-chemical factors on overall water quality [39]. An EWQI < 100 indicates an overall safety of water for drinking purposes. When calculating the EWQI, the current study considered groundwater levels of K+, Ca2+, Na+, Mg2+, Cl, F, NO3, SO42−, and TDS. Among the different groundwater samples, the EWQI ranged between “excellent” and “very bad”, with a mean value of 166 (Figure 9). Of the groundwater samples, 71% were classed as either “excellent” or “good”, thereby complying with the WHO [30] water for drinking guidelines. However, the EWQI of ten groundwater samples exceeded 100, indicating their unsuitability for use as water for drinking.
As shown in Figure 10, the majority of groundwater in the area of study was classed as suitable for use as water for drinking. Most samples classed as unsuitable for use as water for drinking were distributed in the east. According to previous studies and a field investigation, the area of study represents an area of transition from mountain to basin. Consequently, the area of study has a relative elevation difference over 3200 m. The area of study is also characterized by a deep valley with a small population, scarce arable land, and low socioeconomic development. Given the lack of other anthropogenic activities, it can be concluded that mining is the predominant contributor to groundwater pollution in the area of study. Therefore, there is a need for increased focus on groundwater quality conservation in the east of the area of study, which will require long-term monitoring and dynamic evaluation of the groundwater quality.

3.6. Appraisal of the Hazards Posed by the Groundwater Quality to Human Health and Uncertainty Analysis

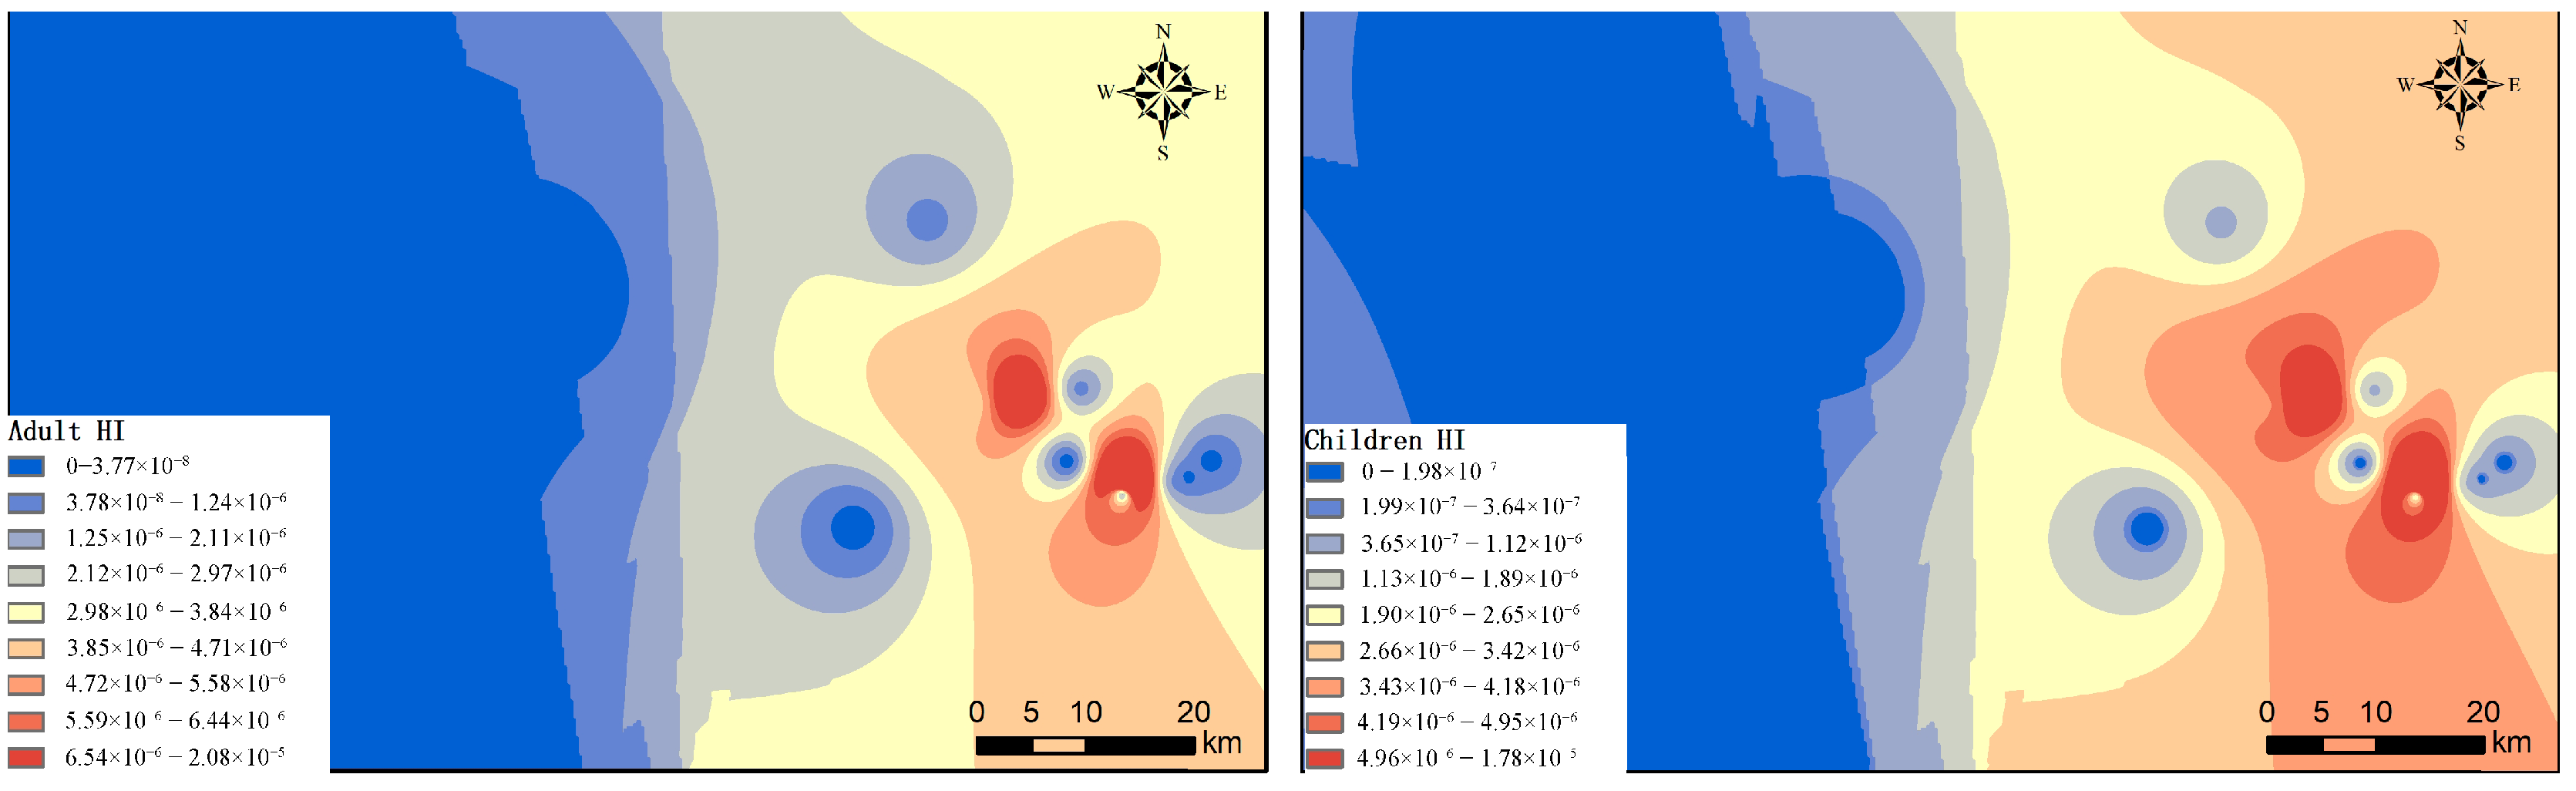
3.6.1. Appraisal of the Health Risk

The results indicated the hazards of the groundwater in the area of study to the health of adults and juveniles due to the use of the water for drinking or ingesting and dermal contact (Table 6). The order of the eight metals according to human health risks was: Cr > Cd > As > Fe > Pb > Cu > Mn > Zn. Levels of Cr and Cd exceeded the maximum tolerable carcinogenic hazard of 1 × 10⁻⁴ [25]. The total carcinogenic hazards posed by the groundwater quality to grownups and juveniles ranged from 2.06 × 10⁻⁵ to 8.79 × 10⁻² and 1.76 × 10⁻⁵ to 7.49 × 10⁻². In the groundwater of a karst lead–zinc mine, the risk values of heavy metals such as Cd, Pb, and Zn are higher [40]. The risk value of heavy metals in an alum mining area is usually Cd > As > Cu > Mn [41]. The current study also calculated the total non-carcinogenic hazard to the health of humans based on the groundwater metals (Table 6), as well as the spread (Figure 9). The total non-carcinogenic hazards posed by the groundwater quality in the area of study to grownups and juveniles ranged from 1.14 × 10⁻⁷ to 3.68 × 10⁻⁵ and 9.71 × 10⁻⁸ to 3.41 × 10⁻⁵, respectively. No groundwater samples exceeded the maximum permissible non-carcinogenic hazard value of 1 × 10⁻⁴ [25].
The spread of the hazard index (HI) (Figure 11) indicated non-carcinogenic health hazards in the east that significantly exceeded that in the west, due to the levels of groundwater metals in the east. Groundwater non-carcinogenic health hazards were predominantly in the Wangcang County, southeast Chaotian County, and northeast Zhaohua County, which could be directly attributed to high groundwater metal contents. The spread of HI was consistent with that of abandoned coal mines.
The USEPA [25] categorization indicated acceptable non-carcinogenic hazards in the study region, with an HI for both grownups and juveniles < 1. The results also showed that health hazards associated with ingestion of groundwater as water for drinking exceeded those associated with dermal contact by a factor of 2–3. The hazard posed by groundwater quality to grownup health exceeded that to juvenile health. This is because exposure of adults to groundwater through consumption of water for drinking and dermal contact exceeded that to juveniles by factors of 1.17 and 1.65, respectively.

3.6.2. Sources of Uncertainty

The confounding impacts of multiple influencing factors may result in unrealistic hazard values. The results of the current study may have been impacted by the following sources of uncertainty: (1) human and instrument error during sampling, transportation, and testing of samples and (2) the applicability of the USEPA standard and hazards parameters utilized in the exposure appraisal stage and its evaluation to the population in China. While these uncertainties may have impacted the results of the health hazard appraisal, the results remain valid and useful, and the uncertainties point to directions of future research needed.

4. Conclusions

The present study assessed the hydro-chemical properties of the groundwater in the Guangwang mining area as a typical mining area and its associated human health risks. The predominant results of the current study are listed below:
(1) Past mining activities led to the highest average levels of TDS and SO42− being located in the east. The predominant groundwater hydro-chemical types in the area of study were SO4⋅Cl–Ca⋅Mg and HCO3–Na.
(2) The predominant groundwater hydro-chemical type in the area of study was Ca-HCO3. Leaching and evaporative levels within the limestone of the coal seam aquifer were identified as the predominant factors regulating groundwater hydrochemistry. Within the groundwater, levels of six of the ten assessed metals exceeded the WHO safe water for drinking standards, with levels of Al (66.97 mg/L) and Cd (194.53 μg/L) being particularly high.
(3) There were significant correlations between groundwater Mn, Al, Cu, and Zn. This could be attributed to the bauxite minerals of abandoned coal mines and the release of a range of metal sulfides through oxidation.
(4) Consumption of the groundwater as water for drinking was the predominant route of the hazards posed by the groundwater quality to the health of humans. The hazards also decreased from east to west, which is consistent with the spreads of abandoned coal mines and fissures. The hazards posed by the groundwater quality to grownup health exceeded that to juvenile health due to higher exposure for the former.
The results of the current study can guide future groundwater quality management in the Guangwang mining area and in similar mining areas in China and abroad.

Author Contributions

Methodology, M.Z. and J.F.; Software, M.Z. and S.R.; Investigation, S.R.; Writing—original draft, M.G.; Writing—review & editing, G.L.; Supervision, J.F.; Project administration, G.L. All authors have read and agreed to the published version of the manuscript.

Funding

This research received no external funding.

Institutional Review Board Statement

Not applicable.

Informed Consent Statement

Not applicable.

Data Availability Statement

Data is contained within the article.

Conflicts of Interest

The authors declare no conflict of interest.

References

  1. Zhang, Y.H.; Dai, Y.S.; Wang, Y.; Huang, X.; Xiao, Y.; Pei, Q.M. Hydrochemistry, quality and potential health risk appraisal of nitrateenriched groundwater in the Nanchong area, southwestern China. Sci. Total Environ. 2021, 784, 147186. [Google Scholar] [CrossRef] [PubMed]
  2. Emenike, P.C.; Nnaji, C.C.; Tenebe, I.T. Assessment of geospatial and hydrochemical interactions of groundwater quality, southwestern Nigeria. Environ. Monit. Assess. 2018, 190, 440. [Google Scholar] [CrossRef] [PubMed]
  3. Liu, J.; Gao, Z.; Wang, M.; Li, Y.; Ma, Y.; Shi, M.; Zhang, H. Study on the dynamic characteristics of groundwater in the valley plain of Lhasa City. Environ. Earth Sci. 2018, 77, 646. [Google Scholar] [CrossRef]
  4. Liu, J.; Peng, Y.; Li, C.; Gao, Z.; Chen, S. Characterization of the hydrochemistry of water resources of the Weibei Plain, Northern China, as well as an assessment of the risk of high groundwater nitrate levels to human health. Environ. Pollut. 2021, 268, 115947. [Google Scholar] [CrossRef]
  5. Rezaei, A.; Hassani, H.; Tziritis, E.; Mousavi, S.B.F.; Jabbari, N. Hydrochemical characterization and evaluation of groundwater quality in Dalgan basin, SE Iran. Groundw. Sustain. Dev. 2020, 10, 100353. [Google Scholar] [CrossRef]
  6. Jia, H.; Qian, H.; Zheng, L.; Feng, W.; Wang, H.; Gao, Y. Alterations to groundwater chemistry due to modern water transfer for irrigation over decades. Sci. Total Environ. 2020, 717, 137170. [Google Scholar] [CrossRef] [PubMed]
  7. Adimalla, N. Application of the Entropy Weighted Water Quality Index (EWQI) and the Pollution Index of Groundwater (PIG) to Assess Groundwater Quality for Drinking Purposes: A Case Study in a Rural Area of Telangana State, India. Arch. Environ. Contam. Toxicol. 2021, 80, 31–40. [Google Scholar] [CrossRef] [PubMed]
  8. Marghade, D.; Malpe, D.B.; Duraisamy, K.; Patil, P.D.; Li, P. Hydrogeochemical evaluation, suitability, and health risk assessment of groundwater in the watershed of Godavari basin, Maharashtra, Central India. Environ. Sci. Pollut. Res. 2020, 28, 18471–18494. [Google Scholar] [CrossRef]
  9. Dang, Z.; Lu, G.L.; Yang, C.; Yi, X.Y.; Guo, C.L. Source control and remediation of environmental contamination in metal sulfide mine areas. J. South China Univ. Technol. Nat. Sci. Ed. 2012, 40, 83–89. [Google Scholar]
  10. Fu, S.M.; Zhou, Y.Z.; Gao, Q.Z.; Yang, Z.J.; Zhang, C.B.; Yang, X.Q.; Zhao, Y.Y. Environmental geochemistry of metallic sulfide mines—A review. Earth Environ. 2006, 34, 23–29. [Google Scholar]
  11. Nieva, N.E.; Borgnino, L.; García, M.G. Long term metal release and acid generation in abandoned mine wastes containing metal-sulphides. Environ. Pollut. 2018, 242, 264–276. [Google Scholar] [CrossRef] [PubMed]
  12. Elijah, M.M.; Wanda, G.C.; Felix, M.T. Hydrogeochemical characterization of water quality evolution within Livingstonia coalfield mining areas in Rumphi district, northern Malawi. Phys. Chem. Earth 2021, 123, 103045. [Google Scholar]
  13. Jiang, C.L.; Zhao, Q.; Zheng, L.G.; Chen, X.; Li, C.; Ren, M.X. Distribution, source and health risk assessment based on the Monte Carlo method of heavy metals in shallow groundwater in an area affected by mining activities, China. Ecotoxicol. Environ. Saf. 2021, 224, 112679. [Google Scholar] [CrossRef]
  14. Luo, C.; Routha, J.; Dario MSarkar, S.; Wei, L.Z.; Luo, D.G.; Liu, Y. Distribution and mobilization of heavy metals at an acid mine drainage affected region in South China, a post-remediation study. Sci. Total Environ. 2020, 724, 138122. [Google Scholar] [CrossRef]
  15. Mohammadpour, A.; Gharehchahi, E.; Gharaghani, M.A.; Shahsavani, E.; Golaki, M.; Berndtsson, R.; Khaneghah, A.M.; Hashemi, H.; Abolfathi, S. Assessment of drinking water quality and identifying pollution sources in a chromite mining region. J. Hazard. Mater. 2024, 480, 136050. [Google Scholar] [CrossRef] [PubMed]
  16. Olivares, D.M.M.; Santana, C.S.; Neris, J.B.; Luzardo, F.H.M.; Fausto, A.M.F.; Mol, A.W.; Velasco, F.G. Assessment of potential human health, radiological and ecological risks around mining areas in northeastern Brazil. Environ. Geochem. Health 2024, 46, 9. [Google Scholar] [CrossRef] [PubMed]
  17. Huang, X.K. Distribution of coal types in the Guangwang coal field. J. Sichuan Geol. 2010, 30, 404–405. [Google Scholar]
  18. Wu, C.; Wu, X.; Qian, C.; Zhu, G. Hydrogeochemistry and groundwater quality assessment of high fluoride levels in the Yanchi endorheic region, northwest China. Appl. Geochem. 2018, 98, 404–417. [Google Scholar] [CrossRef]
  19. Adimalla, N.; Qian, H.; Li, P.Y. Entropy water quality index and probabilistic health risk assessment from geochemistry of groundwaters in hard rock terrain of Nanganur County, South India. Geochemistry 2019, 80, 125544. [Google Scholar] [CrossRef]
  20. Rao, N.S. Hydrogeology: Problems with Solutions; Prentice Hall of India: New Delhi, India, 2017. [Google Scholar]
  21. Fryer, M.; Collins, C.D.; Ferrier, H.; Colvile, R.N.; Nieuwenhuijsen, M.J. Human exposure modelling for chemical risk assessment: A review of current approaches and research and policy implications. Environ. Sci. Policy 2006, 9, 261–274. [Google Scholar] [CrossRef]
  22. Zhou, B.B.; Li, W.Q.; Guo, J.; Chen, X.P.; Gan, B.; Yang, Y.J.; Yang, Q.; Fan, D.L. Comparison and preference of source analysis models for heavy metal contamination of soil from alum mines in Anhui Province, China. Trans. Chin. Soc. Agric. Eng. Trans. CSAE 2024, 40, 321–327. [Google Scholar]
  23. Giri, S.; Singh, A.K. Risk assessment, statistical source identification and seasonal fluctuation of dissolved metals in the Subarnarekha River, India. J. Hazard. Mater. 2014, 265, 305–314. [Google Scholar] [CrossRef] [PubMed]
  24. USEPA. Exposure Factors Handbook; Office of Research and Development: Washington, DC, USA, 1997.
  25. USEPA. Regional Screening Levels (RSL) Tables; United States Environmental Protection Agency: Washington, DC, USA, 2011.
  26. Piper, A.M. A graphic procedure in the geochemical interpretation of water-analyses. Eos Trans. Am. Geophys. Union. 1944, 25, 914–928. [Google Scholar] [CrossRef]
  27. Yang, Q.; Wang, L.; Ma, H.; Yu, K.; Martín, J.D. Hydrochemical characterization and pollution sources identification of groundwater in Salawusu aquifer system of Ordos Basin, China. Environ. Pollut. 2016, 216, 340–349. [Google Scholar] [CrossRef]
  28. Feng, F.; Jia, Y.; Yang, Y.; Huan, H.; Lian, X.; Xu, X.; Xia, F.; Han, X.; Jiang, Y. Hydrogeochemical and statistical analysis of high fluoride groundwater in northern China. Environ. Sci. Pollut. Res. 2020, 27, 34840–34861. [Google Scholar] [CrossRef]
  29. Yidana, S.M.; Bawoyobie, P.; Sakyi, P.; Fynn, O.F. Evolutionary analysis of groundwater flow: Application of multivariate statistical analysis to hydrochemical data in the Densu Basin, Ghana. J. Afr. Earth Sci. 2018, 138, 167–176. [Google Scholar] [CrossRef]
  30. World Health Organization. Guidelines for Drinking-water Quality, 4th ed.; WHO Press: Geneva, Switzerland, 2017. [Google Scholar]
  31. Saravanan, K.; Srinivasamoorthy, K.; Gopinath, S.; Prakash, R.; Suma, C.S. Investigation of hydrogeochemical processes and groundwater quality in Upper Vellar sub-basin Tamilnadu, India. Arab. J. Geosci. 2016, 9, 372. [Google Scholar] [CrossRef]
  32. Mukate, S.V.; Panaskar, D.B.; Wagh, V.M.; Baker, S.J. Understanding the influence of industrial and agricultural land uses on groundwater quality in semiarid region of Solapur, India. Environ. Dev. Sustain. 2020, 22, 3207–3238. [Google Scholar] [CrossRef]
  33. Rao, N.S.; Subrahmanyam, A.; Rao, G.B. Fluoride-bearing groundwater in Gummanampadu Sub-basin, Guntur District, Andhra Pradesh, India. Environ. Earth Sci. 2013, 70, 575–586. [Google Scholar] [CrossRef]
  34. Rao, N.S.; Ravindra, B.; Wu, J. Geochemical and health risk evaluation of fluoride rich groundwater in Sattenapalle Region, Guntur district, Andhra Pradesh, India. Hum. Ecol. Risk Assess. Int. J. 2020, 26, 2316–2348. [Google Scholar] [CrossRef]
  35. Minet, E.; Goodhue, R.; Meier-Augenstein, W.; Kalin, R.; Fenton, O.; Richards, K.; Coxon, C. Combining stable isotopes with contamination indicators: A method for improved investigation of nitrate sources and dynamics in aquifers with mixed nitrogen inputs. Water Res. 2017, 124, 85–96. [Google Scholar] [CrossRef] [PubMed]
  36. Singh, S.K.; Srivastava, P.K.; Pandey, A.C. Fluoride contamination mapping of groundwater in Northern India integrated with geochemical indicators and GIS. Water Supply 2013, 13, 1513–1523. [Google Scholar] [CrossRef]
  37. Rao, N.S.; Sunitha, B.; Adimalla, N.; Chaudhary, M. Quality criteria for groundwater use from a rural part of Wanaparthy District, Telangana State, India, through ionic spatial distribution (ISD), entropy water quality index (EWQI) and principal component analysis (PCA). Environ. Geochem. Health 2020, 42, 579–599. [Google Scholar] [CrossRef]
  38. Gibbs, R.J. Mechanisms Controlling World Water Chemistry. Science 1970, 170, 1088–1090. [Google Scholar] [CrossRef]
  39. Hasan, M.S.U.; Rai, A.K. Groundwater quality assessment in the Lower Ganga Basin using entropy information theory and GIS. J. Clean. Prod. 2020, 274, 123077. [Google Scholar] [CrossRef]
  40. Zhou, W.W.; Chen, G.Y.; Qiong, D.Z.; Zhou, P.; Wang, J.; Tian, Z. Health risk assessment of residents in Groundwater quality of Lhasa Municipal Landfill. Environ. Chem. 2020, 39, 1513–1522. [Google Scholar]
  41. Zhou, J.M.; Jiang, Z.C.; Qin, X.Q.; Zhang, L.K. Heavy Metal Distribution and Health Risk Assessment in Groundwater and Surface Water of Karst Lead–Zinc Mine. Water 2024, 16, 2179. [Google Scholar] [CrossRef]
Figure 1. Map of the area of study (left) and spread of groundwater sample positions (right).
Sustainability 17 02677 g001
Figure 2. Projection of the hydrochemistry of groundwater samples taken in the current study onto a Piper trilinear diagram.
Sustainability 17 02677 g002
Figure 3. Scatter plots of total hardness (TH) versus total dissolved solids (TDS) for the groundwater in the area of study.
Sustainability 17 02677 g003
Figure 4. Spreads of various ions in the groundwater of the area of study. (a) SO42−, (b) Cl, (c) F, (d) NO3, (e) K+, (f) Na+, (g) Ca2+, (h) Mg2+, and (i) TDS.
Sustainability 17 02677 g004
Figure 5. Illustrations of factors contributing to the groundwater chemistry of the area of study using Gibbs diagrams. ((a): TDS versus Cl−Cl+HCO3; (b): TDS versus Na+−Na++Ca+).
Sustainability 17 02677 g005
Figure 6. Scatter plots showing the relationships between various ions in groundwater of the area of study. (a) Cl vs. Na+, (b) SO42− vs. Ca2+, (c) HCO3 vs. Ca2+, (d) HCO3 + SO42− vs. Ca2+ + Mg2+, (e) (Mg2+/Na+) vs. (Ca2+/Na+), (f) (HCO3 /Na+) vs. (Ca2+/Na+), (g) Na+ + K+ − Cl vs. Ca2+ + Mg2+ − HCO3 − SO42−, (h) NO3/Na+ vs. Cl/Na+, and (i) SI value of the rocks.
Sustainability 17 02677 g006
Figure 7. Heat map of heavy metal concentration distribution. ((a): Fe; (b): Mn; (c): Cu; (d): Zn; (e): Pb; (f): Cd; (g): Cr; (h): As; (i): Hg)).
Sustainability 17 02677 g007
Figure 8. Correlation plot for different groundwater toxic metals in the area of study. (* p < 0.05, ** p < 0.01, *** p < 0.001).
Sustainability 17 02677 g008
Figure 9. The relationship between the entropy-weighted water quality index (EWQI) and total dissolved solids (TDS).
Sustainability 17 02677 g009
Figure 10. The spread of groundwater quality based on the EWQI.
Sustainability 17 02677 g010
Figure 11. Geospatial representation of hazard ingestion for different groups of people in groundwater.
Sustainability 17 02677 g011
Table 1. Water quality classification standard based on the index of water quality weighted by entropy (EWQI).
RankEWQIWater Quality
I<50Excellent
II50–100Good
III100–150Medium
IV150–200Poor
V>200Extremely poor
Table 2. Value of parameters of the health hazard appraisal applied in the current study.
ParameterAbbreviationValuesDistributionUnits
AdultChildren
Element ConcentrationCMeasuredMeasuredLog-normalmg/L
Daily Ingestion RateIR2.21.32NormalL/d
Exposure Skin AreaSA17,00013,300Fixed valuecm2
Conversion FactorCF0.0010.001Fixed valueL/cm3
Skin Permeability CoefficientPC0.0001 (Mn and Pb)
0.001 (Fe, As, Cu and Cd)
0.002 (Cr) 0.0006 (Zn)
Fixed valuecm/h
Exposure FrequencyEF350350Triangulard/a
Exposure DurationED70 (Cd, Cr and As)
35 (Fe, Mn, Cu, Zn and Pb)
Fixed valuea
Exposure TimeET0.330.18Fixed valueh/d
Body WeightBW60.642.6Normalkg
Average TimeAT25,500 (Cd, Cr and As)
12,775 (Fe, Mn, Cu, Zn and Pb)
Fixed valued
Average LifeL7070Fixed valuea
Table 3. The slope factor (SF) and reference dose (RfD) of carcinogenic metals in the groundwater of the study site.
Non-CarcinogenRfD (mg kg−1 d−1)CarcinogenSF (mg kg−1 d−1)
IngestionDermalIngestionDermal
Mn1.4 × 10−18.0 × 10⁻⁴Cd6.10.38
Zn3.0 × 10−11.0 × 10⁻¹Cr410.5
Pb1.4 × 10−34.2 × 10⁻⁴As153.66
Cu5.0 × 10−31.2 × 10⁻²
Fe
Hg
3.0 × 10⁻¹
1.0 × 10⁻⁴
4.5 × 10⁻²
3.0 × 10⁻⁴
Table 4. Statistical summary of conventional groundwater quality indicators in the area of study.
ParametersMaxMinMedianMeanSDCV (%)WHO [30]% of SEL
pH8.062.496.285.482.120.396.5~8.552.17
TDS16,347.00299.00985.003204.484485.411.401000.0047.83
TH2175.00214.00679.00909.13623.280.69450.0069.57
SO42−8980.0034.20484.001655.152315.811.40250.0082.61
Cl61.801.702.365.0212.392.47250.000.00
F24.200.110.532.725.592.061.5026.09
NO37.990.011.331.842.091.1345.000.00
K+20.200.643.766.275.950.95--
Na+165.002.419.7519.3133.551.74200.000.00
Ca2+475.0064.00181.00246.43141.380.57200.0047.83
Mg2+243.007.0030.0067.0969.831.04150.0013.04
SD, standard deviation; CV (%), coefficient of variation; and % of SEL, % of samples exceeding acceptable limit.
Table 5. Heavy metal levels in the groundwater of the area of study.
ParametersMaxMinMedianMeanSDCV (%)WHO [30]% of SEL
Fe2235.000.0131.40303.24609.122.010.3078.26
Mn7.800.010.611.722.521.470.5073.91
Al545.000.081.1666.97147.042.200.2078.26
Cu3.060.010.010.290.873.041.008.70
Zn19.000.010.322.985.521.853.0026.09
Pb58.300.120.704.5012.742.830.01100.00
Cd (μg/L)1378.000.012.46194.53447.022.303.0043.48
Cr1.290.010.010.190.402.120.0526.09
As (μg/L)56.200.100.103.6711.693.1910.004.35
Hg (μg/L)0.360.010.110.120.100.811.000.00
Table 6. Carcinogenic and non-carcinogenic hazards posed by the groundwater quality in the area of study to the health of its residents.
CarcinogenNon-Carcinogen
ElementCdCrAsFeMnCuZnPb
Adults ingestion1.36 × 10−28.74 × 10−22.06 × 10−51.16 × 10−51.41 × 10−76.54 × 10−71.13 × 10−73.68 × 10⁻⁵
Children ingestion1.16 × 10−27.46 × 10−21.75 × 10−59.87 × 10−61.20 × 10−75.59 × 10−79.68 × 10−83.14 × 10⁻⁵
Adults dermal2.16 × 10−64.46 × 10−45.24 × 10−81.97 × 10−76.27 × 10−86.95 × 10−105.21 × 10−103.13 × 10⁻⁸
Children dermal2.11 × 10−52.71 × 10−43.18 × 10−81.19 × 10−73.81 × 10−84.22 × 10−103.16 × 10−101.90 × 10⁻⁸
Disclaimer/Publisher’s Note: The statements, opinions and data contained in all publications are solely those of the individual author(s) and contributor(s) and not of MDPI and/or the editor(s). MDPI and/or the editor(s) disclaim responsibility for any injury to people or property resulting from any ideas, methods, instructions or products referred to in the content.

