Article

Multi-Objective Optimal Energy Management Strategy for Grid-Interactive Hydrogen Refueling Stations in Rural Areas

Department of Electrical and Electronics Engineering, Faculty of Engineering, Trakya University, Edirne 22030, Türkiye
*
Author to whom correspondence should be addressed.
Sustainability 2025, 17(6), 2663; https://doi.org/10.3390/su17062663
Submission received: 14 February 2025 / Revised: 14 March 2025 / Accepted: 17 March 2025 / Published: 17 March 2025

Abstract

:
The transportation sector is a significant contributor to global carbon emissions, thus necessitating a transition toward renewable energy sources (RESs) and electric vehicles (EVs). Among EV technologies, fuel-cell EVs (FCEVs) offer distinct advantages in terms of refueling time and operational efficiency, thus rendering them a promising solution for sustainable transportation. Nevertheless, the integration of FCEVs in rural areas poses challenges due to the limited availability of refueling infrastructure and constraints in energy access. In order to address these challenges, this study proposes a multi-objective energy management model for a hydrogen refueling station (HRS) integrated with RESs, a battery storage system, an electrolyzer (EL), a fuel cell (FC), and a hydrogen tank, serving diverse FCEVs in rural areas. The model, formulated using mixed-integer linear programming (MILP), optimizes station operations to maximize both cost and load factor performance. Additionally, bi-directional trading with the power grid and hydrogen network enhances energy flexibility and grid stability, enabling a more resilient and self-sufficient energy system. To the best of the authors’ knowledge, this study is the first in the literature to present a multi-objective optimal management approach for grid-interactive, renewable-supported HRSs serving hydrogen-powered vehicles in rural areas. The simulation results demonstrate that RES integration improves economic feasibility by reducing costs and increasing financial gains, while maximizing the load factor enhances efficiency, cost-driven strategies that may impact stability. The impact of the EL on cost is more significant, while RES capacity has a relatively smaller effect on cost. However, its influence on the load factor is substantial. The optimization of RES-supported hydrogen production has been demonstrated to reduce external dependency, thereby enabling surplus trading and increasing financial gains to the tune of USD 587.83. Furthermore, the system enhances sustainability by eliminating gasoline consumption and significantly reducing carbon emissions, thus supporting the transition to a cleaner and more efficient transportation ecosystem.

1. Introduction

1.1. Motivation

A substantial proportion of global energy consumption is currently attributed to the transportation sector, with the majority of transportation relying on fossil-fuel-powered vehicles. These vehicles contribute to various environmental concerns, including air pollution and greenhouse gas emissions [1]. The environmental impact of fossil-fuel-powered vehicles has gained increasing awareness in society due to its direct contribution to climate change and deteriorating air quality [2]. The transition to sustainable transportation alternatives is imperative to address the associated environmental challenges, including carbon emissions, climate change, and greenhouse gas formation [3]. A key priority should be the widespread adoption of environmentally friendly solutions, with a particular emphasis on electric vehicles (EVs) [4]. However, the environmental benefits of EVs are contingent on the source of the electricity used for charging. To ensure a sustainable transportation ecosystem, it is imperative that electricity consumed by EVs is generated from renewable energy sources (RESs), as opposed to conventional energy sources such as coal and natural gas [5]. In addition, the energy supply–demand balance in rural areas is more complex and challenging in comparison to urban centers [6]. Geographical constraints and limited infrastructure often result in rural regions facing difficulties in accessing stable and sustainable energy sources. Consequently, there has been a notable increase in the search for innovative and sustainable solutions to meet energy needs in rural areas, particularly in recent years [7].
In the context of accelerating the adoption of EVs, the expansion and accessibility of charging and refueling stations are of paramount importance. As these stations become more prevalent, effective management is essential for ensuring seamless operation [8]. While station operators prioritize investment and operational costs, grid operators must address challenges such as increased demand and grid congestion. Through advanced energy management optimization and bi-directional grid interaction, the quality, reliability, and stability of power grids can be enhanced while minimizing costs [9].
A plethora of electric vehicles are currently available, each with distinct advantages and limitations. Among them, fuel-cell electric vehicles (FCEVs) offer significant benefits over battery electric vehicles (BEVs), particularly with regard to refueling time and energy flexibility. The primary rationale for the focus of this study on FCEVs rather than BEVs is the substantial reduction in refueling time. While the average fast-charging time for a BEV is approximately 30 min, the average hydrogen refueling time for an FCEV is only five minutes. This considerable time advantage is crucial for vehicle owners, making hydrogen-powered transportation more practical for widespread adoption. Furthermore, reducing charging downtime contributes to increased efficiency and overall economic benefits at both the individual and national levels. Moreover, the electricity utilized by BEVs may be derived from power plants that rely on fossil fuels, such as gasoline and coal, thereby undermining the environmental benefits of BEVs. In contrast, even in the least sustainable scenario, the hydrogen used in an FCEV is produced from natural gas, referred to as gray hydrogen [10]. However, with the increasing adoption of electrolysis-based green hydrogen production powered by renewable energy sources, the utilization of zero-emission hydrogen refueling stations becomes a viable and scalable solution. Considering these factors, FCEVs present significant advantages over BEVs in terms of both environmental sustainability and operational efficiency.
The emergence of hydrogen energy as a promising alternative can be attributed to its high energy density, zero-emission potential, and ability to complement renewable energy integration. Hydrogen refueling stations (HRSs) with bi-directional grid interaction have the potential to enhance energy security in rural areas, support the widespread adoption of EVs, reduce carbon emissions, and facilitate the integration of RESs into the power grid. However, for these systems to operate effectively and efficiently, multi-objective optimization strategies that balance economic feasibility, energy reliability, and environmental sustainability are required.

1.2. Literature Survey

A number of studies have been published on the subject of hydrogen refueling stations, with a particular emphasis on the optimization of energy systems that integrate electric and hydrogen vehicles with the power grid. Tao et al. [11] examined the operation of an energy system that includes various EVs and HRSs in conjunction with the electrical energy distribution system. By emphasizing the synergy between power and transportation systems, they aimed to achieve minimal emissions through load optimization and the use of RESs. The study presented an optimization approach using the mixed-integer linear programming (MILP) method. Woo et al. [12] focused on the energy management of electric and hydrogen vehicle charging stations that provide charging services for plug-in and fuel-cell EVs. These stations are supported by wind and solar energy systems and include an electrolyzer (EL), fuel cell (FC), and hydrogen tank. In this bi-directional hydrogen grid interaction system, the objective was to minimize the load drawn from the electricity grid while maximizing revenue by managing factors such as charging fees and hydrogen energy portfolio sales. Li et al. [13] developed an integrated energy system that includes wind and solar energy systems, a battery, a hydrogen storage system, an EL, and an FC to supply an electrical load. The study’s primary objective was to analyze investment costs and grid loading, taking into account the lifespan and cycling load of the equipment utilized. Furthermore, the study examined the effects of different equipment operating at various loads within the integrated energy system.
A considerable body of research has been dedicated to investigating the optimal placement and planning of HRSs to support hydrogen-powered transportation networks. These stations feature unidirectional interaction with the electricity grid, RES, and a hydrogen energy system without a fuel cell. Zhu et al. [14] proposed a macro–micro two-stage site selection model for electric–hydrogen hybrid refueling stations based on DC microgrids, considering renewable energy resources and hydrogen policies. Utilizing ArcGIS and the DEMATEL method, their study identifies coastal regions in Guangdong Province, China, as optimal locations, thereby providing a scientific basis for decision making. In a similar vein, Padova et al. [15] developed an optimization framework to strategically position HRSs for hydrogen-based trucks, taking into account technical, policy, and regulatory constraints. Their case study on the Italian highway network determined that 78 HRS nodes would be required to support a 10% hydrogen vehicle share, and they concluded that an additional 368 MW of photovoltaic capacity would be necessary to produce green hydrogen and reduce emissions by 6.5%. Elomiya [16] developed a sophisticated spatial decision model to optimize the placement of HRSs in Prague, integrating multiple methodologies such as the fuzzy analytic hierarchy process, fuzzy C-means clustering, and genetic algorithm with TOPSIS. This model took into account uncertainty and various criteria, identifying 10 optimal locations and offering a robust, data-driven approach for sustainable urban transportation planning.
Hydrogen refueling stations present a distinctive set of safety concerns, prompting researchers to prioritize risk assessment and resilience strategies. He et al. [17] developed a comprehensive resilience assessment framework for hydrogen refueling stations, incorporating a two-state recovery phase with a multi-state transition model. Their case study demonstrated that the resilience of the hydrogen refueling station was enhanced by 12.5% through the implementation of the two-phase recovery process, underscoring its capacity to improve reliable operation. In a similar vein, Hoseyni et al. [18] developed a comprehensive risk assessment framework for hydrogen refueling stations, vehicles, and garages, using structured what-if and bowtie barrier analysis. Their study identified critical hazards, revealing gaps in safety practices and leading to 41 actionable steps and five key activities to improve risk management and ensure the safe integration of hydrogen into transportation systems. Lu et al. [19] developed dynamic Bayesian networks to model fire, explosion, and domino-effect risks at HRSs, identifying critical factors and equipment contributing to accidents and domino effects, providing valuable insights for the safety management of HRS. Tan et al. [20] proposed a coordinated planning model for HRSs and distribution networks, incorporating hydrogen storage safety indicators and a gas–solid two-phase hydrogen storage mode. The model was validated with two networks of different sizes and was found to enhance HRS operational security by considering the safe operation constraints of HRS equipment, DN, and transportation networks. Kang [21] developed an AcciMap-FTA model to analyze the causative factors of fire and explosion accidents in hydrogen refueling stations. The model identified 28 key factors and calculated the probabilistic importance of each. The study demonstrated that the combined model effectively visualized accident causation paths and proposed practical risk prevention measures for the hydrogen energy sector.
Energy management strategies have been the subject of extensive study in order to enhance the efficiency and reliability of HRSs. Jordehi et al. [22] developed a hierarchical stochastic framework for the operational planning of isolated microgrids with hydrogen-refueling-station-integrated energy hubs, taking uncertainties into consideration. Utilizing mixed-integer linear and quadratic programming models, they optimized the operation of energy hubs and microgrids, thereby demonstrating the efficacy of their methodology and evaluating the impact of batteries and wind generators on energy hub operations. Çiçek [23] addressed the optimal energy management of an HRS serving FCEVs, considering factors such as electricity generation from RESs, electricity purchase from the power grid, hydrogen energy production, and hydrogen storage, and proposed an energy management model for a charging station that includes plug-in, fuel-cell, and battery-swappable EVs in [24].
A plethora of studies have evaluated the economic viability of hydrogen refueling infrastructure integrated with renewable energy sources. Choi and Bhakta [25] investigated the techno-economic viability of a hybrid RES integrated with a vanadium redox flow battery for on-site hydrogen production, with the aim of refueling a fleet of 20 FCEVs across seven locations in South Korea. Their study estimated capital expenditure, operation expenditure, and costs for hydrogen and energy, revealing a range of USD 5.95–13.2 million, USD 82,670–202,184 per year, and levelized costs of USD 8.77–19.1/kg for hydrogen and USD 2.1–4.58/kWh for energy. Wolf et al. [26] assessed the feasibility of a large-scale HRS in Germany, integrating RESs like wind, solar, and grid electricity. Their techno-economic analysis revealed that the levelized cost of hydrogen ranged from 13.92 to 18.12 EUR/kg, with excess electricity sales and on-site wind energy reducing costs, providing valuable insights into decentralized green hydrogen systems for heavy-duty transport. In a separate study, Alao and Popoola [27] assessed the techno-economic and environmental viability of waste-to-hydrogen refueling stations in five South African cities. Their findings indicated that the projects were economically feasible, with positive NPVs, low LCOHr, and strong IRRs. Furthermore, the environmental analysis indicated a significant reduction in CO2 emissions, demonstrating the potential for waste-to-hydrogen stations to contribute to green transportation and waste management while providing substantial fuel savings.
Research has also focused on the monitoring and improvement of the efficiency of hydrogen refueling operations. Zhang et al. [28] proposed a holistic idle periodic evaluation method to monitor hydrogen mass balance and evaluate hydrogen losses at HRSs in real-time operations. When applied to two HRSs with off-site hydrogen production, the method achieved hydrogen mass balances of 94.2% and 83.6%, demonstrating its effectiveness for the continuous monitoring of normal and anomalous system operations. In another study, Wu et al. [29] developed the H2-Informer model, based on the informer architecture, to predict hydrogen diffusion concentrations at refueling stations using sparse sensor data and environmental factors. The model demonstrated high prediction accuracy, as evidenced by an R² of 0.9775, and a substantial reduction in inference time. This enhancement in real-time prediction reliability is expected to contribute to improved safety and emergency response at hydrogen refueling stations.
Innovative approaches to hydrogen production and integration with renewable energy have been explored, with Shoja et al. [30] introducing vector-bridging systems, integrating power-to-X technologies with energy storage to enhance flexibility in community-integrated energy systems for natural gas/hydrogen refueling and electric charging stations. The risk-based energy management framework developed by the authors, which incorporates a hybrid MOIGDT/stochastic approach and an incentive-based demand response model, has been shown to reduce daily operating costs by 8.36% and risk levels by 11.3%, thereby enhancing cost efficiency and resilience [30]. Assunção et al. [31] conducted an integrated economic and environmental analysis of the on-site co-production of oxygen and hydrogen at the Santa Maria Hospital in Lisbon, Portugal, using a 1.5 MW PEM electrolyzer. The study’s findings indicated that the system had the capacity to meet the hospital’s oxygen demand, generate hydrogen for fuel-cell vehicles, reduce CO2 emissions by 1874 tons on an annual basis, and achieve financial and environmental benefits through hydrogen sales at a price above 2.4 EUR/kg. Ghaithan [32] developed a multi-objective model for sizing a sustainable hydrogen refueling station powered by an integrated photovoltaic–wind system, with the aim of maximizing renewable energy, minimizing costs, and reducing greenhouse gas emissions. The model was applied to a hydrogen station for 100 taxis in Tabuk, Saudi Arabia, and it was found that the optimal configuration involved a combination of solar panels, wind turbines, and grid integration, with a hydrogen cost of 7.53 USD/kg.
A number of studies have been conducted on the design and efficiency improvements of HRS technology. Chu et al. [33] developed a conceptual design and cost analysis for an on-site hydrogen refueling station combining solar electric power with the electrical grid, using water electrolysis for hydrogen production. The study demonstrated that the implementation of financial incentives could reduce the levelized cost of hydrogen by 15.6%, with the well-to-wheel (WTW) indicator for hydrogen being approximately 34% lower than gasoline, achieving significant reductions in WTW when solar power contributed 50–75%. Gong [34] proposed an energy-optimized design for liquid hydrogen refueling stations, integrating energy-saving systems such as a heat exchange system, organic Rankine cycle, and catalytic combustor to reduce operating costs and environmental impacts. The design, while slightly increasing the hydrogen selling price, demonstrated a 41% reduction in global warming potential, offering a more sustainable infrastructure for hydrogen refueling stations. In a related study, Sezer and Bayhan [35] presented a conceptual design for an HRS for light-duty FCEVs, integrating wind turbines, water electrolyzers, hydrogen compressors, and energy recovery systems. The system achieved an overall efficiency of 25.4%, with wind turbines alone reaching 46.21% efficiency, and effectively utilized waste heat for power generation while meeting thermodynamic principles.

1.3. Contributions

Despite the extensive research that has been carried out on HRSs and their integration with renewable energy sources, there are still significant gaps in the literature. The majority of existing studies focus on HRSs in urban or highway contexts, with a primary focus on the optimization of station placement, energy management, and safety considerations, primarily for passenger vehicles and heavy-duty trucks. However, there remains a paucity of research on the design and operation of HRSs tailored for rural applications, particularly in agricultural settings where hydrogen-powered tractors, combine harvesters, and off-road vehicles stand to benefit significantly from clean energy solutions. Furthermore, while many studies address optimal energy management for HRSs, they often prioritize either economic feasibility or grid interaction, without a comprehensive multi-objective optimization framework that balances profitability, load factor improvement, and environmental benefits. The potential of bi-directional energy trading between the electrical grid and the hydrogen gas network also remains underexplored. To address these gaps, this study proposes an innovative approach to HRS design and operation, specifically focusing on rural areas with diverse hydrogen-powered vehicles and integrating renewable energy sources for enhanced sustainability and energy efficiency. The contributions of the study to the literature can be summarized as follows:
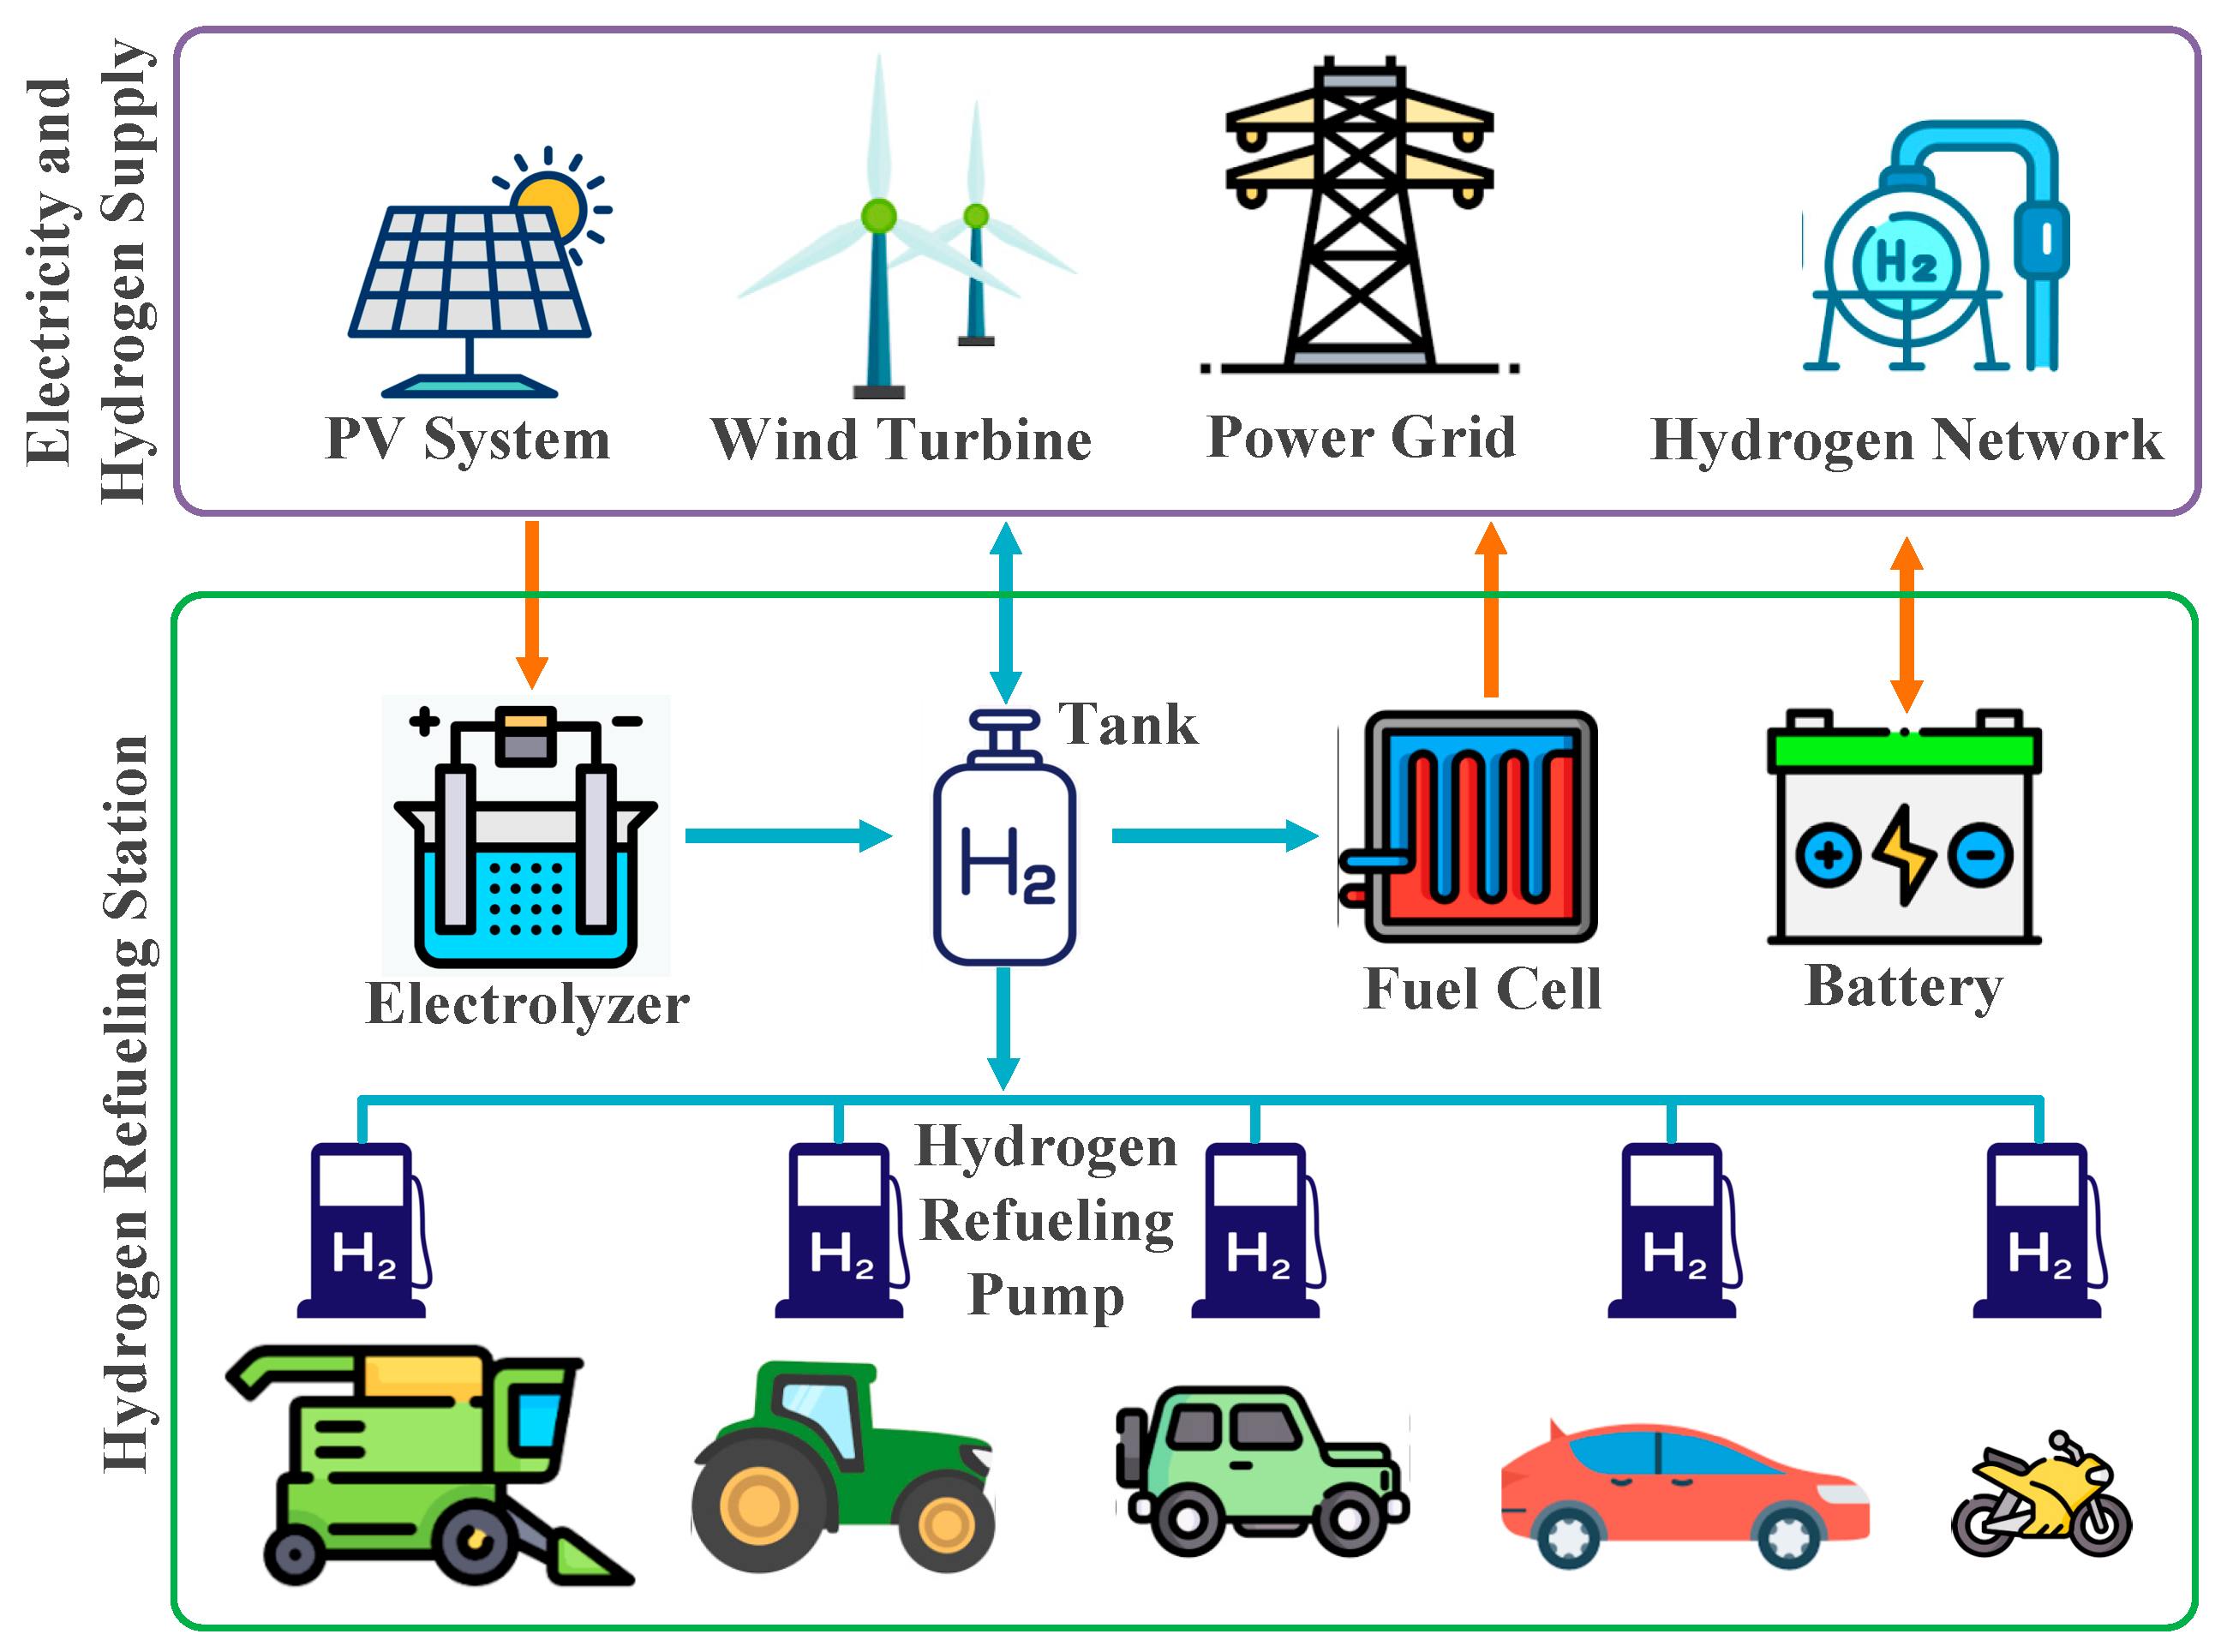
  • A multi-objective optimal energy management model is presented for HRSs located in rural areas with RESs, battery energy storage systems, and hydrogen energy systems, serving various types of EVs such as tractors, combine harvesters, off-road vehicles, cars, and motorcycles. To the best of the authors’ knowledge, this study is the first example in the literature addressing the multi-objective optimal management of grid-interactive, renewable-supported HRSs serving hydrogen-powered vehicles in rural areas.
  • One of the objective functions for the operation of the HRS is to maximize the profit, while the other objective is to improve the load factor. The optimum operation can be achieved by selecting one of these two objectives. The proposed structure also calculates the reduction in carbon emissions achieved, contributing to sustainability and a cleaner environment.
  • The proposed structure can perform bi-directional trading with both the electrical power grid and the hydrogen gas network. This capability allows for dynamic adjustments to supply and demand, optimizing energy distribution, enhancing grid stability, and supporting the integration of sustainable energy solutions into both sectors.

1.4. Paper Organization

The structure of this paper is as follows: Section 2 presents the proposed structure and mathematical modeling, while Section 3 includes the test studies and comparisons conducted to validate the study. Finally, Section 4 highlights the key results.

2. Proposed Structure and Mathematical Modeling

This study puts forward a proposal for an HRS integrated with electricity and hydrogen energy supply sections (see Figure 1). The system has been designed to operate in a rural area, with the aim of ensuring an efficient and sustainable energy supply for hydrogen-powered vehicles. The proposed HRS is assumed to be located in Süloğlu, Edirne, Türkiye, a rural region where solar and wind energy resources are available. The renewable energy generation data utilized in this study correspond to this specific location, ensuring realistic system modeling. The station is considered to operate with bi-directional interactions between the electricity grid and the hydrogen network, allowing both supply and demand adjustments to enhance energy efficiency and system resilience. The EL, which plays a central role in hydrogen production, draws power from either RESs or the power grid. The hydrogen produced by the EL is stored in a hydrogen tank, which serves as a critical storage and distribution unit. This tank supplies hydrogen to multiple components, including the hydrogen grid, FC, and hydrogen refueling pumps. Furthermore, the hydrogen tank and the hydrogen grid operate with bi-directional interaction, enabling efficient hydrogen distribution and storage management. The FC within the system converts stored hydrogen into electrical energy, which is then supplied back to the electricity grid, contributing to grid stability and energy utilization efficiency. Additionally, a battery energy storage system is integrated into the system, maintaining bi-directional interaction with the electricity grid to optimize power management, balance fluctuations in renewable energy generation, and improve overall energy reliability. The hydrogen refueling station has been designed with a specific purpose in mind, namely, to serve FCEVs in rural areas, including tractors, combine harvesters, off-road vehicles, passenger cars, and motorcycles. The proposed structure is designed to ensure an uninterrupted and sustainable hydrogen supply, thereby facilitating the widespread adoption of hydrogen-based transportation in agricultural and remote regions.
In the context of rural hydrogen refueling stations, there is a need for measures such as high-pressure storage, leak detection systems, and effective ventilation systems to ensure safe operation. This is further compounded by the fact that due to the low ignition energy, explosion and fire risks must be minimized by using explosion-proof equipment. It is imperative to raise public awareness and to restrict access to the station to authorized personnel, with regular maintenance and emergency plans in place. The issue of accessibility to emergency response teams in rural areas is a salient one, and this is a matter that must be given due consideration. Continuous safety inspections are therefore crucial in ensuring the safety of these stations and the communities in which they are located.
The objective function of the model under consideration is defined in Equation (1). The aim is to minimize operational costs and/or maximize the load factor of the electricity grid, given scenarios where parameters A and B take the values of 0 and/or 1. Consequently, the structure can be operated for either multi-objective or single-objective purposes using the 1 and 0 parameters.
A t s P t , s b u y P t , s s e l l λ t , s e l e c t r i c p s t s ( m t , s h 2 s e l l m t , s h 2 b u y ) λ t H 2 n e t w o r k + B s L F 1 p s
where t is the time series, and s is the scenario series. P t , s b u y is the power purchased from the electricity grid at time t and scenario s. P t , s s e l l is the power sold to the electricity grid at time t and scenario s. λ t , s e l e c t r i c is the day-ahead electricity market price at time t and scenario s. p s is the probability of scenarios occurring. m t , s h 2 s e l l is the hydrogen amount sold to the hydrogen network at time t and scenario s, while m t , s h 2 b u y is the hydrogen amount purchased from the network at time t and scenario s. λ t H 2 n e t w o r k is the hydrogen gas price at time t. L F 1 is the inverse of the load factor of the electricity grid.
Equation (2) addresses the system’s power balance, incorporating all power generation, consumption, storage, and trading components. The fundamental principle represented by the equation is that the total power supply must always equal the total power demand within the system. The power drawn from the grid, the battery discharge power, the power generated by the FC, and the power produced by RESs can be sold to the power grid, used for battery discharge, or utilized for hydrogen production in the EL. The output power of the FC, as depicted in Equation (3), is contingent on the FC’s working power, the efficiency of the FC, and the efficiency of the DC-AC converter within the FC structure. Equation (4) delineates the hydrogen gas balance for the hydrogen tank. The hydrogen quantity at time t is determined by the hydrogen quantity at the previous period (t − 1), plus the amount of hydrogen gas added (from the EL or hydrogen supply) or subtracted (from hydrogen selling or hydrogen consumption of the FC). Scenarios that reduce the amount of hydrogen in the hydrogen tank could occur due to higher hydrogen consumption by the FC or increased withdrawal from the hydrogen network. Conversely, scenarios that result in an increase in the hydrogen quantity within the hydrogen tank are driven by higher hydrogen production through the EL or by hydrogen supply from the hydrogen gas network.
P t , s b u y + P t , s b a t d i s c h + P t , s f c + P t , s P V + P t , s w i n d = P t , s E L + P t , s b a t c h + P t , s s e l l ,     t , s
P t , s f c o u t p u t = P t , s f c · η F C · η F C c o n v ,       t , s
m t , s h 2 · n m t 1 , s h 2 · n + m t , s h 2 d e m a n d · n + m t , s h 2 s e l l · n m t , s h 2 b u y · n P t , s E L i n p u t · 1 / A + P t , s f c · 1 / A = 0 ,     s ,     I f   t > 1
where P t , s b a t d i s c h is the power discharged from the battery at time t and scenario s, while P t , s b a t c h is the power discharged from the battery at time t, and scenario s represents the energy output from the battery system. P t , s f c is the power generated by the FC at time t and scenario s, while P t , s E L is the power consumed by the EL at time t and scenario s. P t , s P V is the power generated by the PV system at time t and scenario s, while P t , s w i n d is the power generated by the wind turbine at time t and scenario s. P t , s f c o u t p u t is the output power of the FC at time t and scenario s. η F C and η F C c o n v are the efficiency of the FC and converter in the FC. m t , s h 2 is the stored hydrogen mass at time t and scenario s. n is the step size. m t , s h 2 d e m a n d is the hydrogen demand of vehicles at time t and scenario s. P t , s E L i n p u t is the input power to the EL at time t and scenario s. A is the conversion factor between hydrogen mass and power.
Equations (5) and (6) determine whether the EL and FC are active or passive within the system. The parameter u t , s E L can take values of 0 or 1, indicating whether the respective component (EL or FC) is active or not. Equation (7) demonstrates that the EL and FC cannot operate simultaneously (i.e., if the EL is active, the FC must be inactive and vice versa). Equation (8) shows that the operating power of the EL is directly related to the power of the EL and its efficiency. Equations (9) and (10) show that simultaneous withdrawal from and injection into the electricity grid is not allowed. In other words, if energy is being drawn from the electricity grid, no energy can be supplied back to the grid and vice versa.
P t , s E L N · u t , s E L ,     t , s
P t , s F C N · u t , s F C ,     t , s
u t , s E L + u t , s F C 1 ,     t , s
P t , s E L = P t , s E L o u t p u t · η E L ,     t , s
P t , s b u y N · u t , s e l e c t r i c g r i d ,     t , s
P t , s s e l l N · 1 u t , s e l e c t r i c g r i d ,     t , s
where N is a sufficiently large positive number. u t , s E L and u t , s F C are the binary variables for the operation of EL and FC, respectively. P t , s E L o u t p u t is the output power of the EL at time t and scenario s. η E L is the efficiency of the EL. u t , s e l e c t r i c g r i d is the binary variable indicating whether power is being drawn from the electricity grid {1} or not {0}.
Equations (11) and (12) determine the amount of hydrogen energy that can be sold and purchased from the hydrogen grid, respectively. Equation (13) is the equation describing the energy state in the battery. Here, the energy state at time t is obtained by adding the energy state at time t − 1 and the amount of energy charged if the battery is charging at time t or subtracting the amount of energy discharged if the battery is discharging. The linearized case of the load factor is presented in Equation (14). The inverse expression of the load factor was constructed in order to form the objective function under the framework of a single minimization process. The inverse of the load factor is obtained by subtracting the maximum electrical power drawn from the grid from the average electrical power drawn from the grid. In this context, minimizing the inverse of the load factor means minimizing the average power as close as possible to the maximum power. In other words, the load factor is maximized. Equations (15) and (16) are the equations that determine the charging and discharging power of the battery, respectively. With these two equations, simultaneous charging and discharging of the battery is also prevented.
m t , s h 2 s e l l m c a p a c i t y h 2 n e t w o r k · u t , s h 2 n e t w o r k ,     t , s
m t , s h 2 b u y m c a p a c i t y h 2 n e t w o r k · 1 u t , s h 2 n e t w o r k ,     t , s
E D t , s b a t t e r y = E D t 1 , s b a t t e r y + ( P t , s b a t c h · η b a t c h ) · Δ T ( P t , s b a t d i s c h / η b a t d i s c h ) · Δ T ,     t , s
L F 1 = P m a x g r i d P a v e r a g e g r i d ,     t , s
P t , s b a t c h P t , s b a t c a p a c i t y · u t , s b a t t e r y ,     t , s
P t , s b a t d i s c h P t , s b a t c a p a c i t y · 1 u t , s b a t t e r y ,     t , s
where m c a p a c i t y h 2 n e t w o r k is the capacity of the hydrogen transmission network. u t , s h 2 n e t w o r k is the binary variable indicating whether hydrogen is being injected into the network (1) or not (0). E D t , s b a t t e r y is the stored energy in the battery at time t and scenario s. η b a t c h and η b a t d i s c h are the efficiency for the charging and discharging of the battery, respectively. Δ T is the time resolution. P m a x g r i d is the maximum power drawn from the power grid, while P a v e r a g e g r i d is the average power drawn from the power grid. u t , s b a t t e r y is the binary variable indicating whether the battery is charging (1) or discharging (0).

3. Test and Results

Test studies were conducted assuming that the HRS is located in Süloğlu, Edirne, Türkiye. The definitions and values of all components in the proposed HRS structure are presented in Table 1, while the models of FCEVs used in the rural area where the station operates, along with their maximum hydrogen capacities, are provided in Table 2.
As demonstrated in Figure 2, the total amount of electrical energy produced from solar panels and wind turbines is shown as the amount of electricity based on RESs on a single figure. S1, S2, and S3 represent three different scenarios corresponding to consecutive three days. The power generation data of the PV power system and wind turbine are obtained from [41]. As the relevant web address does not provide data for 2024–2025 for the geographical region where the mathematical model developed in the paper operates, the most recent data from 2019 are used. These scenarios cover the dates from 23–26 July 2019. For instance, Scenario 1 (S1) commences on 23 July 2019 at 07:00 and concludes on 24 July 2019 at 06:55. Scenario 2 (S2) commences on 24 July 2019 at 07:00, concluding on 25 July 2019 at 06:55. Scenario 3 (S3) initiates on 25 July 2019 at 07:00, with a conclusion on 26 July 2019 at 06:55. The PV system has an installed capacity of 500 kW, while the wind turbine has an installed capacity of 1 MW.
This study posits the assumption that the HRS acquires electricity from the Turkish electricity market, with real data from the Türkiye electricity market [42] being utilized for this purpose. The relevant data are illustrated in Figure 3, corresponding to the period from 23 July to 26 July 2024.
While the electricity generation data from renewable energy sources are from 2019, the market clearing price data from the day-ahead market are from 2024. This is to ensure the currency of the data and to facilitate understanding for the reader. It should be noted that the years of the two data sets are different, but they belong to the same seasonal period (23–26 July).
The daily hydrogen demand data for various categories of vehicles, including cars, tractors, combine harvesters, off-road vehicles, and motorcycles, requesting hydrogen from the HRS, is presented in Figure 4. The hydrogen demand in S1, S2, and S3 is 400.15 kg, 390.05 kg, and 395.42 kg, respectively.
The proposed model is subjected to rigorous testing and validation through the case studies specified in Table 3, thereby ensuring its robustness and applicability. This process is conducted using the GAMS v.24.1.3 software and the CPLEX v.12 solver, which facilitate the optimization and evaluation of the model under various scenarios. By implementing these case studies, the effectiveness of the model is demonstrated in terms of its ability to optimize hydrogen demand management while ensuring operational feasibility. The results obtained from these simulations provide strong evidence supporting the validity and efficiency of the proposed approach, confirming its potential for real-world applications. In the table, the ✓ symbol indicates that the respective parameter or equipment is included in the model, while the - symbol signifies its absence.
The results of the test studies conducted for this study are presented in Table 4. Six case studies (Case-1, Case-2, Case-3, Case-4, Case-5, and Case-6) were designed with consideration for the presence or absence of RESs, with the objective of ensuring that at least one scenario aimed to minimize costs and maximize the load factor. These cases provide a fundamental analysis of how different configurations impact overall system performance. Case-7 and Case-8 were developed based on the structure of Case-6 to determine the optimal scenario for both the hydrogen energy system and the electricity system. To further analyze potential improvements, these cases include additional modifications. In Case-7, the installed capacity of RESs was doubled compared to Case-6. In Case-8, the power capacity of the EL was increased twofold. These modifications aimed to evaluate their impact on cost efficiency and load factor performance.
The cost analysis reveals significant variations across different case studies. Case-1, Case-3, and Case-5 resulted in negative costs, indicating that these configurations yielded financial gains. If both cost minimization and load factor maximization are considered, this suggests that higher RES penetration, along with modifications such as increasing EL capacity (as seen in Case-7 and Case-8), resulted in higher gains.
Case-1, where only the load factor was optimized without RESs, yielded the costliest scenario, with an average total cost of USD −399.41. When RESs were introduced in Case-2, a revenue of USD 19.61 was obtained, suggesting that RES integration alone provides an immediate economic benefit, while also contributing to improving both the load factor and cost reduction over time. In Case-3, where the primary objective was cost minimization without consideration of the load factor, and in Case-5, where both cost and load factor optimization were prioritized, a similar performance was observed, with average costs of USD −251.44 and USD −252.39, respectively. This suggests that the adjustments made to optimize the load factor had a negligible impact on the overall cost. This finding indicates that the additional load factor optimization in Case-5 had a negligible effect on overall costs, as the cost minimization objective was found to be dominant within the optimization model.
Case-6, which considered both cost and load factor along with RESs, resulted in a gain of USD 167.84, thereby highlighting the trade-off between grid stability and economic feasibility. The introduction of further modifications in Case-7 and Case-8 led to significant gain increases. In Case-7, where the RES capacity was doubled, the gain increased to USD 295.75. Case-8, which involved doubling the EL capacity, exhibited the highest gain of USD 587.83, emphasizing the substantial financial gain of scaling up hydrogen production infrastructure.
The case study results suggest that while RES integration and hydrogen infrastructure modifications can enhance system performance, scenarios with minimal interventions (such as Case-1) resulted in a cost, whereas increases in RES capacity and EL power (Case-7 and Case-8) led to higher financial gains. These findings underscore the critical importance of meticulously designing energy infrastructure to optimize economic and operational benefits.
The results of the load factor analysis for the case studies are presented in Table 5, highlighting the impact of various factors such as cost minimization, load factor maximization, and RES integration. In Case-1 and Case-2, where load factor maximization is prioritized, the load factor remains at 1 across all scenarios, indicating an optimal utilization of available power resources. Furthermore, the incorporation of RES in Case-2 does not impact the load factor, suggesting that RES variability does not impede the achievement of a fully utilized system under these conditions. Conversely, Case-3 and Case-4 prioritize cost minimization, resulting in a substantial impact on the load factor due to the presence of RES. While Case-3 maintains a relatively high load factor of 0.743, the introduction of RES in Case-4 causes a decline to 0.267, marking a 22% decrease. This reduction highlights the challenge of integrating RESs while maintaining an efficient load distribution. Case-5 and Case-6 show varied load factor performance, where the presence of RESs and cost minimization strategies lead to moderate load factor values. Case-5, which balances both cost and load factor considerations without RES integration, achieves a near-optimal load factor of 0.998. However, in Case-6, where RESs are included, the load factor drops to 0.398, indicating that a trade-off exists between cost efficiency and load stability. More complex scenarios, such as Case-7 and Case-8, incorporate additional parameters like doubling RES capacity and doubling EL capacity. Case-7 demonstrates that augmenting RES capacity can to some extent mitigate fluctuations, as evidenced by its relatively high load factor of 0.697. Conversely, Case-8 exhibits a decline in load factor to 0.151, indicating that augmenting EL capacity does not guarantee enhanced load factor performance in the presence of RES variability.
Additionally, to analyze the impact of the battery energy storage system on costs, an extra case study was conducted by excluding the energy storage system in Case-4. In this scenario, a gain of USD 167.11 was achieved, while in Case-4, it was USD 168.52. This indicates that the battery energy storage system has a relatively small effect on the system cost, with an approximate impact of 0.84%.
The results of the study demonstrate the critical interplay between load factor, cost minimization, and RES integration. While it is feasible to maximize the load factor under ideal conditions, the inclusion of RESs and cost-driven strategies often introduces complexities that need careful management.
The data pertaining to the power drawn from the grid in the case studies ranging from Case-3 to Case-8 are presented in Figure 5. In the cases of Case-1 and Case-2, the objective is to maximize the load factor, thereby ensuring that no energy is procured from the power grid. In these two instances, the hydrogen demand is met by the hydrogen network. In Case-3, where the primary objective is cost minimization, and in Case-4, where RESs are incorporated into Case-3, sudden load spikes from the grid are observed due to the emphasis on cost reduction. In Case-5, which does not include RESs but considers both the load factor and cost, an increase in profit is observed, and the load factor reaches a value close to 1. In Case-6, RESs are included in Case-5. In this scenario, as the power drawn from the grid decreases, costs are reduced; however, it should be noted that the load factor also decreases. In Case-7, where the capacity of RESs is doubled, very little energy is consumed from the grid. In Case-8, with the EL capacity doubled and the cost objective function being dominant, profit increases significantly, while the load factor deteriorates compared to Case-6. The energy drawn from the power grid in Case-3 to Case-8 is, respectively, 17,171.81 kWh, 3708.87 kWh, 17,108.10 kWh, 3603.31 kWh, 24.90 kWh, and 20,208.15 kWh.
As illustrated in Figure 6, the amount of hydrogen purchased from and sold to the hydrogen grid for Scenario 2 in Case-1 is presented. In the absence of RESs in this scenario, hydrogen production does not occur, resulting in no hydrogen being sold to the grid. Throughout the day, a total of 414.22 kg of hydrogen is purchased from the network to meet the hydrogen demand. In contrast, Figure 7 illustrates the hydrogen transactions for Scenario 2 in Case-6. In this scenario, a total of 423.03 kg of hydrogen is purchased from the network, while 644.75 kg of hydrogen is sold back. The key difference between the two scenarios is the presence of RESs, which enables hydrogen production. Consequently, the surplus hydrogen generated is fed into the grid, leading to an overall reduction in dependency on external hydrogen sources and potentially providing economic benefits through hydrogen sales.
As illustrated in Figure 8, the hydrogen variation in the hydrogen tank for each case study is presented. It should be noted that the initial and final amount of hydrogen in the tank is 100 kg. Hydrogen is added to the hydrogen tank either by purchasing it from the hydrogen network or by producing it via the EL based on FCEV demands. When hydrogen is supplied to FCEVs or sold to the hydrogen network, the amount of hydrogen in the tank decreases. It is noteworthy that the maximum hydrogen storage capacity is observed in Case-6, where both cost and load factor are considered, and an RES is employed. The presence of an RES facilitates the storage of the produced hydrogen. When the RES capacity is doubled compared to Case-6, the hydrogen storage in the tank is reduced, as electricity is instead sold to the power grid instead of being used for hydrogen production.

4. Conclusions

This study proposes a multi-objective energy management model for an HRS integrated with RESs and hydrogen infrastructure in rural areas, with a focus on optimizing cost and load factor performance. The results highlight the complex interactions between cost minimization and load factor maximization, as evidenced by case studies. These reveal that while higher RES penetration improves economic feasibility by reducing costs and increasing financial gains, it introduces challenges in maintaining an efficient load factor.
The analysis indicates that augmenting RES capacity and EL-rated power leads to substantial financial gains, as evidenced by the instance of doubling the EL capacity in Case-8, which yielded the maximum financial gain of USD 587.83. The introduction of RESs alone resulted in immediate economic benefits, with Case-2 demonstrating a revenue increase of USD 19.61. However, the impact of load factor optimization strategies on overall costs was found to be minimal in certain cases. These findings underscore the importance of increasing RES capacity and optimizing hydrogen production infrastructure to enhance system performance, particularly in rural settings.
The analysis of load factor performance reveals that maximizing load factor is feasible in scenarios without RES integration. However, the inclusion of RESs often leads to a trade-off between economic benefits and load factor stability. In more complex scenarios, such as Case-7 and Case-8, adjustments to RES capacity and EL power were found to partially mitigate these challenges. However, it is important to note that increasing RES capacity and EL power does not guarantee improved load factor performance in scenarios characterized by high RES variability.
This study emphasizes the necessity of achieving an optimal balance between economic and operational objectives when designing energy systems for hydrogen-powered vehicles in rural areas. Future studies could concentrate on refining the proposed energy management model by exploring additional factors such as dynamic pricing, real-time energy demand forecasting, and advanced predictive analytics to enhance system efficiency. The economic feasibility of implementing these technologies should also be evaluated, considering the cost-effectiveness and potential return on investment in rural areas. The integration of smart grid technologies, energy storage optimization, the use of artificial intelligence for demand response, and the minimization of carbon emissions could also be explored to improve the operational flexibility of HRSs in rural settings.

Author Contributions

Conceptualization, A.Ç.; Methodology, B.Ş. and A.Ç.; Software, B.Ş.; Validation, B.Ş. and A.Ç.; Formal analysis, A.Ç.; Investigation, B.Ş. and A.Ç.; Data curation, B.Ş.; Writing—original draft, B.Ş. and A.Ç.; Writing—review & editing, A.Ç.; Visualization, A.Ç.; Supervision, A.Ç. All authors have read and agreed to the published version of the manuscript.

Funding

This research received no external funding.

Institutional Review Board Statement

Not applicable.

Informed Consent Statement

Not applicable.

Data Availability Statement

Data are contained within the article.

Conflicts of Interest

The authors declare no conflict of interest.

References

  1. Saade, R.G.; Zhang, X.; Yu, C.; Yao, J. A Thematic Analysis, Definition, and a Green Aviation Conceptual Model—Putting It All Together. Sustainability 2025, 17, 564. [Google Scholar] [CrossRef]
  2. Samawi, G.A.; Bwaliez, O.M.; Jreissat, M.; Kandas, A. Advancing Sustainable Development in Jordan: A Business and Economic Analysis of Electric Vehicle Adoption in the Transportation Sector. World Electr. Veh. J. 2025, 16, 45. [Google Scholar] [CrossRef]
  3. Gibassier, D. Accounting For Social and Environmental Sustainability: A Multi-Capital Approach; Taylor & Francis: London, UK, 2025; pp. 1–238. [Google Scholar] [CrossRef]
  4. Yıldız, Ö.A.; Sarıçiçek, İ.; Yazıcı, A. A Reinforcement Learning-Based Solution for the Capacitated Electric Vehicle Routing Problem from the Last-Mile Delivery Perspective. Appl. Sci. 2025, 15, 1068. [Google Scholar] [CrossRef]
  5. Dong, Z.; Tao, Y.; Lai, S.; Wang, T.; Zhang, Z. Powering Future Advancements and Applications of Battery Energy Storage Systems Across Different Scales. Energy Storage Appl. 2025, 2, 1. [Google Scholar] [CrossRef]
  6. Li, M.; Dai, S.; Shi, Y.; Qin, K.; Brownson, R.C.; Kestens, Y.; Luo, M.; Liu, S.; Su, J.; Liu, G.G.; et al. Heterogeneous impacts of and vulnerabilities to the COVID-19 pandemic. Landsc. Ecol. 2025, 40, 32. [Google Scholar] [CrossRef]
  7. Martínez, S.H.; Mesman, J.; Sneum, D.M.; Holstenkamp, L.; Harmsen, R.; Menkveld, M.; Akerboom, S.; Faaij, A. From consumers to pioneers: Insights from thermal energy communities in Denmark, Germany and the Netherlands. Energy Sustain. Soc. 2025, 15, 5. [Google Scholar] [CrossRef]
  8. Çiçek, A.; Erenoğlu, A.K.; Taşcıkaraoglu, A.; Erdinç, O. Energy Management Strategy for a Microgrid Including All-in-One Electric Vehicle Station, Renewable Energy and Demand Response. In Proceedings of the 2023 International Conference on Smart Energy Systems and Technologies (SEST), Mugla, Turkiye, 4–6 September 2023. [Google Scholar] [CrossRef]
  9. Şafak, B.; Özekinci, D.; Çiçek, A. Üzerinde Fotovoltaik Panele Sahip Olan Elektrikli Araçları Içeren Bir Şarj Otoparkının Çok Amaçlı Optimum Enerji Yönetim Stratejisi. Niğde Ömer Halisdemir Üniversitesi Mühendislik Bilim. Derg. 2023, 13, 1–9. [Google Scholar] [CrossRef]
  10. Verbruggen, A.; Yermekova, G.; Baigarin, K. Dubious Promises of Hydrogen Energy in a Climate-Constrained World. Energies 2025, 18, 491. [Google Scholar] [CrossRef]
  11. Tao, Y.; Qiu, J.; Lai, S.; Zhang, X.; Wang, G. Collaborative Planning for Electricity Distribution Network and Transportation System Considering Hydrogen Fuel Cell Vehicles. IEEE Trans. Transp. Electrif. 2020, 6, 1211–1225. [Google Scholar] [CrossRef]
  12. Woo, H.; Son, Y.; Choi, S. Optimal Scheduling Model for Renewable Energy Source-Assisted Electric and Hydrogen Vehicle Charging Station in HPS Market. In Proceedings of the 2023 IEEE Power & Energy Society General Meeting (PESGM), Orlando, FL, USA, 16–20 July 2023. [Google Scholar] [CrossRef]
  13. Li, H.; Zhang, X.; Zhong, C.; Wang, Z. Study on the Optimization of Capacity Configuration Strategy for Wind-photovoltaic-hydrogen Energy Storage Stations. In Proceedings of the 2024 3rd International Conference on Energy, Power and Electrical Technology (ICEPET), Chengdu, China, 17–19 May 2024; pp. 108–111. [Google Scholar] [CrossRef]
  14. Zhu, L.; Xiong, K.; Lei, G.; Luo, Y.; Liu, W. A study on the macro-micro two-stage site selection of electric-hydrogen hybrid refueling stations based on GIS and Fuzzy-TODIM. Int. J. Hydrogen Energy 2024. [Google Scholar] [CrossRef]
  15. De Padova, A.; Schiera, D.S.; Minuto, F.D.; Lanzini, A. Spatial MILP optimization framework for siting Hydrogen Refueling Stations in heavy-duty freight transport. Int. J. Hydrogen Energy 2024, 94, 669–686. [Google Scholar] [CrossRef]
  16. Elomiya, A.; Křupka, J.; Simic, V.; Švadlenka, L.; Průša, P.; Jovčić, S. An advanced spatial decision model for strategic placement of off-site hydrogen refueling stations in urban areas. eTransportation 2024, 22, 100375. [Google Scholar] [CrossRef]
  17. He, Q.; Peng, S.; Zhang, Z.; He, Y.; Fan, L.; Yang, Z.; Wang, X.; Shi, X.; Su, H.; Zhang, J. A systematic framework of resilience assessment based on multi-state transition modeling under two-phase recovery for hydrogen refueling stations. Int. J. Hydrogen Energy 2024, 90, 481–497. [Google Scholar] [CrossRef]
  18. Hoseyni, S.M.; Mostafa, M.O.M.; Cordiner, J. Mitigating risks in hydrogen-powered transportation: A comprehensive risk assessment for hydrogen refuelling stations, vehicles, and garages. Int. J. Hydrogen Energy 2024, 91, 1025–1044. [Google Scholar] [CrossRef]
  19. Lu, Z.; Cao, Y.; Zou, Y.; Li, X.; Yang, F.; Khakzad, N.; Chen, C. Dynamic risk analysis of fire and explosion domino accidents at hydrogen refueling stations using Dynamic Bayesian Network. Int. J. Hydrogen Energy 2024, 95, 546–557. [Google Scholar] [CrossRef]
  20. Tan, H.; Shao, Z.; Wang, Q.; Lin, Z.; Li, Z.; Weng, H.; Mohamed, M.A. A coordinated planning method of hydrogen refueling stations and distribution network considering gas-solid two-phase hydrogen storage mode. Int. J. Hydrogen Energy 2025, 100, 1561–1573. [Google Scholar] [CrossRef]
  21. Kang, J.; Su, T.; Li, J.; Wang, Z.; Zhang, J. Research on risk evolution, prevention, and control of fire and explosion accidents in hydrogen refueling stations based on the AcciMap-FTA model. Process Saf. Environ. Prot. 2025, 194, 107–118. [Google Scholar] [CrossRef]
  22. Jordehi, A.R.; Mansouri, S.A.; Tostado-Véliz, M.; Safaraliev, M.; Hakimi, S.M.; Nasir, M. A tri-level stochastic model for operational planning of microgrids with hydrogen refuelling station-integrated energy hubs. Int. J. Hydrogen Energy 2024, 96, 1131–1145. [Google Scholar] [CrossRef]
  23. Çiçek, A. Yenilenebilir Enerji Destekli Bir Hidrojen Yakıt İkmal İstasyonunun Optimum Enerji Yönetimi. In Proceedings of the 5th International Congress on Engineering Sciences and Multidisciplinary Approaches, İstanbul, Türkiye, 25–26 February 2023; pp. 510–518. [Google Scholar]
  24. Çiçek, A. Optimal operation of an all-in-one EV station with photovoltaic system including charging, battery swapping and hydrogen refueling. Int. J. Hydrogen Energy 2022, 47, 32405–32424. [Google Scholar] [CrossRef]
  25. Choi, Y.; Bhakta, S. Hybrid solar photovoltaic-wind turbine system for on-site hydrogen production: A techno-economic feasibility analysis of hydrogen refueling Station in South Korea’s climatic conditions. Int. J. Hydrogen Energy 2024, 93, 736–752. [Google Scholar] [CrossRef]
  26. Wolf, N.; Neuber, R.; Mädlow, A.; Höck, M. Techno-economic analysis of green hydrogen supply for a hydrogen refueling station in Germany. Int. J. Hydrogen Energy 2025, 106, 318–333. [Google Scholar] [CrossRef]
  27. Alao, M.A.; Popoola, O.M. Distributed waste-to-hydrogen refuelling station implementation in South Africa: Techno-economic-socio-political and environmental indications. Int. J. Hydrogen Energy 2025, 106, 616–630. [Google Scholar] [CrossRef]
  28. Zhang, L.; Wang, S.; Decès-Petit, C.; Wang, Y. Holistic Idle Periodic Evaluation method for mass balance monitoring at hydrogen refuelling stations. Int. J. Hydrogen Energy 2025, 97, 66–75. [Google Scholar] [CrossRef]
  29. Wu, Q.; Bi, Y.; Shi, J.; Wang, S.; Zhang, C.; Huang, S.; Gao, W.; Bi, M. A hydrogen concentration evolution prediction method for hydrogen refueling station leakage based on the Informer model. Int. J. Hydrogen Energy 2025. [Google Scholar] [CrossRef]
  30. Shoja, Z.M.; Oskouei, A.B.; Nazari-Heris, M. Risk-based optimal management of a multi-energy community integrated with P2X-based vector-bridging systems considering natural gas/hydrogen refueling and electric vehicle charging stations. Renew. Energy Focus 2025, 53, 100680. [Google Scholar] [CrossRef]
  31. Assunção, R.; Ajeeb, W.; Eckl, F.; Gomes, D.M.; Neto, R.C. Decentralized hydrogen-oxygen co-production via electrolysis for large hospitals with integrated hydrogen refueling station. Int. J. Hydrogen Energy 2025, 103, 87–98. [Google Scholar] [CrossRef]
  32. Ghaithan, A.M. Multi-objective model for designing hydrogen refueling station powered using on-grid photovoltaic-wind system. Energy 2024, 312, 133464. [Google Scholar] [CrossRef]
  33. Chu, Y.; Wu, Z.; Yin, Y. Development of a solar-assisted hydrogen-from-power refueling station: A financial incentive model under the Well-to-Wheel and life cycle cost analyses. Int. J. Hydrogen Energy 2025, 103, 288–299. [Google Scholar] [CrossRef]
  34. Gong, C.; Na, H.; Yun, S.; Kim, Y.J.; Won, W. Liquid hydrogen refueling stations as an alternative to gaseous hydrogen refueling stations: Process development and integrative analyses. eTransportation 2025, 23, 100386. [Google Scholar] [CrossRef]
  35. Sezer, N.; Bayhan, S. Wind-powered hydrogen refueling station with energy recovery for green mobility in sustainable cities. Energy Convers. Manag. X 2025, 26, 100900. [Google Scholar] [CrossRef]
  36. SUZUKI-Burgman Fuel-Cell Scooter. Available online: https://www.globalsuzuki.com/Burgman_Fuel-Cell_Scooter/ (accessed on 15 January 2025).
  37. Toyota Mirai Full Specs. Available online: https://www.toyota.com/mirai/features/mpg_other_price/3002/3003 (accessed on 15 January 2025).
  38. NEXO: Hyundai’s Hydrogen Fuel-Cell First. Available online: https://www.hyundai.com/au/en/news/vehicles/nexo-hyundai-hydrogen-fuel-cell-first#:~:text=Three-high-pressure-fuel-tanks,a-pressure-of-700-bar (accessed on 15 January 2025).
  39. Electric Tractors Lead Charge, Hydrogen in the Wind. Available online: https://www.graincentral.com/machinery/electric-tractors-leads-charge-hydrogen-in-the-wind/ (accessed on 15 January 2025).
  40. XCIENT Fuel Cell Tractor. Available online: https://ecv.hyundai.com/global/en/products/xcient-fuel-cell-tractor-fcev (accessed on 15 January 2025).
  41. Renewables.ninja—Wind Power and Solar Photovoltaic Power (PV). Available online: https://www.renewables.ninja/ (accessed on 16 November 2023).
  42. Day-Ahead Market Prices, EPİAŞ—EXIST (Energy Exchange Istanbul). Available online: https://www.epias.com.tr/en/ (accessed on 15 January 2025).
Figure 1. An overview of the proposed HRS structure.
Sustainability 17 02663 g001
Figure 2. Electricity production from the RESs.
Sustainability 17 02663 g002
Figure 3. Day-ahead electricity market prices.
Sustainability 17 02663 g003
Figure 4. Hydrogen demands of FCEVs.
Sustainability 17 02663 g004
Figure 5. Data of power drawn from the power grid in Scenario 1.
Sustainability 17 02663 g005
Figure 6. Data of hydrogen selling and buying amounts in Case-1 in Scenario 2.
Sustainability 17 02663 g006
Figure 7. Data of hydrogen selling and buying amounts in Case-6 in Scenario 2.
Sustainability 17 02663 g007
Figure 8. Data of hydrogen amount in the hydrogen tank for all case studies.
Sustainability 17 02663 g008
Table 1. Data of system parameters and performance specifications for the proposed system.
Definitions of the Proposed StructureValues
Installed capacity of PV system0.5 MW
Installed capacity of wind power system1 MW
Minimum capacity of hydrogen tank100 kg
Capacity of hydrogen tank1000 kg
Hydrogen pipeline capacity7 kg/5 min
Unit price of hydrogen energy$3.03/kg
Nominal power of EL500 kW
Efficiency of EL0.7
Nominal power of FC500 kW
Efficiency of FC0.6
DC-AC converter efficiency0.95
Battery capacity1 MWh
Battery charge/discharge power250 kW
Battery charge/discharge efficiency0.9
Time resolution5 min
A33.5
Ramp-up rate and ramp-down rate for FC/EL in a period1
Table 2. Hydrogen capacities of the vehicles.
VehicleHydrogen Capacity (kg)
Suzuki Burgman Fuel-Cell Scooter (Motorcycle) [36]0.42
Toyota Mirai (Car) [37]5.60
Hyundai Nexo (Car) [38]6.33
Van8.00
Fendt H2Agrar (Tractor) [39]21.00
Combine Harvester60.00
Hyundai XCIENT Fuel-Cell Tractor (Truck) [40]68.60
Table 3. Data of case studies conducted.
CasesA (Cost)B (Load Factor)RESsDouble Capacity of RESsDouble Capacity of the EL
Case-1----
Case-2---
Case-3----
Case-4---
Case-5---
Case-6--
Case-7-
Case-8-
Table 4. The cost of each case study obtained from the test results.
CasesTotal Cost ($)
S1S2S3Average
Case-1−370.37 −418.4−399.41−396.06
Case-256.49 49.34−46.9919.61
Case-3−219.97 −265.47−268.87−251.44
Case-4185.8 208.12111.63168.52
Case-5−220.58 −266.79−269.79−252.39
Case-6184.46 207.75111.31167.84
Case-7312.26334.52240.46295.75
Case-8589.97681.69491.83587.83
Table 5. Load factor results based on case studies.
CasesLoad Factor
S1S2S3Average
Case-11111
Case-21111
Case-30.7420.7440.7420.743
Case-40.2220.3320.2480.267
Case-50.9980.9980.9980.998
Case-60.4600.4000.3350.398
Case-70.8090.6460.6350.697
Case-80.0380.1930.2230.151
Disclaimer/Publisher’s Note: The statements, opinions and data contained in all publications are solely those of the individual author(s) and contributor(s) and not of MDPI and/or the editor(s). MDPI and/or the editor(s) disclaim responsibility for any injury to people or property resulting from any ideas, methods, instructions or products referred to in the content.

