1. Introduction
The continuous increase in global greenhouse gas emissions has heightened the risks of climate change, which are becoming more severe across all regions of the world. These risks include rising average temperatures, increased rainfall during the wet season, decreased rainfall during the dry season, more frequent hot days, and fewer cold days. Such changes have led to more frequent and intense natural disasters, such as floods, droughts, and storms, as well as rising sea levels, which affect economic and social development in various sectors [
1,
2]. Additionally, climate change impacts ecosystems, plant and animal species, human migration patterns, and the spread of diseases [
3]. Thailand, located in Southeast Asia, is among the countries affected by climate change [
4,
5]. According to the Intergovernmental Panel on Climate Change (IPCC), Southeast Asia has been identified as one of the most vulnerable regions to climate change [
6]. Furthermore, German Watch has ranked Thailand among the top-ten countries at high risk of long-term climate change impacts [
7,
8]. In response to this global challenge, Thailand has actively participated in international efforts to combat climate change, including the Paris Agreement under the United Nations Framework Convention on Climate Change (UNFCCC) [
9]. This agreement requires all participating countries to set national targets and report on progress in addressing climate change [
10,
11]. It also provides mechanisms to drive global action against climate change. Mitigating the long-term impacts of climate change requires global cooperation, as well as strong domestic efforts within Thailand. The country must take responsibility at both the national and international levels to ensure sustainable growth and strengthen its standing on the global stage [
12,
13]. Therefore, Thailand’s participation in the Paris Agreement entails a commitment to enhancing its preparedness and capacity to address climate change challenges effectively [
14,
15].
From 1992 until 2024, Thailand has continuously implemented national policies aimed at reducing greenhouse gas emissions [
16]. However, the country remains highly vulnerable to the severe impacts of climate change due to its reliance on fossil fuels and the rapid expansion of urban areas, which has driven a constant increase in energy demand [
17,
18]. This, in turn, has resulted in rising greenhouse gas emissions. In 1992, Thailand emitted 156.50 Mt CO
2 Eq. (excluding emissions from land-use change and forestry), which increased to 372.59 Mt CO
2 Eq. in 2024. This has been reflected in an overall growth rate of 138.07%. This trend underscores the worsening climate change crisis, despite Thailand’s ongoing efforts in greenhouse gas inventory management [
8,
19,
20]. Thailand has systematically accounted for six major greenhouse gases: carbon dioxide (CO
2), methane (CH
4), nitrous oxide (N
2O), hydrofluorocarbons (HFCs), perfluorocarbons (PFCs), and sulfur hexafluoride (SF
6). As a developing country, Thailand has received financial support from the Global Environment Facility (GEF) for these efforts [
5,
21,
22]. However, emissions have continued to rise, showing that mitigation efforts have not yet resulted in a net reduction. The energy and transportation sectors remain the largest contributors to greenhouse gas emissions, accounting for 70.01% of total emissions in 2024. These sectors alone released 260.81 Mt CO
2 Eq., reflecting a 125.05% increase from 1992 to 2024 [
2,
5].
However, energy consumption in the energy and transportation sectors has increased across all dimensions. The Thai government has made significant efforts to reduce greenhouse gas emissions through various measures, including [
4,
8,
23] the following:
Electricity Generation: The government has implemented two key measures to reduce greenhouse gas emissions in electricity generation: (1) Enhancing energy efficiency in electricity production; and (2) Promoting electricity generation from renewable energy sources. According to the AIM/Enduse model, the selected renewable energy technologies for electricity generation include biomass, biogas, waste-to-energy, solar power, wind energy, and hydropower;
Household Energy Consumption: To reduce greenhouse gas emissions in households, two main measures have been introduced: (1) Improving household energy efficiency; and (2) Promoting the use of renewable energy in households. The AIM/Enduse model identifies technologies that enhance household energy efficiency, including high-efficiency lighting (e.g., T5 and LED bulbs), high-efficiency cooling systems (e.g., COP5 and COP8-9), high-efficiency air conditioners (e.g., COP5 and COP8-9), high-efficiency stoves, and other energy-efficient household appliances. Among these, high-efficiency stoves have the greatest potential for reducing energy consumption and greenhouse gas emissions. In terms of renewable energy use in households, promising technologies include renewable heat generation, such as solar water heaters and biogas digesters for producing heat from biogas;
Energy Use in Commercial and Government Buildings: To improve energy efficiency in commercial and government buildings, the AIM/Enduse model has identified key technologies for optimizing electricity consumption in four main systems: (1) Cooling systems—adoption of high-efficiency cooling technologies; (2) Lighting systems—use of high-efficiency lighting such as LED bulbs; (3) Office equipment—implementation of energy-efficient office appliances; and (4) Other systems—use of high-efficiency heating equipment (e.g., efficient heaters);
Energy Use in the Industrial Sector: The industrial sector has adopted two main measures: (1) Enhancing energy efficiency in industrial processes; and (2) Promoting the use of renewable energy in industries. Industrial energy consumption primarily comes from electricity sources, and measures focus on improving efficiency and transitioning to cleaner energy alternatives.
However, Thailand’s continuous policy implementation aimed at reducing greenhouse gas emissions, particularly CO
2 emissions in the energy and transportation sectors, has not achieved the intended results. This indicates that the existing measures have not been effective in significantly reducing emissions. Instead, the growth rate of CO
2 emissions has continued to rise, deviating from the national strategy to develop Smart City Thailand and making it impossible to achieve the long-term goal of carbon neutrality by 2050 [
2,
5].
Therefore, this research develops a new model to replace Thailand’s existing framework, serving as a crucial decision-making tool for efficient and effective national policy planning in the future. Additionally, it has been observed that previous models used for decision-making in Thailand have overlooked several key factors and failed to establish a new scenario policy to monitor and evaluate governance effectiveness. If forecasting errors are high, they can lead to significant policy miscalculations, making long-term corrections difficult. This research aims to fill these gaps by developing a new model that can be applied to other sectors in the future.
2. Literature Reviews
In recent studies exploring the intersection of energy efficiency, sustainability, and urban development, various strategies have emerged for improving energy use and reducing emissions, particularly within the context of smart cities. Mishina et al. [
24] emphasized the importance of accessibility to social facilities in urban areas, proposing models that predict facility utilization based on population demand and capacity. By enhancing traditional models with deep learning techniques, urban planners can uncover patterns in data-limited contexts, which could be critical for forecasting long-term electricity consumption in cities striving for sustainable development. Wu et al. [
25] explored the attitudes of millennials in China toward adopting low-carbon lifestyles, emphasizing individual responsibility in achieving climate goals. Their study highlights that, while millennials are open to such lifestyles, technological innovation and supportive policies are necessary to overcome the challenges posed by economic and social factors. This insight is valuable for cities aiming to reduce greenhouse gas emissions, especially in urban environments where millennials play a key role in shaping future consumption behaviors.
In the European context, Brodny and Tutak [
26] presented a methodology for assessing the sustainability of EU member states, focusing on energy and climate sustainability. Their study reveals differences between countries, with Sweden and Denmark leading in sustainable development, thus underscoring the importance of national energy strategies in planning for long-term emission reductions in urban areas aspiring to meet smart city objectives. Similarly, Niza et al. [
27] examined the challenges of achieving thermal comfort and energy efficiency in buildings, highlighting the role of new technologies that can optimize energy use but are dependent on regional climate conditions, a critical factor for smart city infrastructure. Further, Almihat et al. [
28] explored the energy needs of smart cities, proposing a framework for predicting electricity consumption using machine learning techniques. They stressed the importance of integrating smart technologies into urban infrastructure to support sustainable energy management. Giourka et al. [
29] similarly discussed the role of smart city solutions in facilitating energy transitions, particularly in two EU cities, Evora and Alkmaar. They identified key value attributes like cost reduction and integration, which are essential for developing sustainable energy strategies that forecast electricity consumption patterns and inform emission-reduction policies in urban settings.
In line with these developments, a study by Angelakoglou et al. [
30] examined the performance indicators for smart cities, proposing key performance metrics (KPIs) to track energy-efficient developments. These KPIs can be instrumental in monitoring and guiding sustainable city initiatives, especially those aiming to optimize energy consumption and reduce carbon footprints. Moreover, Malandrino et al. [
31] explored the challenges that bureaucratic processes present in Italy when implementing energy-efficient policies. They identified a need for streamlined governance and more cohesive inter-departmental cooperation to overcome these barriers. Their work underscored the importance of institutional support in achieving ambitious energy efficiency goals in urban settings, where the complexities of policy implementation often slow progress.
It is also noteworthy that effective energy forecasting is crucial for managing electricity consumption and advancing sustainability in smart cities. Several studies have utilized machine learning models for energy demand prediction in buildings and urban areas. Seefoo Jarquin et al. [
32] utilized artificial neural networks (ANNs) to predict energy usage in university buildings, incorporating weather- and time-related predictors. Khan [
33] applied Ensemble Empirical-Mode Decomposition (EEMD) with an Extreme Learning Machine (ELM) to forecast electricity prices in Australia, demonstrating deep learning techniques’ efficacy in capturing market complexities. Kannari [
34] used machine learning models for energy demand forecasting in commercial buildings, while Abu Al-Haija [
35] employed autoregressive methods to predict building energy use. Ramos [
36] and Buyo [
37] compared ANN and XGBoost algorithms for short-term load forecasting in office buildings and households, respectively, revealing their high accuracy.
In addition to machine learning, hybrid models and tailored approaches have shown significant improvements in forecasting accuracy. Albahli [
38] combined Long Short-Term Memory (LSTM) networks with Prophet for dynamic electricity demand forecasting, yielding reduced error rates. Niu [
39] applied ARIMA models to forecast energy consumption in laboratories, while Fernandez [
40] focused on mobility network models to predict energy demand in smart cities. Using hybrid approaches, Danielsson et al. [
41] blended statistical methods and machine learning techniques for energy load prediction in smart buildings, highlighting better prediction precision. Cao et al. [
42] explored the integration of demand-side management and machine learning models for household energy demand forecasting. These studies demonstrate the versatility and effectiveness of machine learning, hybrid models, and specialized techniques in energy forecasting, contributing to optimized urban energy management and sustainability in smart cities.
In fact, the integration of energy consumption models in various sectors has become essential for enhancing efficiency and promoting sustainability. Anan [
43] utilized a Long Short-Term Memory (LSTM) model for predicting energy consumption in office buildings that considers occupancy, which can improve energy efficiency by 20%. Brzezinski et al. [
44] proposed a three-stage model for estimating energy consumption in intermodal terminals, helping designers to estimate future energy needs and plan accordingly. Ahn and Rakha [
45] developed a simple energy model for hydrogen fuel cell vehicles, demonstrating its accuracy in predicting energy consumption based on real-time data, making it useful for applications like smartphone apps. Buratto et al. [
46] applied time-series forecasting to predict diesel consumption in Brazil’s thermal energy systems, achieving high accuracy with ensemble learning methods, which aids in energy planning. Saiki et al. [
47] focused on forecasting Brazil’s energy consumption trends, utilizing models, such as SARIMA and ARIMA to contribute to sustainable energy strategies and policy-making. Wang et al. [
48] developed a novel gray model for predicting China’s energy consumption and CO
2 emissions, optimizing parameters to better capture new data for more accurate predictions. Denysov et al. [
49] modeled Ukraine’s low-carbon energy transition, emphasizing the role of nuclear energy in the country’s Integrated Power System, enhancing the accuracy of future energy forecasts. Finally, Gifalli et al. [
50] explored the use of artificial neural networks for forecasting electricity consumption in smart grids, improving consumption patterns and energy efficiency through real-time data.
Other recent studies in energy forecasting and efficiency highlight the innovative application of machine learning and hybrid models for enhancing energy management. Nguyen [
51] introduced a PSO–LSTM–GRU hybrid neural network for real-time predictions in hydraulic excavators, achieving significant energy savings (up to 10.89%) and improved tracking accuracy. In natural gas consumption, Wang et al. [
52] proposed a homoheterogeneous stacking ensemble learning method that outperformed traditional models, offering robust predictions for national and provincial data. Stepanova [
53] applied SHAP and a multi-agent approach to short-term power consumption forecasting for gas industry enterprises, achieving a reduction in MAE from 105.00 kWh to 15.52 kWh, improving safety and decision-making. Richter [
54] developed a federated learning framework for forecasting dynamic electrical loads in Renewable Energy Communities, effectively handling non-stationary and discontinuous time series to improve predictive accuracy across distributed communities.
From the literature review, it was found that, in the past, the government’s management of what is referred to as civil politics lacked effectiveness due to the inability to have appropriate decision-making tools. The model previously used by the government was a general model that may not have been suitable for the context of its application in managing the development of smart government. As a result, the management lacked the correct direction and failed, particularly in the creation of Smart City Thailand. It is essential for management to be integrated and aligned with the sustainable development policy, ensuring that growth occurs simultaneously across all sectors. This cannot be managed separately by sector, as factors within the country’s economic system and policy formulation interact with and influence each other, both positively and negatively.
From the literature review, it was found that past forecasting models used for national policy planning, specifically aimed at achieving carbon neutrality by 2050, were developed without analyzing key components essential for strategic governance under the Smart City Thailand framework. This framework requires simultaneous growth in economic, social, and environmental aspects, with the government operating as a smart government to ensure efficient national administration. However, previous approaches relied only on fragmented analyses rather than path analysis and lacked emphasis on the validity and performance of the models.
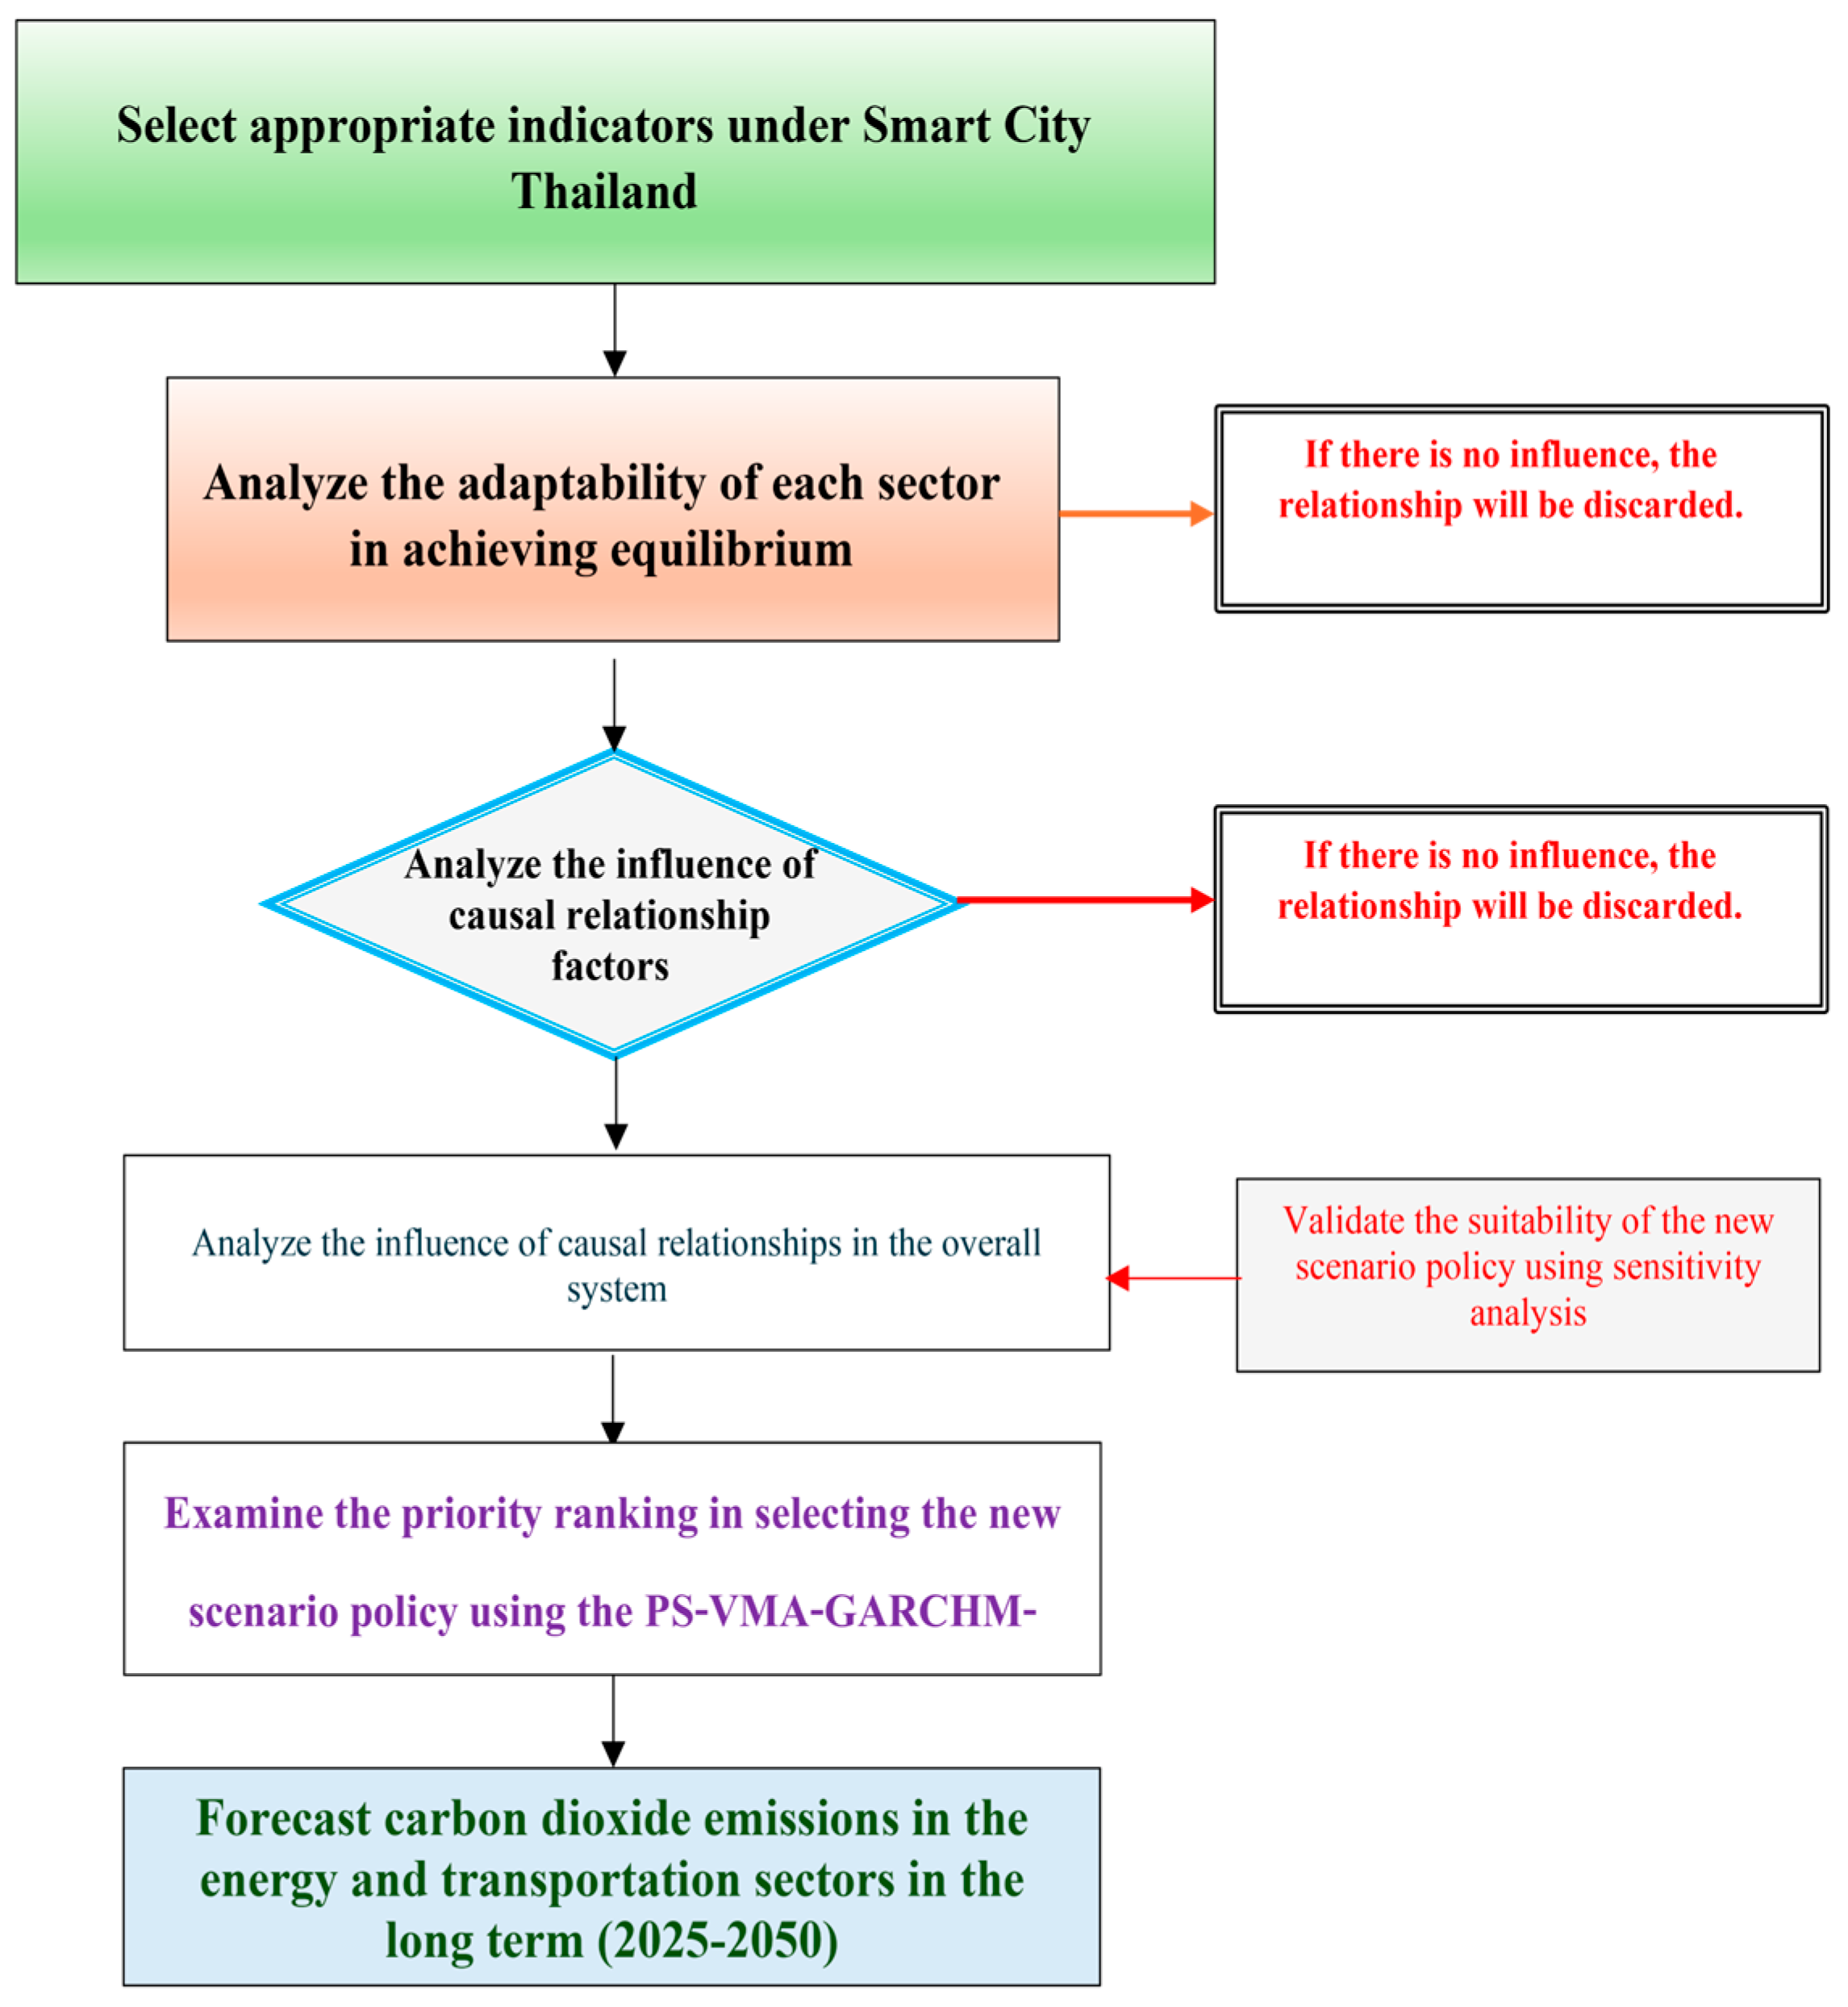
Additionally, Thailand has only used a single, simplistic model for policy planning, which fails to account for spurious relationships, ultimately affecting its credibility and practical implementation. To address these limitations, this research develops a new model called the PS–VMA–GARCHM–EnPoll model, which utilizes secondary data from 1992 to 2024 derived from information used for Thailand’s administration. The data are sourced from the Office of the National Economic and Social Development Council (NESDC), the National Statistical Office, the Ministry of Information and Communication Technology, and the Department of Alternative Energy Development and Efficiency, following these research steps:
Selecting appropriate indicators by incorporating all indicators defined under the Smart City Thailand policy;
Analyzing sectoral equilibrium adjustment capabilities to assess how different sectors adapt over time;
Evaluating causal relationships within the overall system to understand the interconnected influences;
Prioritizing the selection of new scenario policies using the PS–VMA–GARCHM–EnPoll model and confirming their feasibility through sensitivity analysis;
Forecasting long-term carbon dioxide emissions (2025–2050) in the energy and transportation sectors, aligning with the carbon neutrality goal, as illustrated in
Figure 1.
Figure 1 outlines the research framework, in which the PS–VMA–GARCHM–EnPoll model has been developed with a meticulous and systematic approach. This model ensures that the analytical results exhibit white noise properties, minimizing forecasting errors. The model is designed as a decision-making tool for smart government to formulate new scenario policies that effectively steer the country toward the carbon neutrality goal by 2050. It adheres to the carrying capacity criteria and facilitates Thailand’s transition into a Smart City Thailand, ensuring long-term sustainability and appropriateness in national governance.
3. Material and Methods
For this research, a new model has been developed by applying previous models and filling in the gaps found in earlier versions. The model in this research is called the “Path Solow model based on vector moving average-GARCH in mean with environmental pollution (PS–VMA–GARCHM–EnPoll model)”. The model development is performed by adapting existing ideas and theories to be used for formulating strategies for environmental protection. It can also be appropriately applied across various sectors. This model differs from earlier ones in that it can indicate the prioritization of factors for effective and efficient long-term strategic planning in a tangible manner. Additionally, this model can be used as a framework for developing qualitative research designs, with its analytical outcomes helping to close various gaps. The PS–VMA–GARCHM–EnPoll model is constructed with sustainable development in mind for national management, illustrating the interrelationships among the economic, social, and environmental sectors. The analysis results regarding the influence of these relationships from the PS–VMA–GARCHM–EnPoll model must take validity into account and avoid spurious correlations, as detailed below.
3.1. Structure (Specification) of the PS–VMA–GARCHM–EnPoll Model
Based on the traditional Solow model, the production function (aggregate production function) is defined with exogenous labor-augmenting technical progress as
, where A represents the level of technology and
represents effective labor. Assuming that the rate of technological progress is g and the population growth rate is
, the per-effective-worker capital accumulation equation is derived as follows [
55,
56]:
From Equation (1), let
. In this research, the pollution/ambient environment is defined as
. Thus, the pollution accumulation equation can be written as [
57,
58,
59]
From Equation (2), let
. Then, at equilibrium, the steady-state capital stock per efficiency unit is given by
, where the rate of growth of k is
. Thus, the steady state stock of pollution in efficiency units is as follows [
59,
60]:
From Equation (3), it is assumed that
grows at a rate equal to
and that the growth rate of pollution is positive. This leads to the concept of pollution prevention through the use of clean production technology. In this context, the unit emission coefficient is expressed in terms of capital intensity as
. Thus, the growth rate of pollution is given as follows [
59]:
From Equation (4), we observe that
is the long-run equilibrium value of the capital stock in efficiency units. Therefore, from the above equation, in order to reduce pollution, it must be assumed that
is growing positively and that both the average and marginal products of capital equal
, which contradicts the Inada conditions. Thus, we have
and
.
However, this model assumes the existence of two types of capital: productive/output-generating capital
) and abatement capital
), which is used to reduce pollution without generating output. Abatement capital can lower the emissions per unit of output produced, and the production function is expressed as follows [
59,
60].
From Equation (5), let the capital stock be divided into productive capital (which is pollution-generating capital), denoted as , and abatement capital, denoted as . Also, let represent effective labor.
Thus, by assigning saving rates to both types of capital
, the capital and pollution accumulation equations can be written as follows:
From Equations (6)–(8), it is found that , , given that the average and marginal product of capital approach as . This model can explain the transitional dynamics of pollution when the stock of capital decreases, which aligns with the Kuznets curve. When , we obtain and , with a critical value, , that determines and . Therefore, when economic growth exceeds the critical value, pollution will decrease and eventually reach zero, which can be expressed as if and only if .
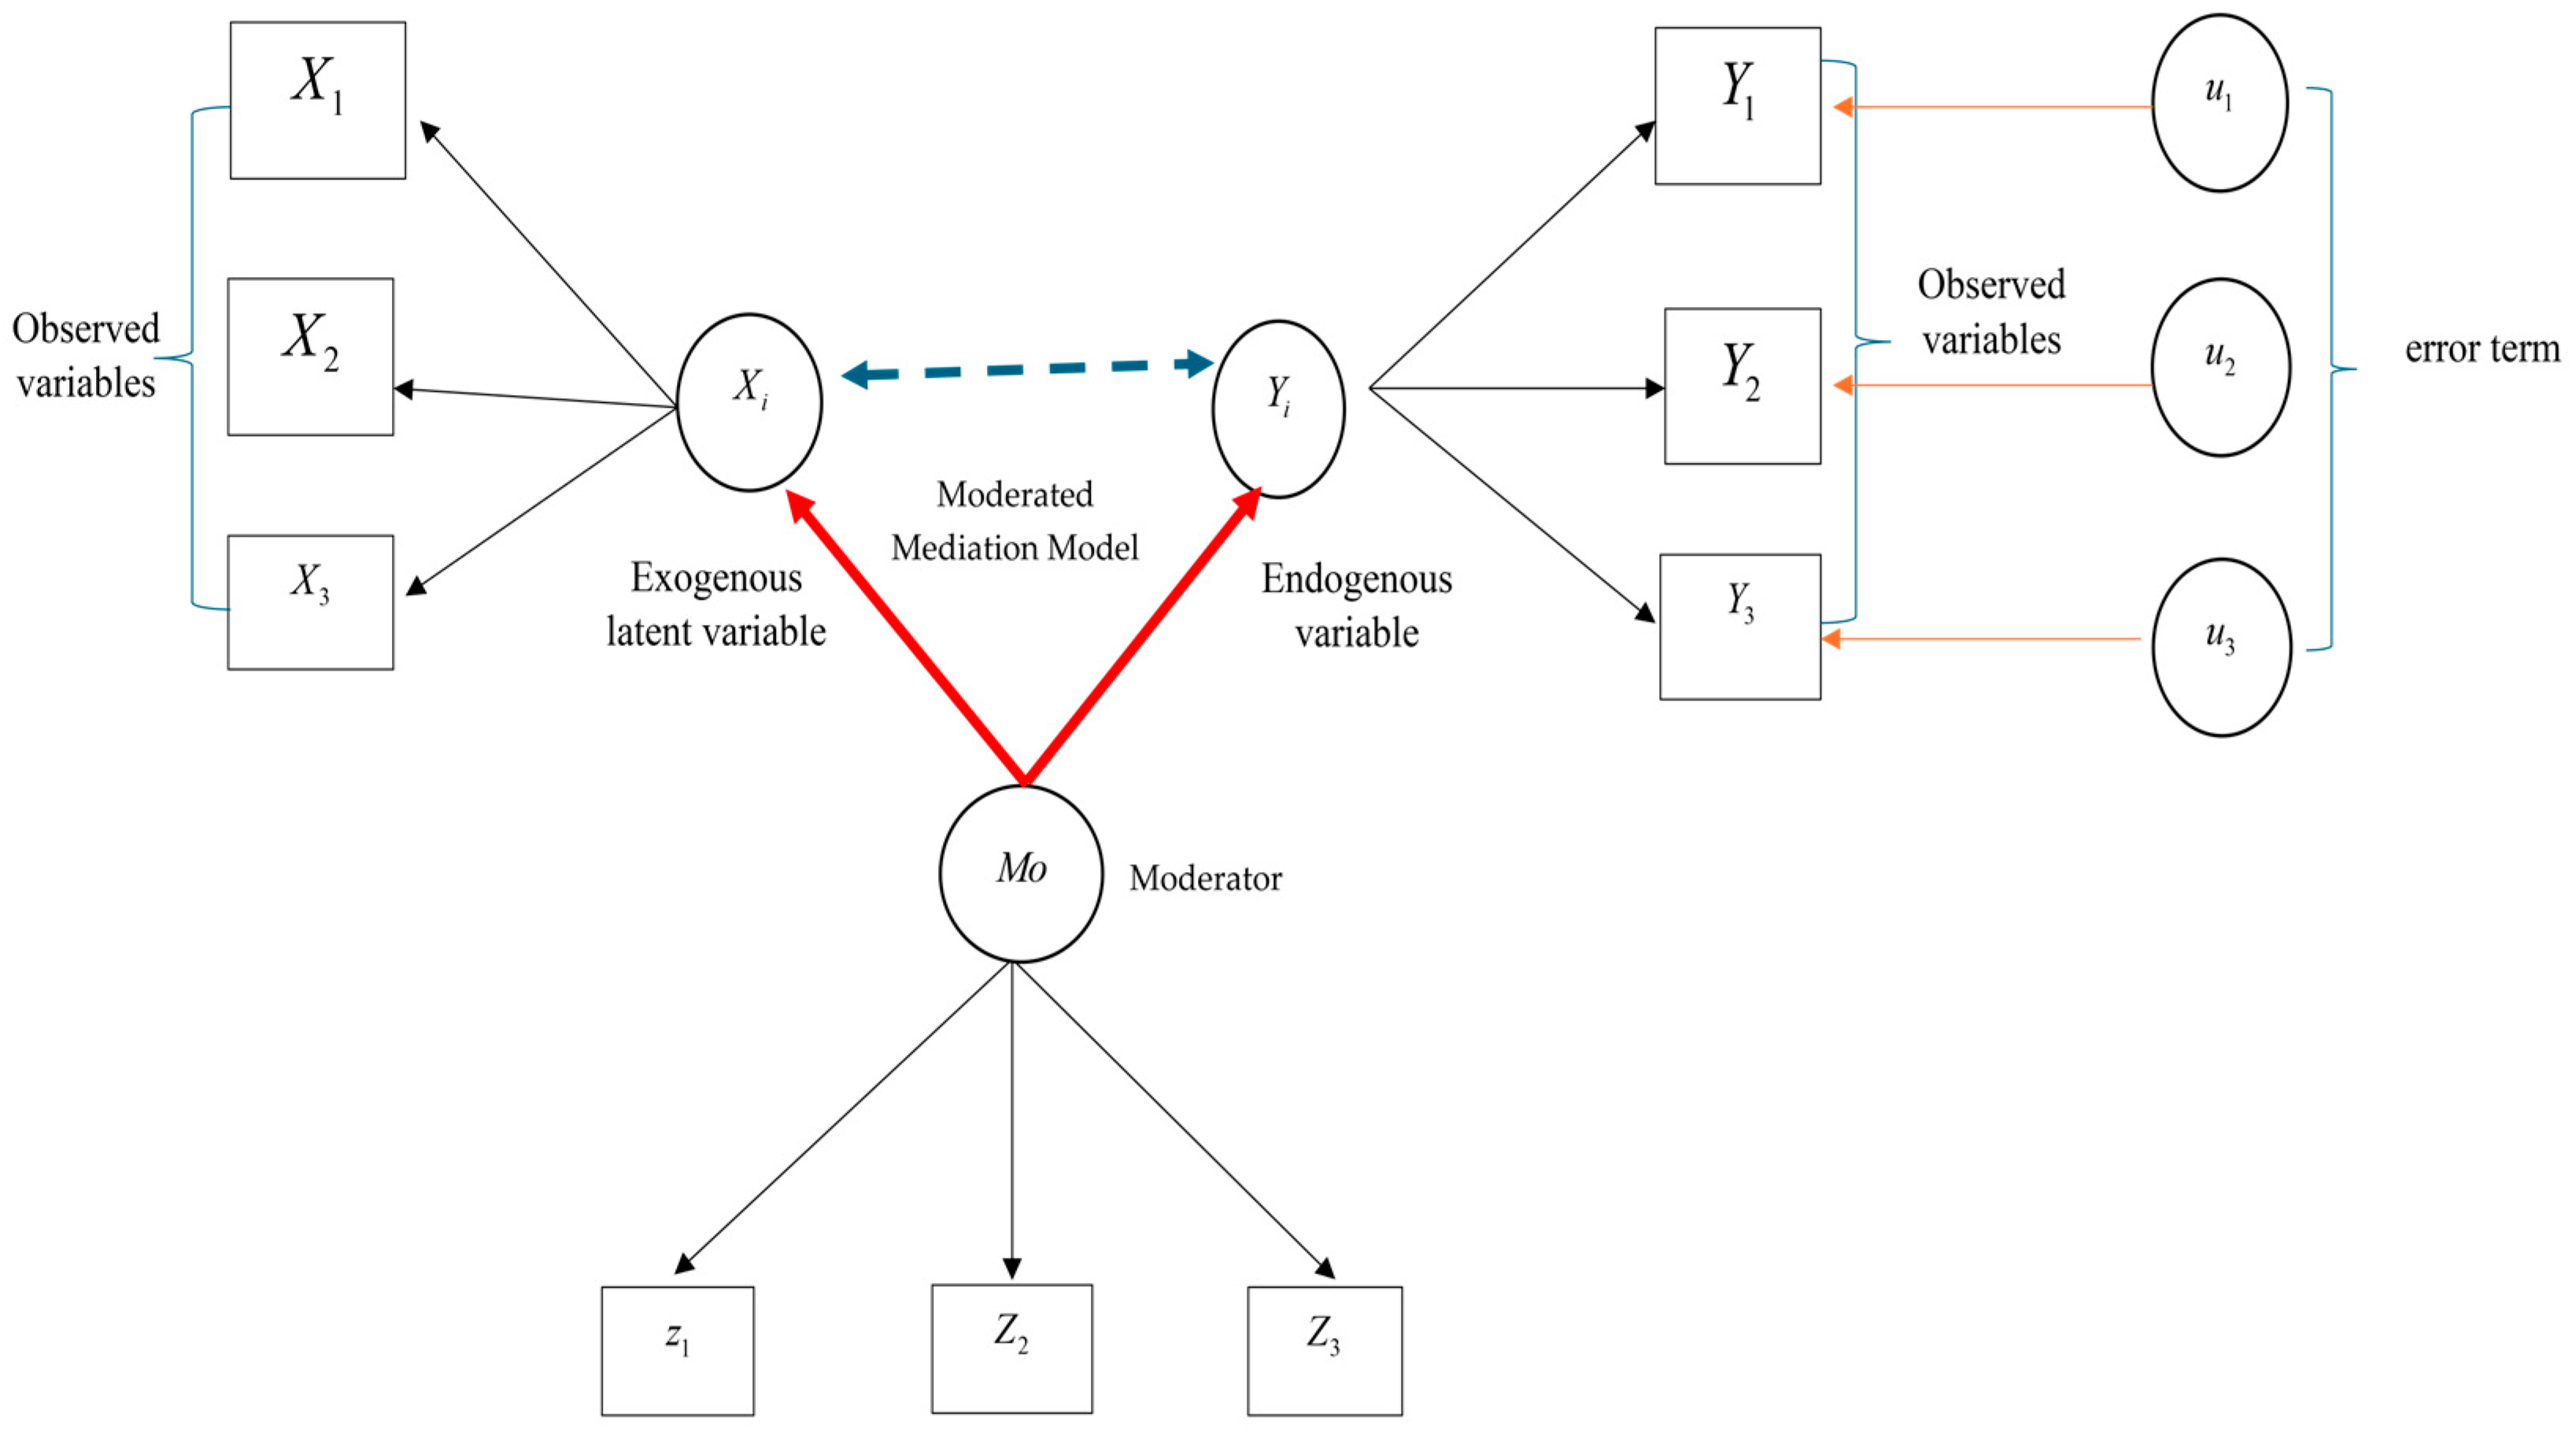
For the components of the PS–VMA–EnPoll model, this consists of three parts [
19,
59,
60].
Figure 2 illustrates the structural relationships of the PS–VMA–GARCHM–EnPoll model, which analyzes the causal relationships among factors. It consists of three aspects: latent variables, observed variables, and moderator variables,
. In this model, the influences of all three components are analyzed.
3.2. Characteristics of the Data Used for Constructing the PS–VMA–GARCHM–EnPoll Model
The PS–VMA–GARCHM–EnPoll model uses data that are stationary for estimation purposes. This model is designed to avoid issues such as autocorrelation, multicollinearity, and heteroscedasticity. Under the assumptions for estimation using stationary data, three conditions must be met: the mean (
) must be constant, the variance (
) must be constant, and the covariance (
) must remain unchanged over time. Generally, data tend to be non-stationary; therefore, it is necessary to test their suitability before building a model by conducting a unit root test based on the Augmented Dickey–Fuller (ADF) approach. The null hypothesis (
) is specified as follows [
55,
56,
57]:
From Equation (9),
is the variable used to conduct the unit root test. The test is performed to determine whether the data exhibit stationarity. If the analysis results indicate
, it means that
is stationary. However, if the results indicate
, this suggests that
is non-stationary. In such a case, it is essential to transform the data into a stationary form. In this research, the first-difference method is applied to achieve stationarity [
58].
From Equation (10),
is the parameter to be estimated. If
is found, this indicates that
has a unit root. The hypothesis is concluded by comparing the t-statistic with the MacKinnon value. In this research’s model, the variance in the error term
has been considered and must remain constant with the characteristics of an AR(q) process, as follows:
From Equation (11), let
be the estimated residuals. In this model,
must follow a white noise process. Given this condition,
and the error term can be expressed as follows:
From Equation (12), it is found that using likelihood techniques and defining
as a multiplicative disturbance can be expressed as follows:
From Equation (13), it is found that and are independent of each other, and is a constant, given that and . This indicates that is a white noise process.
3.3. Measurement of Model Fit
For the PS–VMA–EnPoll model, a detailed examination of the measurement of model fit is required. The values obtained from the assessment must meet all the following criteria [
19,
59,
60]:
Chi-square statistics must fall within the acceptable range of ;
Root Mean Squared Residual (RMSR) must fall within the acceptable range of ;
Root Mean Square Error of Approximation (RMSEA) must fall within the acceptable range of ;
Standardized Root Mean Square Residual (SRMR) must fall within the acceptable range of ;
Normal Fit Index (NFI) must fall within the acceptable range of ;
Non-Normed Fit Index (NNFI) must fall within the acceptable range of ;
Comparative Fit Index (CFI) must fall within the acceptable range of ;
Goodness of Fit Index (GFI) must fall within the acceptable range of ;
Adjusted Goodness of Fit Index (AGFI) must fall within the acceptable range of .
3.4. Performance Evaluation of the PS–VMA–EnPoll Model
In this research, the performance of the PS–VMA–EnPoll model was evaluated by comparing it with past models to determine its suitability for future forecasting. The comparison was conducted against various historical models, including Multiple Regression Model (MR model), artificial neural network (ANN model), Anisotropy Factor Model (ANIF model), gray models (GM(1,1)), neural network model (NN model), RIMA Model, Fuzzy model, convolutional neural network (CNN), and ARIMAX Model.
4. Empirical Analysis
4.1. Selection of Appropriate Indicators for Developing the PS–VMA–GARCHM–EnPoll Model
In this paper, the PS–VMA–GARCHM–EnPoll model is developed, which is a path analysis model designed to analyze the causal influence relationships of key factors. This model incorporates three dimensions, namely, latent variables, formulated as , and it includes pollution-generating capital , abatement capital ), and effective labor . Since these three dimensions are latent variables, all selected indicators must be appropriate and meet the stationarity requirement.
As shown in
Table 1, it was found that only 15 indicators were suitable for analysis in the PS–VMA–GARCHM–EnPoll model. These selected indicators were then utilized as observed variables, including urbanization rate
, industrial structure
, export-import
, foreign investment
, foreign tourism rate
, effective labor rate
, clean technology
, biomass energy
, renewable energy rate
, green material rate
, waste biomass
, gasohol use rate
, fatty acid methyl ester rate
, solar cell rate
, and electric vehicles
. The research has found that all indicators were non-stationary at level I(0). Therefore, this issue is addressed by differencing, applying first difference at level I(1). The results showed that all indicators became stationary at a 99% confidence interval at the first difference level. In fact, this issue is addressed by differencing, applying the first difference at level I(1). The results showed that all indicators became stationary, within a 99% confidence interval, at the first difference level. The verification at the first difference level demonstrates that all stationary indicators must possess three key properties: (1) Mean (μ); (2) Squared standard deviation
or variance
; and (3) Covariance
. These three properties remain constant and do not change over time.
However, this study selected only 15 indicators that were stationary at the first difference level. The selection of indicators was based on those designated by Thailand for formulating national management strategies to achieve sustainability. Any indicators that did not meet these criteria were excluded at this stage and could not be used in model development. Examples of such excluded indicators include the government expenditure rate, carbon credit rate, and forest coverage rate.
4.2. Analysis of Equilibrium Adjustment by Error Correction Mechanism (ECM)
All indicators that were stationary at first difference I(1) were utilized to examine their ability to adjust to equilibrium by applying the co-integration test. This test was conducted to assess the long-term equilibrium adjustment capacity of the indicators. The analysis revealed that all indicators demonstrated the ability to adjust to equilibrium, as shown below.
From
Table 2, it is evident that all indicators have the ability to adjust to equilibrium in the long run. The analysis shows that the Trace Statistic Test is 209.59 and the Max-Eigen Statistic Test is 275.01, both of which are greater than the MacKinnon critical value at a significance level of α = 0.01. This indicates that policy implementations affecting these indicators will have varying impacts on their ability to reach equilibrium. Among the sectors analyzed, abatement capital
demonstrates the fastest adjustment to equilibrium, followed by pollution-generating capital
and effective labor
, respectively, at α = 0.01 significance.
Thus, these findings suggest that, if the government intends to develop long-term strategic policies, it is crucial to prioritize sectors that can quickly adjust to equilibrium. Failing to consider this aspect and implementing policies in less adaptable sectors may lead to inefficiencies in governance, similar to past policy shortcomings.
4.3. Path Analysis of Causal Relationships in the PS–VMA–GARCHM–EnPoll Model
The path analysis of causal relationships in this study initially defines three latent variables: abatement capital , pollution-generating capital , and effective labor . These variables represent the pathways of influence on the changes in different sectors, showing both direct effects and indirect effects, as presented below.
From
Table 3, an assessment has been conducted to verify the best model characteristics of the PS–VMA–GARCHM–EnPoll model. The key findings are as follows:
The validity test results indicate that the model, PS–VMA–GARCHM–EnPoll model, meets high-quality standards. All statistical tests, including , , Cronbach’s alpha, , and Composite Reliability (CR), , confirm that the PS–VMA–GARCHM–EnPoll model possesses appropriate validity;
Measurement of Model Fit has indicated that the goodness-of-fit (GOF) tests of all the criteria meet the required thresholds, as detailed below:
Chi-square statistics = ;
Root Mean Squared Residual (RMSR) = ;
Root Mean Square Error of Approximation = ;
Standardized Root Mean Square Residual = ;
Normal Fit Index = ;
Non-Normed Fit Index = ;
Comparative Fit Index = ;
Goodness of Fit Index =
Adjusted Goodness of Fit Index = ;
Spurious Relationship and Diagnostic Tests have been conducted to verify the validity of the PS–VMA–GARCHM–EnPoll model and found the following: no heteroscedasticity problem was detected, as indicated by ; no multicollinearity problem was found, confirmed by ; no multicollinearity problem was found, as confirmed by , which tests whether the indicators used to construct this model are independent. The test results indicate that the indicators, which consist of information collected by government agencies, are independent when used to develop the model in this study and contribute to the accuracy of the research model, and no autocorrelation problem was observed, as the Durbin–Watson (D.W.) statistic = 1.98.
Therefore, the PS–VMA–GARCHM–EnPoll model possesses all the necessary attributes to serve as a critical tool for policy formulation and long-term strategic planning in Thailand. From the analysis in
Table 3, it is evident that abatement capital
acts as a moderator, as indicated by its path influence coefficient exceeding 0.8. This confirms its significant role in shaping the relationships within the model. The relationship pathways and directional influence of each latent variable have also been mapped out, which can be illustrated as follows:
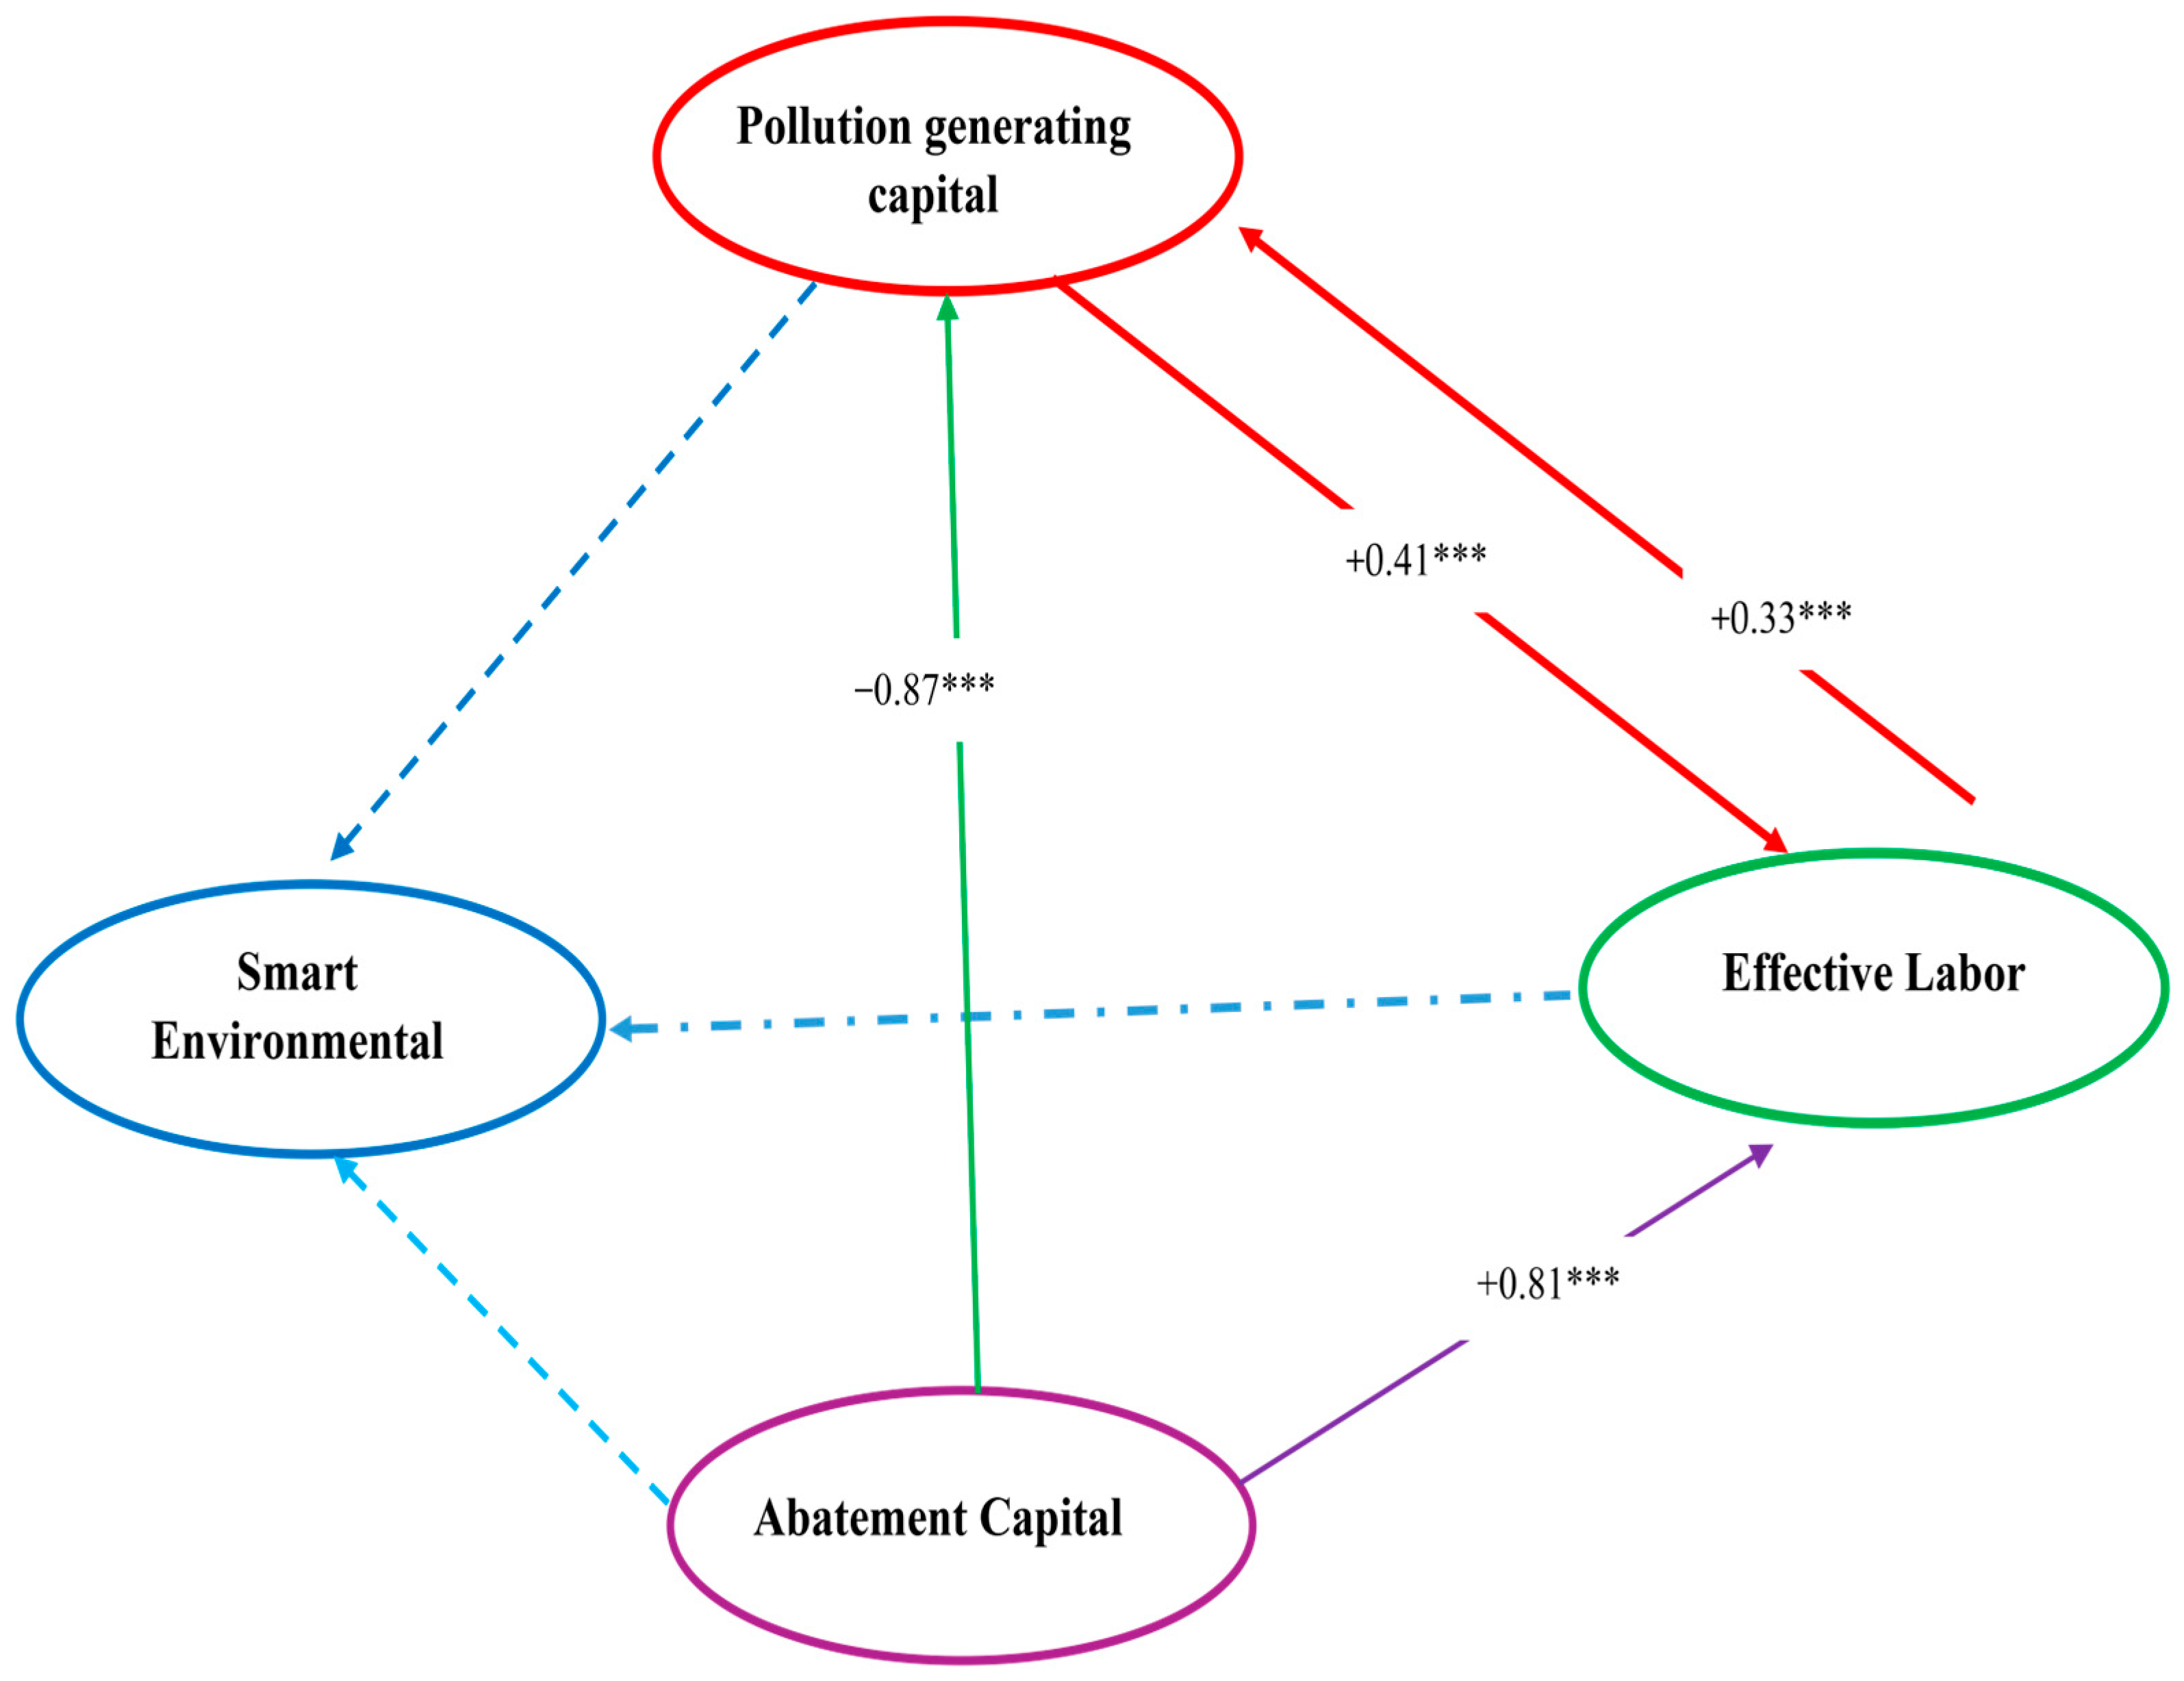
From
Figure 3, the analysis of the PS–VMA–GARCHM–EnPoll model confirms that abatement capital
acts as a moderator, influencing the relationship pathways between pollution-generating capital
and effective labor
. This moderation effect leads to changes in the influence magnitude among sectors. The results of the analysis indicate changes in the influence magnitude of relationships across sectors. Abatement capital
has the strongest direct effect on pollution-generating capital
, with its influence increasing by 0.87% in the opposite direction, at a statistically significant level of
. Secondly, abatement capital
also has a direct effect on effective labor
, with its influence increasing by 0.81% in the same direction, at a statistically significant level of
. Meanwhile, pollution-generating capital
has a direct effect on effective labor
, but its influence decreases by 0.41% in the same direction, at a statistically significant level of
. Lastly, effective labor
has a direct effect on pollution-generating capital
, with its influence decreasing by 0.33% in the same direction, at a statistically significant level of
.
Based on the analysis from the PS–VMA–GARCHM–EnPoll model, it has been concluded that the government should formulate a new scenario policy using abatement capital as the key indicator, as it has the most significant influence on changes in other psectors. Conversely, effective labor and pollution-generating capital should not be used as indicators, as their influence on sectoral changes is declining and they do not act as moderators. To develop a new scenario policy as part of the long-term national strategy, a sensitivity analysis has been conducted to assess the responsiveness of each indicator. The results show that clean technology has the highest sensitivity rate at 96%, followed by renewable energy rate at 93%, biomass energy at 95%, electric vehicles at 92%, green material rate at 91%, waste biomass at 86%, gasohol use rate at 85%, fatty acid methyl ester rate at 81%, and solar cell rate at 80%.
From these findings, the new scenario policy has been categorized into two levels: (1) Urgent and Immediate Implementation, where indicators are with a sensitivity rate of 90% or higher, requires immediate action, including clean technology, biomass energy, renewable energy rate, electric vehicles, and green material rate; (2) Continuous and Nationwide Implementation, where indicators should be systematically integrated across the country in a timely manner, and these include waste biomass, gasohol use rate, fatty acid methyl ester rate, and solar cell rate. Thus, this research has identified key new scenario policies and provides a foundation for forecasting and analyzing their effectiveness in reducing carbon dioxide emissions in the future.
4.4. Forecasting Model for CO2 Gas Emissions Using the PS–VMA–GARCHM–EnPoll Model
This research examines the performance of the PS–VMA–GARCHM–EnPoll model by evaluating MAPE (Mean Absolute Percentage Error) and RMSE (Root Mean Square Error). The model’s performance is compared against various previously established forecasting models, including the Multiple Regression Model (MR model), artificial neural network (ANN model), Anisotropy Factor Model (ANIF model), gray model (GM(1,1)), neural network model (NN model), ARIMA model, convolutional neural network (CNN model), and ARIMAX model. The statistical measures used in this research assess the accuracy and efficiency of the models. The results of the performance evaluation are presented in
Table 4 below.
Table 4 presents the performance evaluation of the PS–VMA–GARCHM–EnPoll model, which demonstrates the highest performance, as indicated by the lowest MAPE and RMSE values of 1.01% and 1.20%, respectively. The next-best-performing model is the ARIMAX model, with MAPE and RMSE values of 3.75% and 3.70%, respectively, followed by the Fuzzy model (MAPE: 3.92%, RMSE: 4.05%), the convolutional neural network (CNN) model (MAPE: 4.09%, RMSE: 4.59%), the ARIMA model (MAPE: 4.55%, RMSE: 4.91%), and the neural network (NN) model (MAPE: 4.78%, RMSE: 4.99%). The gray models (GM(1,1)) recorded MAPE and RMSE values of 5.01% and 5.72%, respectively, while the Anisotropy Factor (ANIF) model had values of 5.45% and 8.10%. The artificial neural network (ANN) model showed MAPE and RMSE values of 5.73% and 8.39%, and the Multiple Regression (MR) model had the lowest performance, with MAPE and RMSE values of 20.10% and 22.45%, respectively. These findings indicate that the PS–VMA–GARCHM–EnPoll model is the most suitable for long-term forecasting, specifically for the period 2025–2050, in alignment with Thailand’s carbon neutrality policy for 2050.
This research forecasts CO2 gas emissions in the energy and transport sector using the PS–VMA–GARCHM–EnPoll model, comparing scenarios where a new policy framework is implemented. The analysis aims to determine the percentage reduction in CO2 emissions if a new scenario policy is adopted.
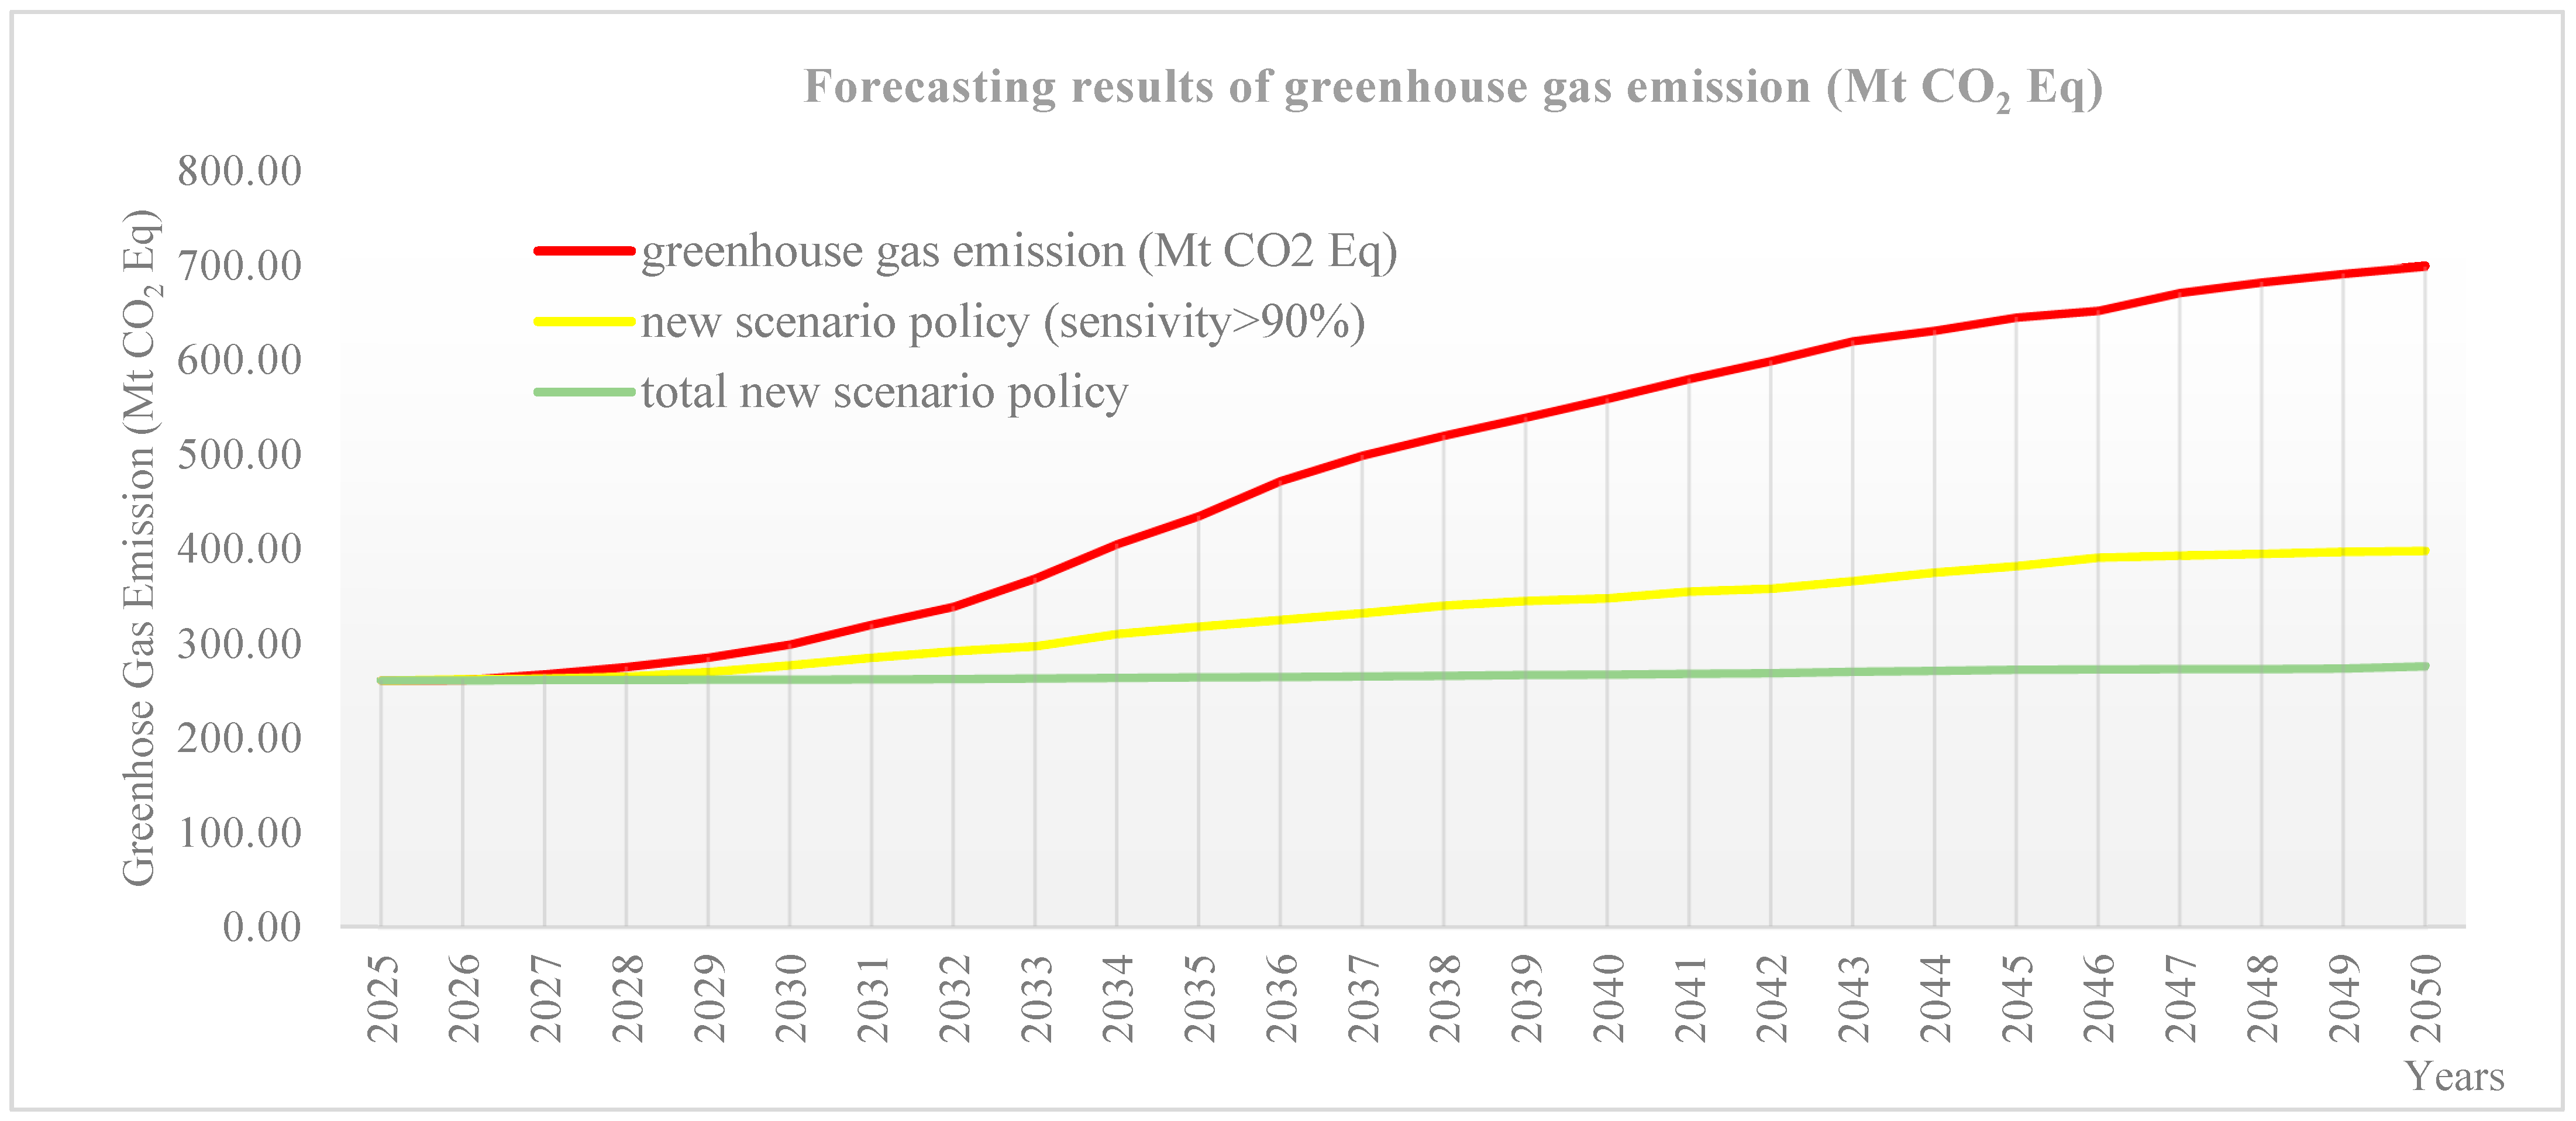
From
Figure 4, the long-term forecast (2025–2050) under Thailand’s carbon neutrality policy reveals a continuous rise in CO
2 emissions, with a growth rate of 168% (2050/2025). By 2050, CO
2 emissions are projected to reach 699.00 Mt CO2 Eq., exceeding Thailand’s carrying capacity limit of 450.07 Mt CO
2 Eq. Thailand has consistently implemented strategic policies to achieve carbon neutrality by 2050, requiring at least a 40% reduction in CO
2 emissions. However, historical data from 1992 to 2024 indicate a continuous rise in emissions, contradicting national policy objectives. This inefficiency highlights the necessity for a more effective strategy. To address this challenge, the PS–VMA–GARCHM–EnPoll model is utilized as a key strategic tool to optimize emission reduction efforts, aligning with carbon neutrality targets and ultimately achieving net-zero GHG emissions by 2065.
The analysis of two policy scenarios using the PS–VMA–GARCHM–EnPoll model demonstrates significant potential for reducing CO2 emissions. Scenario 1 focuses on high-sensitivity indicators (>90%), such as clean technology, renewable energy rate, biomass energy, electric vehicles, and green material rate. This approach achieves a 43.06% reduction in emissions, bringing 2050 levels down to 398.01 Mt CO2 Eq., aligning with Thailand’s 40% reduction target. For Scenario 1, the researcher has selected indicators with the highest sensitivity (above 90%), as these are the most critical for long-term strategic policy implementation. These indicators are particularly sensitive to policy adaptation and are essential for addressing past environmental mismanagement, which has resulted in ongoing environmental degradation. Therefore, the government must enforce this as an urgent policy measure. However, after the implementation of Scenario 1, further action is necessary to maximize effectiveness and enhance long-term greenhouse gas emission reduction capacity. To achieve this, it is essential to integrate additional indicators with at least 80% sensitivity. Scenario 2 builds on Scenario 1 by incorporating waste biomass, gasohol use rate, fatty acid methyl ester rate, and solar cell rate. This approach leads to a 60.65% reduction in emissions, lowering 2050 levels to 275.90 Mt CO2 Eq., which is below Thailand’s designated carrying capacity. This aligns with the national strategy to reduce CO2 emissions by at least 40% by 2050 and enhances the feasibility of achieving net-zero GHG emissions by 2065. For this study, the PS–VMA–GARCHM–EnPoll model was utilized. The model’s construct validity was tested by comparing a portion of the forecasted results with actual data. The evaluation of the square forecast error indicated that this model is highly suitable and reliable, making it applicable for use in other sectors in the future. Therefore, the PS–VMA–GARCHM–EnPoll model proves to be an effective tool for reducing greenhouse gas emissions in the future. However, it should be implemented alongside proactive policy measures to ensure a sustainable and appropriate transition toward long-term climate goals.
However, this study further examined construct validity by conducting a try-out with a sector other than the energy and transportation sectors, specifically the agriculture sector, as it is the next-largest contributor to greenhouse gas (GHG) emissions after these sectors. The findings from forecasting GHG emissions in the agriculture sector (2025–2050), under a new-scenario policy, indicate that emissions will continue to increase but at a declining rate, reaching 68.21 Mt CO2 Eq. with a growth rate of 10.05%, a value below the carrying capacity (not exceeding 101.25 Mt CO2 Eq.). Moreover, if the government manages the country using the selected indicators, GHG emissions in 2050 are projected to decrease by 30.95%, surpassing the government’s original reduction target of 20%. These findings confirm the validity of the PS–VMA–GARCHM–EnPoll model, both in terms of content validity and construct validity, demonstrating its suitability for policy and planning in Thailand. In the future, this model could also be applied to strategic planning in other countries by selecting appropriate country-specific indicators, ensuring maximum benefits in global sustainability efforts.
5. Discussion
Thailand’s national administration policy, guided by the Nationally Determined Contribution (NDC), has set the goal of achieving carbon neutrality under Smart City Thailand by 2050. This means that the amount of greenhouse gas (GHG) emissions released into the atmosphere must be equal to the amount removed. This goal is to be achieved through three key mechanisms: (1) Reducing greenhouse gas emissions by implementing various measures to control and minimize emissions; (2) Carbon removal from the atmosphere by increasing carbon sinks, such as afforestation and reforestation, which enhance the natural absorption of carbon dioxide; carbon capture and storage (CCS) technologies are additionally employed to sequester carbon underground or repurpose it for industrial use; and (3) Carbon credit offset by compensating for emissions through the purchase of carbon credits. Thailand aims to reach net-zero emissions by 2065, which means balancing human-induced emissions with removal efforts, without relying on carbon credit purchases for compensation.
However, implementing this plan in Thailand remains highly challenging due to the continuous rise in greenhouse gas emissions. Despite the government’s ongoing strategic efforts and policy measures, emission growth has not been effectively curbed. Over the years, Thailand has introduced numerous national energy and environmental plans, such as Alternative Energy Development Plan (AEDP 2015), Energy Efficiency Plan (EEP 2015), Power Development Plan (PDP 2015), Smart Grid Development Master Plan (2015), and Sustainable Transport Development and Climate Change Mitigation Master Plan. Despite these initiatives, past policies have largely failed to effectively address environmental issues. One prominent example is the carbon credit purchasing mechanism through forestry projects, particularly under the REDD mechanism (Reducing Emissions from Deforestation and Forest Degradation), which was influenced by international policies. The Thai government has used this mechanism to claim “carbon neutrality”, but, in reality, the approach has proven ineffective. The key issue is that the carbon ‘stored’ in trees is not equivalent to the carbon released from fossil fuel reserves, such as oil, gas, or coal. Once trees release carbon (through deforestation or degradation), the impact on the climate differs significantly from the emissions released from underground carbon reserves. Since the launch of the REDD program in 2014, the Thai government established the Thailand Voluntary Emission Reduction Program (T-VER), aiming to reduce greenhouse gas emissions by 40% by 2030, achieve carbon neutrality by 2050, and become a net-zero emissions country by 2065. A major shift in government policy has been the promotion of “green spaces” rather than natural forests. This approach incentivizes private companies to invest not only in reforestation projects but also in large-scale monoculture plantations, such as oil palm, eucalyptus, acacia, rubber, and teak. These companies gain carbon credits, allowing them to claim that they have offset their emissions. However, in the past decade, the expansion of industrial oil palm plantations has been one of the largest direct causes of deforestation in tropical regions worldwide, contributing significantly to carbon dioxide emissions. Currently, Thailand has approximately 1 million hectares of oil palm plantations, with plans for further expansion in the coming years. Furthermore, large-scale monoculture plantations have numerous negative environmental and social consequences, including massive land appropriation, leading to the displacement of local communities; ecosystem degradation, reducing biodiversity and soil fertility; and increased social conflicts, including forced evictions and land disputes. These issues highlight how current policies have not only failed but have also exacerbated environmental destruction, making the climate crisis even more severe. In fact, the country still faces significant limitations in its climate action efforts, particularly due to the lack of high-quality decision-making tools and effective mechanisms to drive policy implementation. Therefore, strengthening decision-support tools and operational frameworks is crucial to enhancing the effectiveness of Thailand’s greenhouse gas reduction initiatives.
From the findings of this research, valuable knowledge has been discovered, in that it can be used to develop an effective research tool. This, in turn, can help to guide Thailand toward managing its transition to Smart City Thailand in a sustainable and appropriate manner, particularly in the energy and transportation sectors, which are the largest contributors to greenhouse gas emissions. However, the research results indicate that Thailand’s national administration, from the past to the present, has not yet been able to achieve the future targets set, particularly the goal of carbon neutrality by 2050, which requires a 40% reduction in CO2 emissions. On the contrary, the data shows that CO2 emissions have been continuously increasing from 260.81 Mt CO2 Eq. in 2025 to 699.00 Mt CO2 Eq. in 2050, exceeding the country’s carrying capacity. The concept of carrying capacity is established to define the maximum pollution load that an environment can sustain without exceeding air quality standards. This ensures that the environment remains stable and free from harmful impacts. The carrying capacity serves as a benchmark and regulatory limit to prevent pollution concentration levels from surpassing legally defined environmental standards. In this study, the environmental threshold or safety factor is set at 90% of the standard limit. If pollution levels continue to rise beyond the carrying capacity, the environment will suffer irreversible damage. Such consequences may include severe flooding, which can devastate ecosystems and infrastructure; a loss of biodiversity, leading to mass extinction of species; and landslides, rendering areas uninhabitable. Ultimately, exceeding the carrying capacity poses a critical threat to environmental sustainability and human survival.
This research, therefore, aimed to identify key indicators to formulate strategic policies for reducing greenhouse gas emissions. The findings revealed two groups of new scenario policy indicators: (1) High-sensitivity indicators (above 90%), which include clean technology, renewable energy rate, biomass energy, electric vehicles, and green material rate, and these indicators alone could reduce CO
2 emissions by 43.06%, exceeding Thailand’s target; and (2) Indicators with at least 80% sensitivity, which could reduce CO
2 emissions by up to 60.65%, achieving a reduction greater than Thailand’s target and staying below the carrying capacity. The strategy for determining the new scenario policy in this study was developed under the sustainability policy, integrating economic, social, and environmental aspects simultaneously. This marks a clear departure from past approaches, which analyzed these factors separately, rendering them unsuitable for long-term national strategic planning. In contrast, this research adopts a holistic analysis that considers growth in all dimensions, with a particular emphasis on abatement capital. This study utilizes Marginal Abatement Cost Curve (MACC) analysis, a tool that provides a comprehensive overview of different technological options for reducing greenhouse gas emissions. It allows for a comparison between the environmental benefits of emission reduction and the financial costs incurred. Given limited budgets and natural resources alongside society’s unlimited demands, policies must be designed to maximize benefits across all dimensions while ensuring balanced growth. A concrete example of this analysis is the comparative prioritization of solar cell adoption versus LED light usage. The study found that the potential greenhouse gas reductions from using solar cells and LED lights are 700 tCO
2/year and 10 tCO
2/year, respectively. The corresponding abatement costs are −289.5 THB/CO
2 for solar cells and −1072 THB/CO
2 for LED lights. If the government adopts this approach in prioritizing policies, it will help to strategically direct greenhouse gas reduction efforts to meet the established targets efficiently. The research findings align with the hypotheses set in the study and are consistent with several previous studies, including those by Anan et al. [
43], Brzezinski et al. [
44], Wang et al. [
52], Ruangwicha and Tuamsuk [
61], Frikha et al. [
62], Christianides et al. [
63], and Subhani and Widiyanti [
64]
Recommendations: This research has developed the PS–VMA–GARCHM–EnPoll model, the first model designed to improve upon the weaknesses of previous models. It aims to assist government decision-making. Additionally, when the government or other stakeholders adopt this model, it is recommended to consider it alongside proactive measures to enhance its effectiveness and guide the country toward achieving net-zero greenhouse gas (GHG) emissions by 2065 or beyond. The following proactive measures are suggested to complement the model in this research:
Developing an Action Plan for GHG Reduction Measures: This is to assign primary responsibility for each GHG reduction measure to relevant agencies based on the national roadmap for GHG reduction to ensure the achievement of the set targets;
Raising Awareness and Understanding Across All Sectors: This is to increase the public awareness of the GHG reduction roadmap and the importance of emissions reduction to drive behavioral transformation. In fact, the success of GHG reduction efforts relies on cooperation across all sectors, beginning with public education on climate change, preparedness, and active participation in mitigation efforts. Nonetheless, that could be an acceleration to success by encouraging low-carbon lifestyles and sustainable development through strategic planning, infrastructure design, and policies that support energy-efficient buildings, public transportation connectivity, and plastic bag reduction;
Enhancing Public–Private Partnerships for GHG Reduction: This is to strengthen collaboration between the government and private sector to implement measures in line with the national roadmap and to ensure private sector involvement in implementation and performance monitoring, such as improving industrial energy efficiency, wastewater management, and technology upgrades. Furthermore, this requires systematic GHG emissions reporting to enable accurate government tracking and evaluation;
Enhancing GHG Reduction Tools and Mechanisms: This is to improve the financial mechanisms and allocate sufficient funding to support emissions reduction efforts;
Supporting Research and Development in Low-Carbon Technologies: This is achieved by promoting both public- and private-sector investment in technologies that significantly reduce GHG emissions, and developing and maintaining an updated technology roadmap to support decision-making at policy and organizational levels;
Implementing GHG Emission Standards and Product Labeling: This is to establish GHG emission standards to encourage consumer choices that favor low-emission products and services, while requiring businesses to comply with these standards, fostering competition and innovation to improve efficiency and reduce emissions;
Developing Smart Grid Networks: This is to invest in smart grid technology to optimize energy use and integrate renewable energy sources efficiently;
Reviewing and Amending Relevant Legislation: This is to conduct studies on legal frameworks and necessary amendments to support GHG reduction measures while ensuring the proper implementation and enforcement of emissions-reduction policies.
These recommendations, when implemented alongside the PS–VMA–GARCHM–EnPoll model, will contribute to a more comprehensive and effective strategy for achieving net-zero emissions and ensuring sustainable development.
Limitations: The administration of Thailand under the Smart City Thailand policy to achieve carbon neutrality is highly unlikely to succeed if the country lacks essential decision-making tools, as seen in the past. Without transformative changes in people’s lifestyles and active public participation, Thailand will struggle to reach this goal. Additionally, Thailand faces a lack of supportive environmental laws, and existing legal frameworks are not effectively enforced. As a result, environmental conservation is not prioritized by the general public. In other words, for Thailand to achieve sustainable development, a new governance framework is necessary. This includes transforming the government into a smart government, empowering society to become a Smart Society, and revamping the economy into a Smart Economy. These transformations must occur simultaneously. If the government allows Thailand to continue its current trajectory, the country will face severe consequences in the future. Furthermore, ignoring or failing to acknowledge the continuous rise in greenhouse gas emissions will prevent any meaningful progress in tackling the issue. Ultimately, all policies and efforts to achieve carbon neutrality will fail if these fundamental changes are not addressed. In fact, to ensure the long-term efficiency and effectiveness, i.e., for the successful application of the indicators from this research in shaping new scenario policies, it is crucial that the government ensures continuous and concrete implementation. One of the most significant and influential challenges in Thailand is public participation. There is a need to shift public perception, fostering an understanding that the environment is a personal asset rather than merely a public good. In the past, environmental concerns were largely neglected by the Thai population, in stark contrast to countries such as Japan and others. For example, in terms of waste biomass management, Thailand has never implemented adequate regulatory measures. Similarly, the adoption of clean technology by both private and public organizations lacks strict enforcement and concrete policies, with numerous discrepancies between actual practices and official regulations. Addressing these issues would significantly enhance the effectiveness of using indicators. For the private sector, the government must impose strict oversight, and those who violate regulations should face rigorous legal consequences.
Additionally, the government must carefully consider international cooperation within the framework of the United Nations Framework Convention on Climate Change (UNFCCC). This serves as a global platform for establishing rules and strategies to address climate change issues and mitigate its impacts. The Conference of the Parties (COP) under the UNFCCC has progressively strengthened climate policies, requiring all countries to set short-term and long-term greenhouse gas reduction targets. Each country must submit a Nationally Determined Contribution (NDC) every five years and develop a Long-term Low Greenhouse Gas Emission Development Strategy (LT-LEDS) to limit global temperature increases to 2 °C or, preferably, 1.5 °C, preventing severe climate-related consequences. Thailand, therefore, must ensure that its reports and progress reflect actual and verifiable results.
In fact, to ensure the long-term efficiency and effectiveness of applying the PS–VMA–GARCHM–EnPoll model, it is crucial that users fully understand the proper methodology for constructing the model in strict accordance with fundamental principles. One of the most critical aspects is addressing the issue of spurious relationships, which was often overlooked in past models. However, this research places significant emphasis on this issue, as mitigating spurious correlations greatly reduces errors and prevents misguided policy directions, which were common in previous applications. Past models failed to adequately address this concern, leading to issues such as heteroscedasticity, multicollinearity, and autocorrelation. These problems indicate that the models lacked validity, and their application resulted in highly flawed policy decisions at the national level.
6. Conclusions
For this research, the PS–VMA–GARCHM–EnPoll model was developed using three factors, which are latent variables: pollution-generating capital , abatement capital , and effective labor . All selected indicators were required to be stationary at first difference to ensure suitability. Additionally, in testing the adjustment speed toward equilibrium, it was found that indicators in the abatement capital sector adjusted to equilibrium the fastest, followed by pollution-generating capital and effective labor , at a significance level of α = 0.01. Hence, these findings indicate that the government must formulate long-term strategic policies by selecting indicators with the fastest equilibrium adjustment capability to guide national management. Failure to consider this aspect may lead to inappropriate indicator selection, potentially resulting in policy failures similar to those experienced in the past.
The analysis from the PS–VMA–GARCHM–EnPoll model indicates that abatement capital acts as a moderator, influencing the changes in relationship pathways. It was found that abatement capital alters the influence of relationships across different sectors. Specifically, abatement capital has the highest direct effect on pollution-generating capital in the opposite direction at a statistically significant level of . Secondly, abatement capital has a direct effect on effective labor in the same direction, also at a statistically significant level of . Meanwhile, pollution-generating capital has a direct effect on effective labor , but with a decreasing magnitude of influence in the same direction at a statistically significant level of . Similarly, effective labor has a direct effect on pollution-generating capital , but with a decreasing magnitude of influence in the same direction at a statistically significant level of .
From these findings, it is concluded that the government should formulate a new scenario policy using indicators from the abatement capital sector, as it exerts the highest influence and drives changes across other sectors. If the government regulates and controls this sector, this will maximize efficiency, as it can deliver tangible results at the fastest rate. For example, if the government mandates the use of green materials for all citizens and strictly enforces this policy across all business entities nationwide, this can be immediately established as a national strategy and enforced without delay. As a result, businesses and individuals would be able to swiftly adapt to using green materials in their daily lives. This policy would significantly reduce greenhouse gas emissions, particularly harmful substances, such as chlorofluorocarbons (N.), which contain chlorine, fluorine, and carbon dioxide, among others. Conversely, indicators from the effective labor and pollution-generating capital sectors should not be used, as their influence on change is weaker and they do not act as moderators.
To determine the most effective new scenario policy for long-term national strategy, a sensitivity analysis has been conducted, which categorized the policies into two levels: (1) Urgent and immediately necessary policies, consisting of indicators with sensitivity above 90%, including clean technology, biomass energy, renewable energy rate, electric vehicles, and green material rate; and (2) Policies requiring sustained implementation to achieve nationwide coverage in a short period, including waste biomass, gasohol use rate, fatty acid methyl ester rate, and solar cell rate. Thus, forecasting the long-term growth rate of CO2 gas emissions over the next 26 years (2025–2050) under Thailand’s carbon neutrality policy, which has been set as a national strategy, reveals that CO2 gas emissions will continue to increase. The projected growth rate is 168% (2050/2025), with total CO2 gas emissions reaching 699.00 Mt CO2 Eq. (2025–2050), which exceeds the carrying capacity set at 450.07 Mt CO2 Eq.
To address this, the PS–VMA–GARCHM–EnPoll model has been applied, dividing the research into two approaches. In the first approach, a new scenario policy was designed using indicators with sensitivity above 90%, including clean technology, renewable energy rate, biomass energy, electric vehicles, and green material rate. The findings indicate that this approach would reduce CO2 gas emissions by 43.06%, bringing it below Thailand’s carrying capacity and aligning with the national strategic goal of reducing CO2 emissions by at least 40% by 2050. In the second approach, an extended analysis was conducted by incorporating all indicators with a sensitivity of at least 80%, including clean technology, renewable energy rate, biomass energy, electric vehicles, green material rate, waste biomass, gasohol use rate, fatty acid methyl ester rate, and solar cell rate. This approach would result in a 60.65% reduction in CO2 gas emissions, with projected CO2 emissions in 2050 at 275.90 Mt CO2 Eq.
In a nutshell, the PS–VMA–GARCHM–EnPoll model has demonstrated its effectiveness as a key tool for national policy planning and strategy formulation, enabling efficient and sustainable reductions in greenhouse gas emissions in the future.


 ,
, 
