Abstract
With the intensification of armed conflicts driven by regional incentives, global geopolitical conflicts are becoming increasingly intense. In addition, the possibility of another financial crisis is approaching, and global inflation is rapidly rising. As a result, Europe and the United States must restart coal-fired power generation to cope with energy shortages and delay carbon neutrality goals. However, the current political and public opinion about the environment has led to a one-sided exaggeration and political criticism of China’s carbon emissions, resulting in China’s contribution to carbon neutrality being intentionally or unintentionally ignored. The uncertainty surrounding future low-carbon policies has made climate observers increasingly concerned about the threat of environmental degradation to fragile intergovernmental decarbonization efforts. This article aims to clarify the one-sided view of China’s carbon emissions internationally, clarify China’s measurement indicators for carbon emissions, analyze China’s advantages in responding to the global warming crisis under complex historical and political conditions, summarize China’s efforts to achieve its dual carbon goals in the current situation, and thus summarize China’s unique and absolute advantages in cooperation in clean energy, energy storage, and ultra-high voltage transmission networks that are beneficial to global climate change. This will clarify the truth regarding China’s carbon emissions in the global context and boost global confidence in addressing climate change.
1. Complicit Context of Geopolitical Circumstance
Since the 1980s, the rate of warming has significantly accelerated. Since the beginning of the 21st century, the impacts of climate change have become more severe, making it a focal point of global concern. Since its inception, international cooperation in addressing global climate change has not been a single scientific decision-making event but has been intertwined with disputes related to geopolitical polarization, interest distribution, and neutralization dominance and disputes over industrial development rights. These disputes can be seen from the debates among the participants in the Conference of the Parties (COP) in recent years on the obligations of developed countries in providing financial assistance to underdeveloped countries and implementation ratios, retrospection on historical emissions in response to climate change, and total emissions and per capita emissions.
As the US government withdrew from the Paris Agreement during the first Trump administration in 2017, global public opinion expressed great uneasiness about this and, to a certain extent, doubt regarding the enforceability of the agreement. After the US’s return to the Paris Pact in 2021, tensions over climate change appeared to ease. However, increasingly complex international geopolitics has made it more difficult to address climate change. As President Trump entered his second term in office January 2025 and has withdrawn from Paris Agreement again, more and more climate experts are concerned about the impact on climate change, particularly due to the uncertainty surrounding the US government’s carbon emission policy and the world’s second largest carbon emitter—any major changes will affect the direction of the global climate crisis.
If individual countries maintain a biased position and restrict photovoltaic (PV) and wind power products, global efforts to cooperate on climate warming will be frustrated, causing an irreversible deterioration in the situation. Experts are calling on individual countries to immediately put aside their extreme positions and cooperate with all parties in China to respond to the further deterioration of the climate with the current best photovoltaic technology with low cost.
Global-scale inflation emerged in both developed and developing countries a couple of years prior and is now impacting all states’ strategic plans against global warming. Additionally, the COVID-19 pandemic has constrained not only industrial production capacity but also investment in and the construction of carbon-free infrastructure.
As a byproduct of the Russia–Ukraine conflict, more than 15 million tons of CO2 equivalent was emitted into the atmosphere after the explosion of the Nord Streams natural gas transmission lines [1]. This emission almost offset the total carbon reduction (16 million tons) achieved by Alibaba Group’s Ant Forest project during 2016~2022 [2].
Post-cold-war conflict still forms part of observers’ research theories and is subject to non-disclosure from governmental declaration. However, analysts have stated that a new cold-war pattern started in 2018 when the Trump administration imposed tariffs on Chinese imports. This post-cold-war decision both hit the pockets of US civilians and undermined market confidence. The Biden administration’s policy of decoupling the entire industrial chain to “a small courtyard with high walls” has intensified the Sino–US conflict as well as hindering the mutual collaboration between China and the US government on vital climate decisions. As Donald Trump takes his second term into office, the conflict is being intensified. As a result, the transparent dialog between senior carbon reduction officials from China and the United States has been suspended, which has disrupted the cooperation between the two largest carbon-emitting countries. The impact on global carbon reduction efforts is bound to be extremely serious.
The controversial disagreements between developed and developing countries on major obligations regarding carbon neutralization have been confronted from the very beginning of the IPCC meeting on climate change in the 20th century, and there remains an ever-urgent need for compromise and consolidated technical and capital support for an applicable planet-scale solution to address global warming.
The conflict and imbalance between developed and developing countries still hugely disrupts fundamental manufacturing and results in extra costs in carbon neutralization. To date, developed countries have neither fulfilled their obligations to take the lead in emission reduction nor honored their promise to provide financial and technological support to developing countries [3]. The fact that technology and funding will affect the green transformation policies of developing countries has also attracted the attention of countries in the global South. Even at the COP29 summit, this funding has reached USD 300 billion per year, but the proportion of grants and the details of funding implementation have not been reflected in detail [4].
The public has been shocked by the above contexts and the conflicts within major entities globally. The feasibility of preventing average temperatures rising more than 1.5~2.0 degrees above pre-industrial revolution levels is of increasing concern, and the failure to reach a solution is destroying the confidence of the public.
This article tries to collect an amount of literature in order to summarize what kind of transformative advantages China has demonstrated in the context of the global improvement of climate change policies and under complex geopolitical conditions, as well as how to increase China’s confidence in the global response to climate change.
2. Objective Carbon Emissions Assessment
Before entering a discussion on the enablers of China’s fight against climate change, this article spends several paragraphs depicting evaluation criteria for China’s carbon emission from a global perspective.
The discussion of the objective carbon emissions generated by sovereign countries should not be dictated by the unique assessment of their contribution to the carbon crisis of our planet, but rather should be comprehensively considered from more perspectives, such as historical cumulative emissions, the carbon embedded in export products, and per capita carbon emissions. Since 2006, China, for example, has replaced the United States as the world’s largest carbon emitter, and its emissions are rapidly increasing [5], which has led to widespread concerns globally, as well as in China’s public opinion. However, it is undeniable that China has gradually become the world’s largest provider of manufactured goods and services over the past 30 years, while making significant contributions in clean energy, energy conservation, and carbon reduction at the same period.
Historical emissions. Research shows that CO2 in the atmosphere has exerted its greenhouse effect around the planet for at least 300 years [6,7], and the anthropogenic impact on climate change did not start in contemporary times but began from the beginning of civilization. However, the significant impact on global climate change began with the Industrial Revolution. Before the 21st century, the countries and organizations that emitted huge amounts of carbon into the atmosphere were undoubtedly the United States and European countries. Research and statistics from multiple organizations have painted a clear picture clarifying that, despite their rise and fall in the past 150 years, the great powers—the UK, the EU, the USA, the USSR, Japan, Canada, and Australia—contributed 60.1% of CO2 emissions up to 2021 (refer to Figure 1, same as below) due to unrestricted industrial booms together with CO2 emissions [8]. Historically, China contributes quite a small proportion of anthropogenic emissions (12.7%).
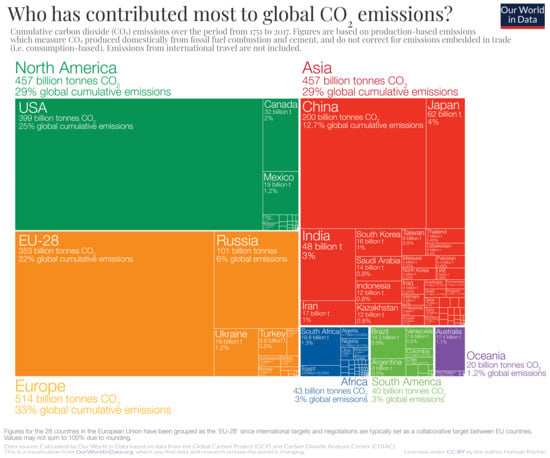
Figure 1.
Cumulative share of historical fossil CO2; source: Our World in Data. China cumulatively contributed 12.7% of carbon emission and is almost a half of USA.
It is a well-known truth that carbon emissions implicate energy consumption, then industrial production, and, finally, the development of the nation’s economy. When curbing global warming and reducing carbon emissions, it is even more important to consider the survival rights of the people, the development rights of the country, and especially the development rights of developing countries. The resolutions of the Global Climate Summit have always required developed countries after the industrial revolution to provide financial and technical assistance to underdeveloped countries, which is also based on this principle.
Carbon embedded in products. When discussing carbon emissions, researchers should consider the principle that whoever consumes is responsible, not only the production base.
Since the beginning of the globalization trend, developed countries have gradually relocated low-end, high-energy-consuming, highly polluting, and high-carbon-emission industries from Europe and the United States to Japan, South Korea, Singapore, and then to China, leaving only high-value-added, high-tech, and high-profit industries in developed countries. This has caused receiving countries to not only be exploited by developed countries, but also to bear the burden of pollution and high carbon emissions. Although this is an unavoidable development path for underdeveloped countries, it is biased to simply blame developing countries, such as China, from a purely carbon emission-based perspective. With the increasing depth of globalization, the production capacity of developed countries such as European countries and the United States is gradually shifting regionally. As a result, more and more industrial products and daily consumer goods are being produced by developing countries, among which China is a leader. In 2013, China became the world’s largest trading country, accounting for 14.4% of global trade in 2024, reaching USD 6.16 trillion and occupying the world’s top position for 10 consecutive years [9].
Peters et al. developed a detailed model to calculate consumer-based carbon emissions and analyzed the carbon emissions of embedded products in major regions [10]. Based on intuition, China established itself as the largest product provider in 2011. The net CO2 export from China was 1.077 GT vs. a total emission of 9.78 GT (making the net export 11%). In 2011, 128 million tons of CO2 were exported from China to the rest of the world, especially to the United States and members of the European Union. As shown in Figure 2, China was a great exporter of embedded CO2 on a large scale, ahead of the EU, the USA, and Oceania countries. The top 12 inter-regional flows of fossil fuel carbon embodied in trade from extracting region to producing region are broken down by primary fuel type and disaggregated further to highlight key countries.
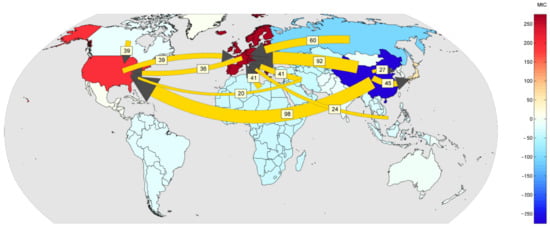
Figure 2.
The 12 largest inter-regional flows of carbon embodied in trade, from the origin of emissions to the region of final consumption, with the key regions disaggregated (2004). The largest single inter-regional flow is from China to the USA (98 MtC). These 12 flows account for 40% of all inter-regional flows using this grouping. Note: Numbers in the above figure is Carbon embodied through regional trade, unit in MtC.
As shown in Figure 3, which presents data organized by the Global Carbon Project (GCP) and processed by Our World in Data, China’s percentage of carbon embedded in product exports reached 20.6% in 2006 and remained at this figure until 2008. The proportion then showed a general upward trend, reaching 8.9% in 2022 [11]. The increase during this period can be roughly attributed to the following reasons: (1) China started clean energy projects and measures to reduce emissions per unit of GDP in 2005; (2) China’s proportion of primary energy has been greatly reduced with the rapid development of low-carbon energy such as hydropower, PV power, wind power generation, and nuclear power; therefore, the proportion of coal-fired thermal power generation has been effectively reduced, and (3) although China’s export output value continued to rise during this period as shown in Figure 4 [12], China’s domestic GDP grew faster. Although the domestic demand-oriented economy has rapidly increased the total amount of carbon emissions embedded in exports, domestic demand consumption has grown even faster.
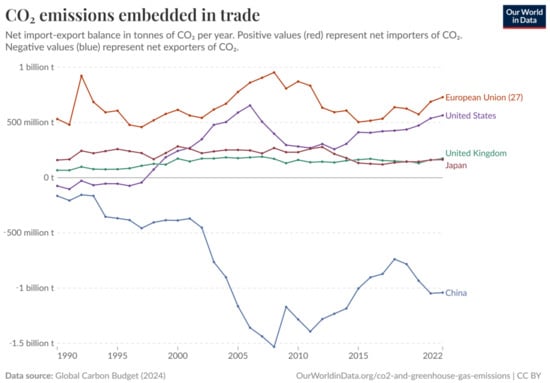
Figure 3.
CO2 embedded in export products 2002~2022. Note: Since the 2008 financial tsunami, China’s exports (embedded product carbon) have experienced a continuous decline from 2011 to 2019 and have shown linear growth due to the rapid recovery from the COVID-19 epidemic. During the same period, the EU, the United States, and Japan have become pure import countries by means of embedded carbon in products.
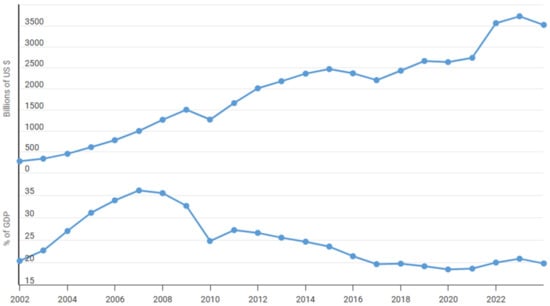
Figure 4.
China export revenue and percentage of GDP, 2002~2024. Note: China’s total exports have been growing rapidly since 2002 and have shown astonishing growth in the rapid recovery from COVID-19; however, their share of GDP has been almost on a downward trend as China’s overall GDP has grown rapidly.
Since 2011, China’s export volume has maintained a continuous increase trend, from USD 2.0 billion in 2011 to USD 3.71 billion in 2022, an increase of 85.5% (please refer to Figure 4). Although the total export volume has increased rapidly, with the increase in China’s carbon reduction measures since the 21st century, the overall amount embedded in export products has shown a decreasing trend and will still reach 1.02 billion tons in 2022 [13]. From a global perspective, except for the regions where agricultural and forestry products are mainly exported in Africa and South America, China plays an absolute leading role in global embedded products, contributing an irreplaceable advantage to the carbon flow of products around the world. As developed Western countries enjoy the convenience of these products, they should also assume responsibility for the carbon emissions of these products; 104 million tons of CO2 was generated from the manufacture of products in China (2021) that were consumed by the West.
Emissions per capita. When justifying carbon emissions, the country’s overall carbon emissions are one dimension; per capita carbon emissions are another dimension with more practical meaning. The per capita carbon emissions reflect both the country’s overall carbon emissions and the country’s economic competency. Currently, the United States and China, the world’s top two economies, have completely different per capita carbon emission indicators: although China’s overall carbon emissions reached 11.4 billion tons in 2022 and the United States’ was 5.06 billion tons in the same period [14], we must consider the huge difference in population size between the two countries. The per capita carbon emissions were 7.99 and 14.95 tons, respectively, which does not take into account the 1.6 and 0.9 tons of per capita embedded product transfers between China and the United States (please refer to Table 1). It can be seen that the per capita carbon emissions based on the consumer end of the United States are 2.4 times those of China. This difference reflects the imbalance in carbon emissions. When discussing carbon emissions, per capita carbon emissions, especially emissions from the consumer end, have more universal significance for equality for all.

Table 1.
Comparison scenarios for CO2 emissions from China vs. the United States: 2022.
To summarize, when judging a country or region’s carbon emissions, overall carbon emissions are not the only criterion. Instead, we should consider historical cumulative carbon emissions and make balanced considerations, taking into account consumer-side carbon emissions and per capita carbon emissions.
Regarding the second question, what power does China have to benefit the climate change situation on this planet on which human beings are reliant? Regarding China’s pledge to achieve a carbon peak by 2030 and neutralization by 2060, what have the major developments since 2020 been?
3. Clean Energy
Clean energy generated from low-carbon sources and value streams such as wind, solar, hydro, and nuclear power is better for the planet, as it releases less carbon into the atmosphere compared with coal fires or fossil fuels. Investments in renewable energy are time-consuming, expensive, and long-term projects that need not only capital support but also full-scale strategy encouragement and engagement. China shows a leading edge in solar energy (photovoltaic), wind energy, hydro power, and nuclear power [15].
3.1. Hydropower and Hydroelectric Power
The application and construction of large-scale hydropower energy gradually increased and enriched only after the founding of the People’s Republic of China. Especially since reform and opening up, the utilization and scale of hydropower resources have gradually occupied a leading position in the world. Important milestones include the development and construction of the Gezhouba Hydropower Station and the Three Gorges (Sanxia) Hydropower Station on the Changjiang River, followed by Baihetan Dam. With the deepening of reform and development, there is an urgent demand for electricity resources, and the development of hydropower resources has made significant progress since the 21st century [16].
China accelerated its hydropower construction from the 1990s, achieving a total capacity of 391 GW in 2022, ranking it first in hydropower utilization; the total electricity generated in 2022 was 1340 TWh [17]. In 2022, China added over 15 GW to its conventional hydropower capacity and a further 8.7 GW to its hydraulic power station capacity. China continues to lead in terms of capacity additions, with 24 GW added in 2022, equal to three-quarters of all global growth. Hydropower remains an important part of the 14th Five-Year Plan for Renewable Energy released in 2022.
As shown in Table 2, China accounts for four of the top seven hydropower stations in the world by installed capacity [18], accounting for 64% of the total installed capacity in the world. China has an absolute advantage in the construction of large-scale hydropower stations.

Table 2.
Top 7 hydroelectricity stations with capacities larger than 10 GW worldwide.
As shown in Figure 5, China’s hydropower showed stable growth in power generation before the 21st century. Since the Three Gorges Generator Unit started generating electricity in July 2003, China’s hydropower has entered a period of rapid growth, peaking at 1322 TWh in 2020. Affected by climate and rainfall, it fell to 1245 TWh in 2023. This has far exceeded the hydropower generation in other major water conservancy countries globally, including Brazil, which covers most of the Amazon River Basin [18].
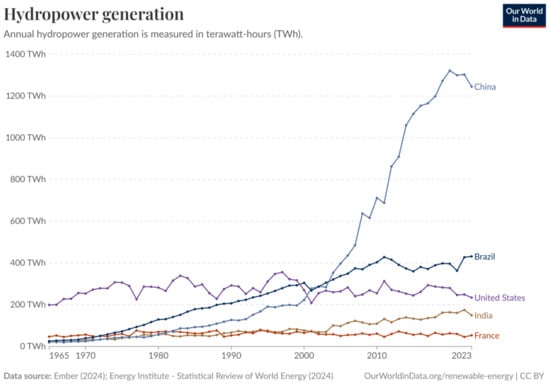
Figure 5.
Hydropower generation growth in the main countries and regions.
These achievements are undoubtedly because of the decision-making and execution capabilities of the Chinese government. However, cost control is also key to whether hydropower facilities can be quickly invested in and constructed. In terms of hydropower cost control, China has demonstrated a huge advantage over other major countries in the world. Figure 6a presents the investment costs of hydropower projects by country. The development of greenfield sites tends to be more expensive and typically ranges from 1000 to 3500 USD/kW in cost [19]. The median investment in hydropower facilities in China is only 60% of that in India and 50% of that in other Asian countries. The cost of hydropower varies within countries and between countries depending on the resource available, site-specific considerations, the cost structure of the local economy, etc., which explains the wide cost bands for hydropower. The lowest investment costs are typically associated with adding capacity at existing hydropower schemes or capturing energy from existing dams that do not have any hydropower facilities. This huge investment advantage has brought the profit expectations of China’s hydropower construction closer.
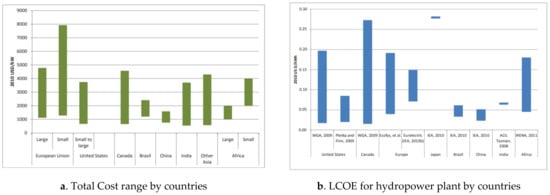
Figure 6.
Total installed hydropower cost ranges and levelized cost of electricity (LCOE) for hydropower plants by country and region; comparison based on the Irena report, 2010. Note: the assumptions on capital costs, capacity factors, O&M costs, lifetimes, and discount rates differ [19,20,21].
On another note, a brief review of the levelized cost of energy (LCOE) ranges for hydropower in countries with the largest installed capacities for hydropower is revealing. At the best sites, the LCOE of hydro is very competitive and among the lowest cost generation options available. However, the majority of (though not all) new developments are in less optimal sites compared to existing hydropower schemes. The average LCOE of new developments is more likely to fall somewhere in the middle of the estimated LCOE range presented in Figure 6b [19]. China’s LCOE for the daily operation and maintenance of hydropower is also the lowest among major global entities, and this advantage makes it difficult for later countries to surpass it in the short term.
Considering its absolute advantage in Capex costs and LCOE, China’s advantage in hydropower construction is unparalleled globally. This advantage has enabled China to occupy a favorable position in hydropower investment, operation, and profitability in the past 40 years, and this advantage will not be surpassed in the short term in the near future. Because of this, China’s government is inclined to invest more in hydropower than other governments.
Although China’s installed hydropower capacity has grown tremendously over the past 40 years, becoming one of the great engines of China’s economic prosperity, the Chinese government has become increasingly cautious in investing in hydropower projects, as available and profitable hydropower resources are increasingly scarce; moreover, the potential damage to biodiversity or fragile ecological environments must be considered. However, with the investment in environmental protection and the upgrading of biodiversity protection technology, more available hydropower investment projects will emerge in new locations. The National Energy Administration of China published their mid-term and long-term plans from 2021 to 2035 for pumped storage hydropower (PSH) development, which would see an installed PSH capacity of at least 62 GW in 2025 and around 120 GW in 2030, up from the present 44.7 GW [22]. By then, China will be playing a leading role irrespective of the installed capacity or generation quantity.
3.2. Solar Energy/Photovoltaic
Globally, to achieve the goal of carbon neutrality by 2050 as stipulated in the Paris Agreement, the best carbon reduction solutions in primary energy are wind and photovoltaic generation.
Commercial concentrated photovoltaic plants were first developed in the 1980s. However, both the Capex and LCOE far exceeded the cost of hydroelectricity and coal electricity in the same period, which made the investors unoptimistic about the industry. As the cost of solar electricity has fallen, mainly due to China PV providers’ tremendous contributions, the number of grid-connected PV systems has grown into the millions and gigawatt-scale solar power stations are being built. Many solar photovoltaic power stations have been built, mainly in Europe, China, and the United States. After the Kyoto Protocol in 1997, the EU boosted its great efforts toward a carbon neutral route on a global scale. This has resulted in increasing demand for PV systems in EU countries, with Germany and Spain leading [23].
Since the 21st century, Chinese photovoltaic companies have invested a lot of money, talents and technology accumulation in the photovoltaic market with huge potential, especially in the global market.. China’s government switched its PV policy to being export-oriented during the period from 2004 to 2008. This proved successful, with the technology being utilized outside China and being a great market driver outside China, as showed in Figure 7. This pattern built the China PV industry with both technological and capital accumulation. There is no doubt that China’s photovoltaic technology development and cost control have become an advantage that European and American countries cannot surpass, and photovoltaic power will become a major part of renewable energy by 2050. Under Western governments’ imposed tariffs, Chinese solar products continued to be indispensable and dominate due to not only their price but also their comprehensive technology. The imposed tariffs failed to stop the increase in the rate of export from China; in the first half of 2023, the exports of solar panels from China grew by 34%, with 114 GW shipped worldwide [24] (please refer to Figure 8). However, after 2011, both the USA and EU realized that their domestic providers failed to compete with China’s competitors on cost, lead time of development, service, quality, and, finally, on the technology [24]. On 21 March 2012, the US imposed tariffs on solar panels from China [25]; on 4 June 2013, the EU imposed provisional extreme anti-dumping duties on Chinese solar panels [26]. Starting from 2013, a rapid increase was shown with extremely rapid growth, while the government alternated its stance to seize the opportunity at the global scale to become the technological and economic leader by looking into low-carbon energy production. As a result, China invested heavily in green industries and technologies to become a significant player in the PV industry on a global scale. Local governments also seized the opportunity due to the central government’s support for clean energy, which facilitated the growth of local PV industries. After rounds of policy incentives and forward pushing in both cost and technology innovation, China’s PV providers show overwhelming power in terms of market dominance. Photovoltaics grew the fastest in China between 2016 and 2021, with 560 GW of capacity addition, more than that in all the advanced economies combined (please refer to Figure 8) [27].
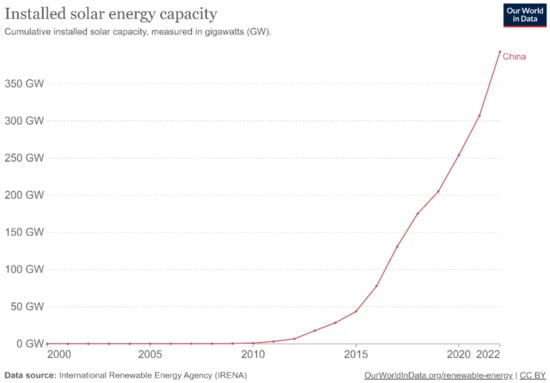
Figure 7.
Solar power generation growth in China.
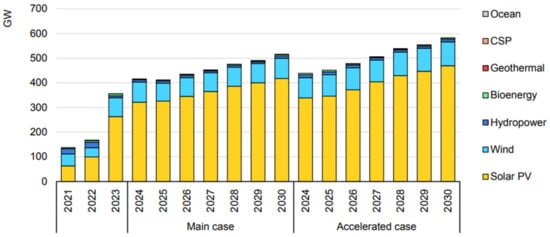
Figure 8.
China renewable capacity additions by technology, 2021–2030: IEA.
Altogether, the advantages of China’s photovoltaic equipment manufacturing industry lie in the following points: flexible industrial support policies, active innovation genes, a complete supply chain, and proactive practitioners. Therefore, China’s photovoltaic industry achieved industry profitability as quickly as possible in the infant stages of entrepreneurship, achieved localization in the entire supply chain, maintained sufficient flexibility and resilience in the face of international uncertainty, and competed in the global market, showing full technical advantages, cost advantages, and short development cycle advantages. Whether Western competitors are willing or not, people must admit that the China PV industry is a partner who cannot be ignored (and possibly the only one) and that can achieve the extremely ambitious target of CNZ by 2050. Per International Energy Agency (IEA) forecasting, China’s renewable energy capacity is expected to expand almost 3207 GW and annual additions are anticipated to reach more than 500 GW in 2030. Among the above, Solar PV is alone accounting for 80% of the increase. China’s renewable capacity expansion is far exceeding government goals and ambitions, with the country surpassing its 1200-GW solar PV and wind ambition for 2030 six years early in July 2024 [19].
3.3. Wind Energy
As with PV power, there were hardly any wind energy installations in China prior to the 21st century, and much less electricity was generated by 2010, mainly due to the complexity of the technique, the investment cost, and dependence on market demand. The increased demand from the market due to environmental improvement urged the relevant entities to prioritize R&D for wind turbines and corresponding areas. At the same time, the increased risk to energy security due to the decoupling potential has pushed the Chinese government to consider energy security and diversity as among the key solutions to satisfy the exponential growth of manufacturing’s demand for primary energy, especially in the PV and wind energy areas. The significant growth rate has been observed in China since 2010, with increasing demand for electricity, pressure from green environmental protection requirements, and global warming leading to the vigorous development of the Chinese government’s projects and even the entire wind power industry. At the same time, under the premise of green industry demand, Europe transferred some wind power equipment assembly, processing, and even design capabilities to relevant Chinese companies in order to reduce the cost of wind power generation facilities on shore. China seized this golden opportunity; attracted patents, technologies, and equipment; and, with the support of relevant policies, realized the transformation of the intellectual property rights of a full set of wind power generation equipment and achieved the supporting construction of the entire industrial chain, thus giving China’s wind power generation strong competitive advantages in both cost and technology in the world.
After a solemn pledge during the UN General Assembly in September 2020, the contribution of new installations dramatically increased to almost 60% during 2020~2023, as shown in Table 3. The data show that China’s new installation capacity accounted for 65% of the global new installation capacity in 2020 and 2023 world (Figure 9). Although only 47 GW and 37 GW were installed in 2021 and 2022 due to the COVID-19 pandemic, on a global scale, China’s share of this newly installed capacity dominated at around 50% [28].

Table 3.
New installation of capacity in China during 2020~2023.
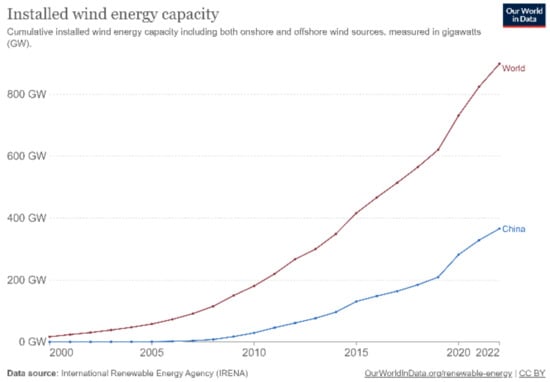
Figure 9.
Wind electricity capacity after 2000, compared with worldwide scale. Note: the evolution curve is shown in Figure 9, with a rather slow rate of increase even after 2000, compared with the worldwide trend, which was mainly driven by European countries.
In 2023, more than 15 wind turbine manufacturers were active in China. Although the domestic market is large, competition has become increasingly fierce, with record-low prices being reported in the past two years. To survive in the domestic price war, Chinese wind power OEMs started exploring opportunities overseas [28].
Global Wind Energy Council (GWEC) Market Intelligence has been monitoring the supply chain for key wind turbine components since 2019. Based on the latest supply chain update, no bottlenecks are expected in 2023–2024 for key components such as blades and generators; however, further investment in both components is needed to accommodate growth [28]. It is also important to note that the supply chain for key components is highly dependent on China, as shown in Figure 10. In addition to gearboxes and generators, China controls the global supply chain for castings, forgings, slewing bearings, towers, and flanges, with a global market share exceeding 70% [28].
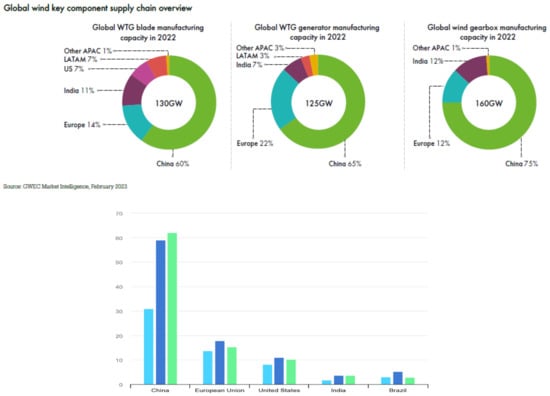
Figure 10.
Net onshore wind electricity capacity additions by country or region, 2022–2024. Note: The color in light blue is addition in 2022, Deep blue is addition in 2023, Yellow is 2024.
In February 2023, the China National Energy Administration (NEA) predicted that generated wind and solar power would double by 2025 [28]. China will continue to lead global wind power development following its ‘30–60’ pledge; moreover, the Chinese government committed to non-fossil fuels, providing 25% of the country’s primary energy mix by 2030.
China is a country with a vast land area of 9.6 million km2 and 3.18 million km2 of marine area, which indicates more opportunities to invest; the technically exploitable capacity for onshore and offshore wind energy is 609.99 GW [28]. China’s wind power development trend remains strong, and the expected development market is still very optimistic. Although the annual installed capacity currently accounts for half of the world’s total, China’s installed wind power capacity will continue to grow in the foreseeable future, both domestically and globally. It is believed that Chinese wind power equipment suppliers will provide high-quality, low-cost solutions covering the entire industry chain for the global response to climate warming.
3.4. Nuclear Energy
The first pressurized water reactor (PWR) power plants were connected to the grid in 1994: the Qinshan Nuclear Power Plant in Zhejiang and the Dayawan Nuclear Power Plant in Guangdong [29,30]. Regarding these two nuclear power plants, China designed them and imported key components from overseas. In nuclear power development, China’s nuclear policy follows the principles of independent innovation and Sino-foreign cooperation. Through digestion, absorption, and re-innovation, China is realizing the independence of nuclear power plant engineering design, equipment manufacturing, engineering construction, and operation management, promoting technological development and industry and developing a comprehensive ability to build large-scale advanced PWR nuclear power plants with independent Chinese brands in batches. As a result, the Westinghouse Electric AP1000 and AREVA Gen III reactor from France were introduced in 2006, and China’s independent intellectual property rights CAP1000, CAP1400, etc., were developed [31]. Taking this as an opportunity, Chinese nuclear power companies accelerated the construction of nuclear power plants to cope with the increasing demand for electricity and began to catch up with global nuclear power technology. After the Fukushima nuclear accident, China took active actions to comprehensively review the nuclear power plants in operation, improve safety measures in a targeted manner, conduct safety assessments on all nuclear power plants under construction using the most advanced standards, strictly approve new nuclear power projects, formulate and issue a nuclear safety plan, and adjust and improve the medium- and long-term plans for nuclear power development [32]. A series of research and development (R&D) projects were launched by the China NEA in February 2012 to improve safety-related technology and the country’s emergency response capabilities at indigenous nuclear power plants in the event of an extreme disaster beyond the design basis [33]. As can be seen from Figure 11, China’s cumulative installed nuclear power capacity increased steadily before 2010 but entered a period of rapid growth after 2015. By 2023, China’s cumulative installed nuclear power capacity had increased to 53 GW, an increase of 24 times compared with 2000, and there was an increase of 34 GW in the preceding 10 years (2014~2023). Overall, China nearly tripled its nuclear power capacity in that decade [31]. In almost the same period, the installed nuclear power capacity of G7 countries shrank from 289.6 GW in 2015 to 259.6 GW in 2022, mainly due to the retirement of aged reactors, while that of other emerging and developing countries increased from 60.4 GW to 68.3 GW [31]. This shows that China’s confidence in nuclear power safety after the review and technological iteration in the past 10 years, and the rapid growth of installed nuclear power capacity brought about by the large-scale construction invested in heavily on this basis, have led to the rapid growth of installed nuclear power capacity. An additional 27 reactors with an estimated 29.0 GW capacity are currently under construction in China (please refer to Figure 12) [34].

Figure 11.
Installed cumulative capacity of nuclear power plants in China, 2000–2021.
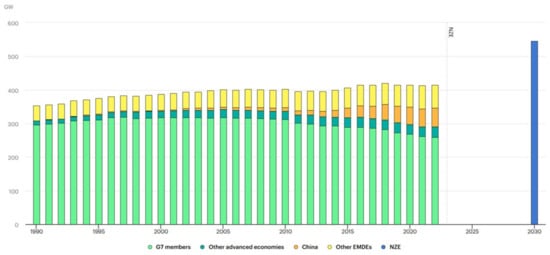
Figure 12.
Nuclear power capacity by country or region in the Net Zero Scenario, 1990–2030. Notes EMDE = Emerging market and developing economies. G7 members comprise Canada, France, Germany, Italy, Japan, the United Kingdom and the United States, plus the European Union. Gross capacity is shown (i.e., before accounting for onsite use of electricity). NZE = Net Zero Emissions by 2050. IEA (2023), Nuclear power capacity by country or region in the Net Zero Scenario, 1990–2030, IEA, Paris https://www.iea.org/data-and-statistics/charts/nuclear-power-capacity-by-country-or-region-in-the-net-zero-scenario-1990-2030-2 (accessed on 1 March 2025), Licence: CC BY 4.0.
According to the international organization Generation IV International Forum (GIF), which coordinates the development of generation IV reactors, six reactor technologies were specifically selected as candidates for generation IV reactors. The designs aimed for improved safety, sustainability, efficiency, and cost [35]. China launched the demonstration Gen IV High-Temperature Gas-Cooled Reactor Pebble-bed Module (HTR-PM) at the Shidaowan in Shandong in 2001. The first reactor reached first criticality in September and the second in November. Steam produced by the heat from the first reactor was used to power the turbine. The first reactor was gradually brought to full power and various tests were carried out before the second reactor underwent a similar process [36,37]. This technology is intended to replace coal-fired power plants in China’s interior, in line with the country’s plan to reach carbon neutrality by 2060.
China’s government will continue to promote industrial and technological development within the nuclear sector. Notable technologies will include small modular reactors, advanced reactors of diverse types, and marine transportable reactors. Future success with nuclear fusion and fuel reprocessing is less predictable. China’s commitment to commercial nuclear power is growing rapidly, and China will replace the United States as the country with the largest installed nuclear power capacity by 2030 [36]. Many organizations and institutions have made predictions on China’s medium- and long-term installed nuclear power capacity planning. The operable installed capacity will reach 180 GW to 200 GW, and presumably 300 GW in the operational situation by 2050. Even based on conservative estimates, China’s installed nuclear power capacity will increase to about three times the current level by then, and the proportion of power generation will reach about 20%, which is four times more than the current 4.8% [37,38].
4. Energy Storage
Energy storage is the capture of energy produced at one time for use at a later time to reduce imbalances between energy demand and energy production [39]. An energy storage system has two basic advantages: The first is that it stabilizes unstable power generation facilities. The second is that, during the low-power-consumption period, the power generated by low-carbon power generation facilities cannot play an economic role due to the reduced load, resulting in waste. The Net Zero Emissions scenario envisions both the massive deployment of variable renewables like solar PV and wind power and a large increase in overall electricity demand as more end uses become electrified. Grid-scale storage will be essential to manage the impact on the power grid and handle the hourly and seasonal variations in renewable electricity output while keeping grids stable and reliable in the face of growing demand. On the one hand, wind and solar power generation is affected by the natural environment, and a suitable energy storage system is needed to ensure a stable power supply when necessary. Wind power equipment that generates electricity at night can also store this part of the electricity in the system and release low-carbon electricity during the daytime. On the other hand, hydropower generation can store electricity during the low-power period and pump water that has entered the downstream of the dam back to the dam.
Since the end of 2020, the compulsory allocation policy for energy storage in new projects, including solar + storage, has emerged as a significant driving force. By the end of 2022, more than 20 provinces, municipalities, and autonomous regions in China had issued new energy allocation and storage policies [40].
These policies mandate energy storage allocation ratios ranging from 10% to 20%, with varying allocation durations of 2–4 h. The allocation and storage of new energy resources have generated substantial demand for energy storage installations, providing a reliable market for the energy storage sector. In 2021 and 2022, alongside policies supporting the development of new energy, including PV, specific subsidy policies for energy storage, particularly for PV + energy storage applications, were introduced [41].
According to statistics from the China Energy Storage Association (CNESA), Major markets target the greater deployment of storage additions through new funding and strengthened recommendations. China led the market in grid-scale battery storage additions in 2023, and pumped hydro storage still occupied a major proportion of the energy storage system, at 67.0% cumulatively in 2023, with annual installations approaching 20 GW (8.7 GW in 2022). The cumulative installed capacity of new energy storage exceeded 30 GW for the first time. According to data from the National Energy Administration, lithium-ion battery energy storage accounted for 96.9% of the new storage installation at the end of 2023. And Flywheels contributed 0.6%, compressed air constituted 0.7%, Sodium Battery addition of 0.8%, flow battery energy storage comprised 0.4%, and lead–acid battery energy storage contributed 0.8% [41].
Global Energy Storage Project Database, by the end of 2023, the cumulative installed capacity of electrical energy storage projects commissioned in China was 59.8 GW, accounting for 25% of the total global market scale, with an annual growth rate of 38% (Figure 13). The cumulative installed capacity of pumped hydro storage also fell below 80% for the first time, down by 8.3% compared to the same period in 2021. New energy storage continued to develop at a rapid pace, with the cumulative installed capacity exceeding 10 GW for the first time, reaching 13.1 GW/27.1 GWh, and with an annual growth rate of 128% in power scale and 141% in energy scale (Figure 14) [41].
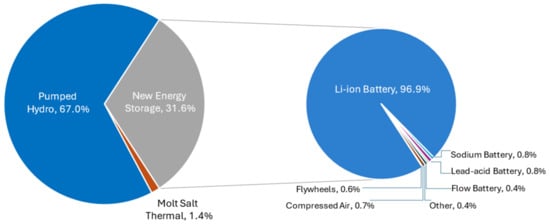
Figure 13.
Cumulative installed capacity of China’s electrical energy storage market by the end of 2023.
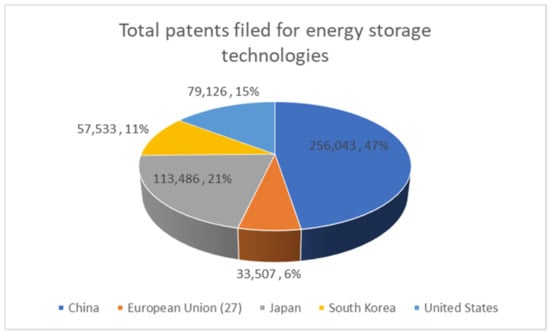
Figure 14.
China’s entities aiming for R&D for multiple energy storage technologies.
Despite the rapid growth in the installation of energy storage, almost all the energy storage entities in China are at the provincial level. Patents filed also contribute 47% of the great leading power in energy storage countries. With the relegalization of the above patents into physical products, a new safe storage system with higher efficiency and low carbon emissions could be expected in the near future.
China’s mid-term and long-term plans for pumped storage hydropower development, published in September 2021, set out ambitious targets to reach a total installed capacity of at least 62 GW by 2025 and 120 GW by 2030. The chemical energy storage system will be fully marketized with strong market vitality and capacity expectations [41].
5. UHV Trans-Grid
5.1. Definition and Advantage of UHV
Ultra-high voltage (UHV) refers to transmission technology with alternating current (AC) voltage levels of 1000 kilovolts or more and a direct current (DC) of ±800 kilovolts or more. With the continued increase in global energy demand and regional imbalance in power generation and consumption, UHV transmission technology has emerged to provide more efficient, safe, and reliable power transmission. The large-scale construction of UHV projects has driven the rapid development of UHV technology, playing a crucial role in the global energy supply and energy transformation [42]. This technology offers significant advantages in terms of transmission capacity and energy efficiency, which considerably improves the transmission capacity of the electrical grid. Moreover, there is less loss during transmission, and the cost is lower, with the Capex only accounting for 70% of that for non-UHV technology with same capacity; the transmission distance is longer; the transmission capacity is greater; its use in heavy loaded areas and substation sits and line corridors is more feasible; less land is occupied; and its environmental impact is smaller.
In the context of increasing global warming, the regional imbalance in green energy, especially wind, solar, and hydro power generation, in China, has led to a sharp increase in the demand for green and low-carbon electricity in economically developed regions.
Before the emergence of UHV in China, extra-high voltage (EHV, 230 kVAC~1000 kVAC) dominated the transmission technology from 1959. Some countries with high transmission demand and large areas began investing in the research and development of UHV transmission technology in the 1970s. Among them, the USSR and Japan established UHV transmission lines; however, they have had to downgrade the operation voltage to a lower designed specification. The United States and Brazil have only conducted initial exploratory research in related fields without any substantial progress [43,44,45].
5.2. Development of China UHV
As a latecomer, China began investing heavily in the development of UHV technology in 1986 to address the imbalance in the resource and electricity consumption layout. The first UHV transmission line from Jinxinan to Jingmen was officially established in January 2009, with a length of 652 km and AC 1000 kV. The transmission line has complete independent intellectual property rights, making China the only country in the world that fully controls these property rights, a status that has been maintained to this day. After years of transmission verification, it has been proven that the line has stable transmission performance, and the corresponding technology has been effectively recognized. Subsequently, the China State Grid and Southern Power Grid entered the peak period of UHV transmission line construction, and effective construction planning was carried out from the 11th Five-Year Plan onwards. Up to October 2023, 49,629 km of UHV transmission lines were constructed across China for both UHV AC and DC technologies, mainly to transmit PV and wind power electricity to high-consumption areas in East China or South China [46].
Entering the “14th Five-Year Plan (FYP)” and “15th FYP” periods, the demand for UHV DC construction remained more vigorous. During the 14th Five-Year Plan period, the total investment in the planning and construction of ultra-high voltage “14 DC + 24 AC” by the State Grid of China was RMB 380 billion (USD 59.6 bn) [47]. In 2022, the National Development and Reform Commission and the Energy Administration issued the “Planning and Layout Plan for Large Wind and Solar Power Bases with a Focus on Deserts, Gobi, and Desert Areas”, proposing the building and implementing it in the operation of a large wind and solar power base with a total installed capacity of approximately 200 GW, including 150 GW for external delivery and 50 GW for local self-use, with an external delivery ratio of 75%. It is expected that, during the 15th FYP period, the total installed capacity of the planned construction of the wind and solar base will be approximately 255 GW, including the external transportation of approximately 165 GW, approximately 90 GW for local self-use, and approximately 65% for external delivery.
5.3. What Is Next for China’s UHV Technology
China remains the only country in the world to possess full intellectual property rights in UHV technology and will maintain this status for a long time. A literature review revealed that Chinese stakeholders will not stay at the current level of technology but have thoroughly and resolutely innovated at the next levels of UHV technology. Multi-circuit transmission technology, compact transmission technology, and enlarged diameter conductor technology will be the next UHV technology breakthroughs.
In 2021, the global number of UHV technology patents was approximately 768,680 pieces, a decrease of 10.8% compared to the previous year. Among them, China had the highest number of patent applications, with around 318,392, accounting for 41.4%. The number of patent applications in the United States and Japan was 169,110 and 130,672, respectively, accounting for approximately 22% and 17% of the total [48].
Despite the technological innovation, China began global market development after the successful opening of its first UHV transmission line. Companies like SGCC started to invest in and construct several UHV projects overseas. Among these, the Belo Monte II UHV transmission project initiated in 2010 in Brazil is a good example of its application scenario globally. With a designed transmission capacity of 4 GWh, adopting a ±800 UHV DC transmission program, and crossing over 2500 km in length, this is the first overseas UHV project implemented by SGCC [49]. The high-voltage direct current transmission line project from Kimal in the Antofagasta region of northern Chile to Loagire in the central capital region, which was jointly planned by the Southern Power Grid, is the first high-voltage direct current transmission line in the country. Chinese enterprises’ high-voltage direct current transmission technology has assisted Chile’s green development [50]. By 2022, one third of the key infrastructure projects under construction in countries and regions along “the Belt and Road” had implemented Chinese standards, providing technical support for the high-quality construction of “the Belt and Road”. At the same time, international standards such as UHV and new energy access, led by China, have also become important norms for global engineering construction. More initiatives are to be developed in Russia, Pakistan, Mongolia, and so on, by 2030.
6. What Puts China in Lead in Carbon Neutrality
Looking back at China’s green energy and green industry routes, whether in terms of technological invention or policy promotion, it has lagged behind Europe and the United States and was not leading even in Asia decades before. However, with the establishment of the People’s Republic of China, especially since reformation and opening up, China has gone from being a technological follower in clean energy to being on par with developed Western countries and is now ahead of them in many aspects. This was not achieved overnight: to promote renewable energy, the China Central Government has implemented a series of policies in the past three decades. Since 2022, China’s renewable energy market has entered a new stage. The support for renewables has switched from a feed-in tariff (FiT) model to a ‘grid parity’ model, whereby electricity generated from renewables receives the same remuneration as that from coal-fired power plants. Nevertheless, the phaseout of subsidies has not slowed the pace of renewable energy development in China [19]. However, since the 1990s, China has gradually caught up with or even surpassed developed countries in terms of innovation, capacity improvement, and market share in carbon neutrality technologies (such as wind and solar power generation, hydropower, nuclear power, energy storage systems, and ultra-high voltage storage). The global technology and industrial experts are curious about what strength China has that enables it to achieve its current leading position and continue to play a leading role in global carbon neutrality technology in the next few decades.
The authors intend to discuss the reasons why China has taken the lead.
Continuity of policy. Like governments of other countries, the Chinese government has gradually realized the climate crisis and the importance of achieving carbon neutrality across the whole of society. The difference is that once this awareness is achieved, it can be transformed into policy formulation and made consistent in the subsequent leadership team, without cyclical policy fluctuations caused by changes in political parties. As new industries, low-carbon energy, energy storage systems, ultra-high voltage, and other high-cost, long-cycle, high-risk technologies undoubtedly need long-term and stable support from the government in terms of policy support and capital investment, otherwise changing policies will affect the confidence of industry investors. Especially in the increasingly urgent and frequent extreme climate, maintaining investor and public confidence will have a profound impact on the final industry to gradually form cluster advantages. Take the Three Gorges Hydropower Project as an example, from the early feasibility assessment, huge immigration policies, to the huge capital investment in the mid-term, almost all the efforts of the country to build the Three Gorges Dam Project. Without continuous policy support, the above difficulties are almost impossible to achieve. Even so, it still took 17 years (1992–2007) from the approval of the project by the National People’s Congress to its final completion. The continuous policy support behind it must have played an absolute role [17].
Innovation is essential for the transition to succeed. Public spending on low-carbon energy research and development (R&D) in China has risen by 70% since 2015. China accounts for nearly 10% of patenting activity in renewables and EVs. In recent years, its start-ups have attracted more than one third of global early-stage energy venture capital [51]. In addition, China’s huge talent training mechanism, especially in the training of science and engineering, provides a solid accumulation of high-level technical talents for technological innovation and industrial upgrading. According to the Chinese government’s calculations, China produces about 5 million science and engineering (STEM) graduates each year, and the total number of talent resources of all kinds reaches 220 million. At the same time, the total number of skilled workers exceeds 200 million, and the number of highly skilled talents exceeds 60 million [52]. Such a huge talent resource is bound to promote China’s innovation and revolution in the field of high technology, green innovation for example. This has enabled China to improve its development advantage from “demographic dividend” to “talent dividend”. This advantage is conducive to an absolute leading position in the world, and under the premise of this leading position, it is not surprising that technological changes in fields such as wind, solar, energy storage, and UVH have emerged.
Determination and confidence. As an old Chinese saying goes, soldiers follow the orders of their generals just as grass follows the wind. In the face of the climate crisis, not all governments have adopted the most resolute energy transformation policies to reverse the seemingly irreversible climate warming. Only the government’s firm confidence can lead the public to move unswervingly towards a carbon-neutral future. Any policy fluctuation may cause unrest in social groups and, ultimately, affect the speed of the global improvement of climate policies. In fact, before the Chinese government announced its carbon peak and carbon neutrality goals in 2020, the Chinese government had invested heavily in the construction of environmental and low-carbon energy in the early 21st century. For example, in 2020, it had achieved a reduction of more than 48.4% in carbon emissions per unit of GDP, exceeding the commitment made by the Chinese government in Copenhagen in 2009 (a reduction of 40~45%) [53]. After the Chinese government’s commitment, China has launched global commitments at all levels, from policies to energy, from industrial manufacturing to service trade. China’s determination and confidence in its carbon neutrality path will inevitably become the stabilizing core and ballast cornerstone of the global response to climate change and will surely play a more positive role in addressing public anxiety due to extreme climate change and geopolitical conflictions.
7. Conclusions
This article aims to discuss the enabling role that China can play in clean energy, energy storage systems, UHV, etc., to meet the strong demand for combating global warming in a complex geopolitical environment. As mentioned, China did not have an advantage in the above industries and technologies at the beginning. With the solemn dual-carbon commitment of the Chinese government and the vigorous development since the beginning of the 21st century, China has made technological breakthroughs in many fields and achieved industrialization.
Despite China’s main strengths in carbon neutrality in the energy field, it still has much room for improvement in the following areas.
- Improve geopolitical and international public image, reverse the stereotypical views of the international public on China’s carbon neutrality technology and policies, including wind and solar power generation, energy storage systems, etc., and help the green transformation of the energy field in developed countries and the global South countries, so as to improve the pace of global warming and enable China’s green industry capital to obtain the necessary returns.
- Accelerate technological innovation in new fields including CCUS, geothermal power generation, and ocean power generation. Although China has played a leading role in the fields described in this article, there is still room for considerable progress in the technologies. China can use its first-mover advantage and capital accumulation in other fields to increase capital investment and technological exploration in the above directions and, ultimately, benefit humanity.
- Accelerate carbon trading system and use financial leverage to further urge the investment of related companies in the low-carbon and zero-carbon fields. Only in this way can the construction of investment momentum for technological updates be accelerated.
- Low-carbon and zero-carbon life for all. Although government policies have shown great momentum, the participation of the entire nation is the foundation of a thorough zero-carbon society in the future. It can not only stimulate rapid carbon reduction measures but also further activate the wisdom of the entire nation and improve the atmosphere of zero-carbon living in the entire society.
It should be emphasized that global carbon neutrality is by no means a one-way action of a single entity or even a single government or region. It requires the full commitment of all entities and individuals in the world to effectively save energy and reduce carbon emissions throughout the entire industrial chain, globally. Only in this manner can people achieve a certain victory in the global cooperation strategy that can only be won or lost. Just as for global cooperation in the face of the depletion of the atmospheric ozone layer in the past 30 years, it is necessary to abandon all geopolitical tendencies, all ideological disputes, and all economic imbalance disputes. Only through this multilateral action does China have an absolute advantage in energy fields such as clean energy, energy storage, and transmission technology.
In the current atmosphere of geopolitical and regional conflicts, China brings solutions to global warming and future alternative energy requirements. As is well established, China has taken a leading position in the world in the manufacturing sector and has established its own advantages in the entire industrial chain and the entire production range. These advantages will also provide a fast and low-cost solution for global efforts to mitigate climate change. The authors believe that, with the in-depth advancement of technology and global cooperation, there is still hope that the world will work towards the 2.5° scenario of the Paris Agreement, although the 1.5° scenario is unrealistic. However, the crisis requires major countries to let go of their reservations and work with their Chinese counterparts to cope with the crisis of survival facing this planet.
Funding
This research received no external funding.
Acknowledgments
The research in this article benefit from multiple organizations, associations, and websites which we appreciate for their great achievements: UNCC, IEA, IRENA, World Nuclear Association, OurWorldinData, Wikipedia, and so on. And we are also thankful to the authors whose articles cited. The authors are grateful for the comments from the anonymous reviewers of this article.
Conflicts of Interest
Qishan Feng was employed by Stellantis. The remaining authors declare that the research was conducted in the absence of any commercial or financial relationships that could be construed as a potential conflict of interest.
References
- Sanderson, H.; Czub, M.; Jakacki, J.; Koschinski, S.; Tougaard, J.; Sveegaard, S.; Frey, T.; Fauser, P.; Bełdowski, J.; Beck, A.J.; et al. Environmental impact of the explosion of the Nord Stream pipelines. Sci. Rep. 2023, 13, 19923. [Google Scholar] [CrossRef] [PubMed]
- Liu, S. Ant Forest: Ant Forest: Using Financial Technologies to Advance Climate Solutions in China. In Case Profile Series on Land Trusts as Climate Change Solution Providers; Lincoln Institute of Land Policy: Cambridge, MA, USA, 2022; Available online: https://landconservationnetwork.org/wp-content/uploads/2022/08/Case20Profile20Ant20Forest_final-1.pdf (accessed on 11 January 2025).
- UNCC. Five Key Takeaways from COP27; UNFCCC: Sharmel Sheikh, Egypt, 2022. [Google Scholar]
- UNCC. Key Takeaways from COP29 and the Road Ahead for Developing Countries; UN Trade and Development (UNCTAD): Baku, Azerbaijan, 2024. [Google Scholar]
- Liu, H.; Evans, S.; Zhang, Z.; Song, W.; You, X. As Part of a Series on How Key Emitters Are Responding to Climate Change, Carbon Brief Looks at China, Which Leads the World in Terms of Greenhouse Gas Emissions and Coal Use—But Also on the Deployment and Manufacture of Low-Carbon Technologies. Available online: https://interactive.carbonbrief.org/the-carbon-brief-profile-china/index.html (accessed on 1 March 2025).
- Buis, A. The Atmosphere: Getting a Handle on Carbon Dioxide. In Sizing Up Humanity’s Impacts on Earth’s Changing Atmosphere: A Five-Part Series; NASA Science: Washington, DC, USA, 2019. [Google Scholar]
- Inman, M. Carbon is forever. Nat. Clim. Change 2008, 1, 156–158. [Google Scholar] [CrossRef]
- Share of CO2 Emissions Embedded in Trade. Available online: https://ourworldindata.org/grapher/share-co2-embedded-in-trade?tab=chart&time=2002..latest&facet=none&country=USA~GBR~CHN~JPN (accessed on 12 December 2024).
- Ge, J. The Joint Efforts of the Government and Enterprises Are Gradually Getting Better, and the Export of Private Enterprises is Brighter—A Review of Foreign Trade Data in 2024. Available online: https://www.eeo.com.cn/2025/0206/709469.shtml (accessed on 9 February 2025).
- Peters, G.P.; Davis, S.J.; Andrew, R. A synthesis of carbon in international trade. Biogeosciences 2012, 9, 3247–3276. [Google Scholar] [CrossRef]
- Ritchie, H. Who Has Contributed Most to Global CO2 Emissions?—Our World in Data. Available online: https://ourworldindata.org/contributed-most-global-co2 (accessed on 1 March 2025).
- China Exports 1960–2024. Macro Trends. Available online: https://www.macrotrends.net/global-metrics/countries/CHN/china/exports (accessed on 1 March 2025).
- CO2 Emissions Embedded in Trade. Available online: https://ourworldindata.org/grapher/co-emissions-embedded-in-global-trade?tab=chart&time=2002..latest&country=USA~GBR~CHN~OWID_EU27~JPN (accessed on 11 December 2024).
- Ritchie, H.; Rosado, P.; Roser, M. CO2 and Greenhouse Gas Emissions. 2023. Published Online at OurWorldInData.org. Available online: https://ourworldindata.org/co2-and-greenhouse-gas-emissions (accessed on 9 January 2025).
- Ensure Access to Affordable, Reliable, Sustainable and Modern Energy. Available online: https://www.un.org/sustainabledevelopment/energy/ (accessed on 11 January 2025).
- Wikipedia. Hydroelectricity in China. Available online: https://en.wikipedia.org/wiki/Hydroelectricity_in_China (accessed on 18 December 2024).
- Wikipedia. Three Gorges Dam. Available online: https://en.wikipedia.org/wiki/Three_Gorges_Dam (accessed on 18 December 2024).
- Wikipedia. List of Largest Hydroelectric Power Stations. Available online: https://en.wikipedia.org/wiki/List_of_largest_hydroelectric_power_stations (accessed on 18 December 2024).
- International Renewable Energy Agency. Renewable Energy Technologies: Cost Analysis Series; International Renewable Energy Agency: Masdar, Abu Dhabi, 2012; Volume 1, Power Sector Issue 3/5 June 2012. [Google Scholar]
- Black & Veatch. Building a World of Difference and National Renewable Energy Laboratory Cost and Performance Data for Power Generation Technologies, 2012/02; Black and Veatch Corporation: Overland Park, KS, USA, 2012. [Google Scholar]
- International Renewable Energy Agency, Prospects for the African Power Sector: Scenarios and Strategies for Africa Project. Available online: https://www.irena.org/-/media/Files/IRENA/Agency/Publication/2011/Prospects_for_the_African_PowerSector.pdf (accessed on 1 March 2025).
- Regional Profile, East Asia and Pacific, by International Hydropower Association. Available online: https://www.hydropower.org/region-profiles/east-asia-and-pacific (accessed on 18 December 2024).
- Liu, B.; Song, C.; Wang, Q.; Wang, Y. Forecasting of China’s solar PV industry installed capacity and analyzing of employment effect: Based on GRA-BiLSTM model. Environ. Sci. Pollut. Res. 2022, 29, 4557–4573. [Google Scholar] [CrossRef] [PubMed]
- Ember and Energy Institute. Electricity generation from solar power [dataset]; Yearly Electricity Data [original data]. In Statistical Review of World Energy (2024); With Major Processing by Our World in Data; Ember and Energy Institute: London, UK, 2024. [Google Scholar]
- USA Imposes Tariffs on Solar Panels from China—China Briefing News. Available online: https://www.china-briefing.com/news/u-s-imposes-tariff-on-solar-panels-from-china/ (accessed on 11 January 2025).
- Memo: EU Imposes Provisional Anti-Dumping Duties on Chinese Solar Panels. Brussels, 4 June 2013. Available online: https://ec.europa.eu/commission/presscorner/detail/en/MEMO_13_497 (accessed on 11 January 2025).
- Hawkins, S. Solar Exports from China Increase by a Third; EMBER: Atlanta, GA, USA, 2023. [Google Scholar]
- GWEC. Global Wind Report 2023; Global Wind Energy Concil: Brussels, Belgium, 2023. [Google Scholar]
- Qinshan Nuclear Power Plant. Baidu Encyclopedia. Available online: https://baike.baidu.com/item/%E7%A7%A6%E5%B1%B1%E6%A0%B8%E7%94%B5%E7%AB%99/759536?fr=ge_ala (accessed on 1 March 2025).
- Daya Bay Nuclear Power Operation and Management Co., Ltd. Available online: http://www.dnmc.com.cn/dnmccn/c101666/list_gsgk_tt.shtml (accessed on 1 March 2025).
- Ezell, S. How Innovative Is China in Nuclear Power? Hamilton Center on Industrial Strategy: Washington, DC, USA, 2024. [Google Scholar]
- World Nuclear Asscociation. Nuclear Power in China. Available online: https://www.economist.com/china/2023/11/30/china-is-building-nuclear-reactors-faster-than-any-other-country (accessed on 1 March 2025).
- After the Fukushima Nuclear Accident, What Improvement Measures Related to Nuclear Safety Has My Country Taken? Available online: https://nnsa.mee.gov.cn/ztzl/xgzgt/hyfsaqkp/kptw/202303/t20230320_1020913.html (accessed on 11 December 2024).
- IEA. Nuclear Power Capacity by Country or Region in the Net Zero Scenario, 1990–2030; IEA: Paris, France, 2023; Available online: https://www.iea.org/data-and-statistics/charts/nuclear-power-capacity-by-country-or-region-in-the-net-zero-scenario-1990-2030-2 (accessed on 1 March 2025).
- Generation IV Goals. Available online: https://www.gen-4.org/gif/jcms/c_9502/generation-iv-goals (accessed on 11 December 2024).
- Demonstration HTR-PM Connected to Grid. Available online: https://www.world-nuclear-news.org/Articles/Demonstration-HTR-PM-connected-to-grid (accessed on 12 December 2024).
- China Starts Up World’s First High-Temperature Gas-Cooled Reactor. Global Construction Review. 15 September 2021. Available online: https://www.reuters.com/world/china/china-starts-up-worlds-first-fourth-generation-nuclear-reactor-2023-12-06/ (accessed on 28 October 2021).
- The Oxford Institute of Energy for Studies. Nuclear Power in China: Its Role in National Energy Policy; The Oxford Institute of Energy for Studies: Oxford, UK, 2023. [Google Scholar]
- Wikipedia: Energy Storage. Available online: https://en.wikipedia.org/wiki/Energy_storage (accessed on 1 March 2025).
- Hazarika, G. Compulsory Allocation Policy for Energy Storage Has Emerged as a Significant Driving Force. 23 July 2023. Available online: https://www.mercomindia.com/chinas-storage-increased-by-110-in-2022 (accessed on 1 March 2025).
- Chen, H.; Yu, Z.; Liu, W. Energy Storage Industry White Paper 2024; Summary Version; China Energy Storage Alliance: Beijing, China, 2023. [Google Scholar]
- ZMS Cable Company, Ltd. The Energy Revolution: Ultra High Voltage Transmission; ZMS Cable Company, Ltd.: Zhengzhou, China, 2023; Available online: https://zmscable.es/en/transmision-ultra-alta-tension (accessed on 1 March 2025).
- Gela, G. UHV Transmission Lines Worldwide IEEE/PES Berkshire Chapter Thursday, 30 April 2015, BETC. 2015. Available online: https://ewh.ieee.org/r1/berkshire/NOTICES/GG%20IEEE%20UHV%20lines%202015.pdf (accessed on 1 March 2025).
- Candas, M.; Meric, O.S. The Application of Ultra High Voltage in the World. J. Power Energy Eng. 2015, 3, 453–457. [Google Scholar] [CrossRef]
- Wikipedia. Ultra-High-Voltage Electricity Transmission in China. Available online: https://en.wikipedia.org/wiki/Ultra-high-voltage_electricity_transmission_in_China (accessed on 21 November 2024).
- Zhou, R. Large-Scale Wind and Solar Bases Drive Strong Demand for UHV, and 2023 Will Be a Big Year for DC Construction China Galaxy Securities. 2023. Available online: https://finance.sina.cn/hkstock/gsxw/2023-04-10/detail-imypwkps4592607.d.html?oid=3816551570282202&vt=4&wm=1013?car_1=$car_1&cid=76526&node_id=76526 (accessed on 1 March 2025).
- Li, H. The Total Investment During the 14th Five Year Plan Period Is Expected to Reach 380 Billion Yuan! Ultra High Voltage Becomes the Main Force of New Energy Power Transmission. Available online: https://www.yicai.com/news/101297128.html (accessed on 1 March 2025).
- Sai, Y.; Lei, H.; Jiang, J. Global Application Outlook Of Ultra High Volt-Age (UHV) Electricity Transmission—A Super Highway For A Cleaner World? Climate Future. 15 December 2021. Available online: https://climatefutureglobal.com/global-application-outlook-of-ultra-high-volt-age-uhv-electricity-transmission-a-super-highway-for-a-cleaner-world/ (accessed on 21 November 2024).
- Yang, Y. The Silk Road will be a Success in Ten Years—Written on the Occasion of the Convening of the Third Belt and Road Forum for International Cooperation. In China Electric Power News; China Electric Power Press: Beijing, China, 2023; Available online: https://www.cpnn.com.cn/news/xwtt/202310/t20231018_1642611.html (accessed on 12 December 2024).
- IEA. An Energy Sector Roadmap to Carbon Neutrality in China. Available online: https://iea.blob.core.windows.net/assets/9448bd6e-670e-4cfd-953c-32e822a80f77/AnenergysectorroadmaptocarbonneutralityinChina.pdf (accessed on 12 December 2024).
- Zhang, Y.; Xie, P.; Huang, Y.; Liao, C.; Zhao, D. Evolution of Solar Photovoltaic Policies and Industry in China. In Proceedings of the 3rd International Conference on Green Energy and Sustainable Development, San Francisco, CA, USA, 26–30 May 2024. [Google Scholar]
- People’s Daily Overseas Edition. Over 5 Million STEM Graduates Each Year, Leading the World. Available online: https://www.gov.cn/yaowen/liebiao/202404/content_6942783.htm (accessed on 12 December 2024).
- IEA. Net Onshore Wind Electricity Capacity Additions by Country or Region, 2022–2024; IEA: Paris, France, 2023; Available online: https://www.iea.org/data-and-statistics/charts/net-onshore-wind-electricity-capacity-additions-by-country-or-region-2022-2024 (accessed on 12 December 2024).
Disclaimer/Publisher’s Note: The statements, opinions and data contained in all publications are solely those of the individual author(s) and contributor(s) and not of MDPI and/or the editor(s). MDPI and/or the editor(s) disclaim responsibility for any injury to people or property resulting from any ideas, methods, instructions or products referred to in the content. |
© 2025 by the authors. Licensee MDPI, Basel, Switzerland. This article is an open access article distributed under the terms and conditions of the Creative Commons Attribution (CC BY) license (https://creativecommons.org/licenses/by/4.0/).