1. Introduction
Global urbanization is accelerating. According to United Nations projections, the global urban population is expected to increase by 2.5 billion by 2050, accounting for 68% of the total population [
1]. While this rapid urbanization fosters economic growth and infrastructure development [
2], it also exacerbates the unequal distribution of public resources, with urban green space equity being a particularly pressing issue [
3]. Urban green spaces include both natural areas (e.g., parks and forests) and artificial green spaces (e.g., waterfront greenways, community green spaces, and landscaped plazas) [
4,
5]. These spaces not only provide essential ecosystem services such as air purification, temperature regulation, and biodiversity conservation [
6] but also enhance residents’ well-being by alleviating psychological stress, promoting social interactions, and strengthening community cohesion [
7,
8,
9]. However, the spatial distribution of urban green spaces is often inequitable, disproportionately disadvantaging low-income and marginalized communities, which tend to have limited access to green spaces of adequate size and quality [
10,
11,
12].
Spatial inequities in urban green space not only elevate mental health risks, such as anxiety and depression [
13], but also contribute to chronic conditions, including obesity [
14], diabetes [
15], and cardiovascular diseases [
16]. Of particular concern is the issue of “latent green space inequality”, where official statistics indicate an abundance of green spaces, yet residents perceive themselves as living in a “green desert [
17]”, unable to truly benefit from these areas. This disconnect may stem from limited accessibility, poor environmental quality, safety concerns, and social exclusion, all of which shape residents’ actual experiences with urban green spaces. This raises a critical question: How do structural disparities in green space distribution undermine residents’ well-being through psychosocial mechanisms?
From a theoretical perspective, environmental justice theory and biophilic urbanism provide crucial frameworks for understanding these impacts. Environmental justice theory emphasizes that environmental resources, such as urban public green spaces, should be equitably distributed to ensure that all social groups—particularly low-income populations, the elderly, and immigrant communities—have equal access to environmental benefits [
18,
19]. However, in practice, real estate development and urban renewal often lead to a concentration of green space resources in affluent neighborhoods, reducing accessibility and diminishing the experience of lower-income groups [
20]. Biophilic urbanism, on the other hand, posits that humans have an innate need to connect with nature, which enhances psychological well-being, alleviates stress, and improves overall happiness [
21]. When green space distribution is uneven, it can weaken residents’ perceived environment, sense of security, and community belonging, ultimately affecting their well-being [
22]. These two theoretical perspectives are deeply intertwined in the context of urban green space allocation, providing a foundational framework for understanding how distributional inequities impact residents’ quality of life [
23].
Current research on urban green space equity primarily focuses on several key areas. The first is objective measurement of green space equity. Previous studies have employed advanced technologies such as geographic information systems (GIS) and spatial analysis models to examine the physical distribution characteristics of green spaces in depth. For instance, in terms of green space coverage, national social surveys and land-use data have been used to quantify green space proportions across different regions [
24,
25]. Regarding spatial accessibility, transportation network analysis and spatial lag regression models have been applied to assess the ease of access to green spaces for residents [
26,
27,
28]. In the context of service radius, buffer analysis has been utilized to delineate the effective service areas of various types of green spaces [
29,
30]. In urban areas globally, a substantial body of community-level research has underscored systemic disparities in the size, accessibility, and quality of green spaces [
31,
32,
33]. For example, Zhang’s regional study in developed countries found that while most low-income communities tend to have greater green space availability, their actual accessibility remains limited. Additionally, neighborhoods with a higher proportion of Asian people had more UGS availability but less accessibility [
25].
Another strand of research examines how sociodemographic characteristics influence residents’ actual access to and use of green spaces, addressing issues of social inequality and resource distribution [
34,
35,
36]. For example, Lu et al. investigated the impact of socioeconomic factors on spatial equity across 263 cities in China. Their findings indicate that increases in GDP and population growth rates improve spatial equity in terms of community green spaces and street greenery. However, economic development and migration inflows exacerbate inequalities in public green space accessibility [
20]. Similarly, Silviya Korpilo utilized Public Participation Geographic Information Systems (PPGIS) to assess environmental justice in relation to green and blue spaces (e.g., rivers and lakes) on Amager Island, Copenhagen, Denmark. The study authors found that gender significantly influences residents’ perceptions of green space equity [
37]. In addition, some studies have focused on the profound impact of inequalities in green space utilization on public health [
38,
39,
40]. For example, Gao et al. found that during the COVID-19 pandemic, patterns of park usage in the United States varied significantly based on socioeconomic status, urban–rural location, and population mobility. Due to the unequal distribution of green spaces and safe social distancing policies, pre-existing disparities in green space accessibility may have been further exacerbated, negatively affecting residents’ mental health and social interactions [
41]. In Europe, studies conducted in the United Kingdom and Germany indicate that policymakers have increasingly recognized the impact of green space equity on public health and have begun integrating equity-based strategies into urban planning to optimize the distribution of green infrastructure [
42,
43].
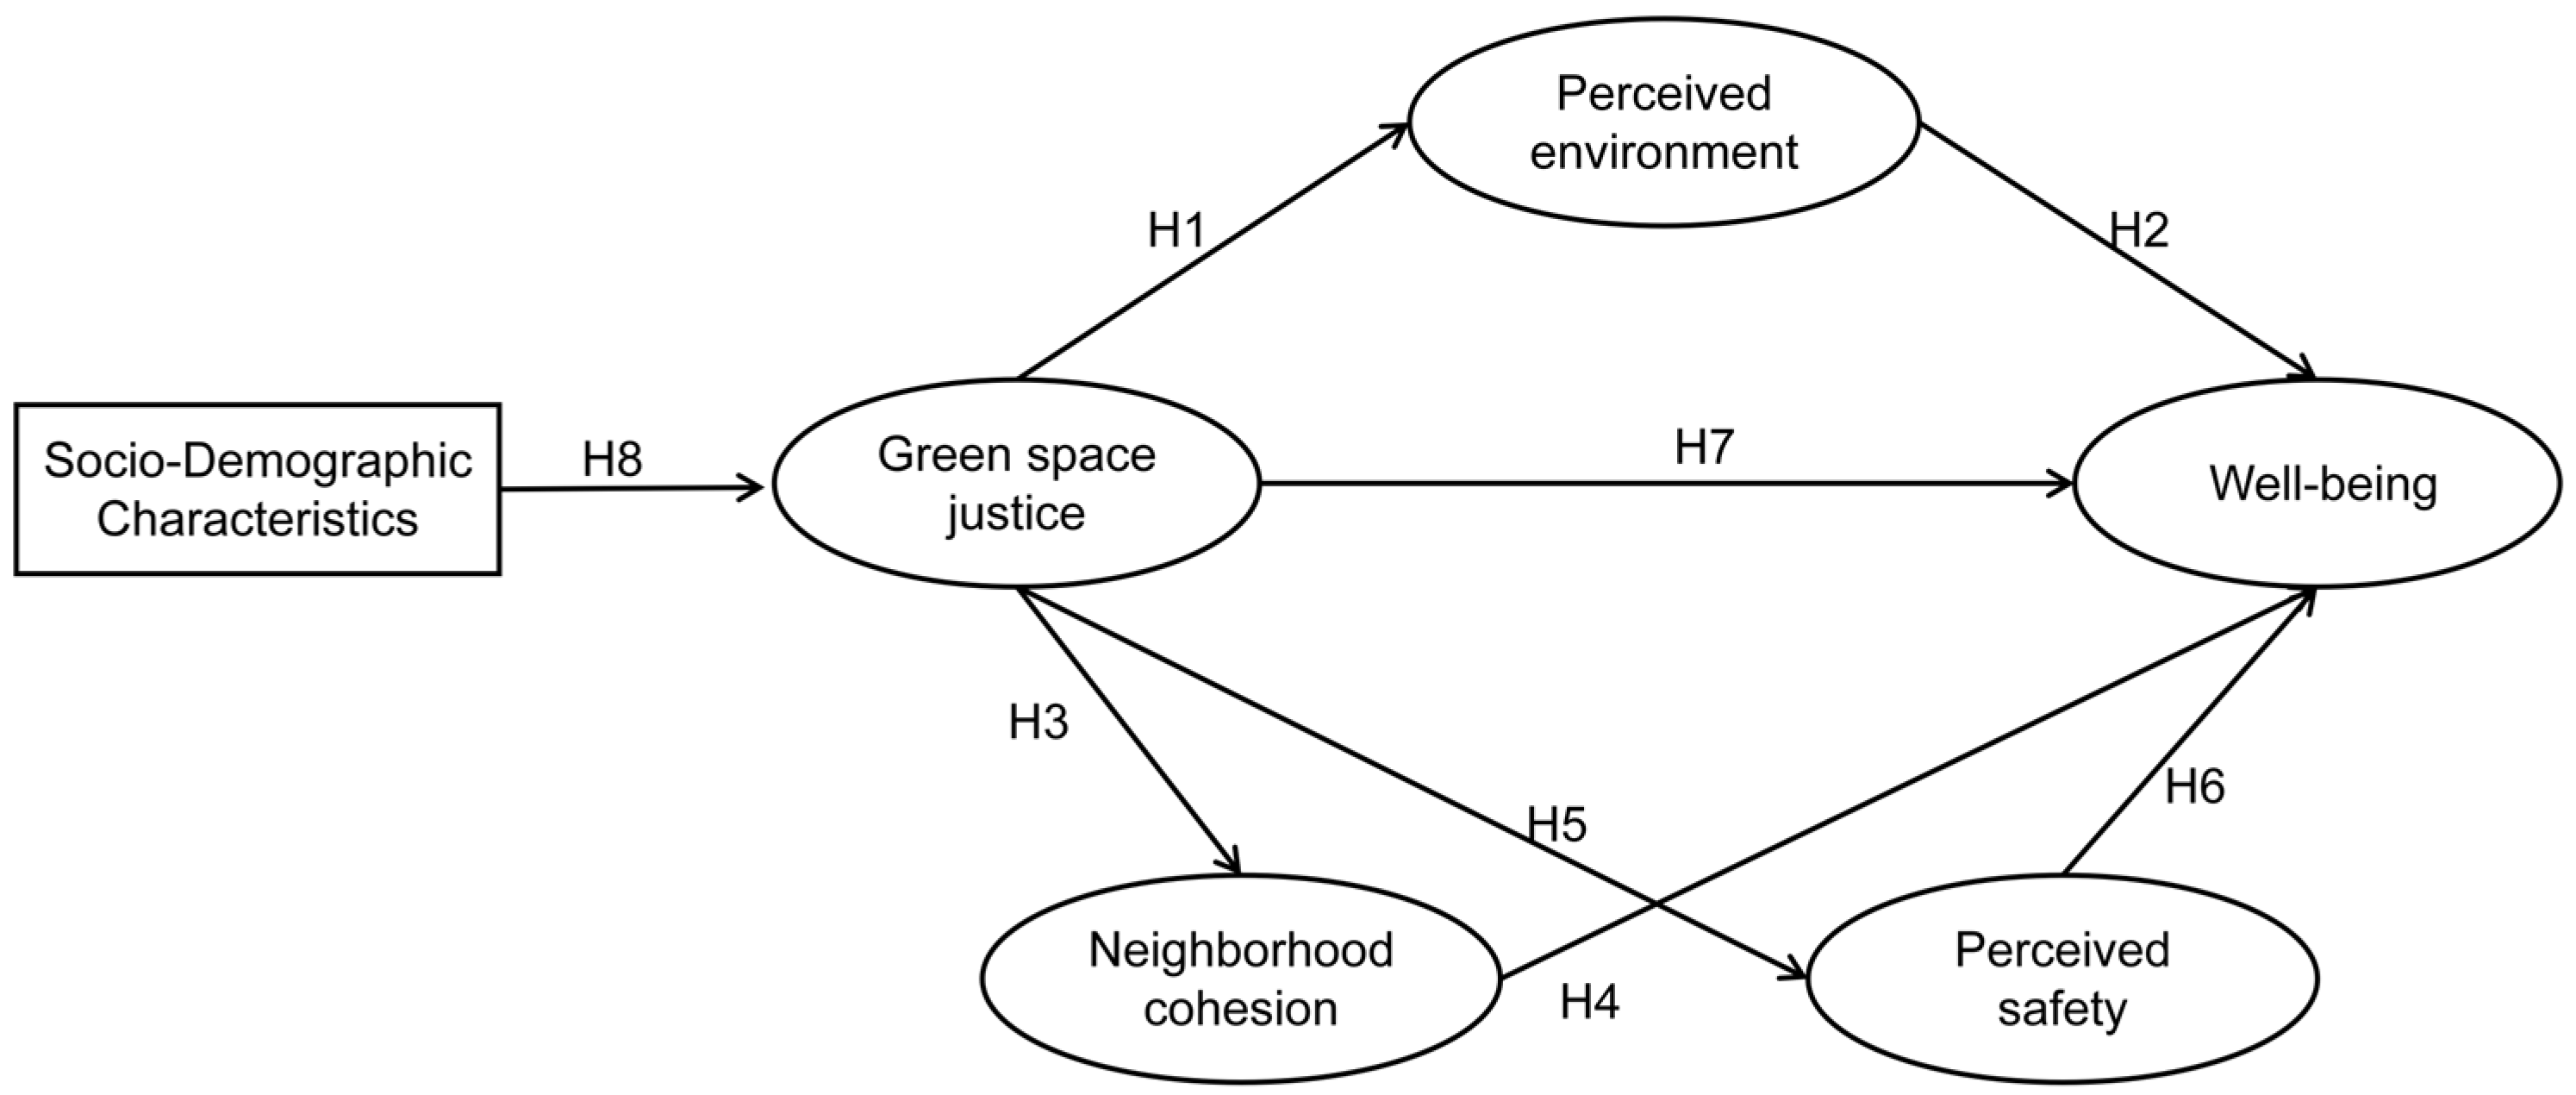
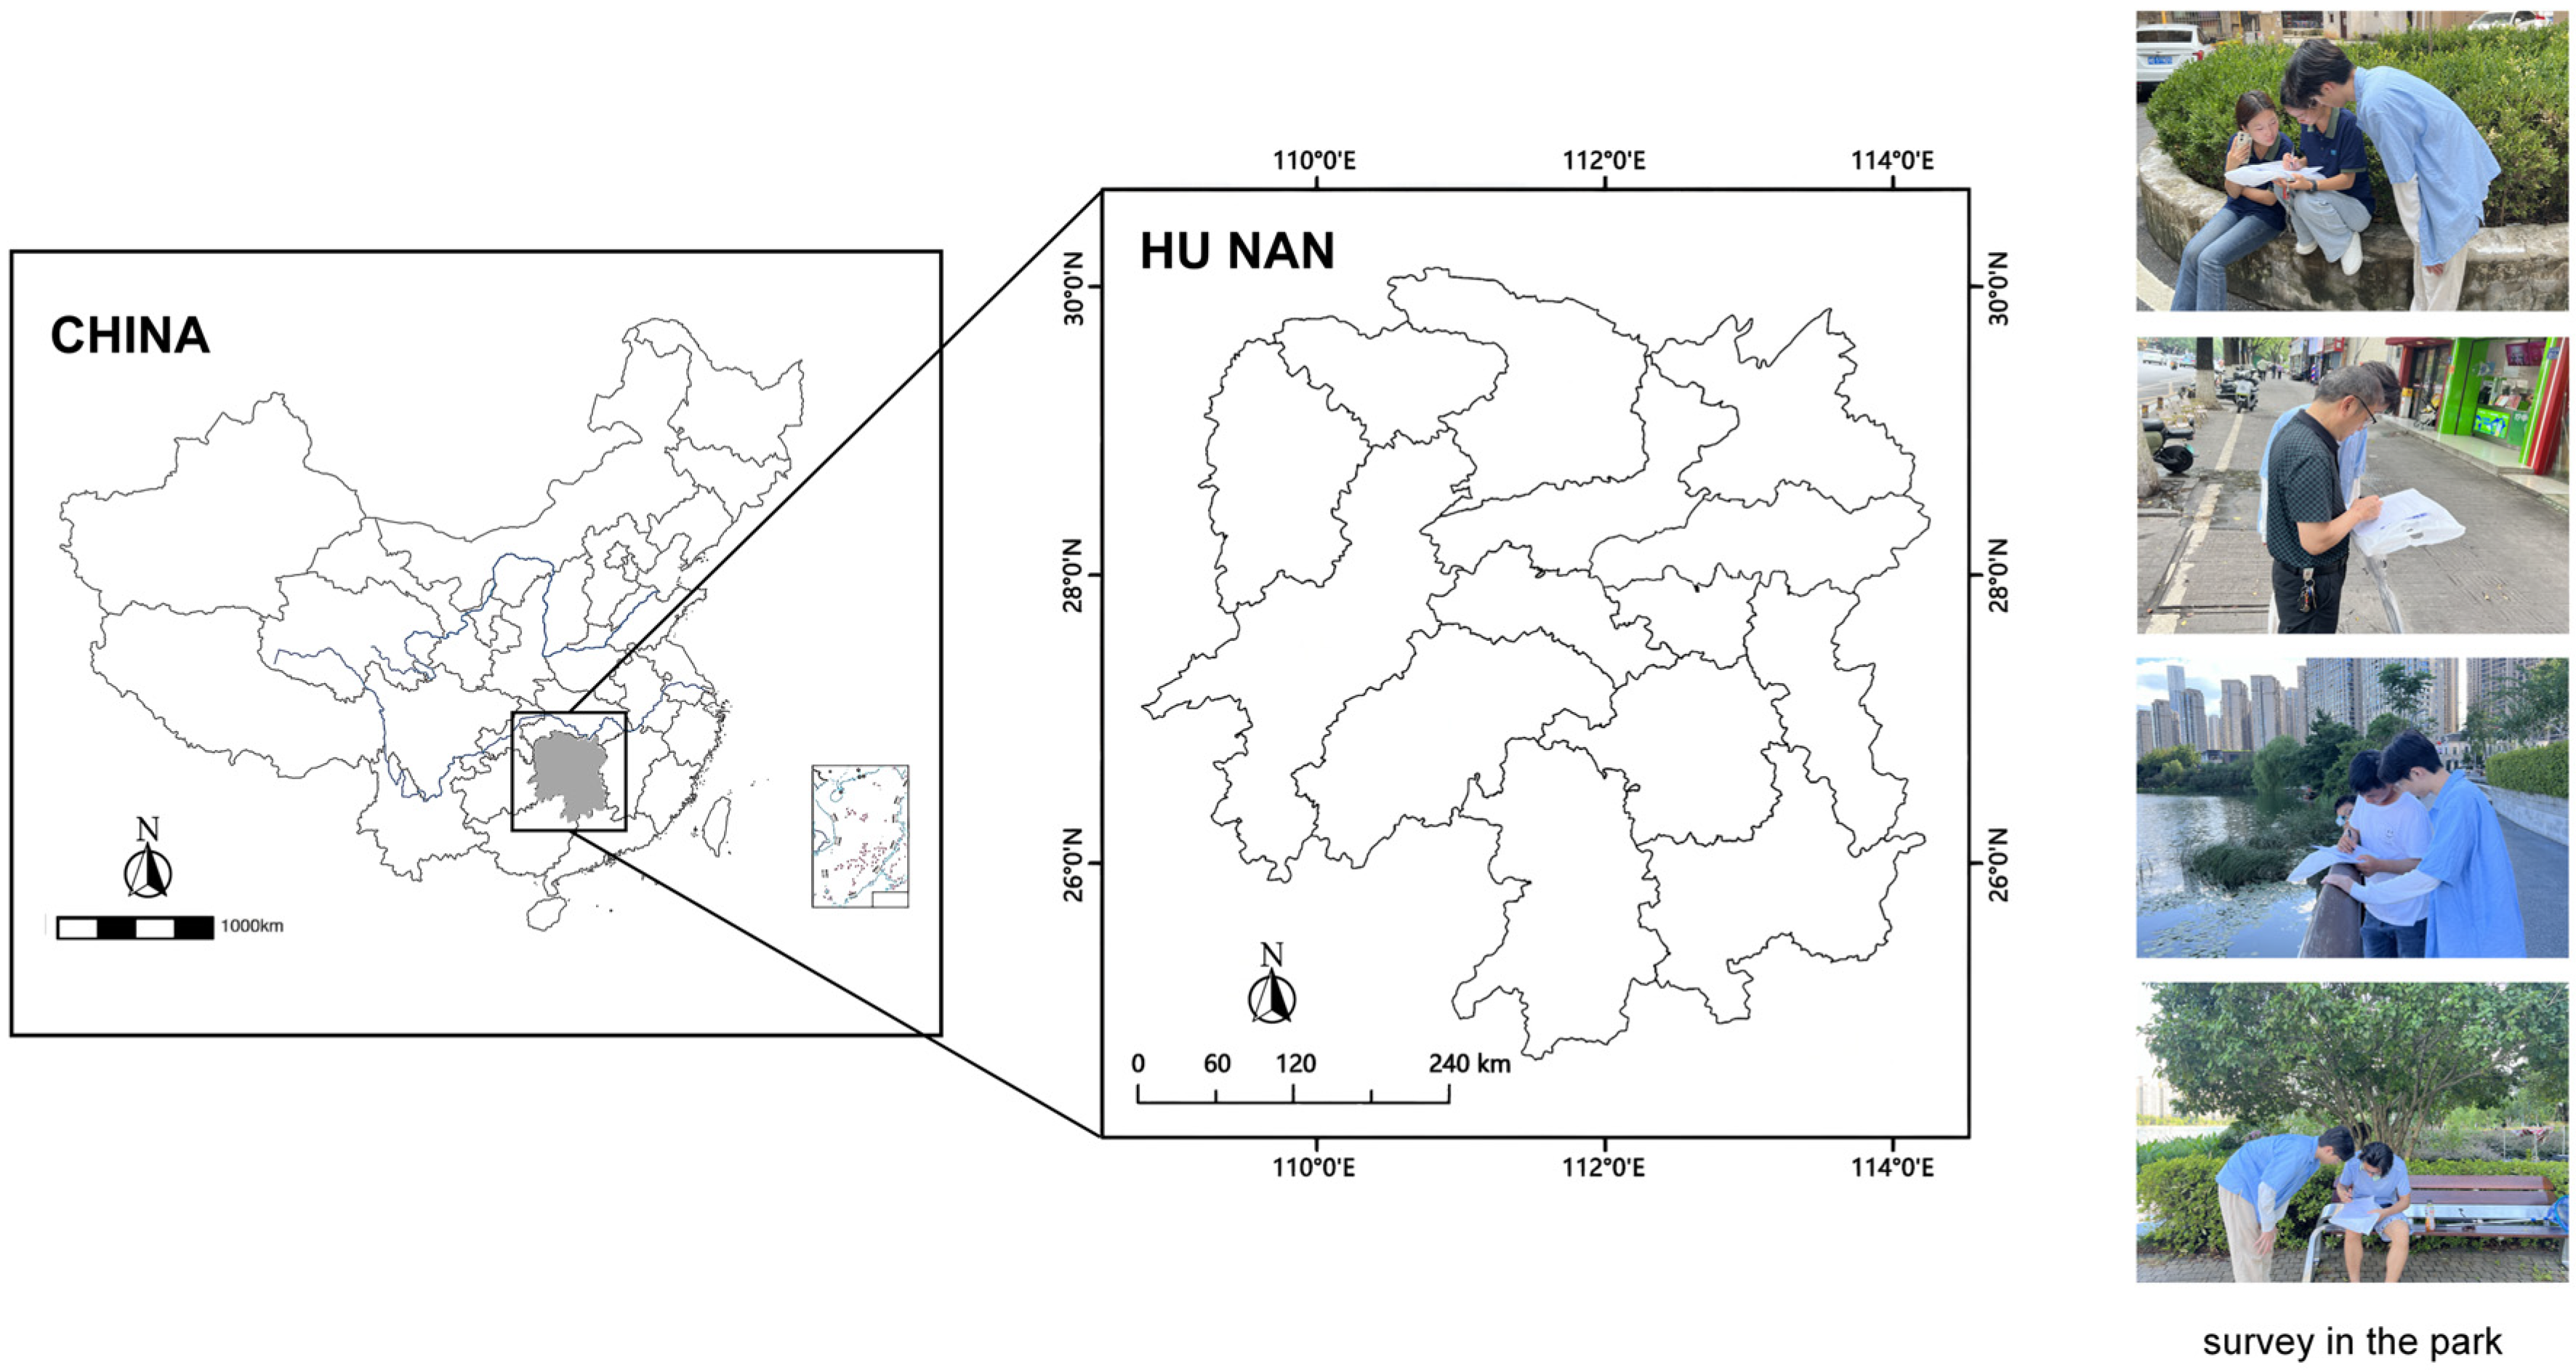
However, while these studies have revealed the role of green space equity in physical accessibility, sociodemographic influences, and public health, relatively few have systematically analyzed residents’ subjective perceptions and behavioral preferences. In particular, there is a lack of systematic exploration regarding how psychological and social mechanisms—such as environmental perception, sense of security, and neighborhood cohesion—mediate the relationship between green space equity and well-being. To fill this research gap, this study focuses on the equity of public green spaces at the community scale and investigates how it affects residents’ well-being through psychological and social mechanisms. Specifically, this study involves two core analytical steps: (1) constructing a structural equation model (SEM) to verify the impact of perceived public green space equity on well-being from the residents’ perspective, revealing how multi-level factors interact and shape the perception of green space equity, and (2) applying the random forest (RF) algorithm to identify key variables influencing residents’ preferences for public green space use in Hunan Province and analyze the effects of various factors on residents’ green space usage behavior. By integrating biophilic urbanism theory and the environmental justice framework, this study enhances the understanding of public green space equity and its social impacts, providing scientific support for urban planning and policy development and contributing to the fair and efficient allocation of urban green space resources.
4. Results
4.1. Results of the Sociodemographic Characteristics of the Participants
The results of the basic demographics indicated (
Table 2) that among the respondents, the proportion of males (56.2%) was slightly higher than that of females (43.8%). The main concentration was in the age group of 34–39 years, accounting for 30.9%. In the neighborhoods where the respondents resided, the majority of the respondents had a house price range of 5000–9999 CNY (59.5%). Regarding marital status, the majority of the respondents were married (88.6%). In terms of education, those with a bachelor’s degree were the most numerous (56.4%). In terms of the distribution of the respondents’ monthly income, it was mainly concentrated in the range of 6000–12,000 CNY, constituting 30.7% of the total number of respondents. In terms of housing status, the majority of the respondents (80.5%) owned commercial or self-built housing, demonstrating more stable living conditions. Renters accounted for 7.3%. With respect to the length of residence, the highest percentage of respondents (41.6%) had resided in a city or region for 1–3 years, indicating that a significant portion of the respondents had a relatively stable residence in a city or region. The proportion of respondents who had lived in a city or region for 6 months to 1 year was 15.6%, and the proportion of those who had lived in a city or region for 3–5 years was 15.7%, while the proportion of those who had lived in a city or region for a shorter period of time (less than 6 months) or a longer period of time (more than 5 years) was relatively small, accounting for 3.8% and 23.3%, respectively. The majority of the respondents (66.9%) considered their health condition average, suggesting that the respondents were generally neutral about their health condition.
In terms of green space usage (
Table 3), respondents were overwhelmingly positive about the adequacy of public green space near their neighborhoods. Among them, 30.3% of respondents fully agreed and 54.6% partially agreed, with the total of the two amounting to 94.9%. In terms of frequency of use, the proportion of respondents using the park 1–3 times per week is the highest, reaching 37.5%, showing that respondents have a certain regularity and frequency of using urban parks or community green spaces. In terms of length of stay, the proportion of respondents staying for 30 min to 1 h was the highest, at 51.4%. Among the respondents, the vast majority (84.5%) believed that the nearby urban parks or community green spaces were easy to reach on foot, indicating that the accessibility of urban parks or community green spaces is good for residents’ daily use and leisure activities.
In
Table 4, it can be clearly seen that residents’ expectations of rent increases due to the construction of a new city park near their neighborhood exhibit a skewed distribution. Nearly 40% of respondents (36.6%) predicted that rents would increase by 0.10–0.50%. Similarly, the expected increase in property prices also follows this distribution pattern, with nearly 30% of respondents (29.1%) anticipating a price rise of 0.10–0.50%. When asked about the additional budget they would be willing to pay for housing closer to green spaces, over 40% of respondents (48.9%) indicated a willingness to pay an extra 101–500 yuan, and about one-third of respondents (24.5%) were willing to pay an additional 501–800 yuan, indicating a high willingness to pay.
4.2. Reliability and Validity Analysis
The reliability and validity of the measurement model were assessed based on the valid data obtained from the questionnaire (see
Table 5). The results indicated that Cronbach’s α coefficients for the five potential variables—green space justice, perceived environment, well-being, perceived safety, and neighborhood cohesion—ranged from 0.753 to 0.866. These values suggest acceptable reliability and meet conventional criteria (with α > 0.7 generally considered indicative of good reliability) [
84]. Furthermore, the Composite Reliability (CR) for each potential variable ranged from 0.702 to 0.853, all exceeding the threshold of 0.70 and thus reaching an acceptable level [
84]. Additionally, the Average Variance Extracted (AVE) values for each potential variable were greater than 0.500 [
84], demonstrating that each construct within the scale possesses strong reliability and validity and can effectively measure the intended constructs. In summary, the questionnaire exhibited robust performance in terms of both reliability and validity, making it suitable for further analysis.
4.3. SEM Results
The hypothetical model’s fit was verified in this study using the maximum likelihood method. The fit indices of the final model following fitting correction are presented in
Table 6. Based on the data in
Table 5, it can be observed that the primary fit indices of this study fall within the recommended acceptable range, suggesting a good model fit [
85].
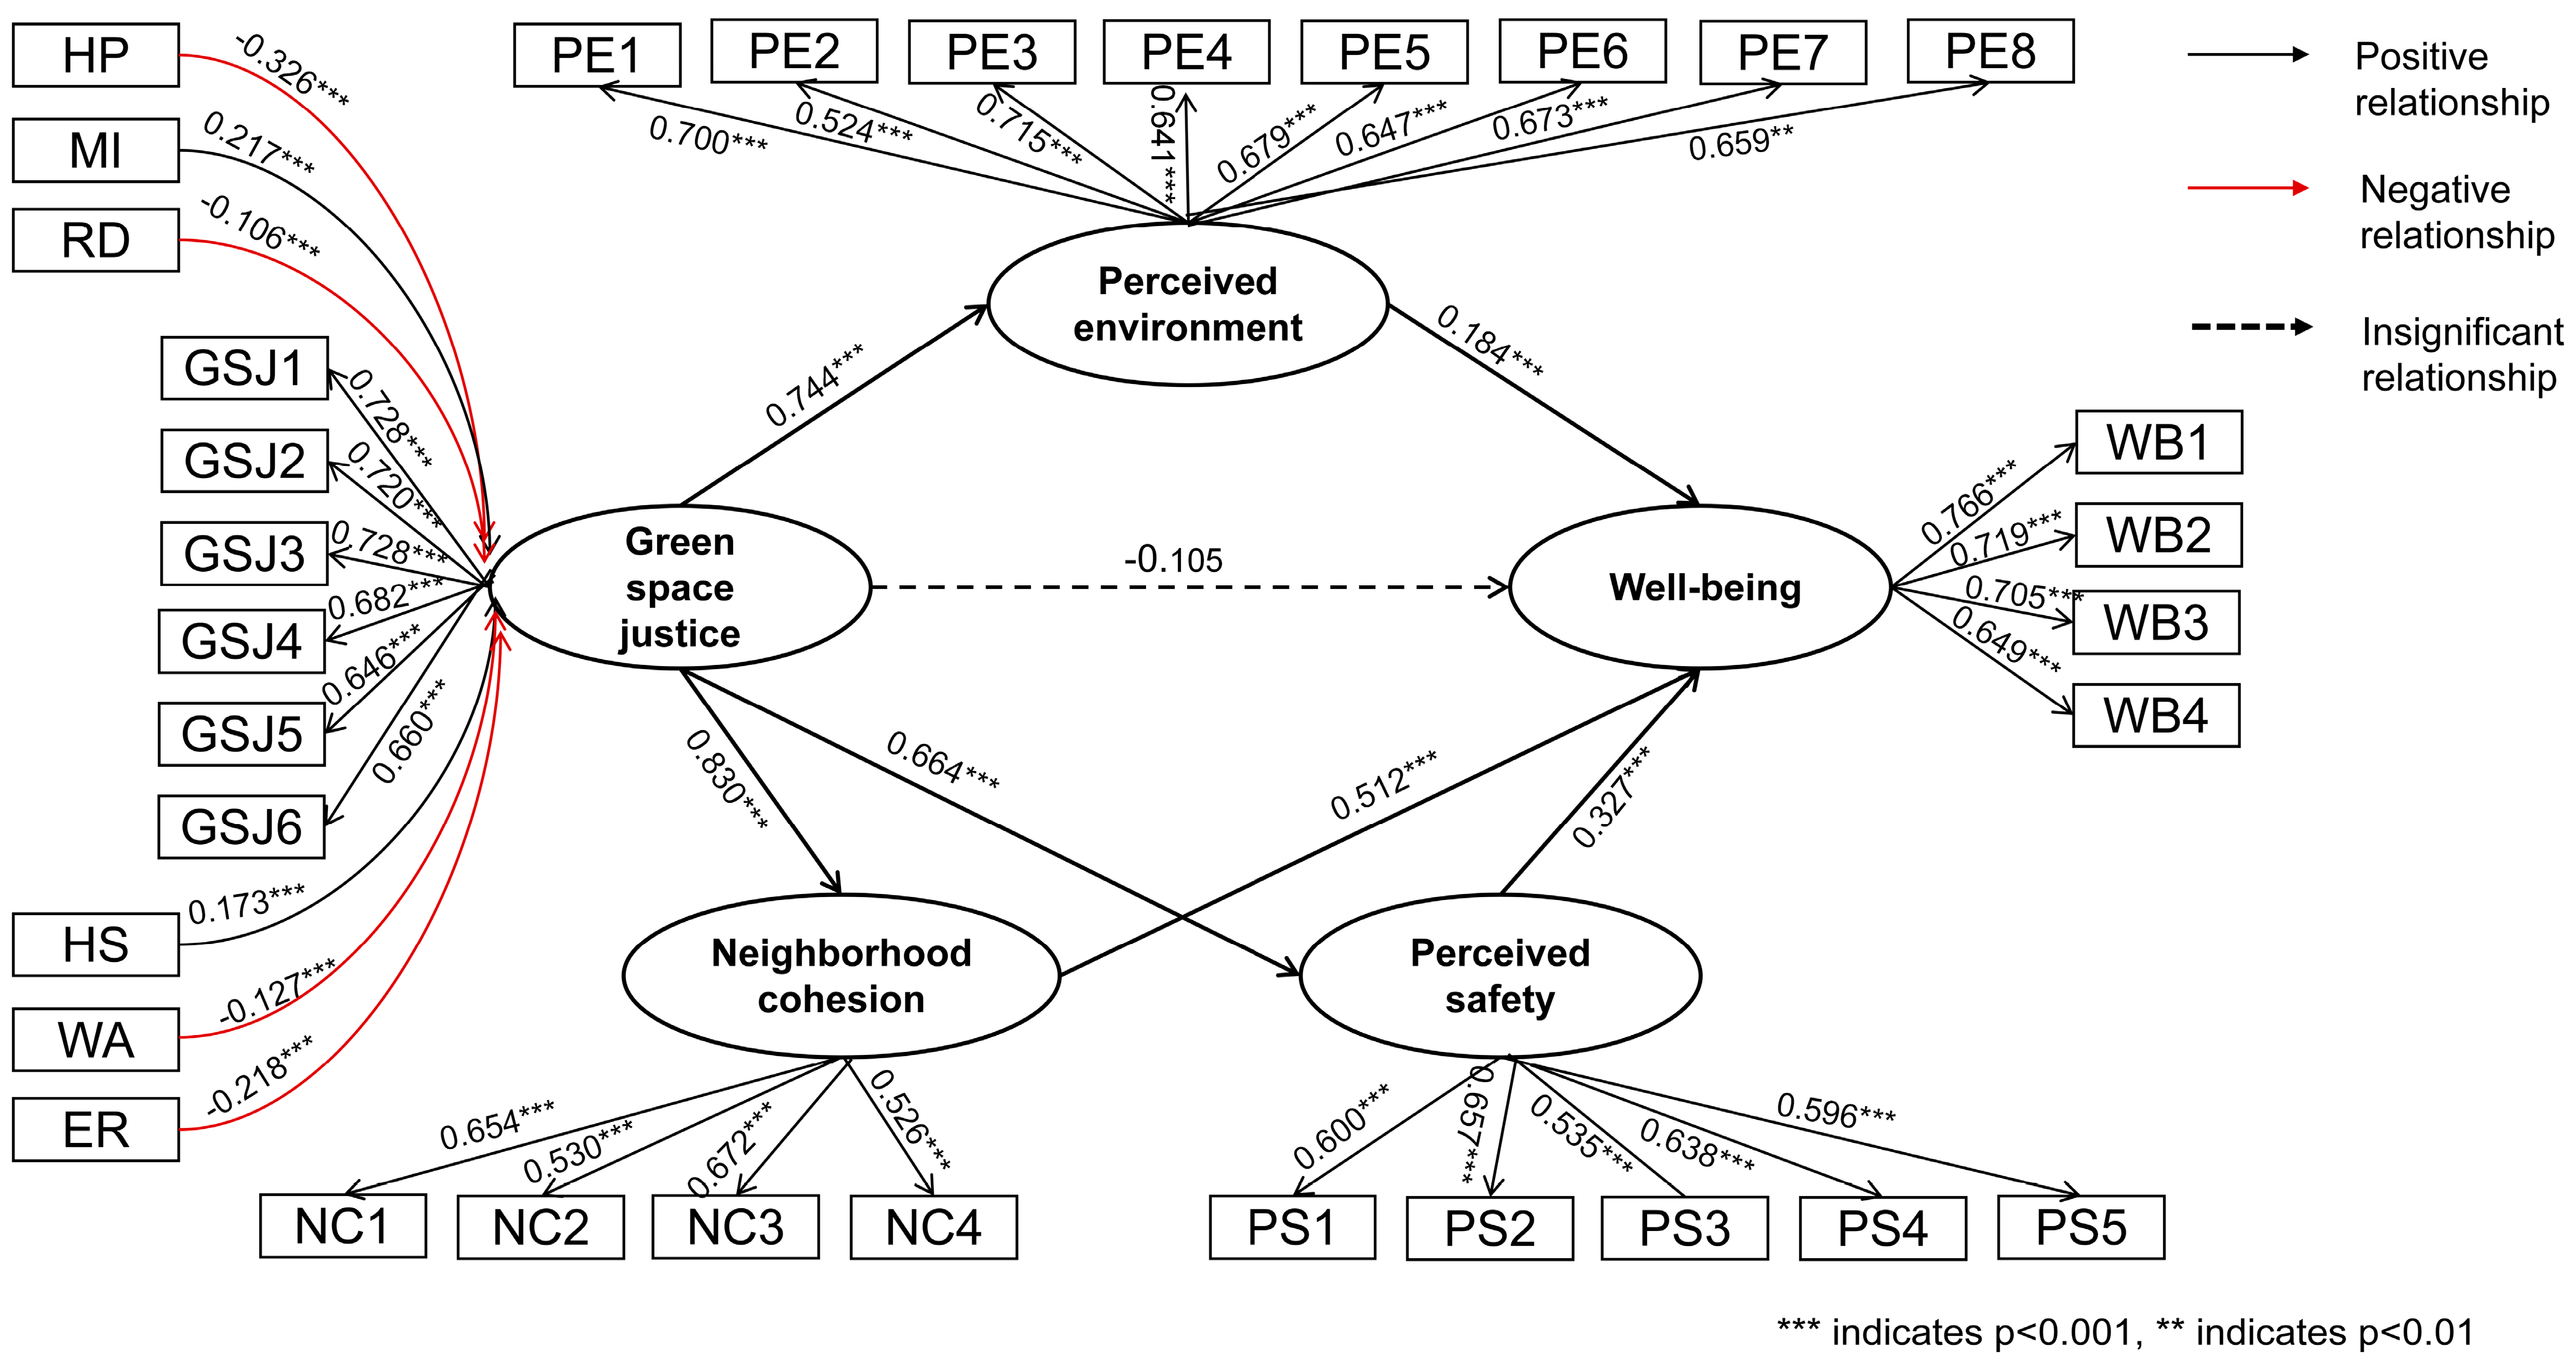
The hypotheses of the research model were tested using AMOS. The standardized path coefficients between latent variables and their significance are presented in
Table 7 and
Figure 4. Both the structural model, representing the hypothesized relationships, and the measurement model, defining the relationship between latent variables and their indicators, were estimated. As shown in
Table 8, the factor loadings of all measured indicators exceed the acceptable value of 0.5 [
86]. The path coefficients (γ) and their significance levels can be interpreted as follows:
When the path coefficient (γ) is positive, it indicates a positive relationship or direct effect between the variables, meaning that an increase in one variable leads to an increase in another. When the path coefficient (γ) is negative, it indicates a negative relationship or inverse effect, where an increase in one variable leads to a decrease in another. A path coefficient with a p-value greater than 0.05 suggests that the relationship between the variables is not statistically significant.
In the results, green space justice had significant positive effects on perceived safety (γ = 0.664, p = 0.001), perceived environment (γ = 0.744, p = 0.001), and neighborhood cohesion (γ = 0.830, p = 0.001). These factors, in turn, significantly influenced happiness, with perceived safety (γ = 0.327, p = 0.001), perceived environment (γ = 0.184, p = 0.001), and neighborhood cohesion (γ = 0.512, p = 0.001) all showing positive effects on happiness. However, green space justice itself did not significantly impact happiness. Additionally, housing price (γ = −0.326, p = 0.001), length of residence (γ = −0.106, p = 0.001), and projected rent premium (γ = −0.218, p = 0.001) had significant negative effects on the fairness of green space, while monthly income (γ = 0.217, p = 0.001) and personal health status (γ = 0.173, p = 0.001) had significant positive effects on green space justice.
4.4. Mediating Effect
The bootstrap method was used to evaluate the mediating effect, and the estimates were derived based on the bias-corrected interval. A statistically significant mediating effect is indicated if the 95% confidence interval (95% CI) for the indirect effect does not include zero. The model produces both direct and aggregate indirect effects (see
Table 9).
Table 9 shows that the 95% CI values of “green space justice → environmental perception → happiness”, “green space justice → security perception → happiness” and “green space justice → neighborhood cohesion → happiness” do not contain zero, indicating that there is a significant mediating effect in these paths.
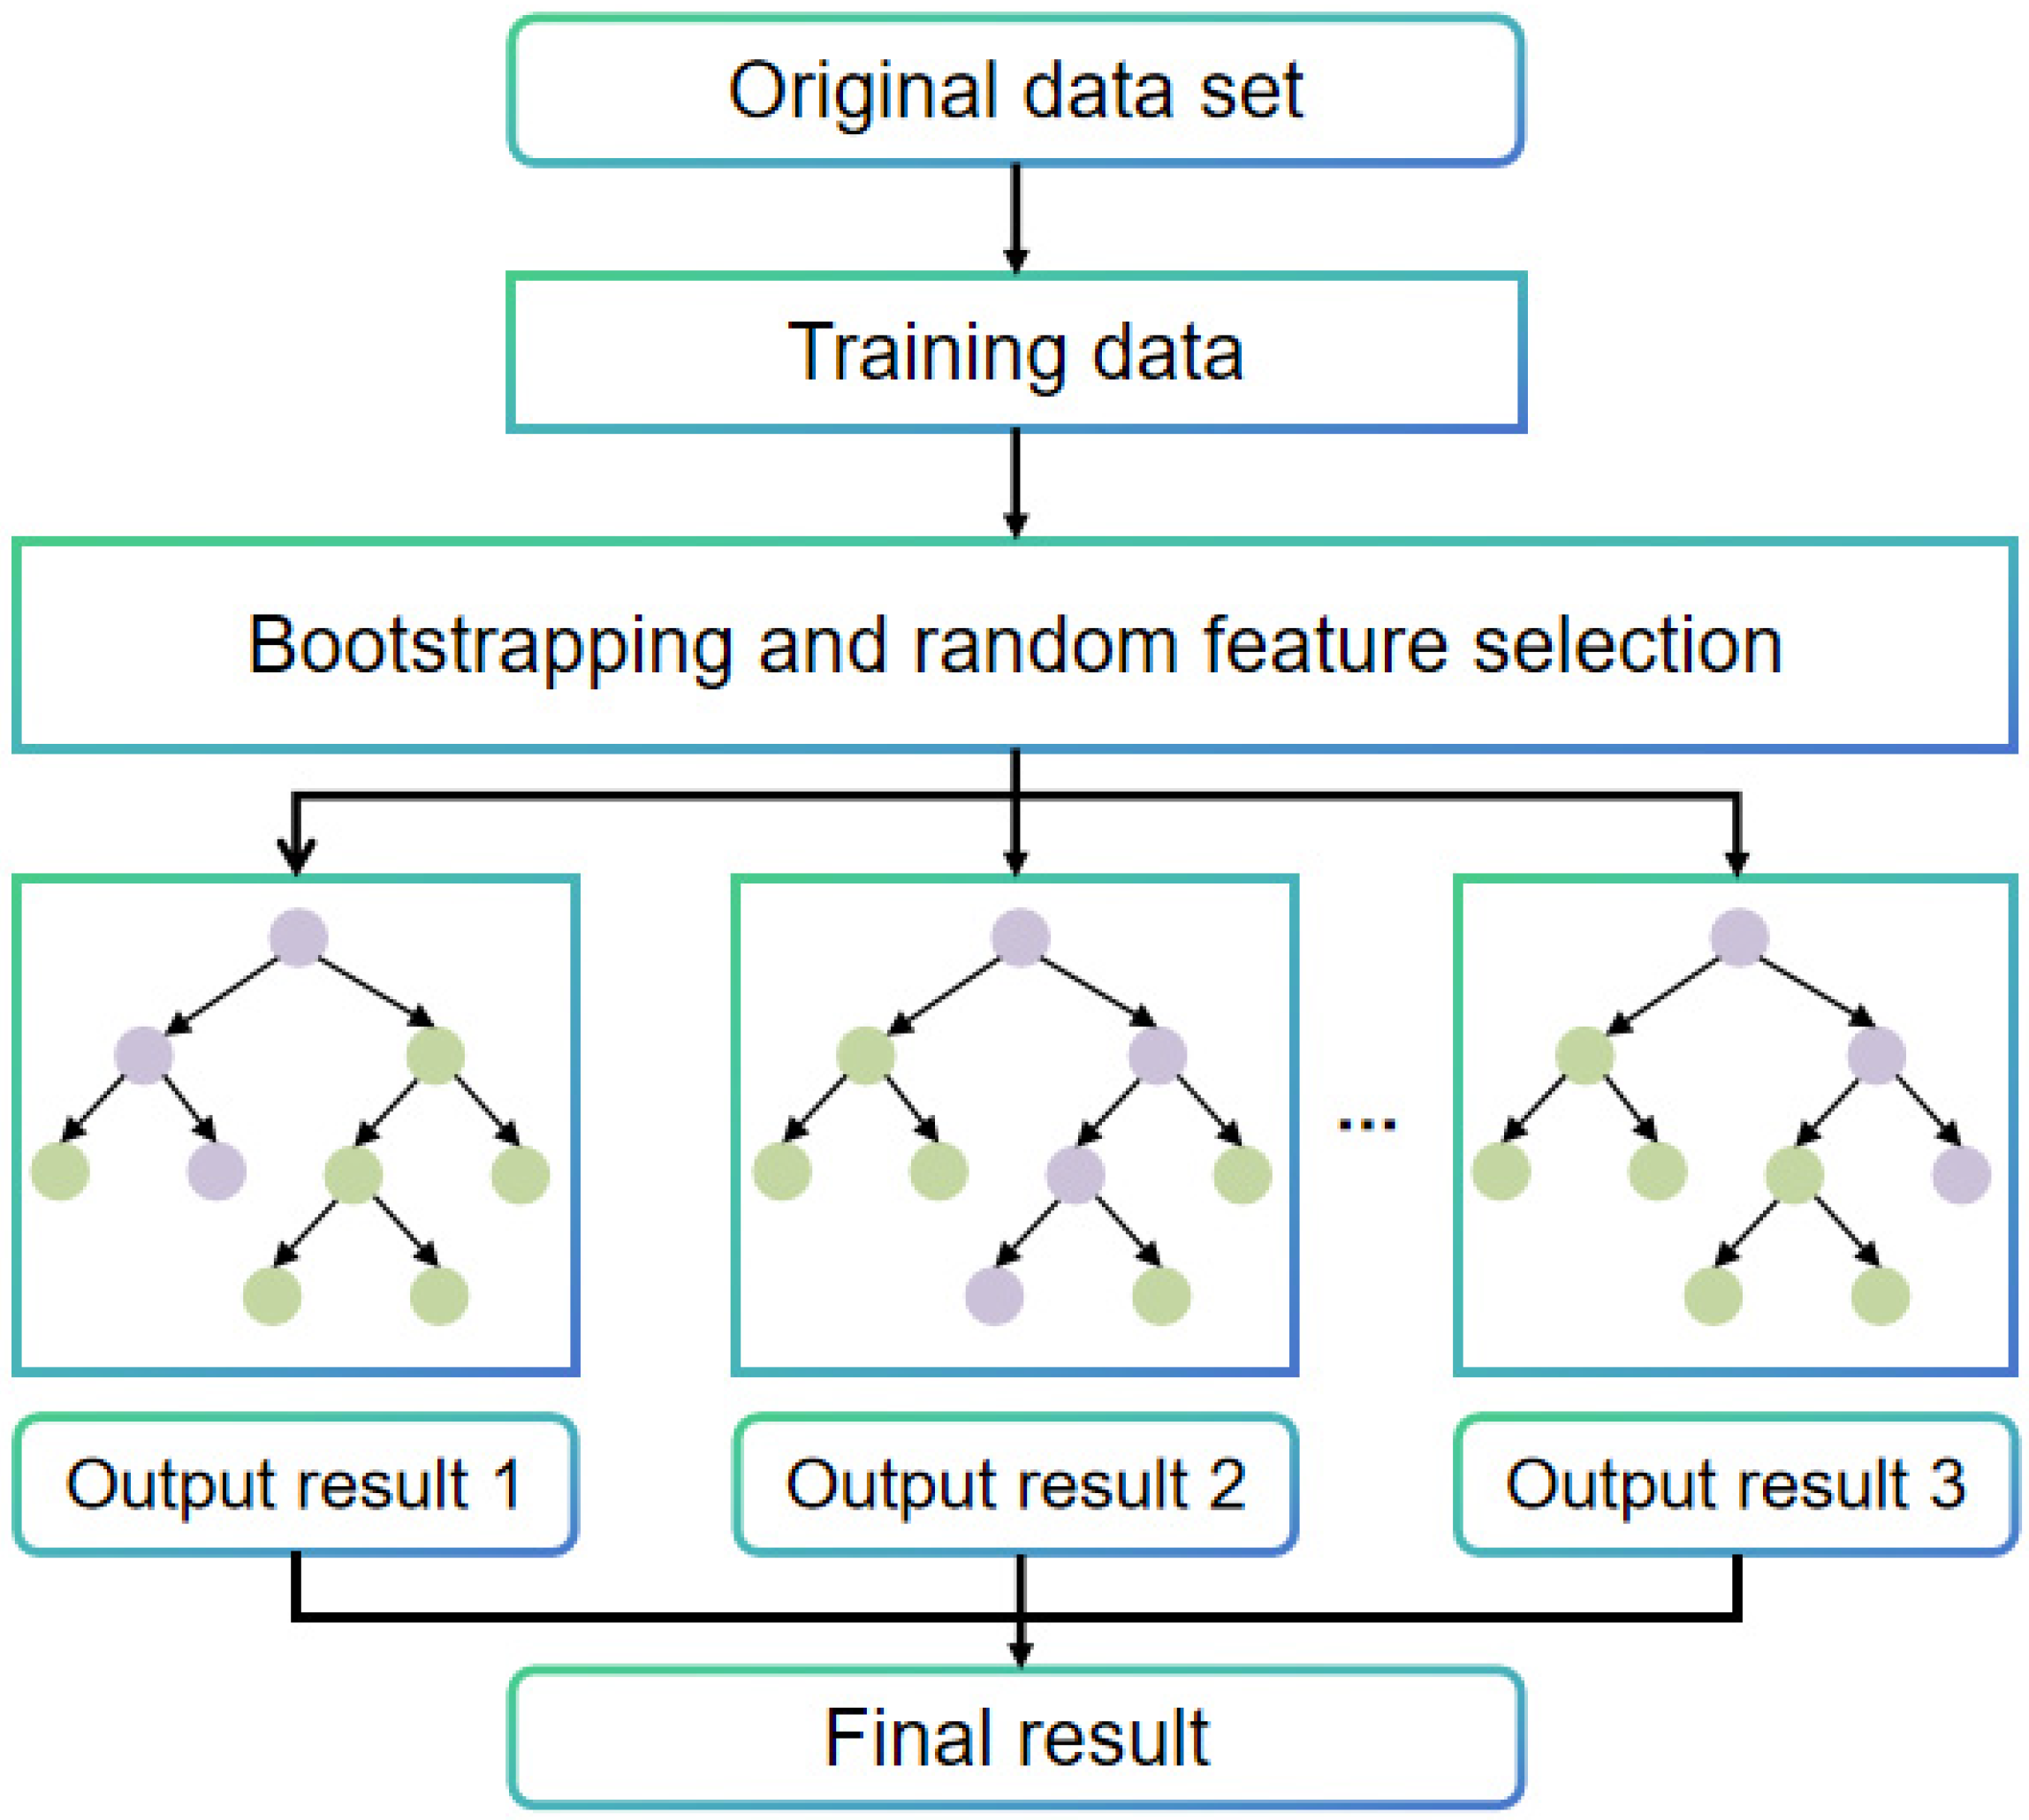
4.5. Green Space Preferences: Determinants and Relative Importance
To explore the factors influencing residents’ preferences for park usage, “the frequency of residents’ use of nearby urban parks or community green spaces” and “the duration of residents’ stay in these areas” were selected as indicators of their preference for public green spaces. A random forest model was employed to assess the impact of these factors on park usage preferences and identify the most significant features contributing to the predictions. The dataset was divided into a training set and a test set in an 80:20 ratio; 80% of the samples were used for training, while 20% were reserved for validation. The model’s overall accuracy for predicting “the frequency of residents’ use of nearby urban parks or community green spaces” was 67.5%, with a prediction accuracy of 83.2%. For predicting “the duration of residents’ stay in nearby urban parks or community green spaces”, the overall accuracy was 60.2%, with a prediction accuracy of 77.0% (
Figure 5).
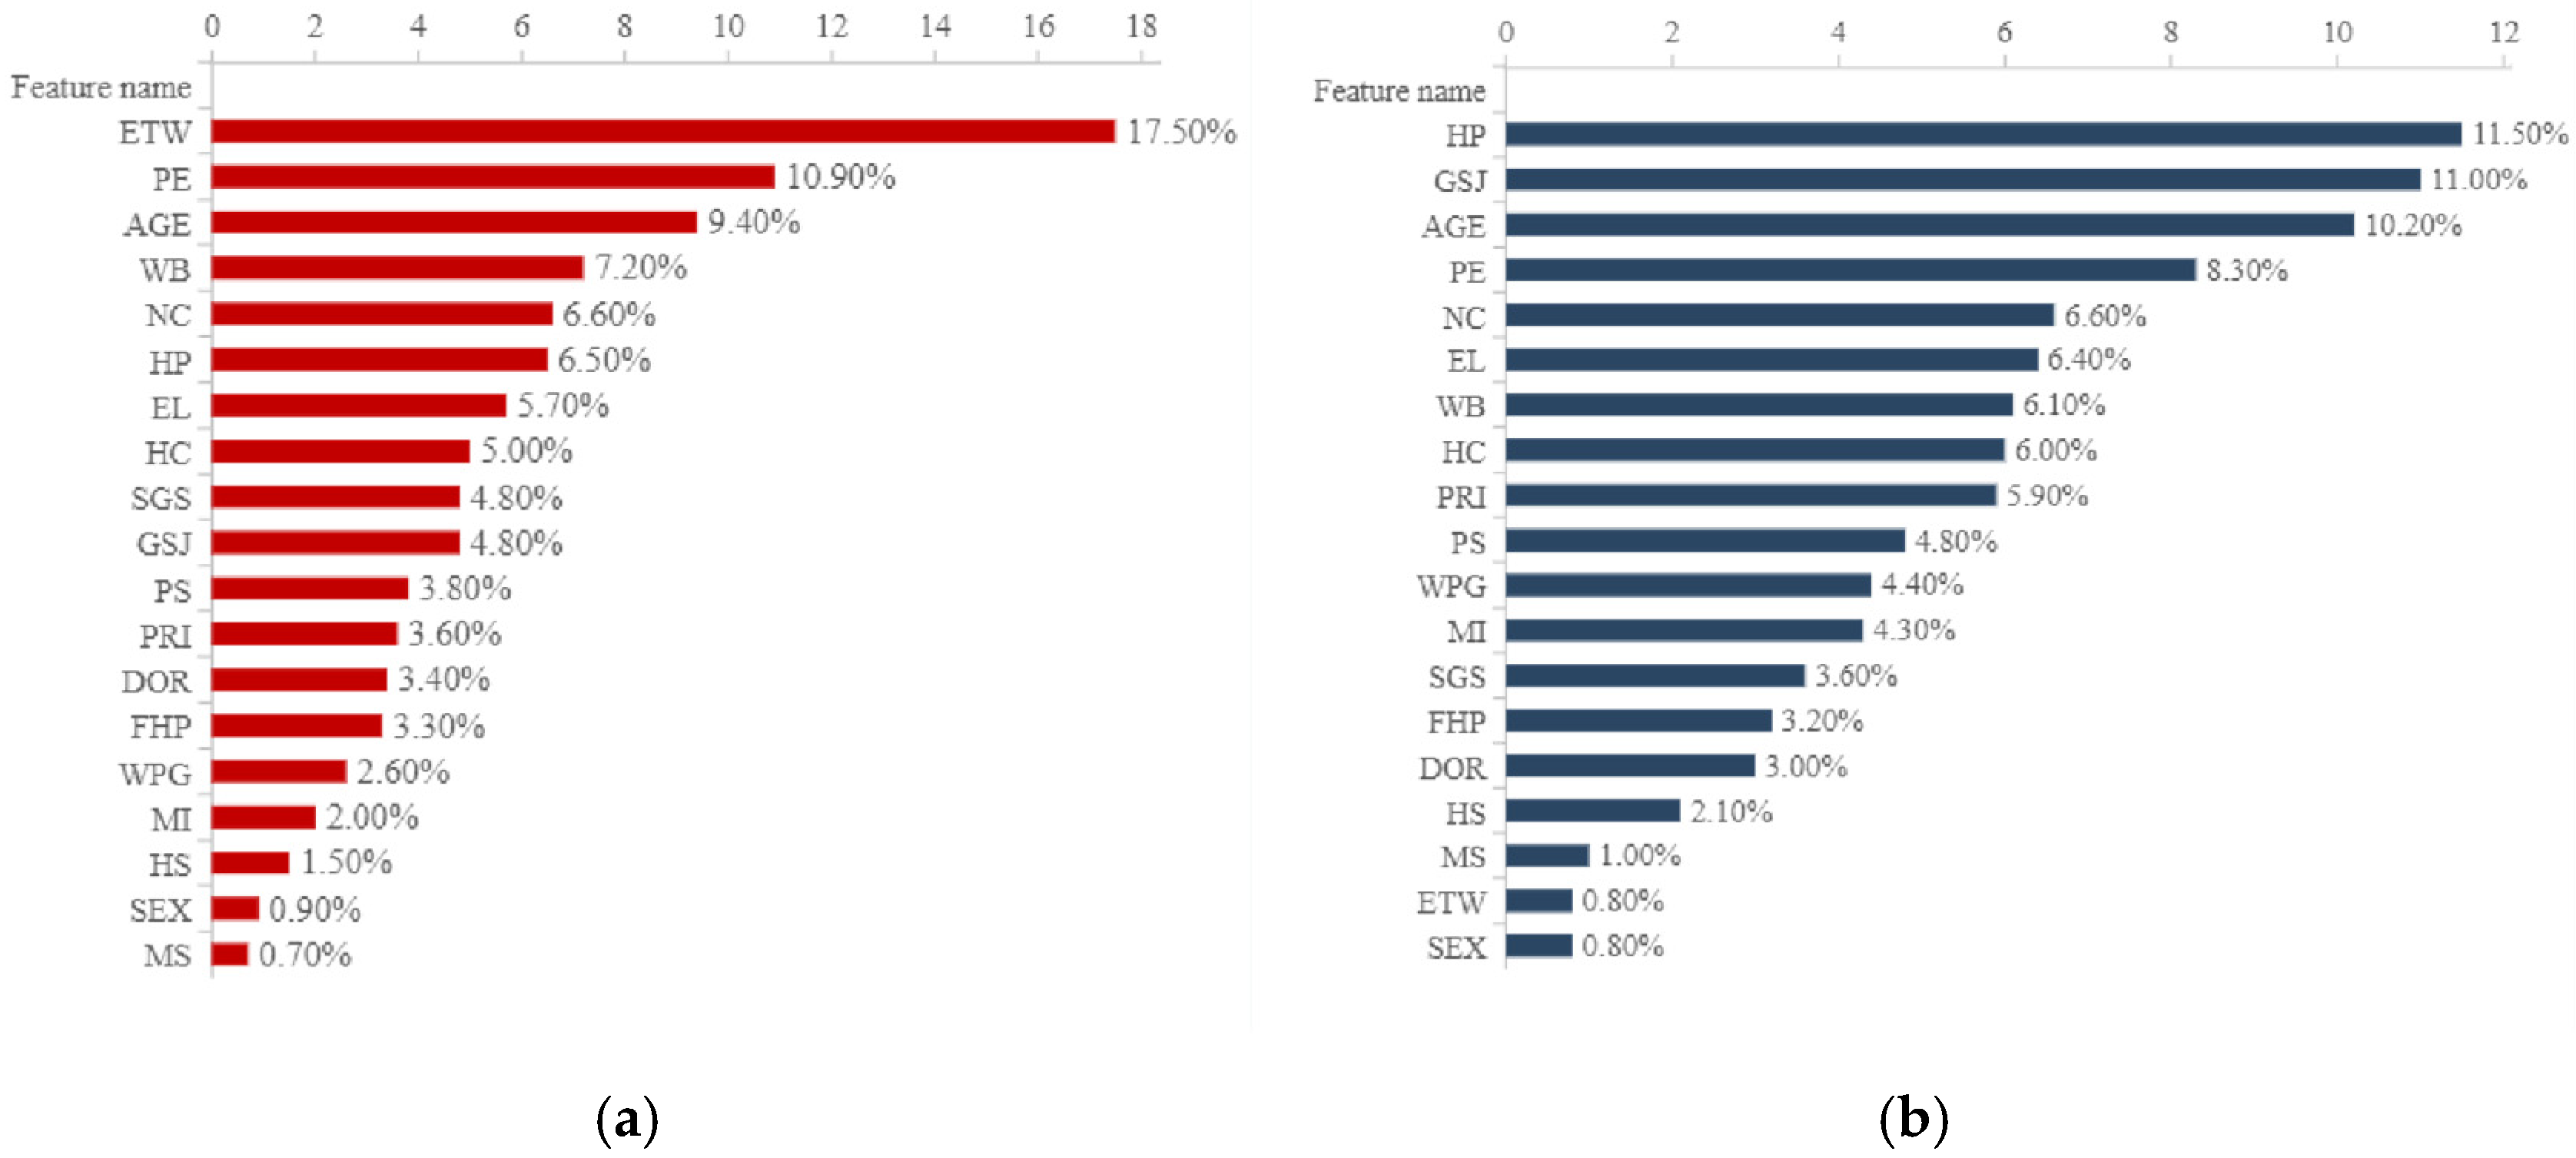
The random forest model also assessed the importance of each variable. For predicting “the frequency of residents’ use of nearby city parks or community green spaces”, the most influential variables were ease of walking (17.5%), green space justice (11.0%), and age (10.2%). In the model predicting “the duration of residents’ stay in nearby city parks or community green spaces”, the top factors were housing price (11.5%), environmental perception (10.9%), and age (9.4%). The analysis reveals that, among social background factors, age is the most significant determinant, while housing price is the key factor among residential environmental influences, and anticipated rent increases play a notable role in market factors.


