

Quantitative Evaluation and Driving Forces of Green Transition of Cultivated Land Use in Major Grain-Producing Areas—A Case Study of Henan Province, China


Abstract
1. Introduction
2. Theoretical Framework for GTCL
3. Materials and Methods
3.1. Study Area
3.2. Data Sources
3.3. Methods
3.3.1. Entropy Weight Method
3.3.2. Spatial Autocorrelation Model
3.3.3. Geographic Detector Model
4. Results
4.1. The Index of GTCL
4.2. Spatiotemporal Characteristics of GTCL
4.2.1. The Spatiotemporal Differences in GTCL
- (1)
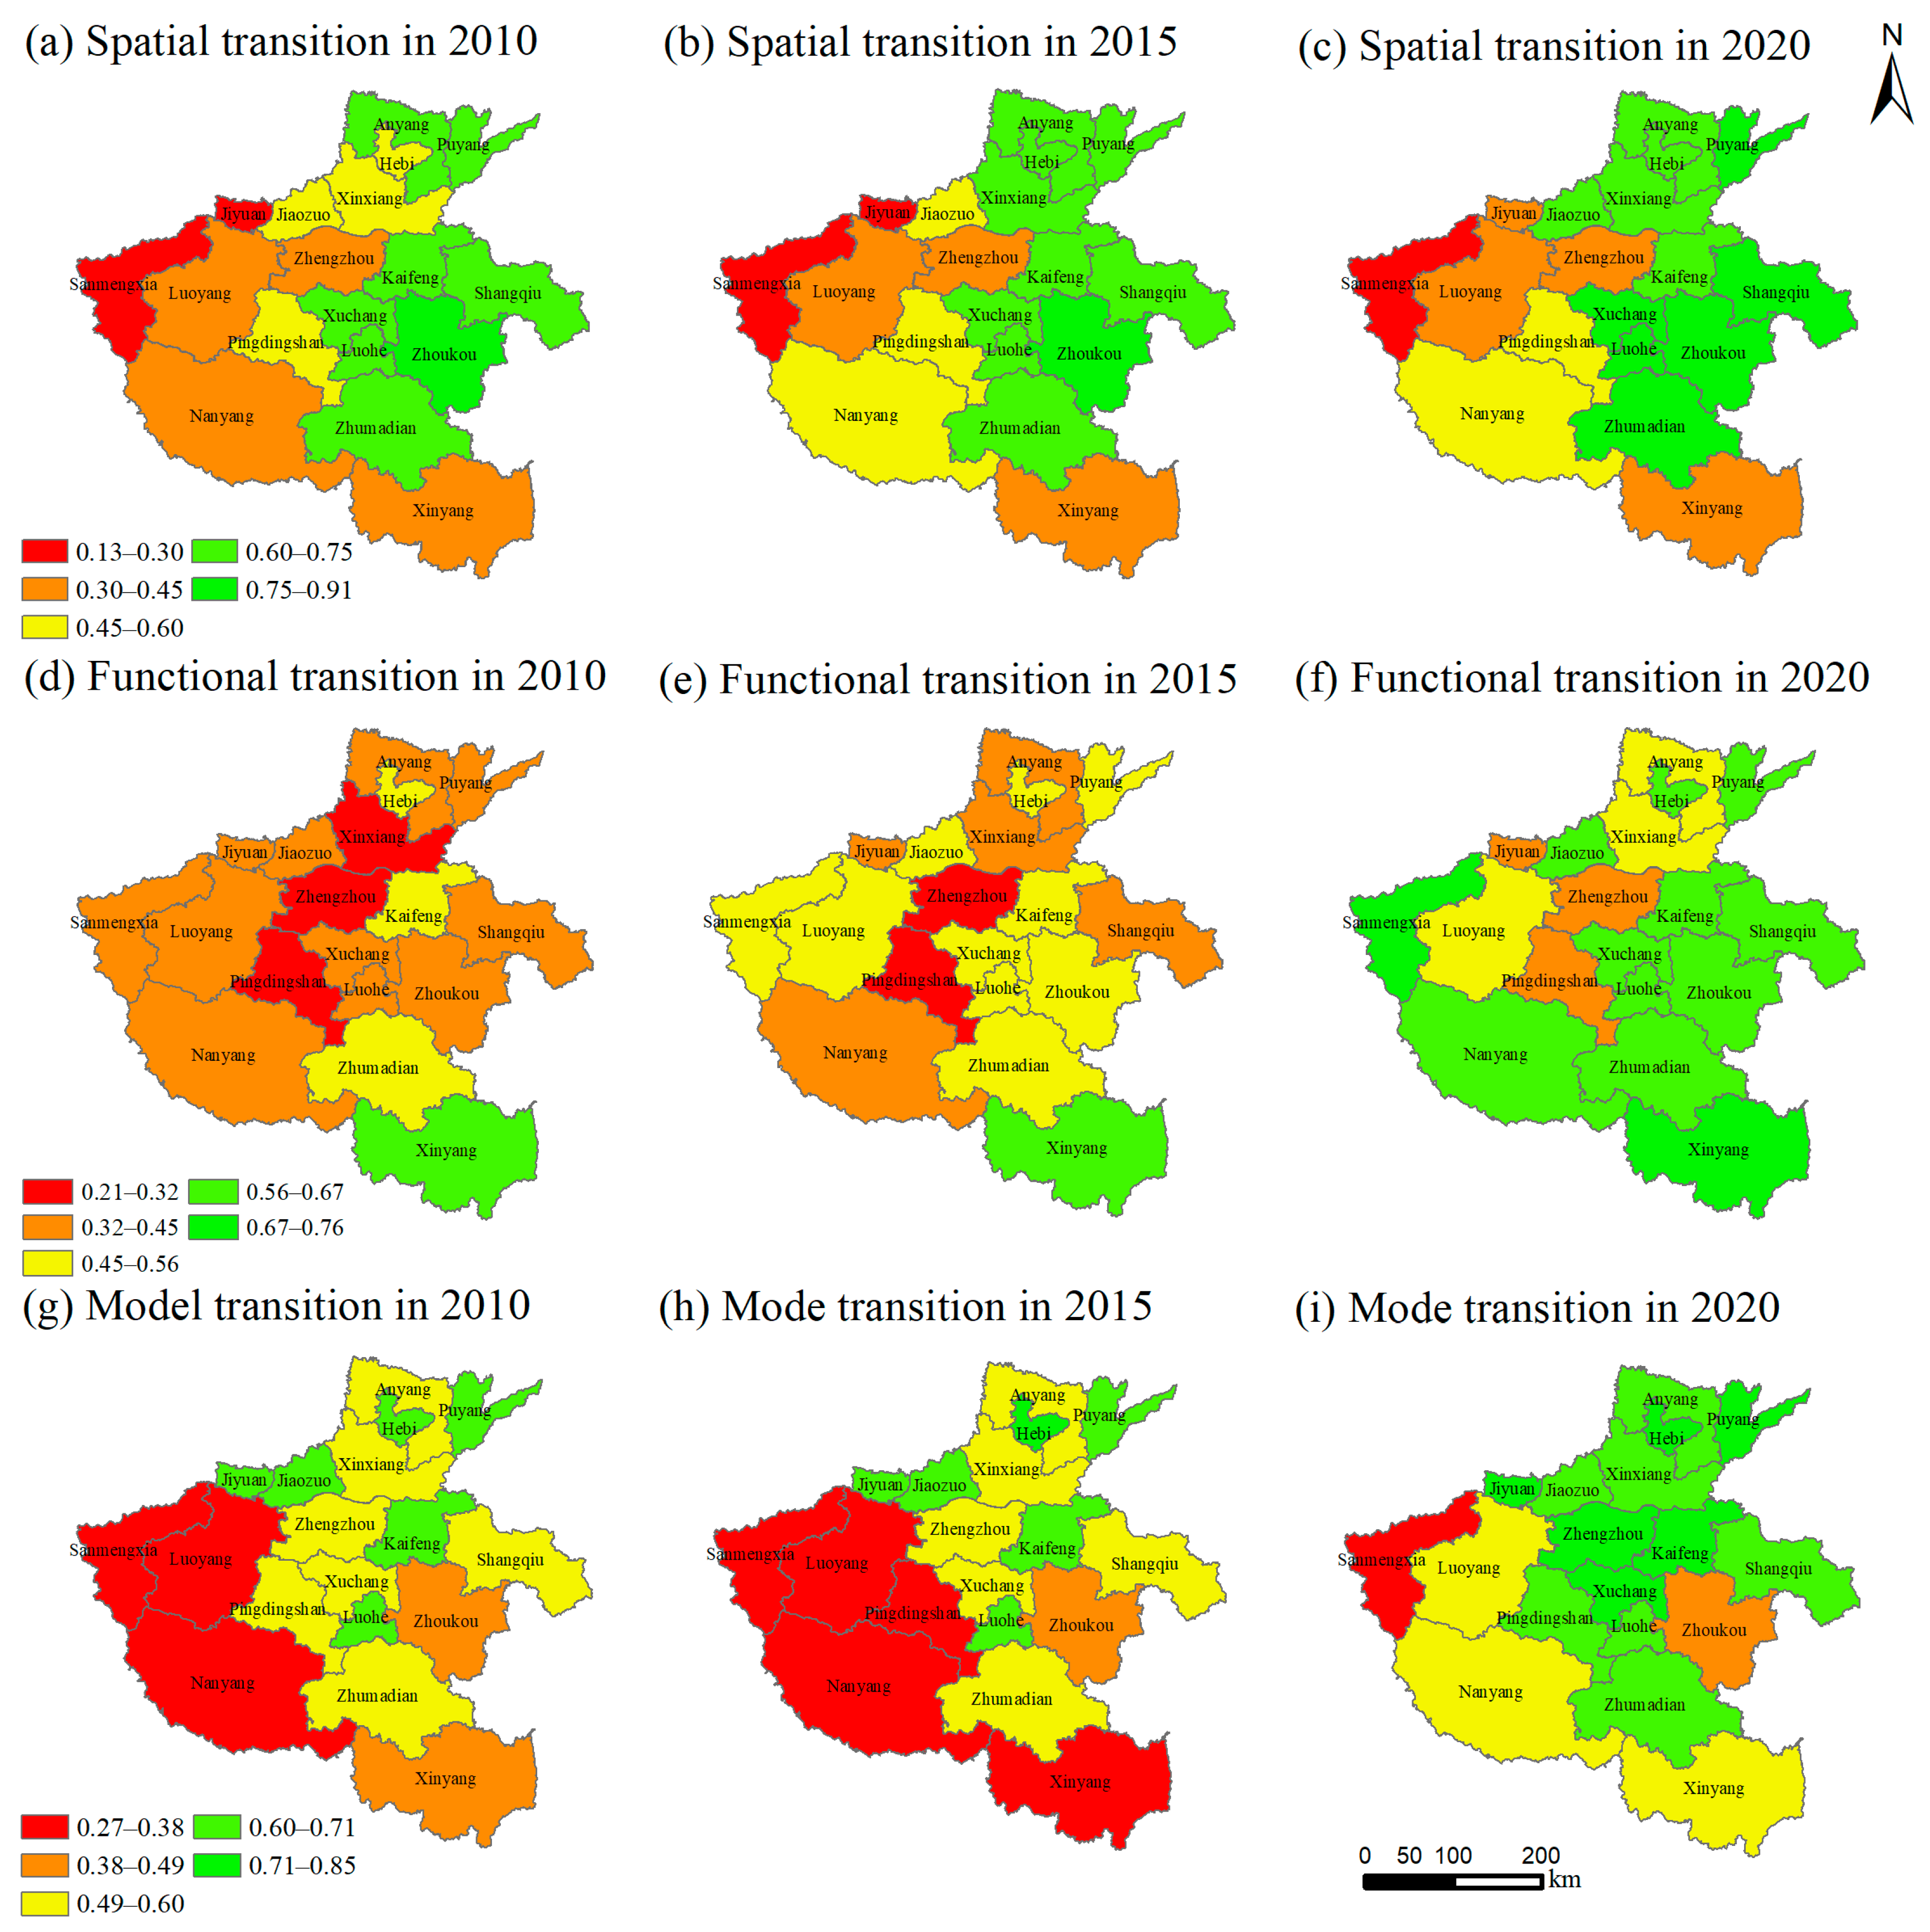
- Spatial transition: the spatial transition presents a difference in being higher in the northeast and lower in the southwest. The spatial transition index values of places such as Sanmenxia and Luoyang in the west have been consistently low, while Zhoukou in the east has been consistently high. The spatial transition index of various cities has generally increased, with an average increase of 0.10, among which Zhoukou, Xuchang, and Puyang show the most significant growth.
- (2)
- Functional transition: the overall trend of functional transition is high in the south and low in the north. The functional transformation index values of Zhengzhou and Pingdingshan have always been low, while the value of Xinyang in the south has always been high. The functional transformation index of various cities in Henan province has grown significantly, with an average increase of 0.18. Among them, the growth rates of Sanmenxia, Jiaozuo, and Shangqiu have all exceeded 0.2.
- (3)
- Mode transition: mode transition presents a spatial pattern of high in the north and low in the south. The model transition index values of Sanmenxia, Nanyang, and Luoyang in the southwest have always been low, while the values of Puyang, Hebi, and Jiyuan in the north have always been high. Unlike spatial transition and functional transition, the model transition index of various cities in Henan province has not been consistently increasing. From 2010 to 2015, the model transition index values of eight cities including Xinyang, Sanmenxia, and Pingdingshan showed a decline, but by 2020, the values of each city had shown a significant increase. The average value of the model transition index in various cities from 2010 to 2020 increased by 0.11, with Zhengzhou, Xuchang, and Luoyang showing the largest growth.
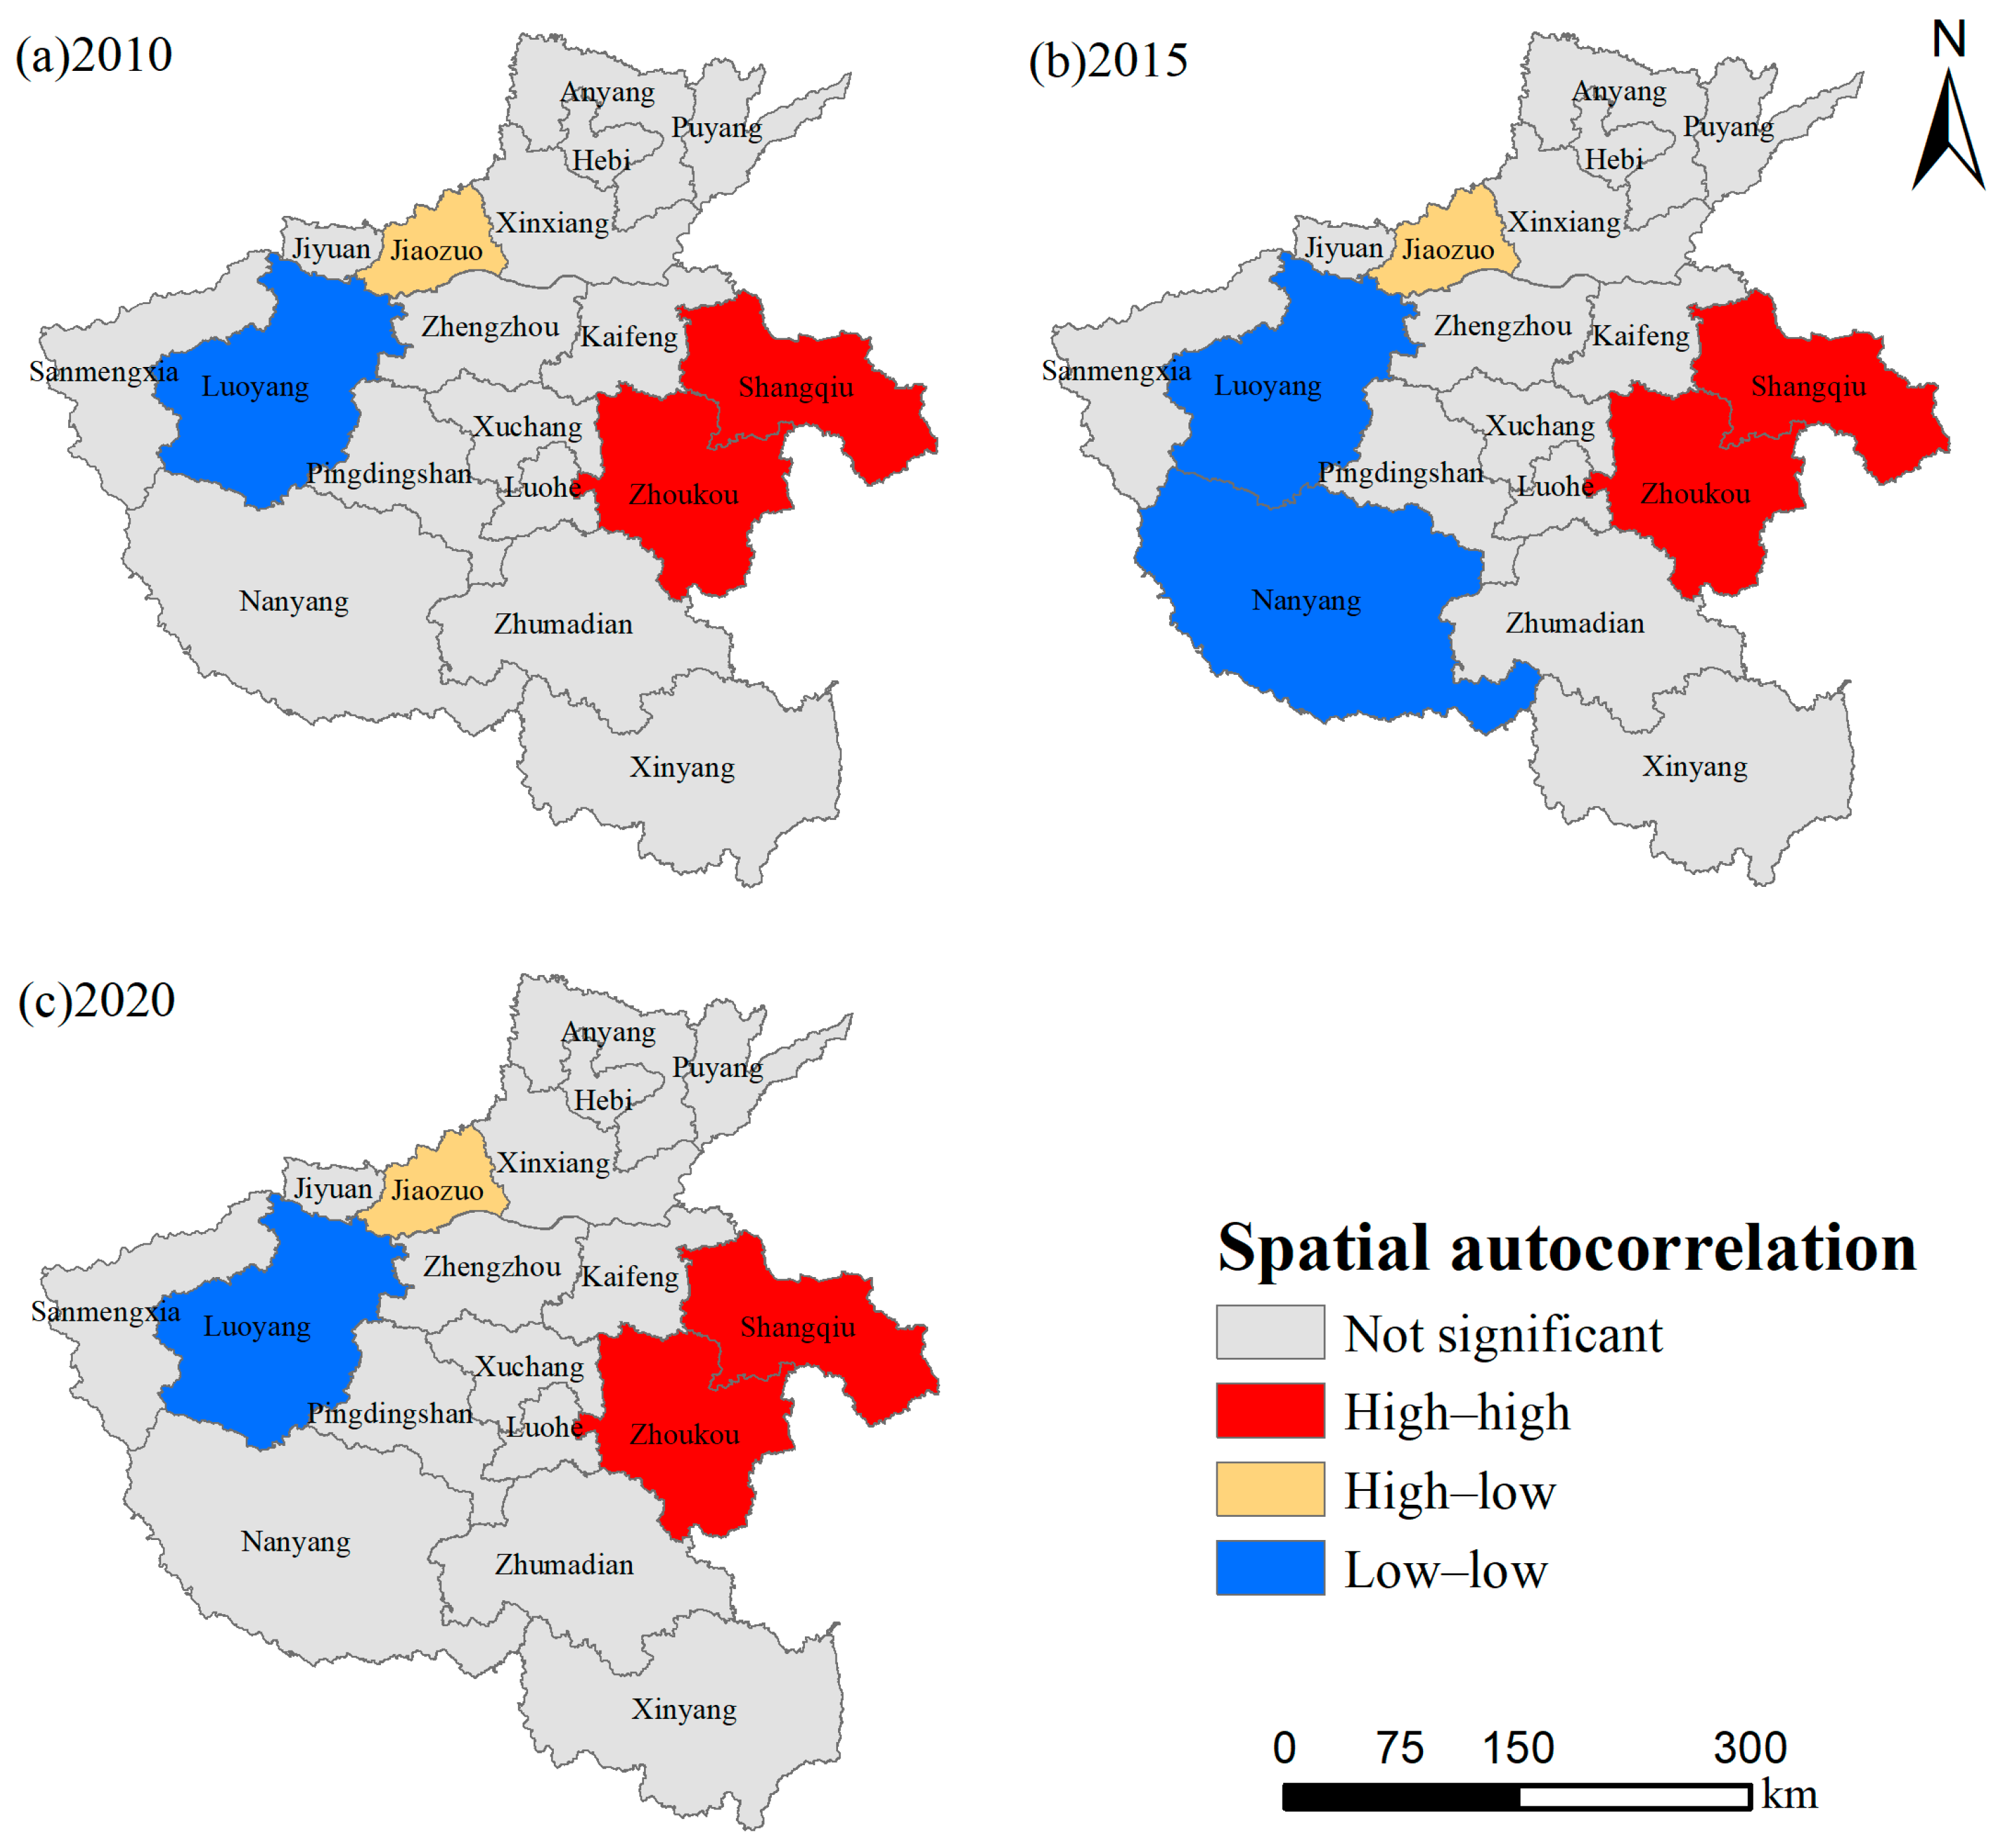
4.2.2. The Spatial Agglomeration of GTCL
4.3. The Driving Factors for the GTCL
4.3.1. Selection of Driving Forces
4.3.2. Driving Forces for GTCL
5. Discussion
5.1. The Effectiveness and Evolution of GTCL
5.2. Implications for Cultivated Land Green Use
- (1)
- Strengthen the linkage effect and coordination relationship among the three subsystems of space, function, and mode of GTCL. The GTCL in Henan province is constantly advancing, but there is still room for improvement. It should actively seek a balancing point between the spatial, functional, and mode transitions of cultivated land and the productivity of cultivated land, refine the design of green transition paths for cultivated land utilization, and maximize the linkage effects between various subsystems. Various cities in Henan province should improve the mechanism for green utilization of cultivated land, promote green agricultural production, and stimulate the coordinated development of spatial, functional, and systematic transitions of cultivated land utilization.
- (2)
- Implement differentiated green utilization strategies for cultivated land that are tailored to local conditions. For example, the green transition process of cultivated land utilization in cities such as Zhengzhou and Luoyang, which have developed urbanization and industrialization, is relatively slow, while cities such as Zhumadian and Zhoukou, which are relatively economically backward, are leading in the process of GTCL. For cities with a developed industrial economy and urbanization, it is necessary to transform the agricultural development according to actual land demand, introduce ecological and organic agriculture from the perspective of regional food ecological security to internalize the external costs of occupying cultivated land, strengthen cultivated land protection through optimizing the green utilization mode and functional transition of cultivated land, and change the situation where the ecological service value of cultivated land is lower than the price of agricultural products. For cities with a high proportion of agricultural output value, it is necessary to promote the transition of agricultural production from traditional agriculture to modern agriculture, balance ecological and economic benefits, and achieve coordinated development between humans, land, and ecology.
- (3)
- Stimulate the intrinsic vitality of the driving mechanism for GTCL. Economic and social factors are the main driving forces for the GTCL. Only by ensuring the stable development of agricultural production can they provide impetus for the GTCL. It should continue to promote the upgrading of ecological technology in agricultural production, strictly constrain the utilization mode of cultivated land with low ecological benefits, and give full play to the role of agricultural technology in promoting the GTCL. It should enhance agricultural mechanization to promote the efficient utilization of cultivated land, stimulating the driving role of economy, society, environment, and population in the GTCL. It should accelerate the GTCL through the development of agricultural ecology, modernization, and industrialization.
5.3. Limitations and Future Research
6. Conclusions
- (1)
- The index value of GTCL from 2010 to 2020 was relatively low but showed a continuous upward and stable growth trend, indicating significant progress in the GTCL in Henan province, and there were obvious differences between different cities. The index of GTCL in Kaifeng is the most prominent, while Zhengzhou is relatively low. The index of Kaifeng’s GTCL has always been more than 1.5 times that of Zhengzhou.
- (2)
- The GTCL in Henan province shows a significant trend of spatial agglomeration, especially in the east–west direction, showing obvious differences and differentiation. And, it has significant spatial dependence and spillover effects. Cities with high index values are mainly concentrated in the southeast of Henan province, while cities in the northwest maintain medium and low index values.
- (3)
- The three subsystems of GTCL have all achieved significant but inconsistent improvements. The spatial transition index has increased by an average of 0.1, showing a spatial trend of being higher in the northeast and southwest regions. The functional transition index has increased by an average of 0.18, showing a spatial trend of high in the south and low in the north. The model transition index of various cities showed fluctuations from 2010 to 2015, with an average growth of 0.11 from 2010 to 2020, presenting a spatial pattern of high in the north and low in the south.
- (4)
- The GTCL in Henan Province is gradually promoted and achieved through the interweaving and joint effects of multiple factors such as social change, economic development, environmental protection, and agricultural modernization. The population density, urbanization rate, per capita GDP, and irrigation index are key influencing factors on the GTCL.
Author Contributions
Funding
Institutional Review Board Statement
Data Availability Statement
Conflicts of Interest
References
- Vasudhevan, P.; Pu, S.; Ayyamperumal, R.; Manikandan, E.; Sujitha, S.B.; Singh, S.; Ponniah, J.M.; Dixit, S.; Thangavel, P. Pollution assessment, ecological risk and source identification of heavy metals in paddy soils and rice grains from Salem, South India. J. Hazard. Mater. Adv. 2025, 17, 100526. [Google Scholar] [CrossRef]
- Yun, W.; Wu, K.; Zhang, X. Health problems and prevention countermeasures of cultivated land in China. China Dev. 2019, 19, 34–37. [Google Scholar]
- Yu, S.; Bai, X.; Zhao, J.; Zeng, Y.; Wang, Y.; Wang, Z.; Wang, L.; Shi, Z. Mismatch between provincial grain production and consumption increased cropland soil erosion in China. Agric. Ecosyst. Environ. 2024, 367, 108999. [Google Scholar] [CrossRef]
- Lu, H.; Xie, H.; Lv, T.; Yao, G. Determinants of cultivated land recuperation in ecologically damaged areas in China. Land Use Policy 2019, 81, 160–166. [Google Scholar] [CrossRef]
- Chen, R.; Ye, C.; Cai, Y.; Xing, X.; Chen, Q. The impact of rural out-migration on land use transition in China: Past, present and trend. Land Use Policy 2014, 40, 101–110. [Google Scholar] [CrossRef]
- Long, H.; Qu, Y. Land use transitions and land management: A mutual feedback perspective. Land Use Policy 2018, 74, 111–120. [Google Scholar] [CrossRef]
- Long, H.; Zhang, Y.; Ma, L.; Tu, S. Land Use Transitions: Progress, Challenges and Prospects. Land 2021, 10, 903. [Google Scholar] [CrossRef]
- Hu, S.; Tong, L.; Long, H. Land use transition potential and its assessment framework. Geogr. Res. 2019, 38, 1367–1377. [Google Scholar]
- Lu, X.; Shi, Y.; Chen, C.; Yu, M. Monitoring cropland transition and its impact on ecosystem services value in developed regions of China: A case study of Jiangsu Province. Land Use Policy 2017, 69, 25–40. [Google Scholar] [CrossRef]
- Gong, Y.; Li, J.; Li, Y. Spatiotemporal characteristics and driving mechanisms of arable land in the Beijing-Tianjin-Hebei region during 1990–2015. Socio-Econ. Plan. Sci. 2020, 70, 100720. [Google Scholar] [CrossRef]
- Ke, S.; Cui, H.; Lu, X.; Hou, J.; Wu, Y. Research on the spatial-temporal pattern and mechanisms of green transition of farmland use: A case of Hubei Province. China Land Sci. 2021, 35, 64–74. [Google Scholar]
- Lu, X.H.; Cui, H.Y.; Ke, S.; Kuang, B. Coupling coordination and driving mechanism of green transition of farmland use and total factor productivity of grain in Hubei Province. China Land Sci. 2022, 36, 75–84. [Google Scholar]
- Özkan, O.; Popescu, I.A.; Destek, M.A.; Balsalobre-Lorente, D. Time-quantile impact of foreign direct investment, financial development, and financial globalisation on green growth in BRICS economies. J. Environ. Manag. 2024, 371, 123145. [Google Scholar] [CrossRef] [PubMed]
- Zhang, J.; Li, D. Research on path tracking algorithm of green agricultural machinery for sustainable development. Sustain. Energy Technol. Assess. 2023, 55, 102917. [Google Scholar] [CrossRef]
- Ge, D.; Long, H.; Zhang, Y.; Ma, L.; Li, T. Farmland transition and its influences on grain production in China. Land Use Policy 2018, 70, 94–105. [Google Scholar] [CrossRef]
- Rudnicki, R.; Biczkowski, M.; Wiśniewski, Ł.; Wiśniewski, P.; Bielski, S.; Marks-Bielska, R. Towards green agriculture and sustainable development: Pro-environmental activity of farms under the common agricultural policy. Energies 2023, 16, 1770. [Google Scholar] [CrossRef]
- Madsen, S.; Bezner Kerr, R.; LaDue, N.; Luginaah, I.; Dzanja, C.; Dakishoni, L.; Lupafya, E.; Shumba, L.; Hickey, C. Explaining the impact of agroecology on farm-level transitions to food security in Malawi. Food Secur. 2021, 13, 933–954. [Google Scholar] [CrossRef]
- Zhu, Y.; Zhang, Y.; Ma, L.; Yu, L.; Wu, L. Simulating the dynamics of cultivated land use in the farming regions of China: A social-economic-ecological system perspective. J. Clean. Prod. 2024, 478, 143907. [Google Scholar] [CrossRef]
- Lambin, E.F.; Meyfroidt, P. Land use transitions: Socio-ecological feedback versus socio-economic change. Land Use Policy 2010, 27, 108–118. [Google Scholar] [CrossRef]
- Li, G.; He, T.; Zhang, M.; Wu, C. Spatiotemporal variations in the eco-health condition of China’s long-term stable cultivated land using Google Earth Engine from 2001 to 2019. Appl. Geogr. 2022, 149, 102819. [Google Scholar] [CrossRef]
- Zhao, C.; Zhou, Y.; Jiang, J.; Xiao, P.; Wu, H. Spatial characteristics of cultivated land quality accounting for ecological environmental condition: A case study in hilly area of northern Hubei province, China. Sci. Total Environ. 2021, 774, 145765. [Google Scholar] [CrossRef]
- Yang, H.; Li, X. Cultivated land and food supply in China. Land Use Policy 2000, 17, 73–88. [Google Scholar] [CrossRef]
- Xu, D.; Deng, X.; Guo, S.; Liu, S. Labor migration and farmland abandonment in rural China: Empirical results and policy implications. J. Environ. Manag. 2019, 232, 738–750. [Google Scholar] [CrossRef] [PubMed]
- Wang, X.; Song, X.; Wang, Y.; Xu, H.; Ma, Z. Understanding the distribution patterns and underlying mechanisms of non-grain use of cultivated land in rural China. J. Rural Stud. 2024, 106, 103223. [Google Scholar] [CrossRef]
- Wei, Y.; Gan, Z.; Cheng, J.; Zhang, H. Study on Eco-friendly Land Use. China Land Sci. 2021, 35, 27–34. [Google Scholar]
- Kuang, B.; Fan, X.; Lu, X. Spatial-temporal differentiation characteristics of the efficiency of green transformation of cultivated land use and its affecting factors in China. Trans. Chin. Soc. Agric. Eng. (Trans. Csae) 2021, 37, 269–277. [Google Scholar]
- Zu, J.; Hao, J.M.; Chen, L.; Zhang, Y.B.; Wang, J.; Kang, L.T.; Guo, J.H. Analysis on trinity connotation and approach to protect quantity, quality and ecology of cultivated land. J. China Agric. Univ. 2018, 23, 84–95. [Google Scholar]
- Song, X.; Li, X. Theoretical explanation and case study of regional cultivated land use function transition. Acta Geogr. Sin. 2019, 74, 992–1010. [Google Scholar]
- Chen, Z.; Li, X.; Xia, X. Temporal-spatial pattern and driving factors of cultivated land use transition at country level in Shaanxi province, China. Environ. Monit. Assess. 2022, 194, 365. [Google Scholar] [CrossRef]
- Li, W.; Cai, Z.; Jin, L. Urban green land use efficiency of resource-based cities in China: Multidimensional measurements, spatial-temporal changes, and driving factors. Sustain. Cities Soc. 2024, 104, 105299. [Google Scholar] [CrossRef]
- Zhang, J.; Zhang, P.; Liu, Y.; Lu, S.; Wu, G. An analysis of the spatiotemporal evolution and driving force of cultivated land green utilization in karst region of southwest China. J. Clean. Prod. 2024, 434, 140002. [Google Scholar] [CrossRef]
- Li, H.; Song, W. Spatial transformation of changes in global cultivated land. Sci. Total Environ. 2023, 859, 160194. [Google Scholar] [CrossRef]
- Fu, J.; Ding, R.; Zhu, Y.; Du, L.; Shen, S.; Peng, L.; Zou, J.; Hong, Y.; Liang, J.; Wang, K.; et al. Analysis of the spatial-temporal evolution of Green and low carbon utilization efficiency of agricultural land in China and its influencing factors under the goal of carbon neutralization. Environ. Res. 2023, 237, 116881. [Google Scholar] [CrossRef] [PubMed]
- Gao, J.; Qiao, W.; Liu, Y.; Li, Y.; Tu, W.; Zhang, Y. The higher grain production, the more social deprivation? A case study of Henan province in traditional agricultural areas of China. J. Mt. Sci. 2018, 15, 167–180. [Google Scholar] [CrossRef]
- Li, Y.; Liu, Y.; Long, H.; Cui, W. Community-based rural residential land consolidation and allocation can help to revitalize hollowed villages in traditional agricultural areas of China: Evidence from Dancheng County, Henan Province. Land Use Policy 2014, 39, 188–198. [Google Scholar] [CrossRef]
- Wei, H.; Wang, Y.; Liu, J.; Zhang, J.; Cao, Y. Coordinated development of cultivated land use and ecological protection in cities along the main stream of the Yellow River in Henan Province, China. Ecol. Indic. 2023, 156, 111143. [Google Scholar] [CrossRef]
- National Bureau of Statistics of China. Annual Statistical Data on Agricultural Production in China; China Statistics Press: Beijing, China, 2022. [Google Scholar]
- Qu, Y.; Zhan, L.; Wei, C.; Zhang, Q.; Wang, J. Interactive transition of cultivated land and construction land during china’s urbanization: A coordinated analytical framework of explicit and implicit forms. Land Use Policy 2024, 138, 107049. [Google Scholar] [CrossRef]
- Tang, Y.; Chen, M. The impact mechanism and spillover effect of digital rural construction on the efficiency of green transformation for cultivated land use in China. Int. J. Environ. Res. Public Health 2022, 19, 16159. [Google Scholar] [CrossRef]
- Getis, A. Spatial autocorrelation. In Handbook of Applied Spatial Analysis: Software Tools, Methods and Applications; Springer: Berlin/Heidelberg, Germany, 2009; pp. 255–278. [Google Scholar]
- Polykretis, C.; Alexakis, D.D. Alexakis, Spatial stratified heterogeneity of fertility and its association with socio-economic determinants using Geographical Detector: The case study of Crete Island, Greece. Appl. Geogr. 2021, 127, 102384. [Google Scholar] [CrossRef]
- Afrizal; Putra, E.V.; Elida, L. Palm oil expansion, insecure land rights, and land-use conflict: A case of palm oil centre of Riau, Indonesia. Land Use Policy 2024, 146, 107325. [Google Scholar] [CrossRef]
- Dadi, W.; Mulugeta, M.; Semie, N. Impact of urbanization on the welfare of farm households: Evidence from Adama Rural District in Oromia regional state, Ethiopia. Heliyon 2024, 10, e23802. [Google Scholar] [CrossRef] [PubMed]
- Kroot, M.V. Accommodating agriculture at al-Khayran: Economic relations and settlement practices in the earliest agricultural communities of the southern Levant. J. Anthropol. Archaeol. 2024, 75, 101606. [Google Scholar] [CrossRef]
- Wen, Y.; Zhang, Z.; Liang, D.; Xu, Z. Rural Residential Land Transition in the Beijing-Tianjin-Hebei Region: Spatial-Temporal Patterns and Policy Implications. Land Use Policy 2020, 96, 104700. [Google Scholar] [CrossRef]
- Patiño-Gutiérrez, S.E.; Domínguez-Rivera, I.C.; Daza-Torrez, M.C.; Ochoa-Tocachi, B.F.; Oviedo-Ocaña, E.R. Effects of rainfall seasonality and land use change on soil hydrophysical properties of high-Andean dry páramo grasslands. CATENA 2024, 238, 107866. [Google Scholar] [CrossRef]
- Rangel-Peraza, J.G.; Sanhouse-García, A.J.; Flores-González, L.M.; Monjardín-Armenta, S.A.; Mora-Félix, Z.D.; Rentería-Guevara, S.A.; Bustos-Terrones, Y.A. Effect of land use and land cover changes on land surface warming in an intensive agricultural region. J. Environ. Manag. 2024, 371, 123249. [Google Scholar] [CrossRef]
- Lu, F.; Meng, J.; Cheng, B. How does improving agricultural mechanization affect the green development of agriculture? Evidence from China. J. Clean. Prod. 2024, 472, 143298. [Google Scholar] [CrossRef]
- Ebrahimian, H.; Zeleke, K. Chapter 4—Water and irrigation management in semiarid and arid lands for sustainable agriculture. In Sustainable Agriculture Under Drought Stress; Etesami, H., Chen, Y., Etesami, H., Chen, Y., Eds.; Academic Press: Cambridge, MA, USA, 2025; pp. 31–47. [Google Scholar]
- Wu, J.; Lu, W.; Li, M. A DEA-based improvement of China’s green development from the perspective of resource reallocation. Sci. Total Environ. 2020, 717, 137106. [Google Scholar] [CrossRef] [PubMed]
- Ke, X.L.; Deng, J.; Song, Y. Spatial-temporal pattern of coupling coordination between green transition of farmland use and urban-rural integration development in the Yangtze River Economic Belt. Acta Ecol. Sin. 2024, 44, 5773–5785. [Google Scholar]
- Gao, J.; Yang, Y. Spatial-temporal Patterns and Driving Factors of Green Transformation for Cultivated Land Use of Major Grain-producing Areas in Northeastern China. China Land Sci. 2023, 37, 114–123. [Google Scholar]
- Liu, Y. Research on the urban-rural integration and rural revitalization in the new era in China. Acta Geogr. Sin. 2018, 73, 637–650. [Google Scholar]


| Targets | Factors | Indicators | Attribute | Illustration | Weight |
|---|---|---|---|---|---|
| Spatial transition | Quantity | Per capita cultivated land | + | Cultivated land area/total population | 0.0505 |
| Land reclamation rate | + | Cultivated land area/total area | 0.0678 | ||
| Structure | Grain crop sowing ratio | + | Grain crop sowing area/cultivated land area | 0.0878 | |
| Multiple-crop index | + | Crop sowing area/cultivated land area | 0.062 | ||
| Functional Transition | Production | Grain yield per ha | + | Grain yield/sowing area of grain crops | 0.0711 |
| Agricultural output value per ha | + | Agricultural output value/cultivated land area | 0.1371 | ||
| Living | Per capita grain output | + | Grain production/total population | 0.0759 | |
| Proportion of agricultural employment population | + | Agricultural employment population/total employment population | 0.0486 | ||
| Ecological | Population carrying capacity per ha | − | Rural population/cultivated land area | 0.0265 | |
| Fertilizer usage per ha | − | Fertilizer usage/cultivated land area | 0.1219 | ||
| Mode transition | Green production | Proportion of water-saving irrigation | + | Water-saving irrigation area/cultivated land area | 0.0748 |
| Technological innovation | Agricultural machinery power per ha | + | Total power of agricultural machinery/cultivated land area | 0.0648 | |
| Eco-friendly | Organic fertilizer input intensity | + | Green manure sowing area/cultivated land area | 0.0656 | |
| Pesticide use per ha | − | Pesticide usage/cultivated land area | 0.0454 |
| Cities | 2010 | 2015 | 2020 |
|---|---|---|---|
| Zhengzhou | 0.33 | 0.37 | 0.46 |
| Kaifeng | 0.54 | 0.59 | 0.69 |
| Luoyang | 0.36 | 0.4 | 0.51 |
| Pingdingshan | 0.34 | 0.34 | 0.46 |
| Anyang | 0.46 | 0.5 | 0.58 |
| Hebi | 0.53 | 0.58 | 0.66 |
| Xinxiang | 0.43 | 0.47 | 0.58 |
| Jiaozuo | 0.47 | 0.53 | 0.62 |
| Poyang | 0.51 | 0.57 | 0.68 |
| Xuchang | 0.47 | 0.53 | 0.67 |
| Luohe | 0.53 | 0.58 | 0.65 |
| Sanmenxia | 0.3 | 0.38 | 0.52 |
| Nanyang | 0.4 | 0.43 | 0.58 |
| Shangqiu | 0.53 | 0.53 | 0.69 |
| Xinyang | 0.5 | 0.5 | 0.62 |
| Zhoukou | 0.54 | 0.58 | 0.67 |
| Zhumadian | 0.54 | 0.56 | 0.68 |
| Jiyuan | 0.35 | 0.38 | 0.46 |
| Average | 0.45 | 0.49 | 0.6 |
| Range | 0.24 | 0.25 | 0.23 |
| Factors | Indicators | Explanation of Indicators |
|---|---|---|
| Social | Population density (X1) | Population/total area |
| Urbanization rate (X2) | Urban population/total population | |
| Economic | Per capita GDP (X3) | GDP/total population |
| Proportion of agricultural output value (X4) | Agricultural GDP/Total GDP | |
| Environmental | Rainfall (X5) | Annual rainfall |
| Temperature (X6) | Annual temperature | |
| Agricultural Modernization | Agricultural mechanization (X7) | Total power of agricultural machinery/sowing area of crops |
| Irrigation index (X8) | Effective irrigation area/cultivated land area |
| Indicators | 2010 | 2015 | 2020 | |||
|---|---|---|---|---|---|---|
| q Value | Rank | q Value | Rank | q Value | Rank | |
| X1 | 0.8425 * | 1 | 0.4883 * | 5 | 0.6896 * | 1 |
| X2 | 0.7425 * | 2 | 0.5012 * | 3 | 0.6749 * | 3 |
| X3 | 0.6721 * | 4 | 0.4963 * | 4 | 0.6834 * | 2 |
| X4 | 0.4412 * | 6 | 0.3736 * | 7 | 0.5757 * | 6 |
| X5 | 0.3906 * | 7 | 0.6981 * | 1 | 0.3932 * | 8 |
| X6 | 0.3523 * | 8 | 0.2856 * | 8 | 0.6412 * | 5 |
| X7 | 0.5110 * | 5 | 0.4541 * | 6 | 0.5656 * | 7 |
| X8 | 0.7037 * | 3 | 0.6972 * | 2 | 0.6594 * | 4 |
Disclaimer/Publisher’s Note: The statements, opinions and data contained in all publications are solely those of the individual author(s) and contributor(s) and not of MDPI and/or the editor(s). MDPI and/or the editor(s) disclaim responsibility for any injury to people or property resulting from any ideas, methods, instructions or products referred to in the content. |
© 2025 by the authors. Licensee MDPI, Basel, Switzerland. This article is an open access article distributed under the terms and conditions of the Creative Commons Attribution (CC BY) license (https://creativecommons.org/licenses/by/4.0/).
Share and Cite
Yang, J.; Cai, E.; Chen, W.; Li, L.; Jing, Y.; Li, Y. Quantitative Evaluation and Driving Forces of Green Transition of Cultivated Land Use in Major Grain-Producing Areas—A Case Study of Henan Province, China. Sustainability 2025, 17, 2624. https://doi.org/10.3390/su17062624
Yang J, Cai E, Chen W, Li L, Jing Y, Li Y. Quantitative Evaluation and Driving Forces of Green Transition of Cultivated Land Use in Major Grain-Producing Areas—A Case Study of Henan Province, China. Sustainability. 2025; 17(6):2624. https://doi.org/10.3390/su17062624
Chicago/Turabian StyleYang, Jinning, Enxiang Cai, Weiqiang Chen, Ling Li, Ying Jing, and Yingchao Li. 2025. "Quantitative Evaluation and Driving Forces of Green Transition of Cultivated Land Use in Major Grain-Producing Areas—A Case Study of Henan Province, China" Sustainability 17, no. 6: 2624. https://doi.org/10.3390/su17062624
APA StyleYang, J., Cai, E., Chen, W., Li, L., Jing, Y., & Li, Y. (2025). Quantitative Evaluation and Driving Forces of Green Transition of Cultivated Land Use in Major Grain-Producing Areas—A Case Study of Henan Province, China. Sustainability, 17(6), 2624. https://doi.org/10.3390/su17062624