Unravelling Mangrove Storm Damage Resistance for Sustainable Flood Defense Safety Using 3D-Printed Mimics

 , , , , , ,
  ,
,  and
and
Abstract
1. Introduction
2. Materials and Methods
2.1. Sediment Preparation and Properties
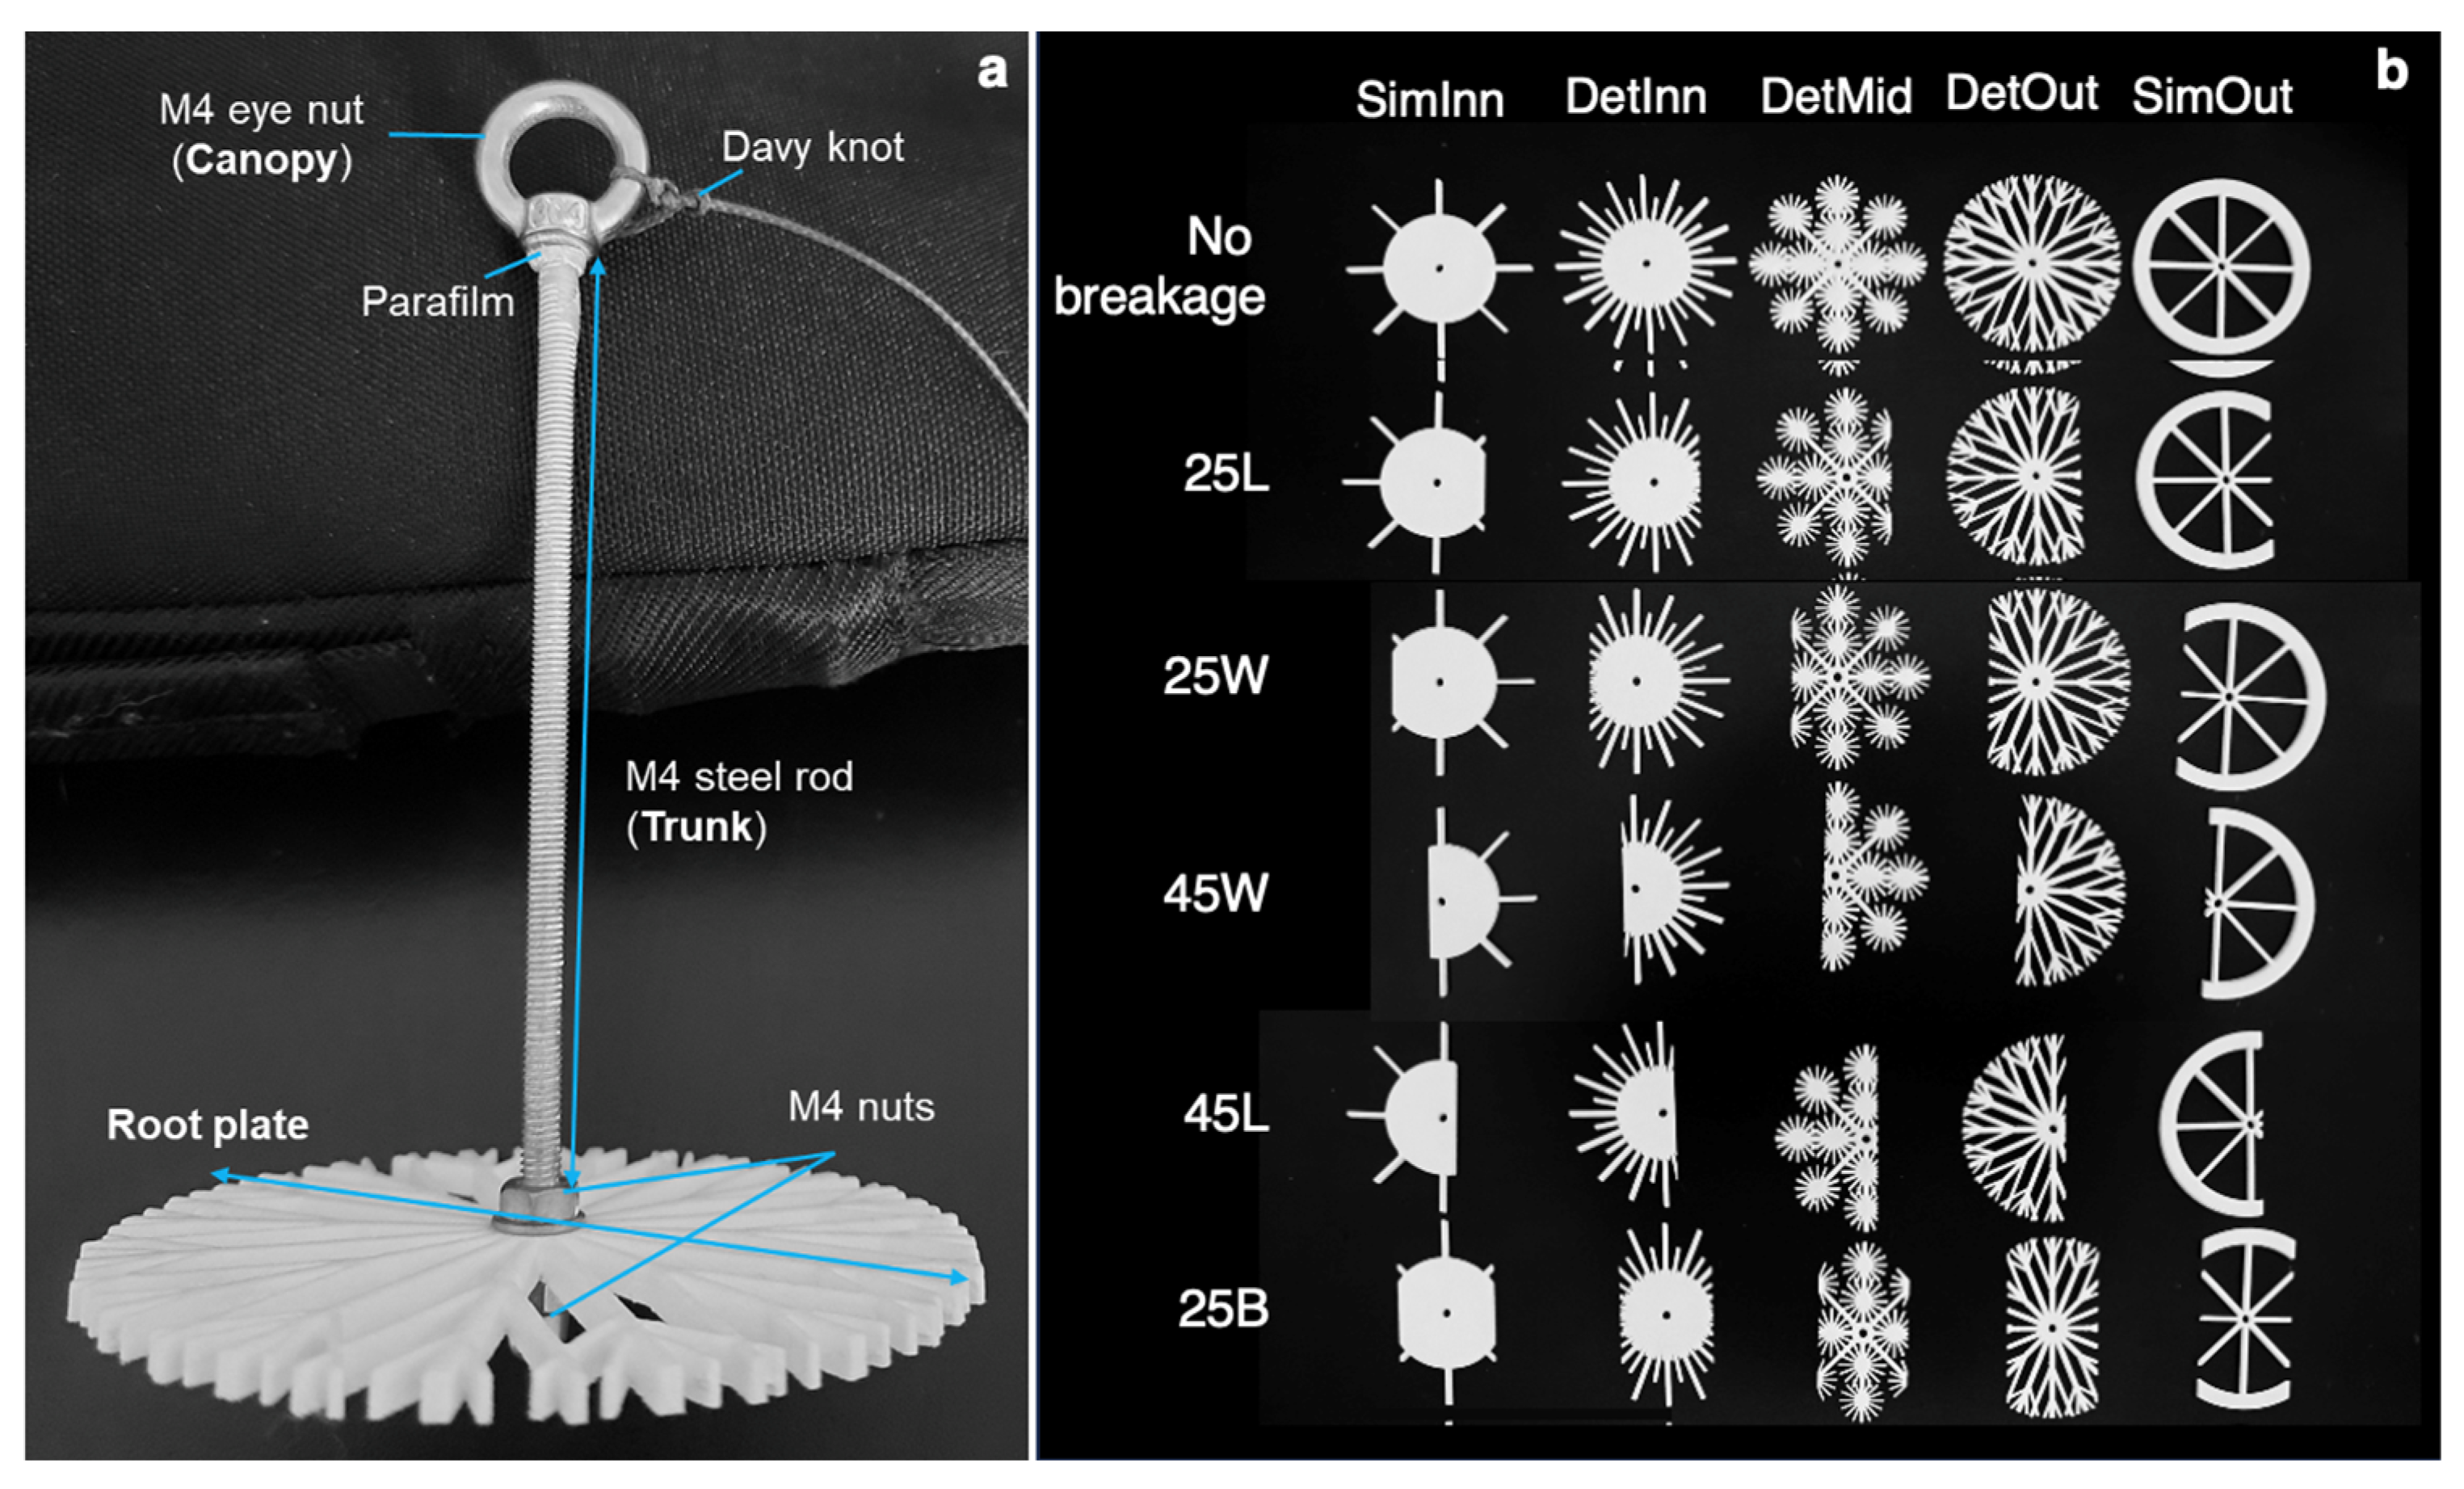
2.2. Root Plate and Mimic Design
2.3. Root Plate 3D-Printing Process and Assemblage

| Tree/Mimic | Tree Height, m (Mean ± SD) | Root Plate Radius, m (Range) | Root Depth, m (Range) |
|---|---|---|---|
| Avicennia marina | 9.6 ± 5.4 | 1.4–16.1 | 0.2–1.4 |
| Rhizophora stylosa | 7.4 ± 6.4 | 1.6–5.1 | 0.3–1.0 |
| Mimic | 0.105 | 0.04 | 0.007 |
| Mimic upscaled 100× | 10.5 | 4 | 0.7 |
2.4. Weight Scaling of Tree-Soil System
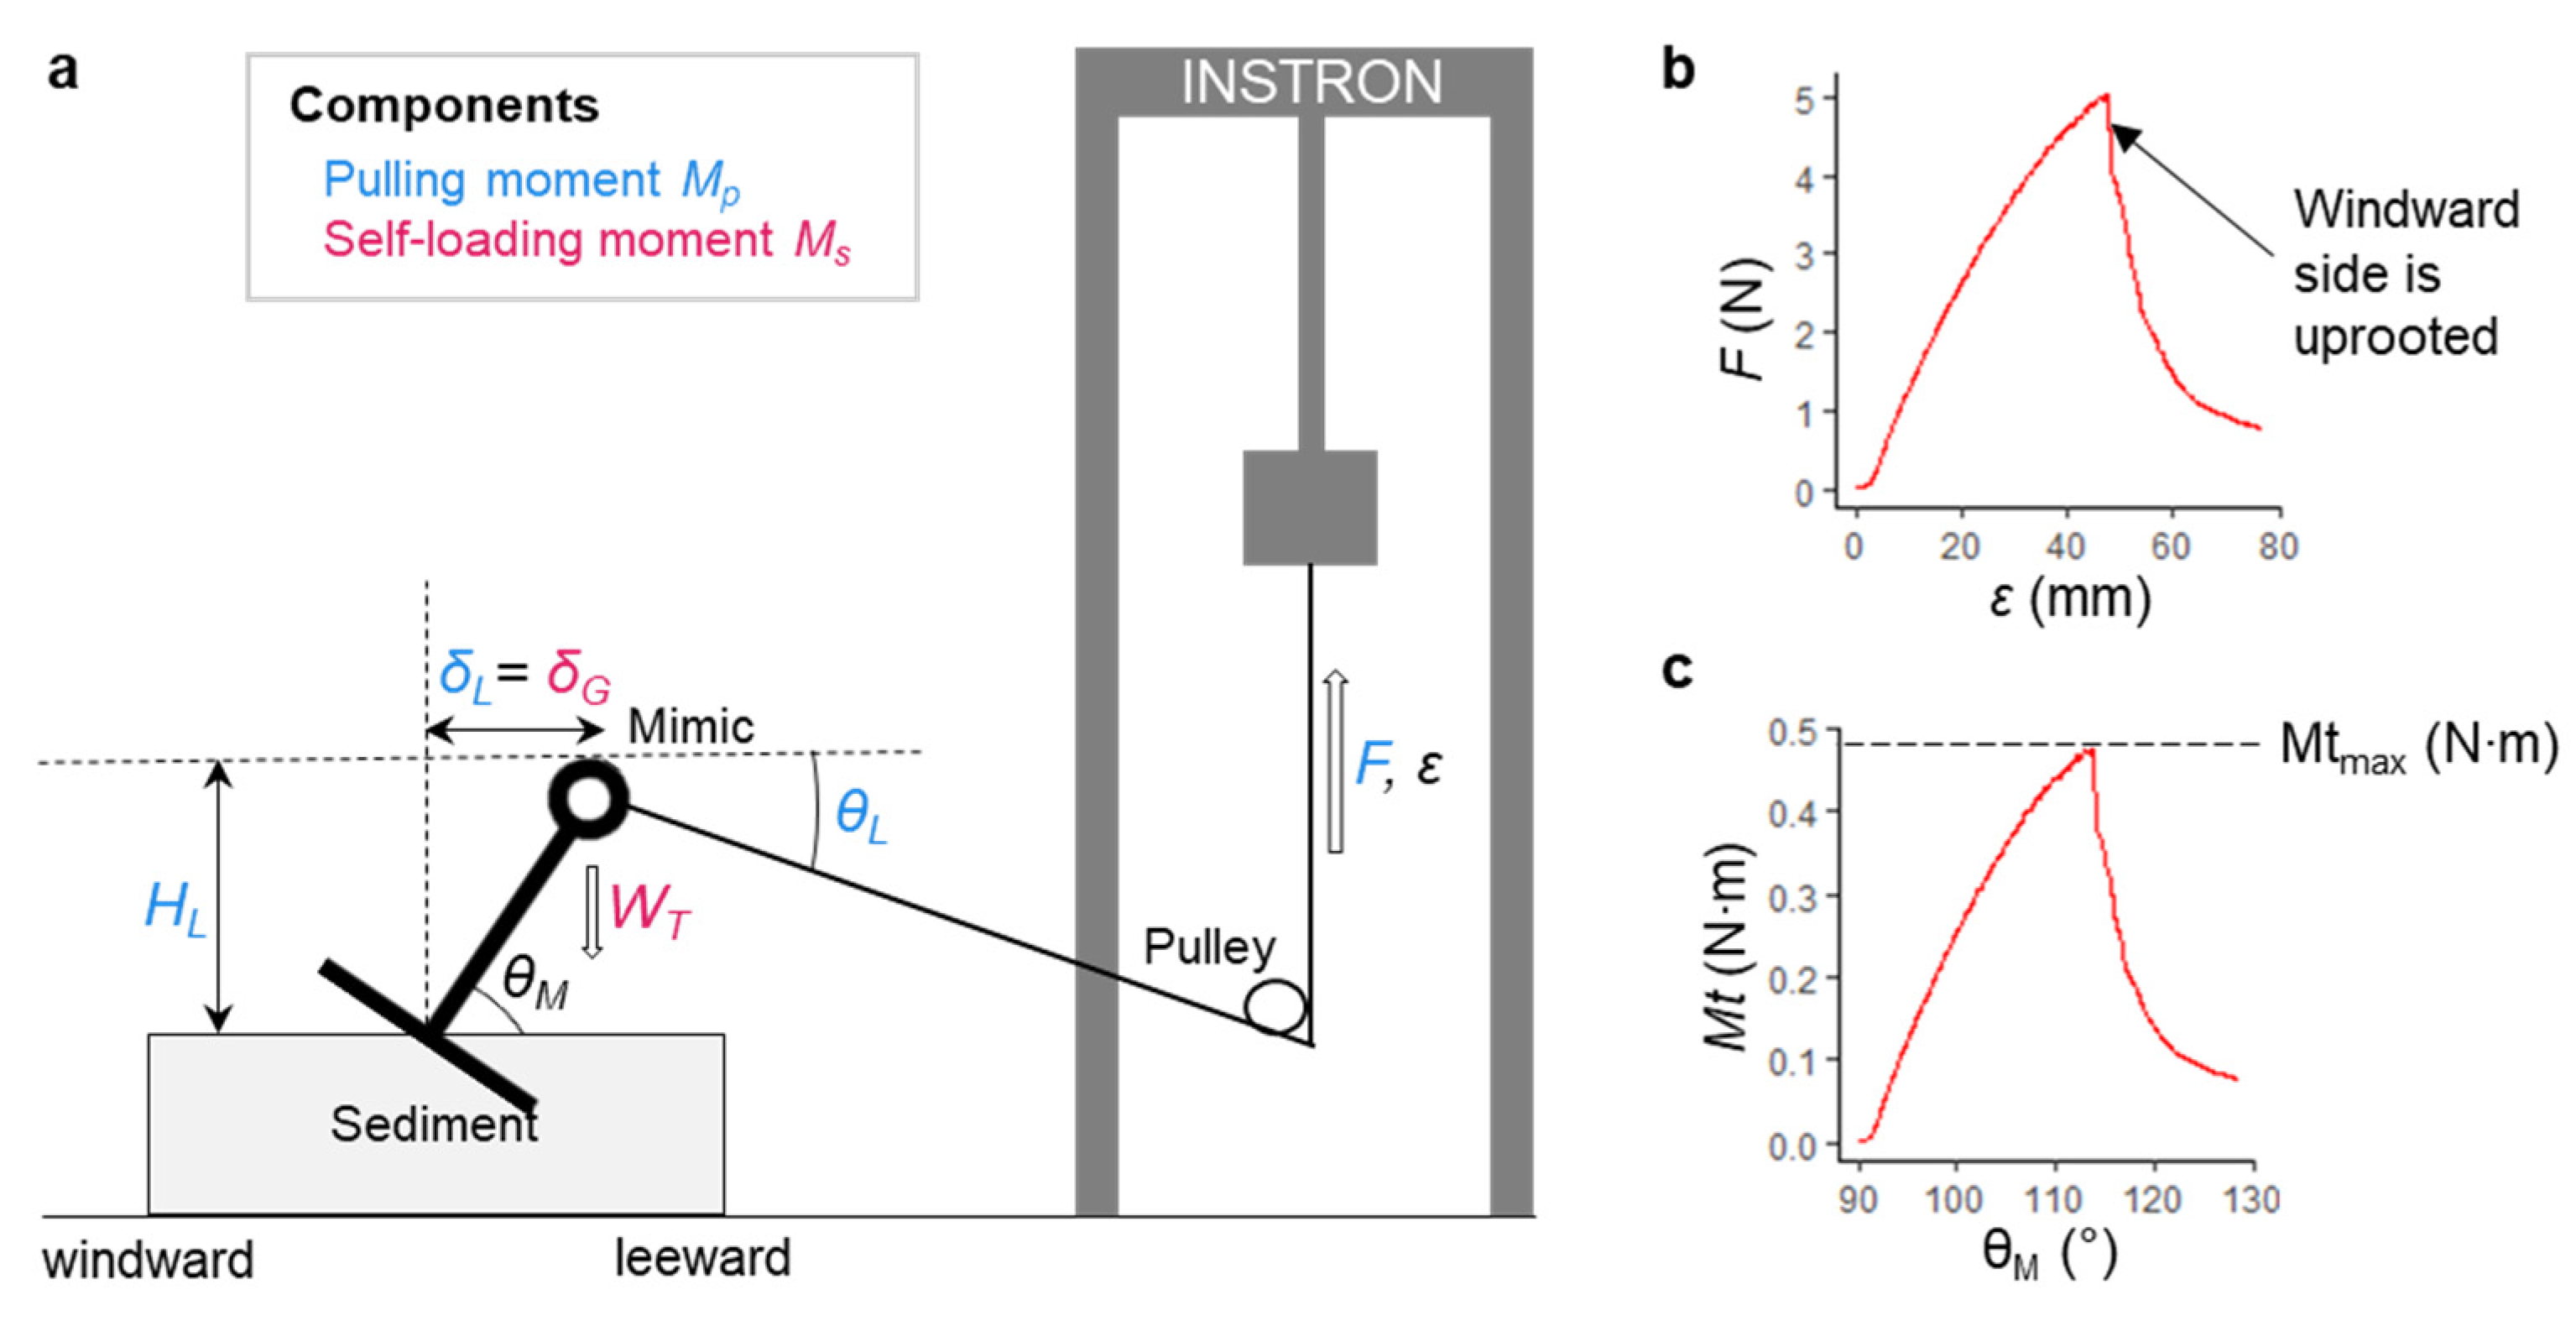
2.5. Pulling Tests to Measure Overturning Moments
2.6. Calculation of Overturning Moments
2.7. Statistical Methods
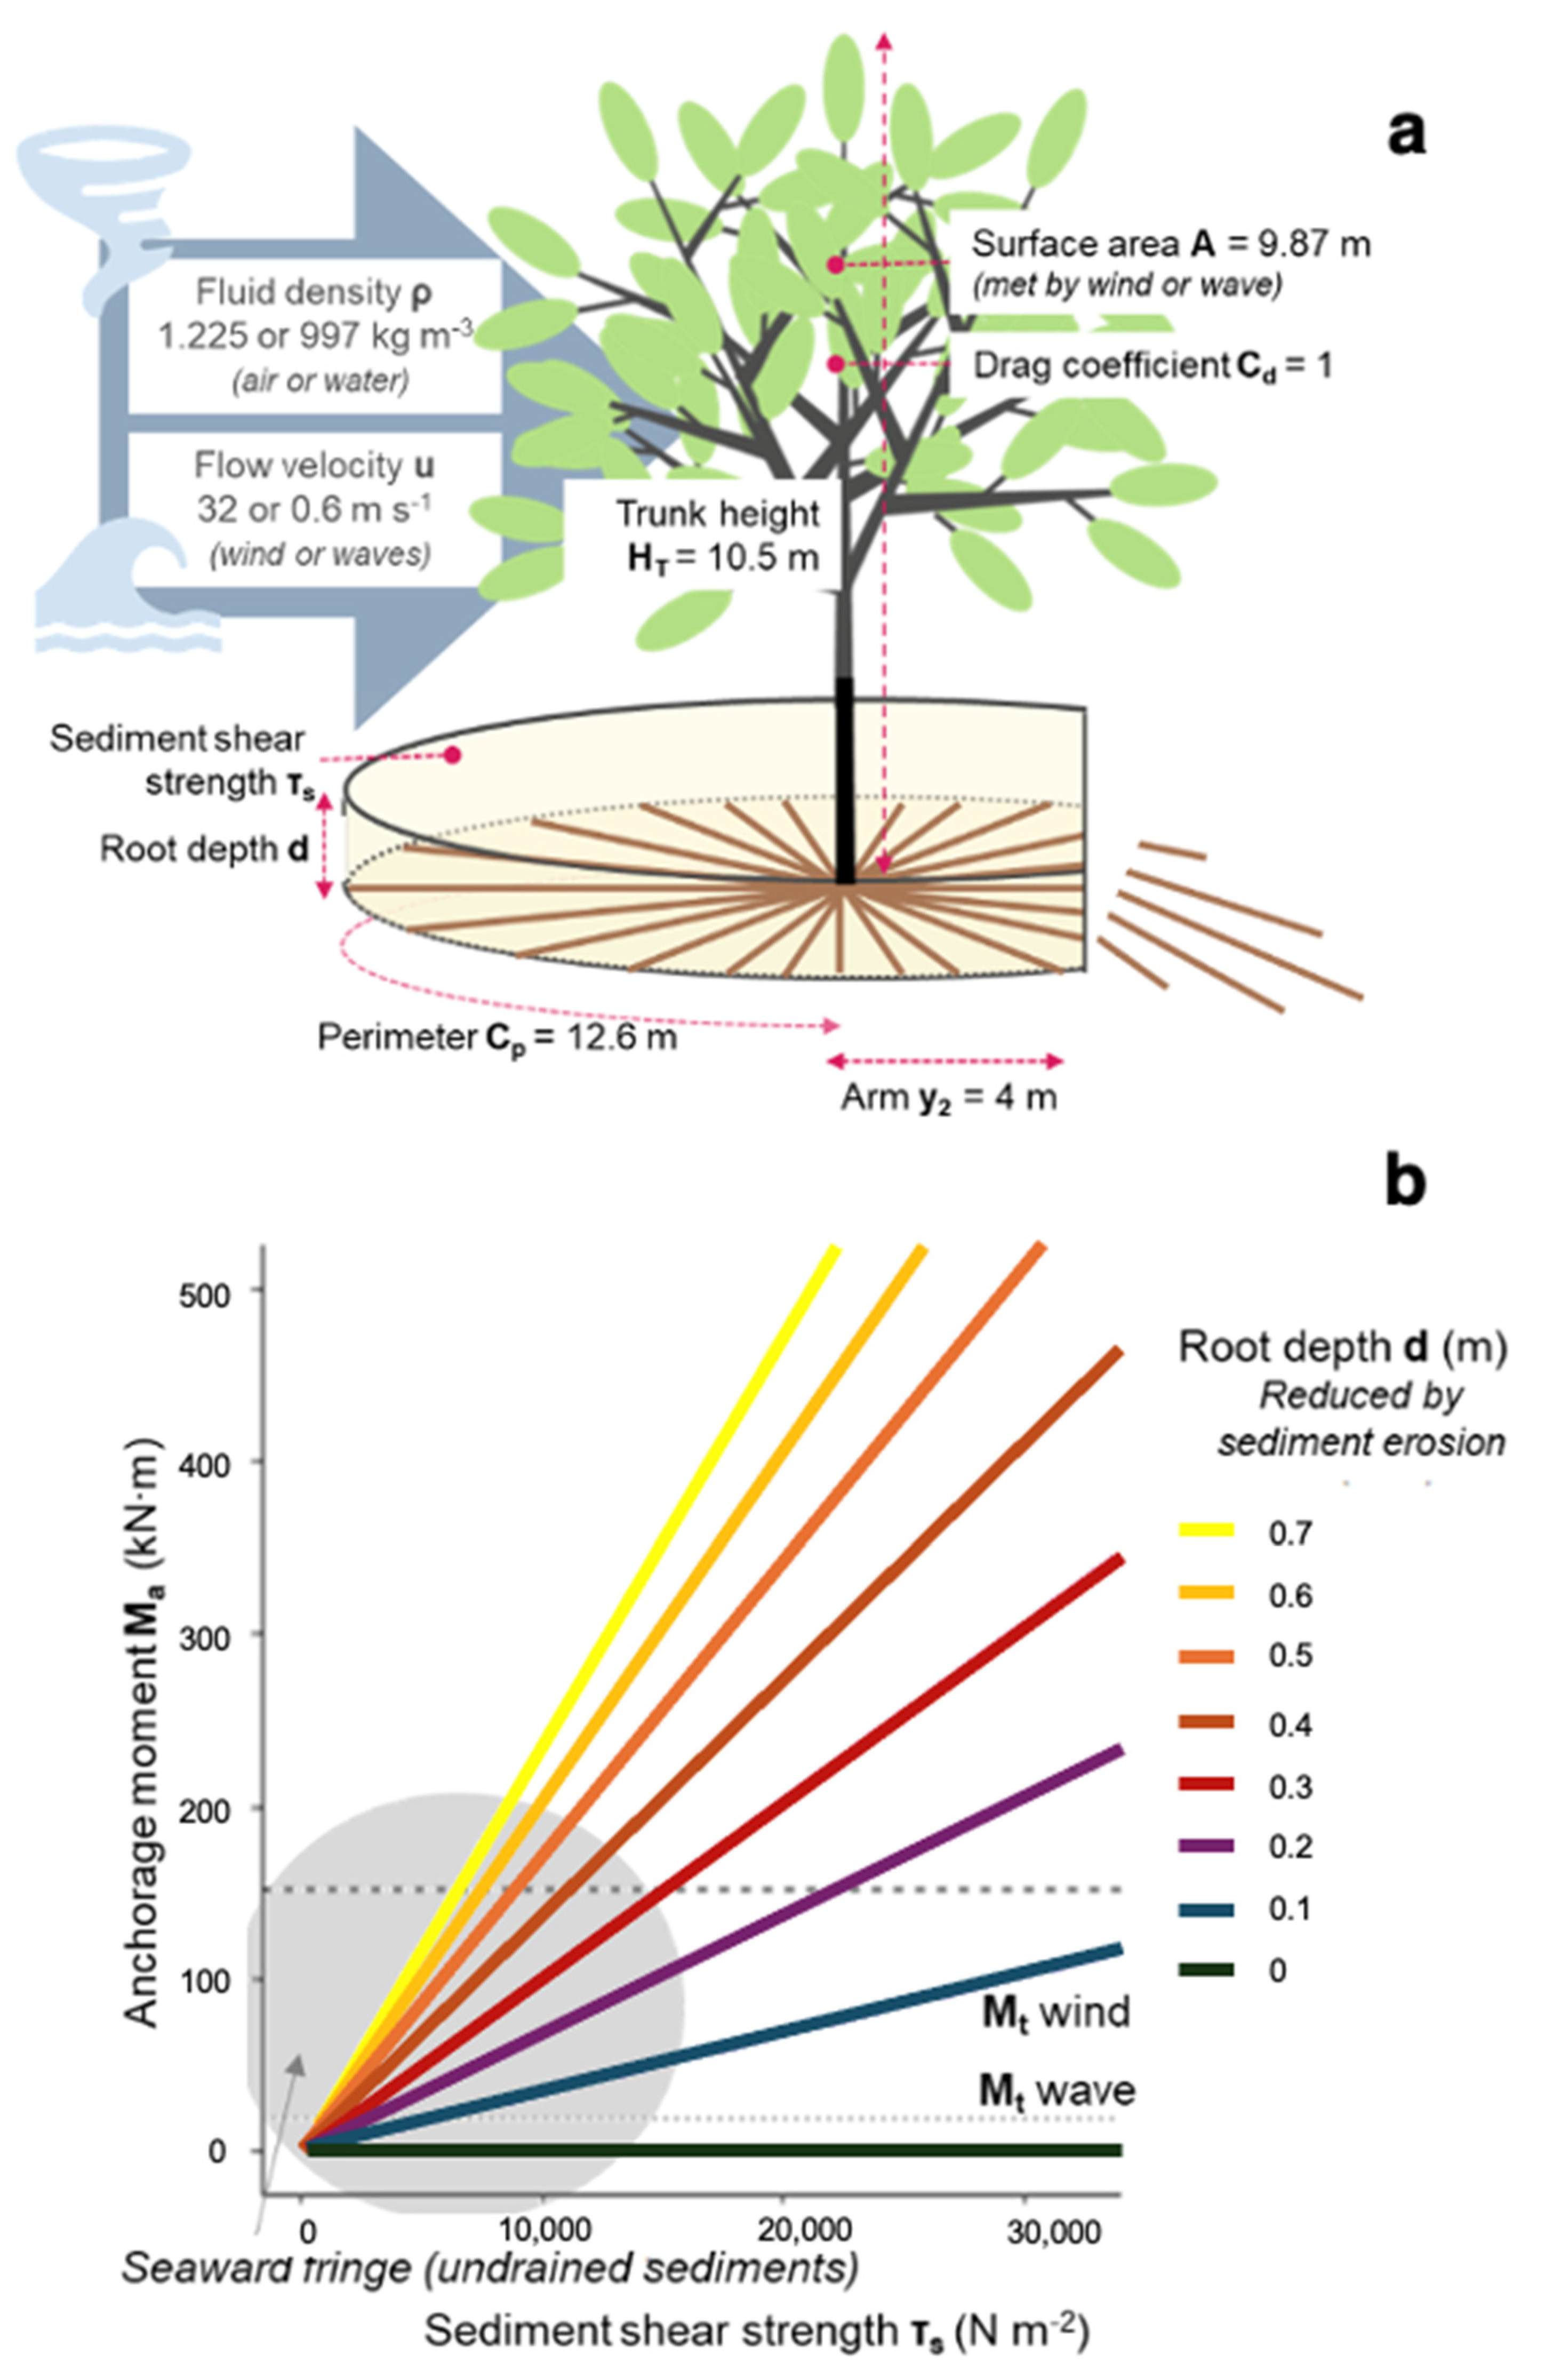
2.8. Mangrove Stability Model
3. Results
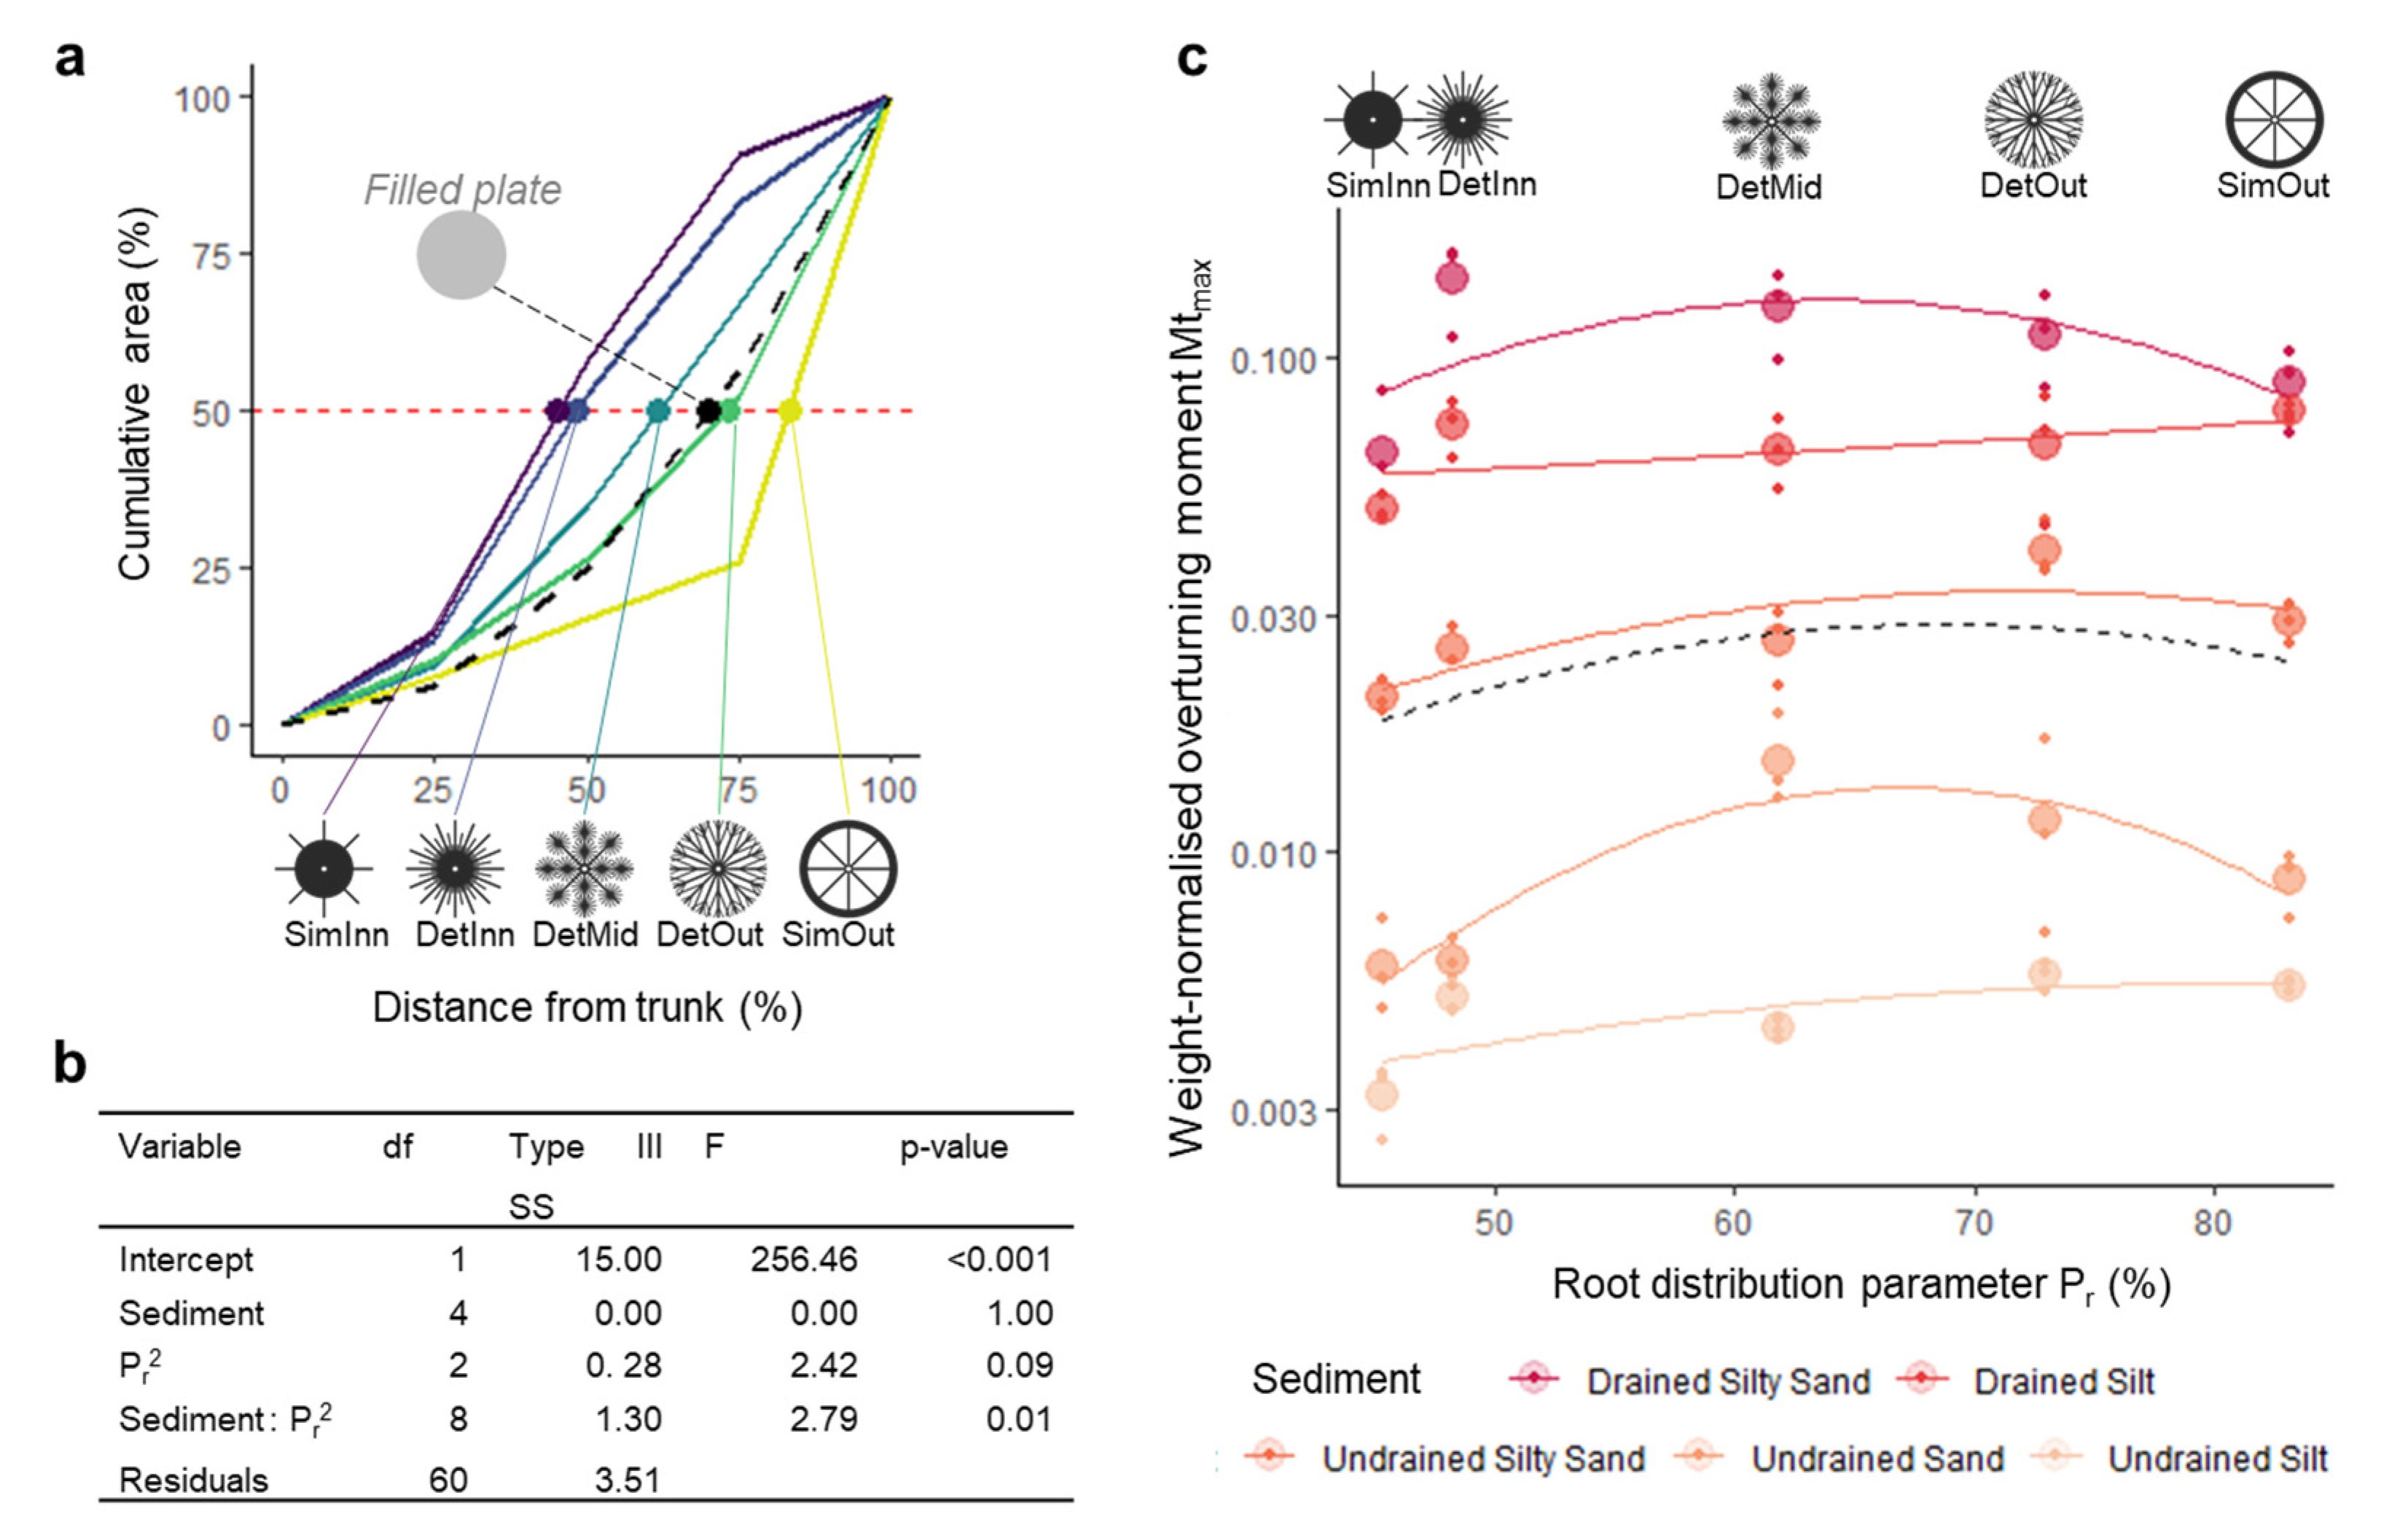
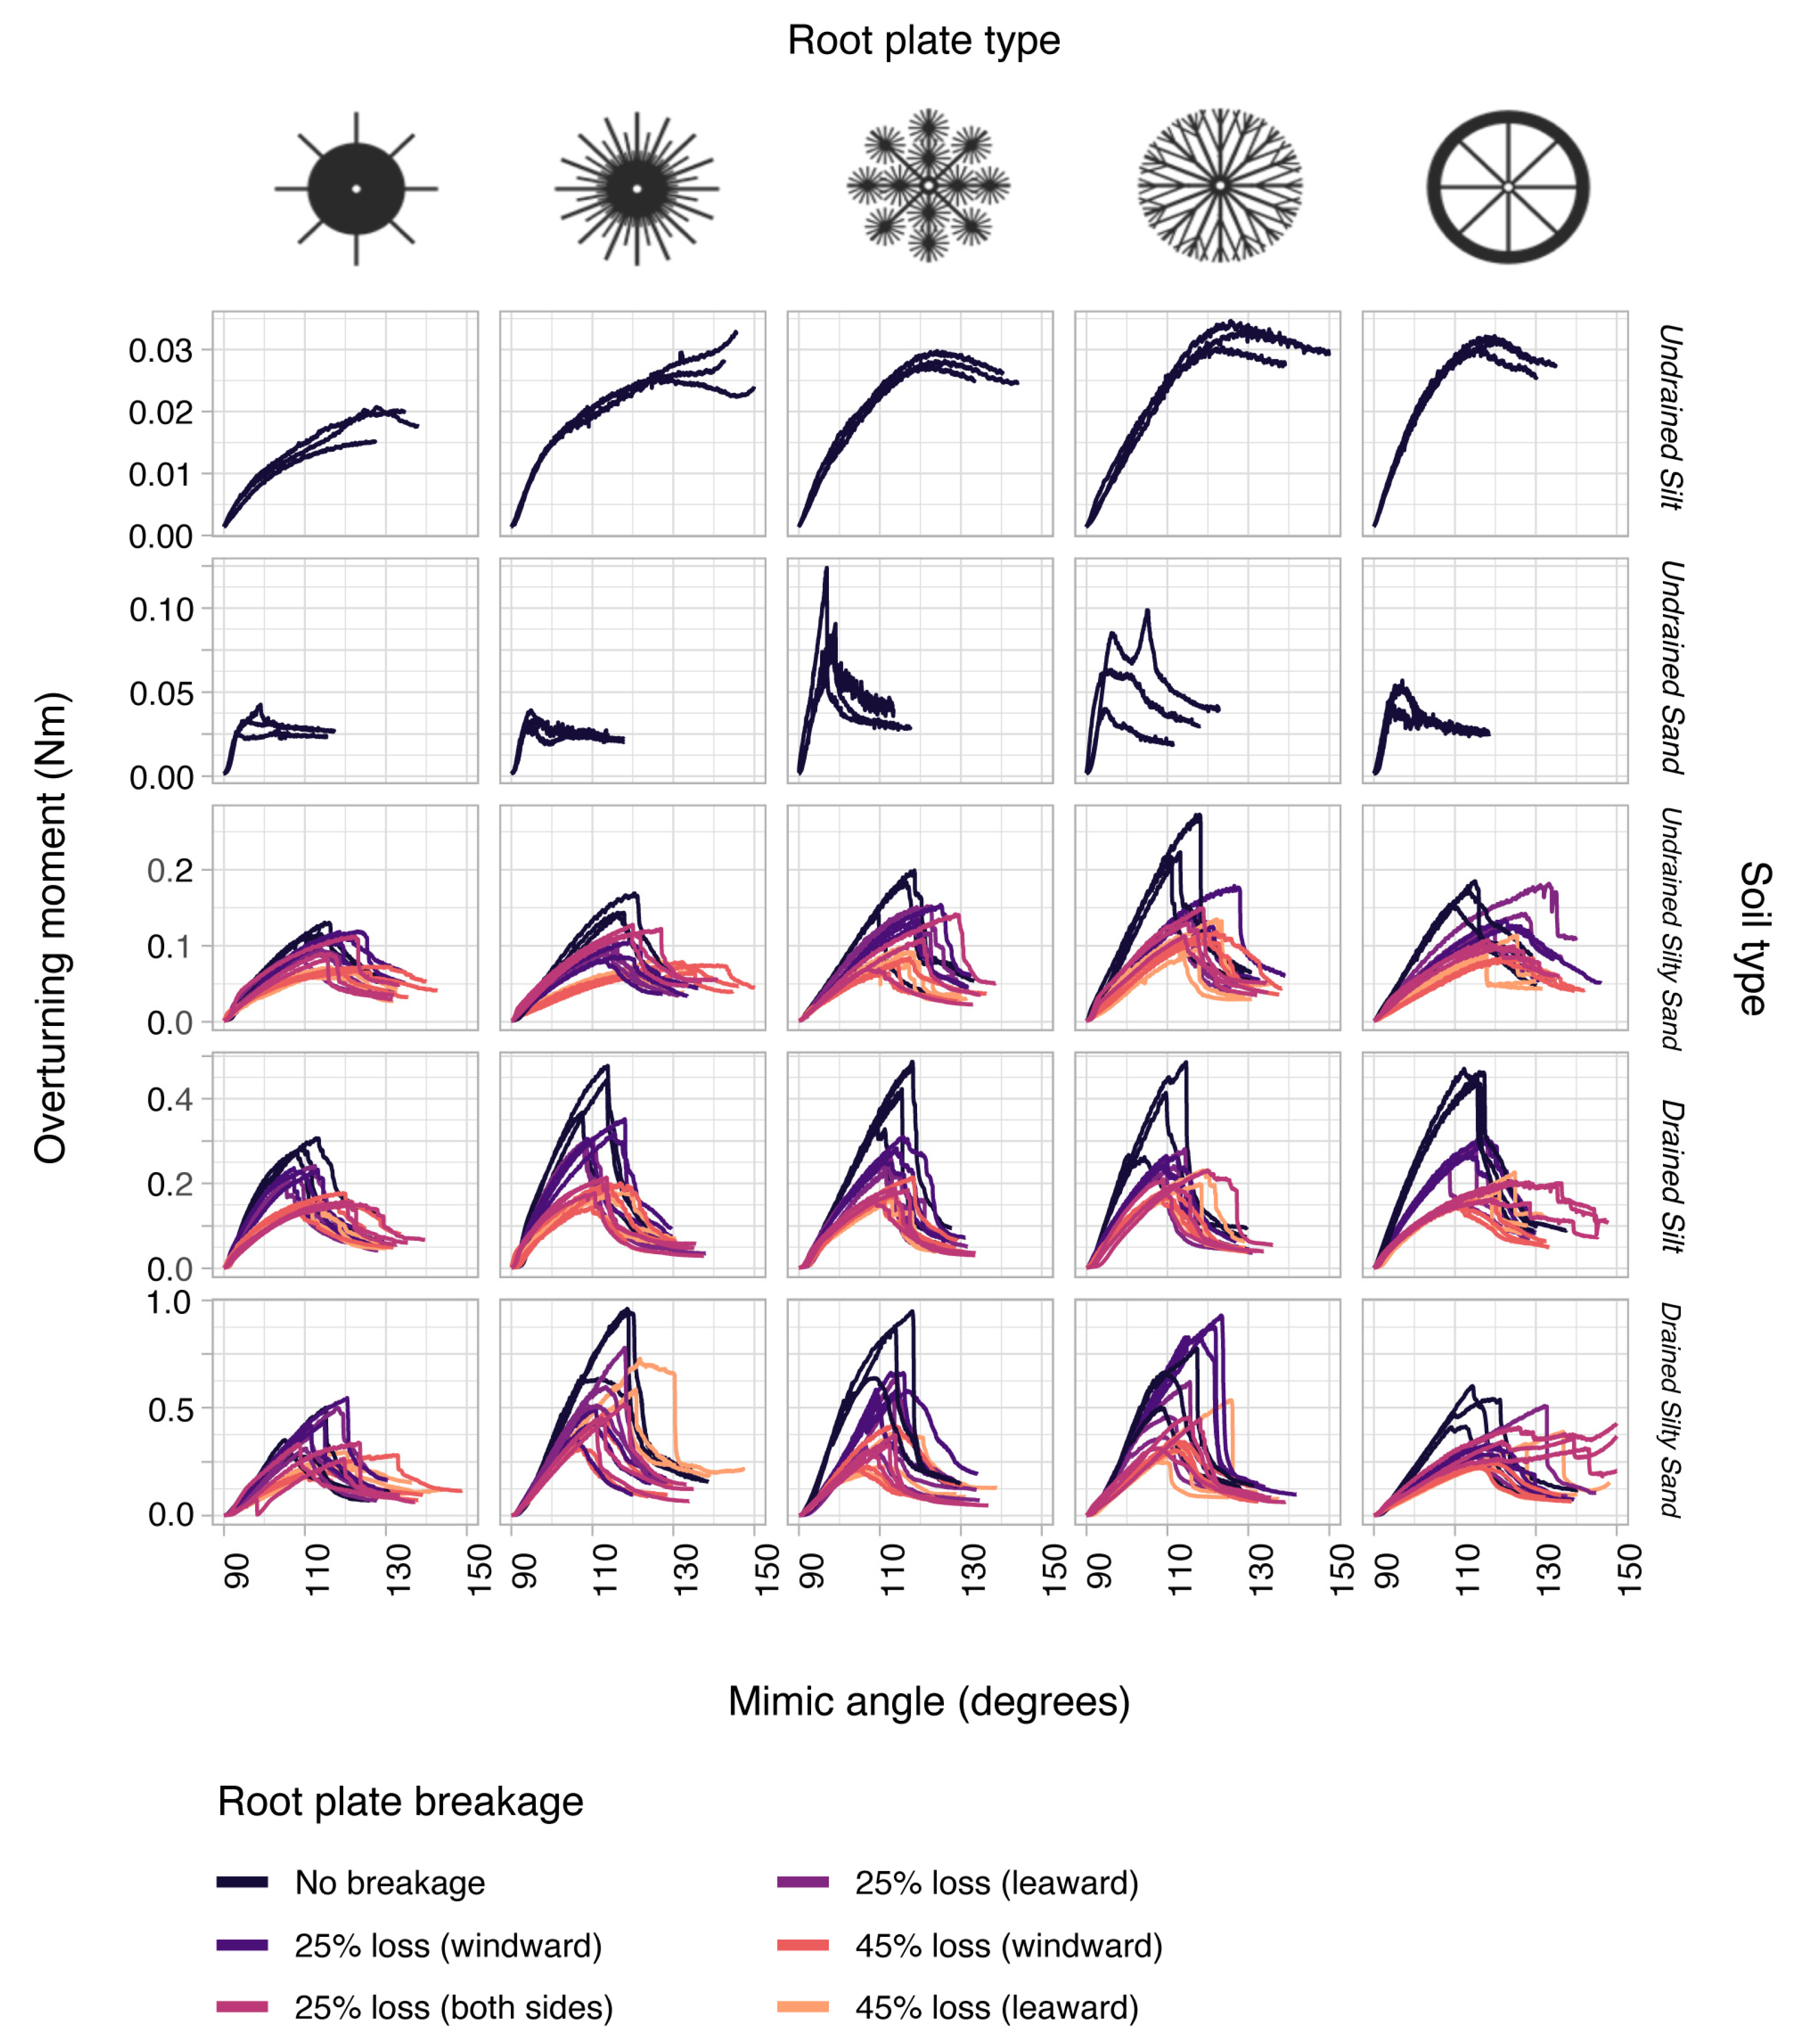
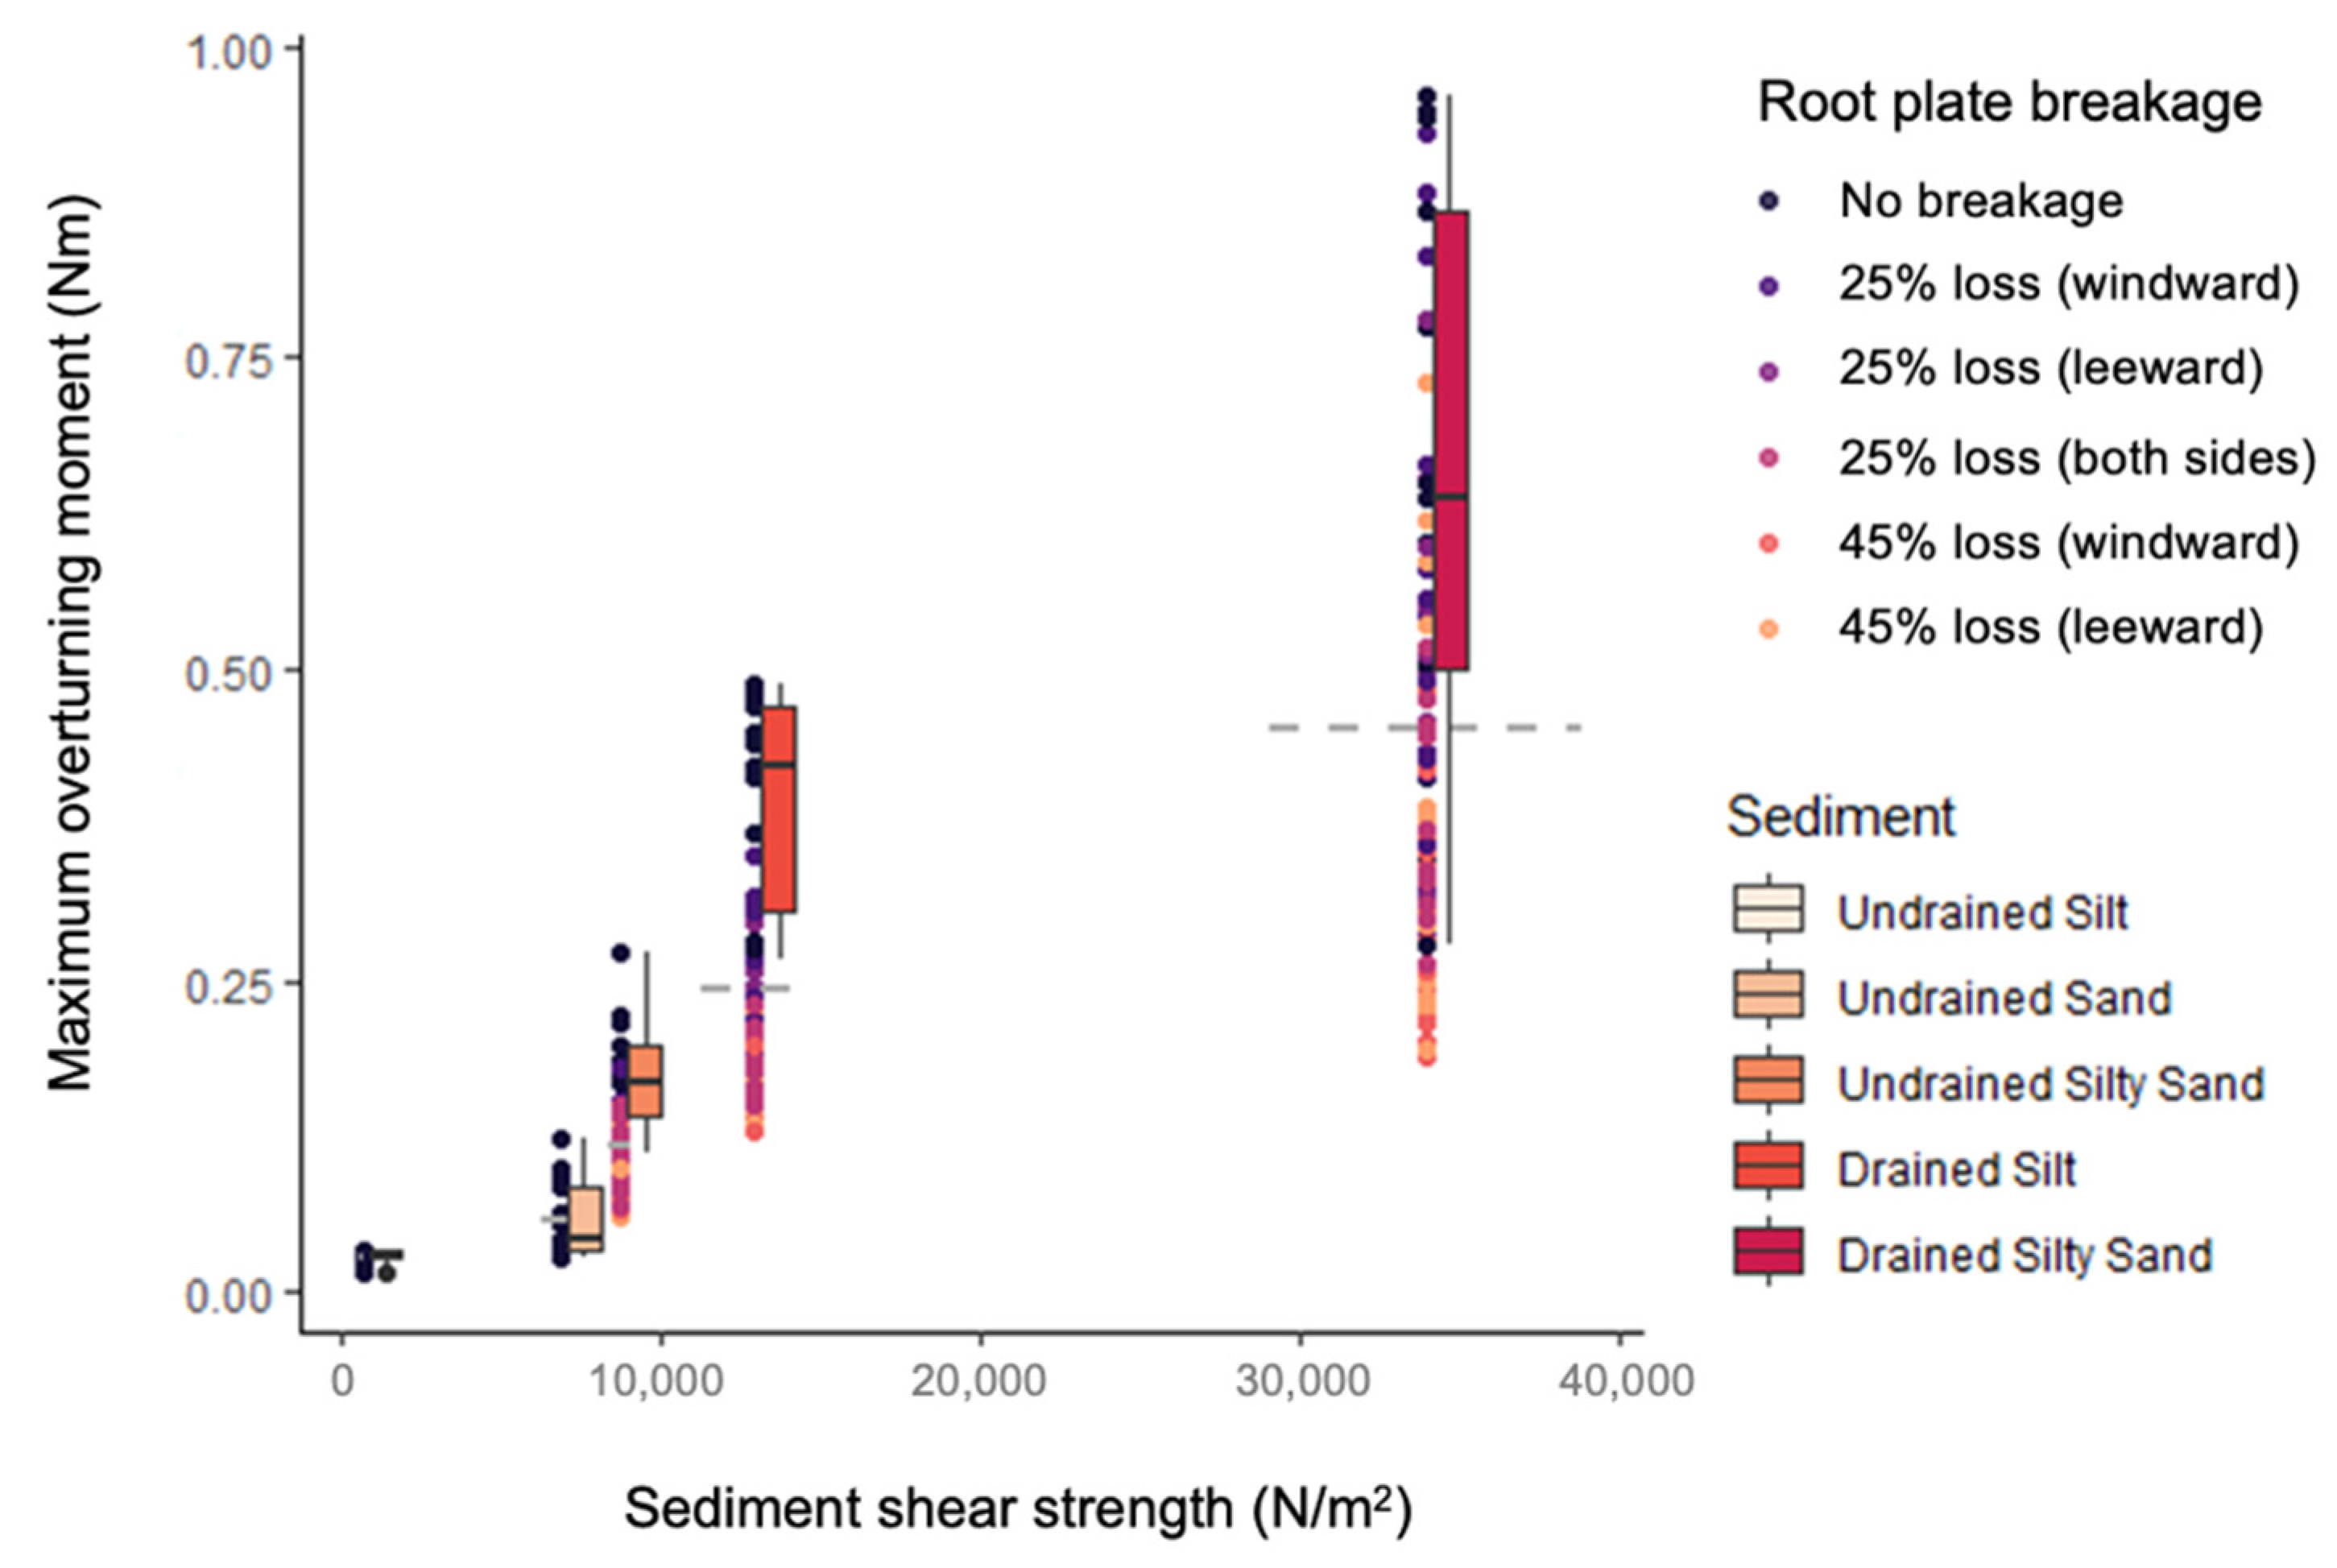
3.1. General Patterns in Mimic Stability
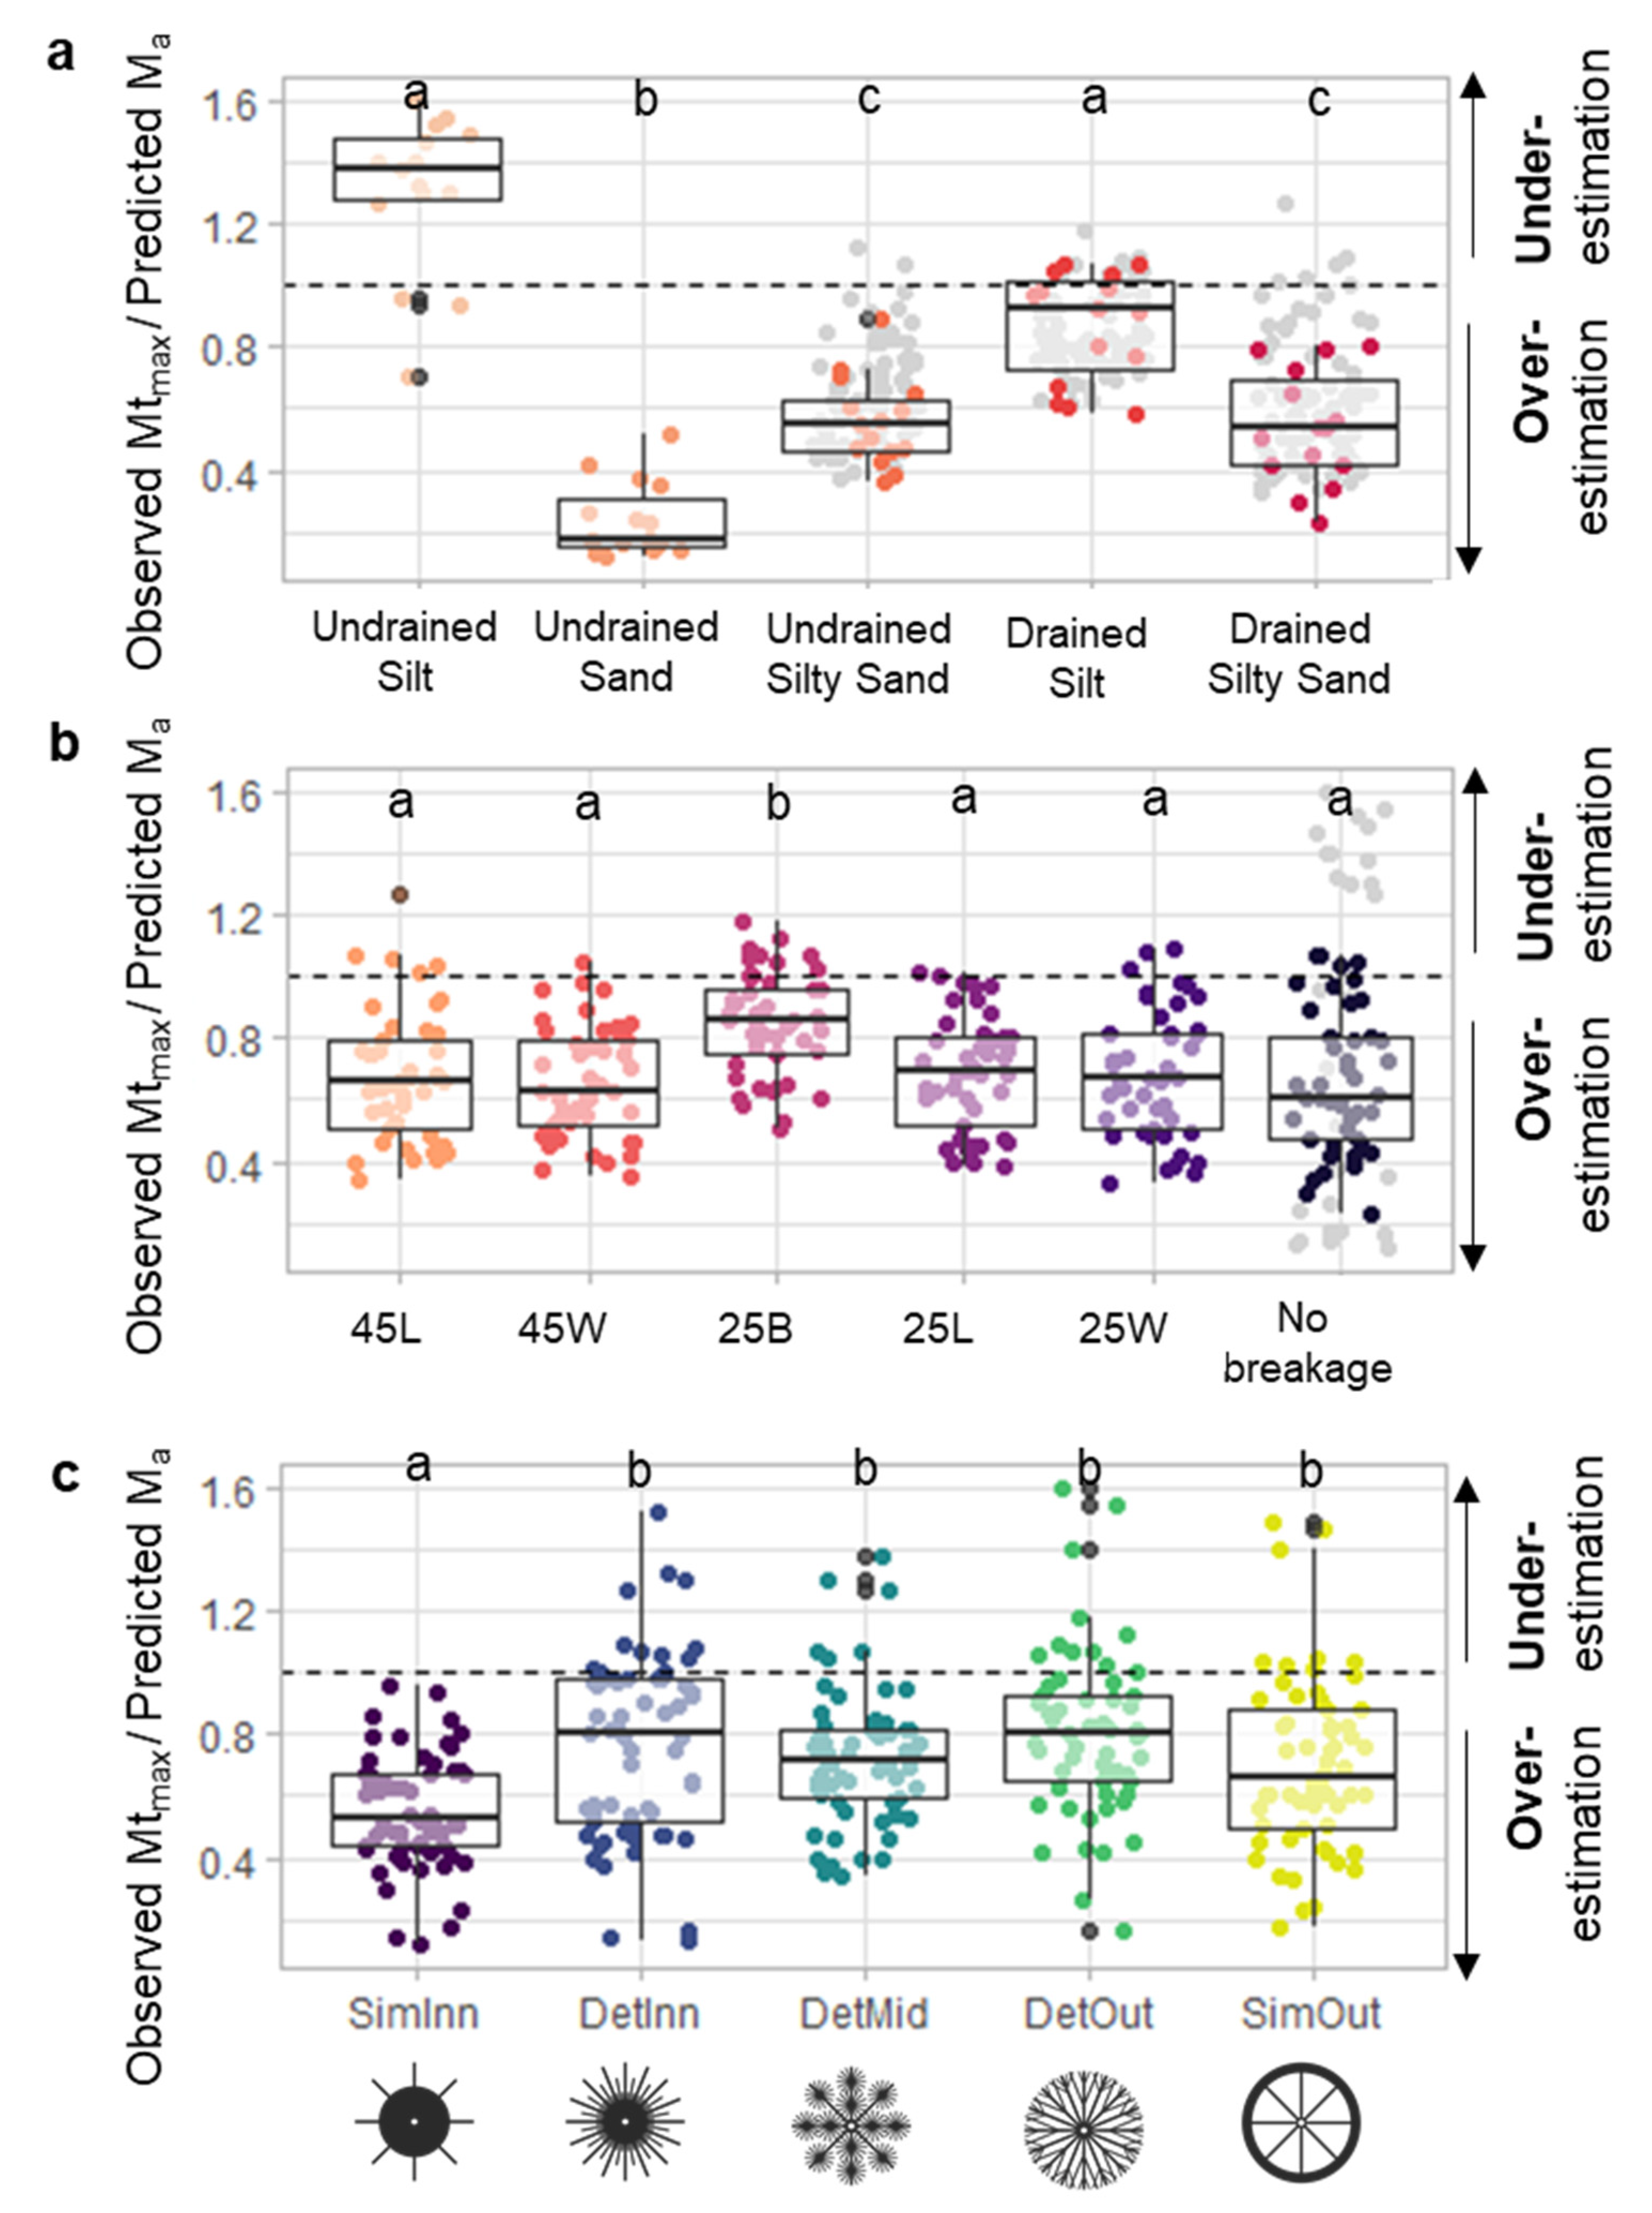
3.2. Anchorage Predictions and Model Fitting
4. Discussion
4.1. Strengths and Limitations of the Experimental Set Up
4.2. Validation with Field Experiments
4.3. Additional Drivers of Mangrove Root Development
4.4. Failure Models
4.5. Implications for Mangrove Stability in Coastal Settings
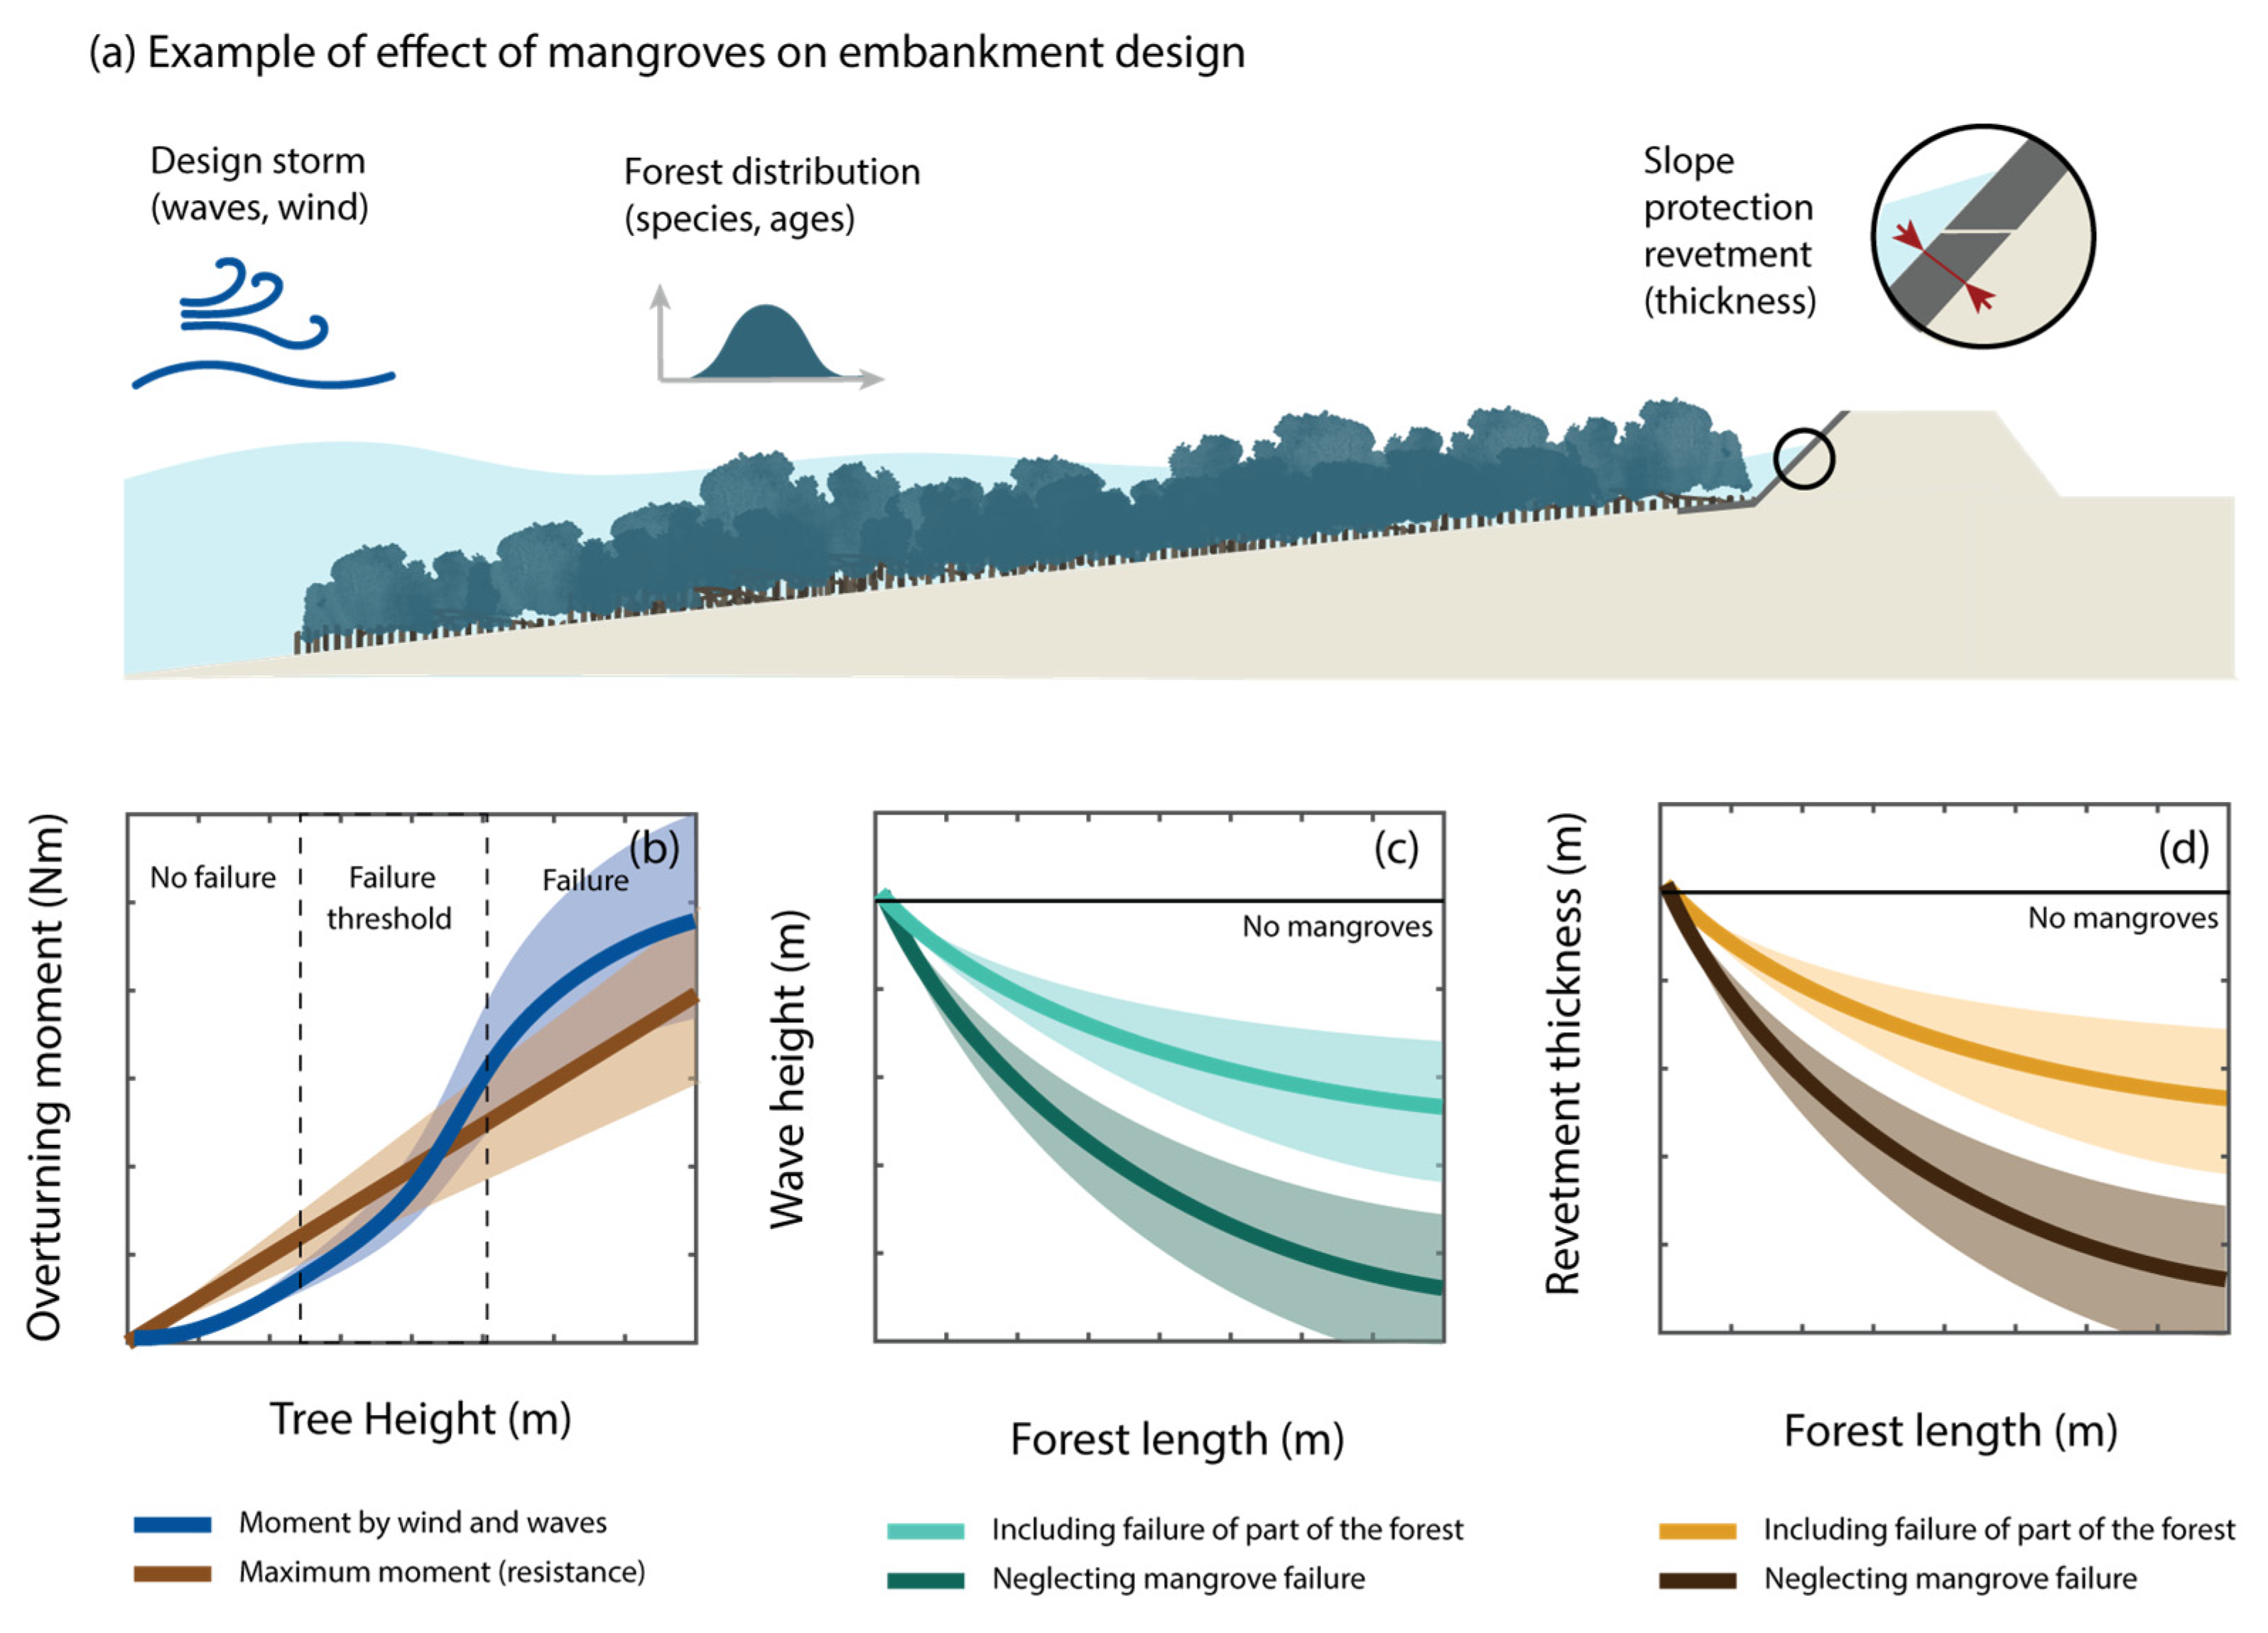
4.6. Frameworks to Implement Mangrove Failure in Coastal Protection
5. Conclusions
Supplementary Materials
Author Contributions
Funding
Institutional Review Board Statement
Informed Consent Statement
Data Availability Statement
Acknowledgments
Conflicts of Interest
Appendix A
Appendix A.1. Additional Information for the Methods

| Symbol | Unit | Meaning | Source |
|---|---|---|---|
| Soil parameters | |||
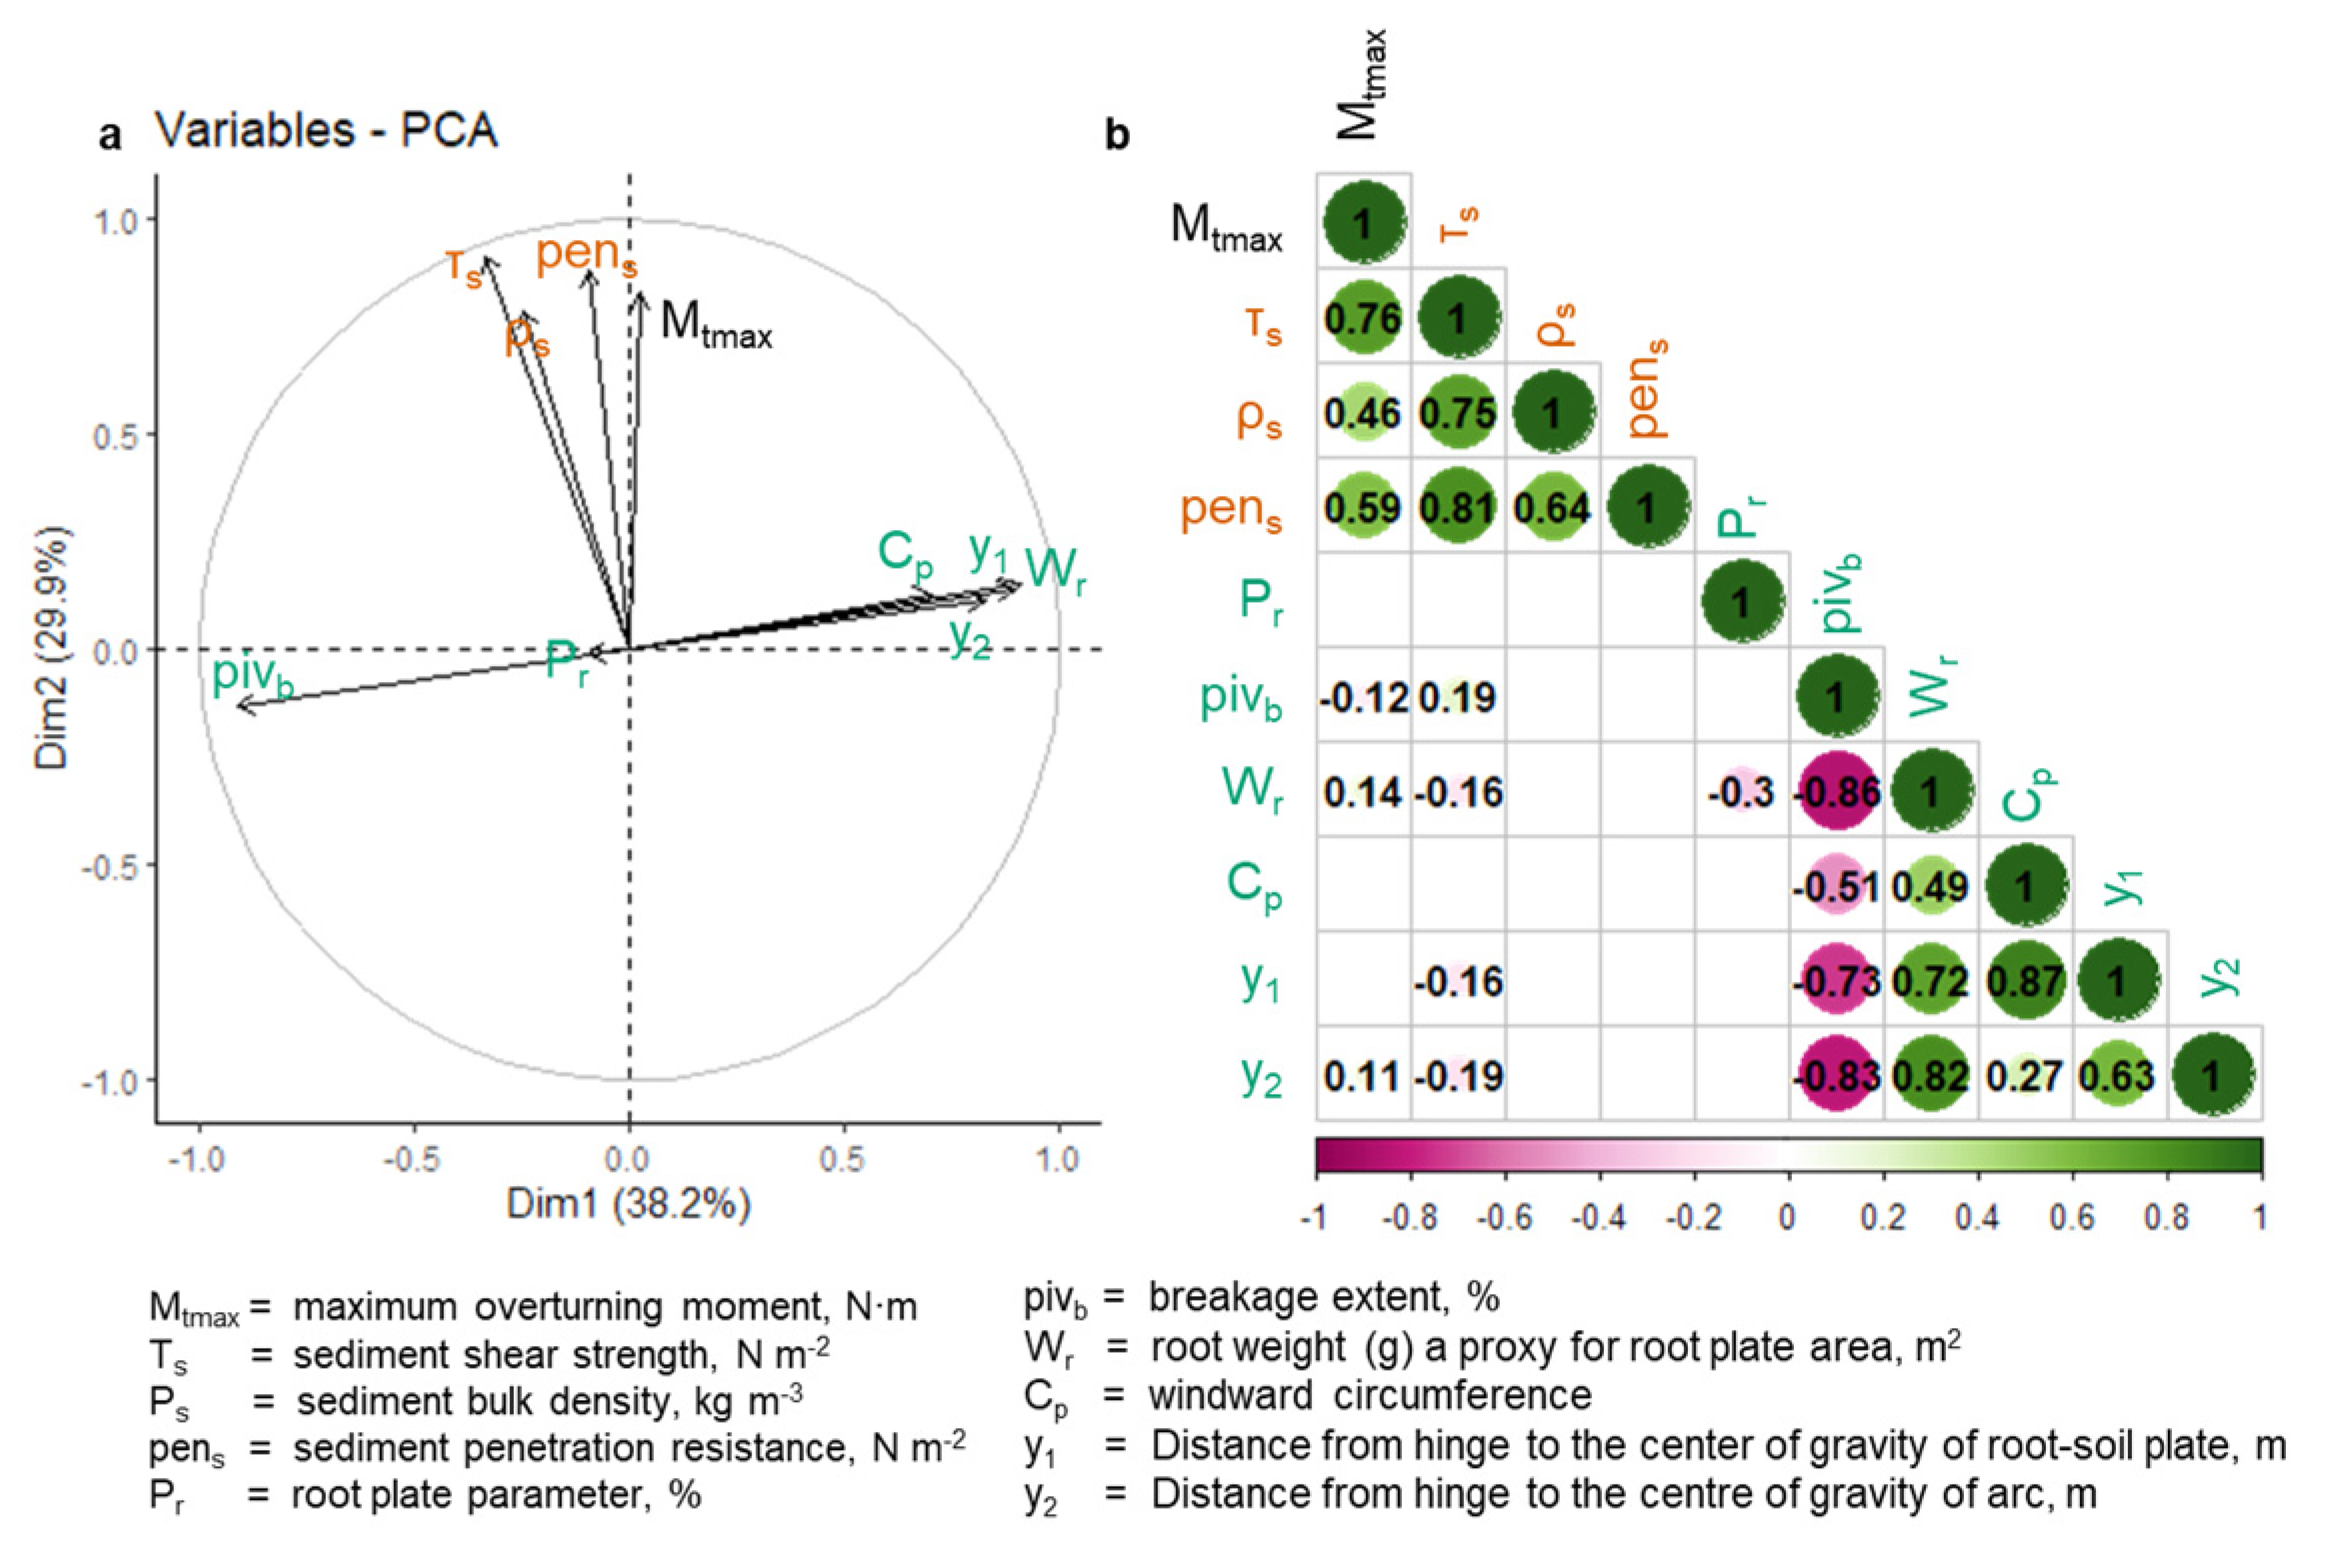
| N m−2 | Shear strength | Table 1 | |
| kg m−3 | Bulk density | Table 1 | |
| pens | N m−2 | Penetration resistance | Table 1 |
| Root parameters | |||
| Pr | % | Half surface parameter | Figure A2a |
| pivb | # | Number of root breakages | Figure 2b |
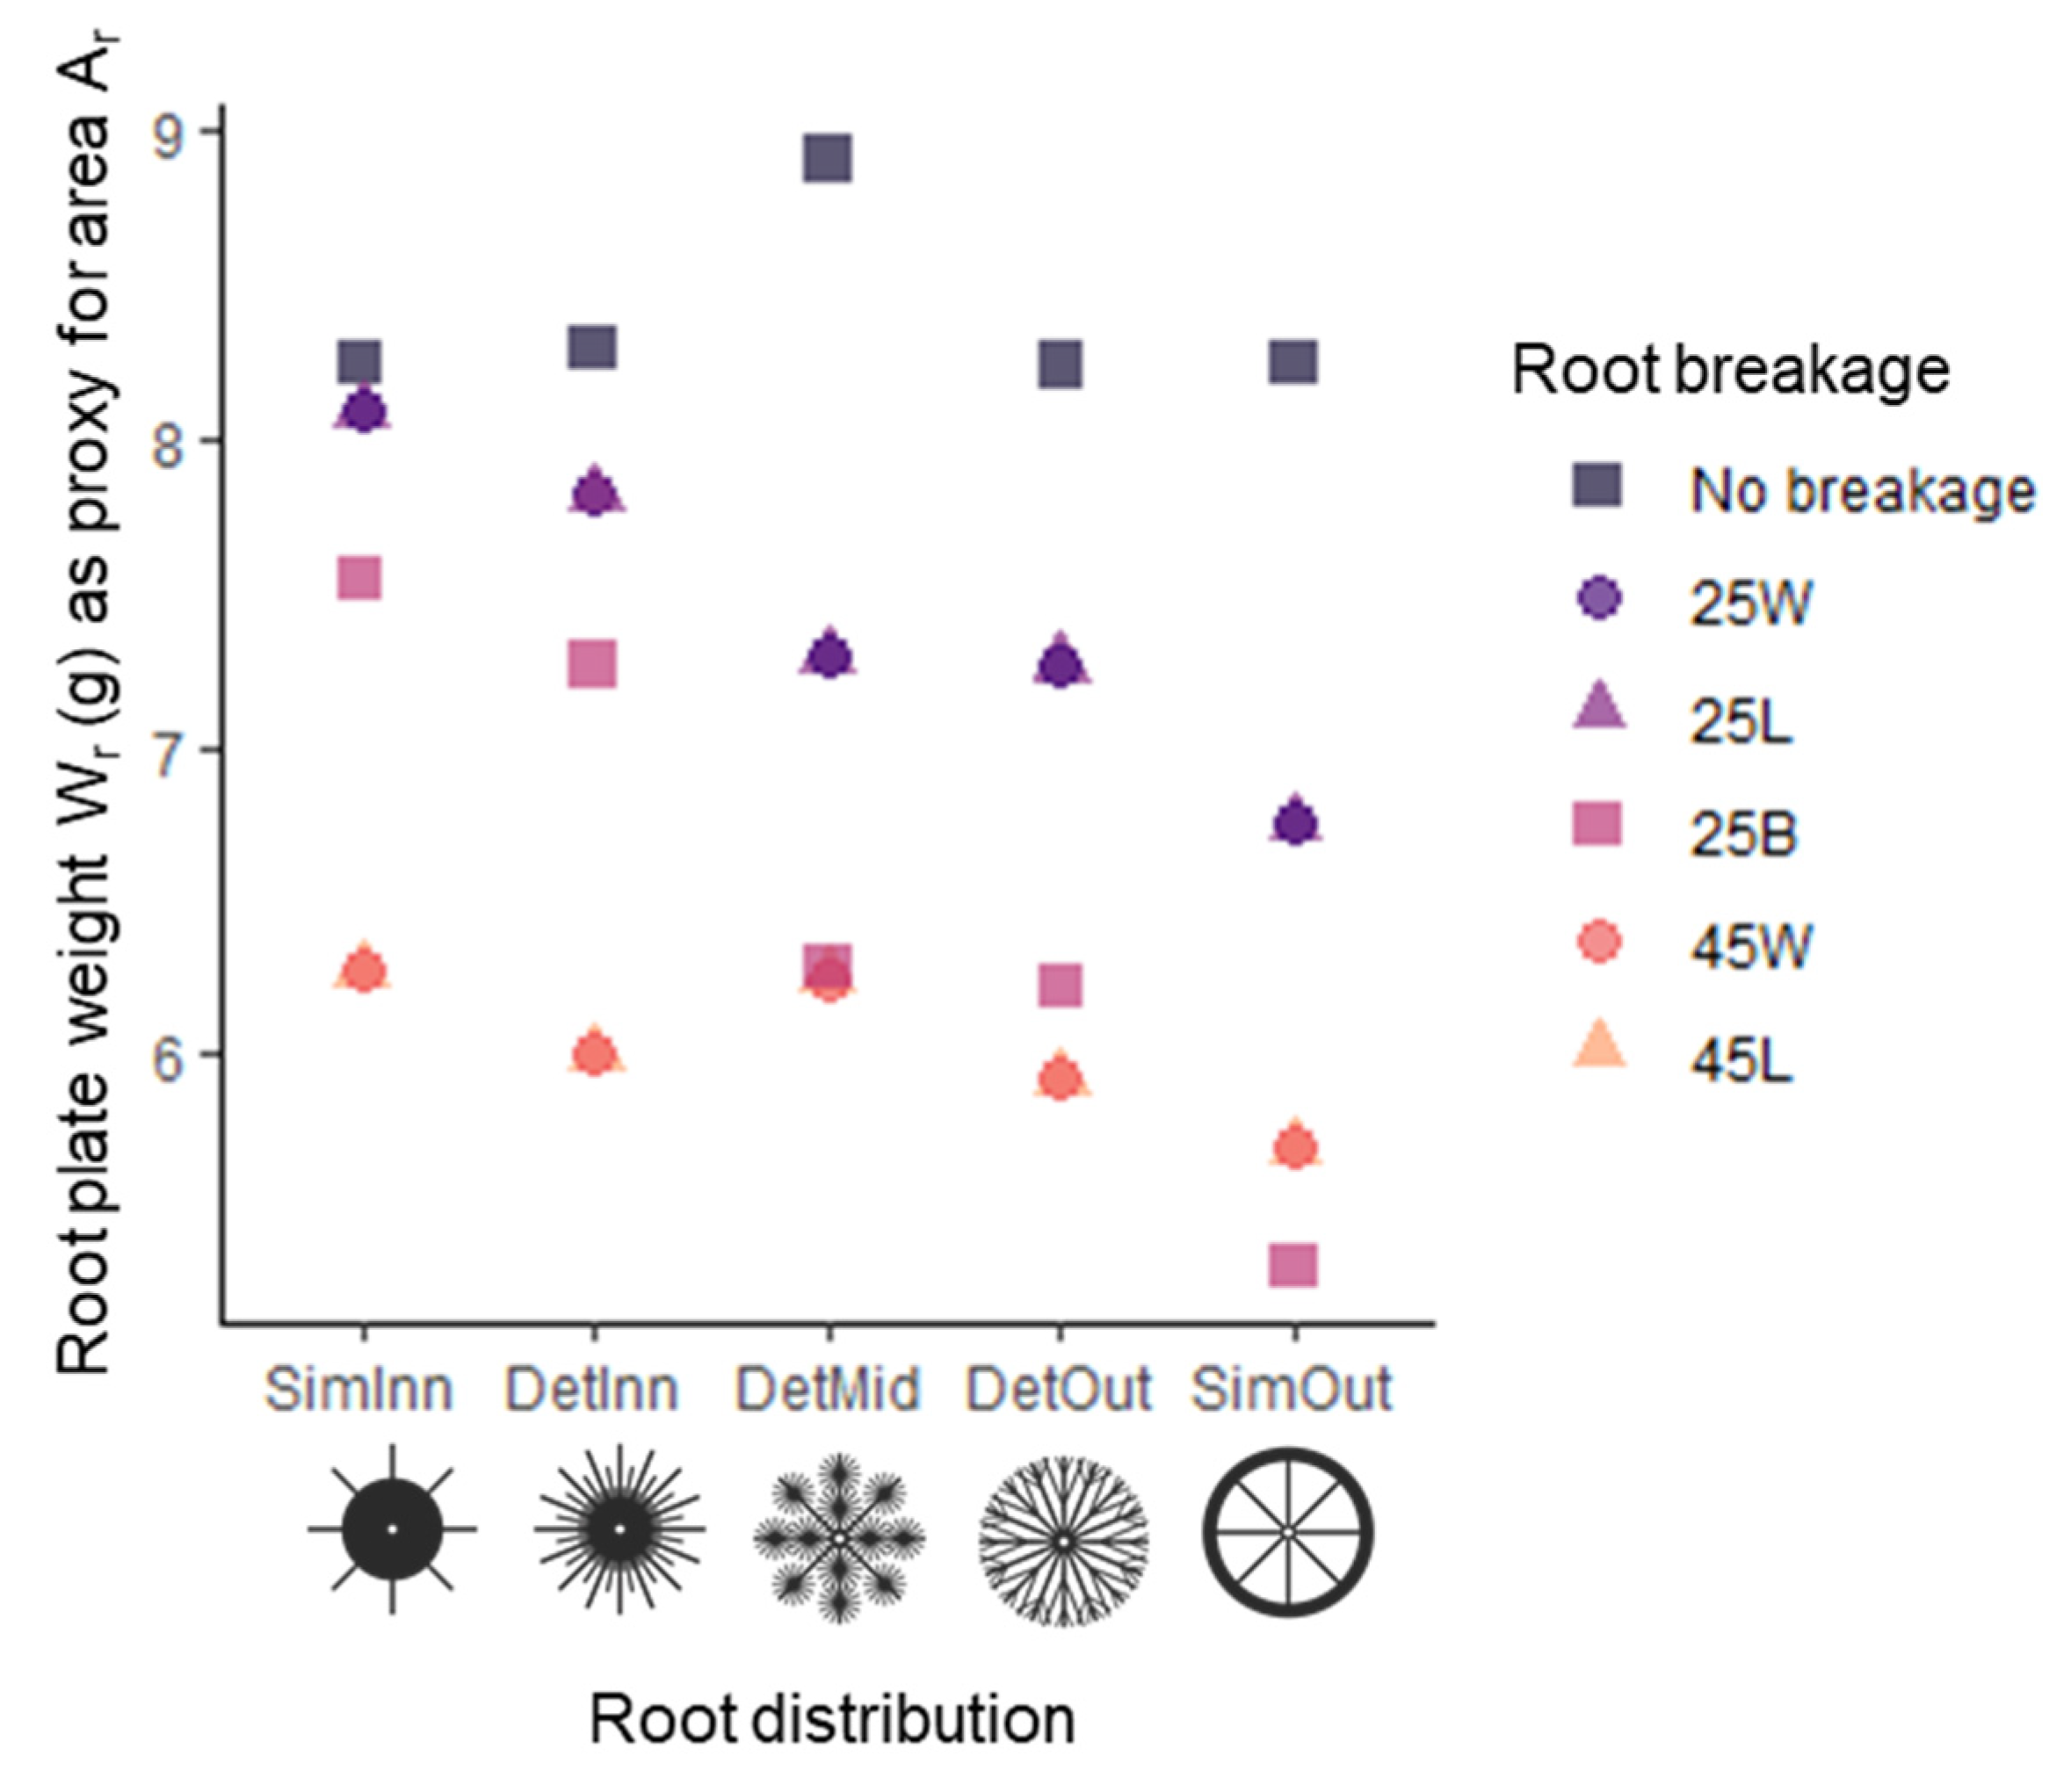
| m2 | Root plate area | Figure 3, Table S3 | |
| kg | Root plate weight, proxy for area Ar | Figure 3, Table S3 | |
| m | Sediment/rooting depth | 0.007; Table 2 | |
| Overturning components | |||
| Mt; Mtmax | N m | (Maximum) overturning moment | |
| Mp | N m | Pulling moment | |
| Ms | N m | Self-loading moment | |
| m | Pulling height | See Figure 4a | |
| N | Pulling load | See Figure 4a | |
| rad | Angle of pulling | See Figure 4a | |
| m | Horizontal displacement of the stem at pulling height | See Figure 4a | |
| kg | Aboveground biomass | 0.02 | |
| Anchorage components | |||
| Ma | N m | Anchorage moment | |
| Mw | N m | Weight moment | |
| Mr | N m | Resistance moment | |
| m | Distance from hinge to the center of gravity of root–sediment plate | Table S3, Figure A1 of the Appendix A | |
| kg | Weight of the sediment cylinder above the roots | ||
| N kg−1 | Gravitational constant | 9.81 | |
| m | Perimeter of windward side of the root plate | Table S3, Figure A1 of the Appendix A | |
| m | Distance from hinge to the center of gravity of the arc | Table S3, Figure A1 of the Appendix A | |
Appendix A.2. Additional Explanations and Results of Statistical Analyses
Appendix A.2.1. Additional Methods
Appendix A.2.2. Additional Results
| Statistical Model | df | AIC | Wi | Adj. R2 | p-Value |
|---|---|---|---|---|---|
| Mtmax~1 | 2 | −142.78 | 0 | 0 | NA |
| 3 | −399.28 | 0 | 0.58 | <0.001 | |
| 3 | −146.48 | 0 | 0.02 | 0.017 | |
| Mtmax~Pr2 | 4 | −142.9 | 0 | 0.01 | 0.13 |
| 4 | −451.16 | 0 | 0.64 | <0.001 | |
| + Pr2 | 5 | −405.13 | 0 | 0.59 | <0.001 |
| Mtmax~+ + | 5 | −490.85 | 0 | 0.69 | <0.001 |
| Mtmax~+ + Pr2 | 6 | −466.51 | 0 | 0.66 | <0.001 |
| Mtmax~+ + + Pr2 | 7 | −513.12 | 0 | 0.71 | <0.001 |
| Mtmax~+ + + Pr2 + Pr2 | 9 | −519.52 | 0.03 | 0.72 | <0.001 |
| Mtmax~+ + + Pr2 + Pr2 | 9 | −516.17 | 0.01 | 0.72 | <0.001 |
| Mtmax~+ + + Pr2 + Pr2 + Pr2 | 11 | −526.62 | 0.97 | 0.73 | <0.001 |

References
- Gijsman, R.; Horstman, E.M.; van der Wal, D.; Friess, D.A.; Swales, A.; Wijnberg, K.M. Nature-Based Engineering: A Review on Reducing Coastal Flood Risk With Mangroves. Front. Mar. Sci. 2021, 8, 702412. [Google Scholar] [CrossRef]
- van Hespen, R.; Hu, Z.; Borsje, B.; De Dominicis, M.; Friess, D.A.; Jevrejeva, S.; Kleinhans, M.G.; Maza, M.; van Bijsterveldt, C.E.; Van der Stocken, T.; et al. Mangrove forests as a nature-based solution for coastal flood protection: Biophysical and ecological considerations. Water Sci. Eng. 2023, 16, 1–13. [Google Scholar] [CrossRef]
- Mazda, Y.; Magi, M.; Ikeda, Y.; Kurokawa, T.; Asano, T. Wave reduction in a mangrove forest dominated by Sonneratia sp. Wetl. Ecol. Manag. 2006, 14, 365–378. [Google Scholar] [CrossRef]
- Quartel, S.; Kroon, A.; Augustinus, P.G.E.F.; Van Santen, P.; Tri, N.H. Wave attenuation in coastal mangroves in the Red River Delta, Vietnam. J. Asian Earth Sci. 2007, 29, 576–584. [Google Scholar] [CrossRef]
- Horstman, E.M.; Dohmen-Janssen, C.M.; Narra, P.M.F.; van den Berg, N.J.F.; Siemerink, M.; Hulscher, S.J.M.H. Wave attenuation in mangroves: A quantitative approach to field observations. Coast. Eng. 2014, 94, 47–62. [Google Scholar] [CrossRef]
- Kobashi, D.; Mazda, Y. Tidal Flow in Riverine-Type Mangroves. Wetl. Ecol. Manag. 2005, 13, 615–619. [Google Scholar] [CrossRef]
- Sánchez-Núñez, D.A.; Bernal, G.; Pineda, J.E.M. The Relative Role of Mangroves on Wave Erosion Mitigation and Sediment Properties. Estuaries Coasts 2019, 42, 2124–2138. [Google Scholar] [CrossRef]
- Saintilan, N.; Khan, N.S.; Ashe, E.; Kelleway, J.J.; Rogers, K.; Woodroffe, C.D.; Horton, B.P. Thresholds of Mangrove Survival Under Rapid Sea Level Rise. 2020. Available online: http://science.sciencemag.org/ (accessed on 3 March 2024).
- Krauss, K.W.; Osland, M.J. Tropical cyclones and the organization of mangrove forests: A review. Ann. Bot. 2020, 125, 213–234. [Google Scholar] [CrossRef] [PubMed]
- van Bijsterveldt, C.E.J.; Herman, P.M.J.; van Wesenbeeck, B.K.; Ramadhani, S.; Heuts, T.S.; van Starrenburg, C.; Tas, S.A.J.; Triyanti, A.; Helmi, M.; Tonneijck, F.H.; et al. Subsidence reveals potential impacts of future sea level rise on inhabited mangrove coasts. Nat. Sustain. 2023, 6, 1565–1577. [Google Scholar] [CrossRef]
- Alongi, D.M. Carbon sequestration in mangrove forests. Carbon. Manag. 2012, 3, 313–322. [Google Scholar] [CrossRef]
- Primavera, J.H. Mangroves as Nurseries: Shrimp Populations in Mangrove and Non-mangrove Habitats. Estuar. Coast. Shelf Sci. 1998, 46, 457–464. [Google Scholar] [CrossRef]
- Palacios, M.L.; Cantera, J.R. Mangrove timber use as an ecosystem service in the Colombian Pacific. Hydrobiologia 2017, 803, 345–358. [Google Scholar] [CrossRef]
- Smith, T.J., III; Boto, K.G.; Frusher, S.D.; Giddins, R.L. Keystone Species and Mangrove Forest Dynamics: The Influence of Burrowing by Crabs on Soil Nutrient Status and Forest Productivity. Estuar. Coast. Shelf Sci. 1991, 33, 419–432. [Google Scholar] [CrossRef]
- Cahoon, D.R.; Hensel, P.; Rybczyk, J.M.; Perez, B.C.; Christopher, B. Hurricane Mitch: Impacts on Mangrove Sediment Elevation Dynamics and Long-Term Mangrove Sustainability Recommended Citation; Western Washington University: Bellingham, WA, USA, 2002. [Google Scholar]
- Jiménez, J.A.; Lugo, A.E.; Cintrón, G. Tree Mortality in Mangrove Forests. Biotropica 1985, 17, 177–185. [Google Scholar] [CrossRef]
- Mo, Y.; Simard, M.; Hall, J.W. Tropical cyclone risk to global mangrove ecosystems: Potential future regional shifts. Front. Ecol. Environ. 2023, 21, 269–274. [Google Scholar] [CrossRef]
- Anthony, E.J.; Gardel, A.; Gratiot, N.; Proisy, C.; Allison, M.A.; Dolique, F.; Fromard, F. The Amazon-influenced muddy coast of South America: A review of mud-bank–shoreline interactions. Earth Sci. Rev. 2010, 103, 99–121. [Google Scholar] [CrossRef]
- Ellison, J.C. Impacts of Sediment Burial on Mangroves. Mar. Pollut. Bull. 1999, 37, 420–426. [Google Scholar] [CrossRef]
- Urata, T.; Shibuya, M.; Koizumi, A.; Torita, H.; Cha, J. Both stem and crown mass affect tree resistance to uprooting. J. For. Res. 2012, 17, 65–71. [Google Scholar] [CrossRef]
- Sagi, P.; Newson, T.; Miller, C.; Mitchell, S. Stem and root system response of a Norway spruce tree (Picea abies L.) under static loading. For. Int. J. For. Res. 2019, 92, 460–472. [Google Scholar] [CrossRef]
- Achim, A.; Nicoll, B.C. Modelling the anchorage of shallow-rooted trees. For. Int. J. For. Res. 2009, 82, 273–284. [Google Scholar] [CrossRef]
- COUTTS, M.P. Components of Tree Stability in Sitka Spruce on Peaty Gley Soil. For. Int. J. For. Res. 1986, 59, 173–197. [Google Scholar] [CrossRef]
- Fourcaud, T.; Ji, J.-N.; Zhang, Z.-Q.; Stokes, A. Understanding the Impact of Root Morphology on Overturning Mechanisms: A Modelling Approach. Ann. Bot. 2008, 101, 1267–1280. [Google Scholar] [CrossRef] [PubMed]
- Ow, L.F.; Harnas, F.R.; Indrawan, I.G.B.; Sahadewa, A.; Sim, E.K.; Rahardjo, H.; Leong, E.C.; Fong, Y.K.; Tan, P.Y. Tree-pulling experiment: An analysis into the mechanical stability of rain trees. Trees 2010, 24, 1007–1015. [Google Scholar] [CrossRef]
- Ferreira, T.O.; Otero, X.L.; de Souza Junior, V.S.; Vidal-Torrado, P.; Macías, F.; Firme, L.P. Spatial patterns of soil attributes and components in a mangrove system in Southeast Brazil (São Paulo). J. Soils Sediments 2010, 10, 995–1006. [Google Scholar] [CrossRef]
- Soares, M.L.G.; Schaeffer-Novelli, Y. Above-ground biomass of mangrove species. I. Analysis of models. Estuar. Coast. Shelf Sci. 2005, 65, 1–18. [Google Scholar] [CrossRef]
- Gilman, E.L.; Ellison, J.; Duke, N.C.; Field, C. Threats to mangroves from climate change and adaptation options: A review. Aquat. Bot. 2008, 89, 237–250. [Google Scholar] [CrossRef]
- Winterwerp, J.C.; Albers, T.; Anthony, E.J.; Friess, D.A.; Mancheño, A.G.; Moseley, K.; Muhari, A.; Naipal, S.; Noordermeer, J.; Oost, A.; et al. Managing erosion of mangrove-mud coasts with permeable dams—Lessons learned. Ecol. Eng. 2020, 158, 106078. [Google Scholar] [CrossRef]
- Van Loon, A.F.; Brake, B.T.; Van Huijgevoort, M.H.J.; Dijksma, R. Hydrological classification, a practical tool for mangrove restoration. PLoS ONE 2016, 11, 3. [Google Scholar] [CrossRef]
- Watson, J.G. Mangrove Forests of the Malay Peninsula; Printed by Fraser & Neave: Singapore, 1928; Available online: https://www.biodiversitylibrary.org/item/331433 (accessed on 10 November 2024).
- PLASTIM. Product Data Sheet Nylon 12; PLASTIM: Gloucester, UK, 2015. [Google Scholar]
- Njana, M.A.; Bollandsås, O.M.; Eid, T.; Zahabu, E.; Malimbwi, R.E. Above- and belowground tree biomass models for three mangrove species in Tanzania: A nonlinear mixed effects modelling approach. Ann. For. Sci. 2016, 73, 353–369. [Google Scholar] [CrossRef]
- Njana, M.A.; Eid, T.; Zahabu, E.; Malimbwi, R. Procedures for quantification of belowground biomass of three mangrove tree species. Wetl. Ecol. Manag. 2015, 23, 749–764. [Google Scholar] [CrossRef]
- Johnson, J.B.; Omland, K.S. Model selection in ecology and evolution. Trends Ecol. Evol. 2004, 19, 101–108. [Google Scholar] [CrossRef]
- Zanetti, C.; Vennetier, M.; Mériaux, P.; Provansal, M. Plasticity of tree root system structure in contrasting soil materials and environmental conditions. Plant Soil. 2015, 387, 21–35. [Google Scholar] [CrossRef]
- Hill, J.W.; Bennion, V.; Lovelock, C.E. Mangrove tree strength estimated with field experiments. Ecol. Eng. 2024, 203, 107259. [Google Scholar] [CrossRef]
- Vovides, A.G.; Berger, U.; Grueters, U.; Guevara, R.; Pommerening, A.; Lara-Domínguez, A.L.; López-Portillo, J. Change in drivers of mangrove crown displacement along a salinity stress gradient. Funct. Ecol. 2018, 32, 2753–2765. [Google Scholar] [CrossRef]
- Vovides, A.G.; Berger, U.; Balke, T. Chapter 5—Morphological plasticity and survival thresholds of mangrove plants growing in active sedimentary environments. In Dynamic Sedimentary Environments of Mangrove Coasts; Sidik, F., Friess, D.A., Eds.; Elsevier: Amsterdam, The Netherlands, 2021; pp. 121–140. [Google Scholar] [CrossRef]
- Nicoll, B.C.; Ray, D. Adaptive growth of tree root systems in response to wind action and site conditions. Tree Physiol. 1996, 16, 891–898. [Google Scholar] [CrossRef]
- McKee, K.L. Interspecific Variation in Growth, Biomass Partitioning, and Defensive Characteristics of Neotropical Mangrove Seedlings: Response to Light and Nutrient Availability. Am. J. Bot. 1995, 82, 299–307. [Google Scholar] [CrossRef]
- Ye, Y.; Tam, N.F.Y.; Wong, Y.S.; Lu, C.Y. Growth and physiological responses of two mangrove species (Bruguiera gymnorrhiza and Kandelia candel) to waterlogging. Environ. Exp. Bot. 2003, 49, 209–221. [Google Scholar] [CrossRef]
- Nicoll, B.C.; Gardiner, B.A.; Rayner, B.; Peace, A.J. Anchorage of coniferous trees in relation to species, soil type, and rooting depth. Can. J. For. Res. 2006, 36, 1871–1883. [Google Scholar] [CrossRef]
- Rahardjo, H.; Harnas, F.R.; Leong, E.C.; Tan, P.Y.; Fong, Y.K.; Sim, E.K. Tree stability in an improved soil to withstand wind loading. Urban. For. Urban. Green. 2009, 8, 237–247. [Google Scholar] [CrossRef]
- Gillen, M.N.; Messerschmidt, T.C.; Kirwan, M.L. Biophysical controls of marsh soil shear strength along an estuarine salinity gradient. Earth Surf. Dynam. 2021, 9, 413–421. [Google Scholar] [CrossRef]
- Grabowski, R.C.; Droppo, I.G.; Wharton, G. Erodibility of cohesive sediment: The importance of sediment properties. Earth Sci. Rev. 2011, 105, 101–120. [Google Scholar] [CrossRef]
- Yoshikai, M.; Nakamura, T.; Suwa, R.; Argamosa, R.; Okamoto, T.; Rollon, R.; Basina, R.; Primavera-Tirol, Y.H.; Blanco, A.C.; Adi, N.S.; et al. Scaling relations and substrate conditions controlling the complexity of Rhizophora prop root system. Estuar. Coast. Shelf Sci. 2021, 248, 107014. [Google Scholar] [CrossRef]
- Mendez, F.J.; Losada, I.J. An empirical model to estimate the propagation of random breaking and nonbreaking waves over vegetation fields. Coast. Eng. 2004, 51, 103–118. [Google Scholar] [CrossRef]
- Morison, J.R.; Johnson, J.W.; Schaaf, S.A. The Force Exerted by Surface Waves on Piles. J. Pet. Technol. 1950, 2, 149–154. [Google Scholar] [CrossRef]
- Banerjee, K.; Bal, G.; Mitra, A. How Soil Texture Affects the Organic Carbon Load in the Mangrove Ecosystem? A Case Study from Bhitarkanika, Odisha. In Environmental Pollution, Water Science and Technology Library; Singh, V.P., Yadav, S., Yadava, R.N., Eds.; Springer Singapore: Singapore, 2018; pp. 329–341. [Google Scholar] [CrossRef]
- Bulmer, R.H.; Lundquist, C.J.; Schwendenmann, L. Sediment properties and CO2 efflux from intact and cleared temperate mangrove forests. Biogeosciences 2015, 12, 6169–6180. [Google Scholar] [CrossRef]
- Dewiyanti, I.; Darmawi, D.; Muchlisin, Z.A.; Helmi, T.Z.; Imelda, I.; Defira, C.N. Physical and chemical characteristics of soil in mangrove ecosystem based on differences habitat in Banda Aceh and Aceh Besar. IOP Conf. Ser. Earth Environ. Sci. 2021, 674, 012092. [Google Scholar] [CrossRef]
- Duan, J.; Han, J.; Zhou, H.; Lau, Y.L.; An, W.; Wei, P.; Cheung, S.G.; Yang, Y.; Tam, N.F. Development of a digestion method for determining microplastic pollution in vegetal-rich clayey mangrove sediments. Sci. Total Environ. 2020, 707, 136030. [Google Scholar] [CrossRef]
- Stokes, D.J.; Harris, R.J. Sediment properties and surface erodibility following a large-scale mangrove (Avicennia marina) removal. Cont. Shelf Res. 2015, 107, 1–10. [Google Scholar] [CrossRef]
- Takagi, H.; Xiong, Y.; Furukawa, F. Track analysis and storm surge investigation of 2017 Typhoon Hato: Were the warning signals issued in Macau and Hong Kong timed appropriately? Georisk Assess. Manag. Risk Eng. Syst. Geohazards 2018, 12, 297–307. [Google Scholar] [CrossRef]
- van Hespen, R.; Hu, Z.; Peng, Y.; Borsje, B.W.; Kleinhans, M.; Ysebaert, T.; Bouma, T.J. Analysis of coastal storm damage resistance in successional mangrove species. Limnol Ocean. 2021, 66, 3221–3236. [Google Scholar] [CrossRef]


| Saturation State | Sediment | Sand Content (%) | Silt Content (%) | Average Grain Size (µm) | Water Content (% of Dry Weight) | Bulk Density ρs (kg m−3) | Penetration Resistance Pens (kPa) | Shear Strength τs (kPa) |
|---|---|---|---|---|---|---|---|---|
| Undrained | Silt | 0 | 100 | 30 | 100 | 1498 | 0.5 | 0.7 |
| Undrained | Sand | 100 | 0 | 400 | 30 | 1732 | 64.3 | 7.6 |
| Undrained | Silty sand | 50 | 50 | 215 | 50 | 1738 | 6.5 | 9.1 |
| Drained | Silt | 0 | 100 | 30 | 70 | 1537 | 20.0 | 15.0 |
| Drained | Silty sand | 50 | 50 | 215 | 30 | 1903 | 53.7 | 40.7 |
| Prediction Equation | df | AIC (Mt~Ma) | Wi | r (p < 0.01) | ||
|---|---|---|---|---|---|---|
| 5 | −507.08 | 0.06 | 0.84 | 0.03 | 0.56 | |
| 2 | −153.08 | 0 | 0.2 | 0.17 | 14.07 | |
| 3 | −512.6 | 0.94 | 0.84 | 0.04 | 0.56 | |
| l | 2 | −491.76 | 0 | 0.83 | 0.03 | 0.07 |
| 2 | −145.53 | 0 | 0.13 | 0.18 | 3065.44 | |
| 2 | −433.52 | 0 | 0.79 | 0.03 | 0.02 |
Disclaimer/Publisher’s Note: The statements, opinions and data contained in all publications are solely those of the individual author(s) and contributor(s) and not of MDPI and/or the editor(s). MDPI and/or the editor(s) disclaim responsibility for any injury to people or property resulting from any ideas, methods, instructions or products referred to in the content. |
© 2025 by the authors. Licensee MDPI, Basel, Switzerland. This article is an open access article distributed under the terms and conditions of the Creative Commons Attribution (CC BY) license (https://creativecommons.org/licenses/by/4.0/).
Share and Cite
van Hespen, R.; Gijón Mancheño, A.; Kleinhans, M.; van Belzen, J.; van Bijsterveldt, C.E.J.; de Smit, J.; Hu, Z.; Borsje, B.W.; Hofland, B.; Bouma, T.J. Unravelling Mangrove Storm Damage Resistance for Sustainable Flood Defense Safety Using 3D-Printed Mimics. Sustainability 2025, 17, 2602. https://doi.org/10.3390/su17062602
van Hespen R, Gijón Mancheño A, Kleinhans M, van Belzen J, van Bijsterveldt CEJ, de Smit J, Hu Z, Borsje BW, Hofland B, Bouma TJ. Unravelling Mangrove Storm Damage Resistance for Sustainable Flood Defense Safety Using 3D-Printed Mimics. Sustainability. 2025; 17(6):2602. https://doi.org/10.3390/su17062602
Chicago/Turabian Stylevan Hespen, Rosanna, Alejandra Gijón Mancheño, Maarten Kleinhans, Jim van Belzen, Celine E. J. van Bijsterveldt, Jaco de Smit, Zhan Hu, Bas W. Borsje, Bas Hofland, and Tjeerd J. Bouma. 2025. "Unravelling Mangrove Storm Damage Resistance for Sustainable Flood Defense Safety Using 3D-Printed Mimics" Sustainability 17, no. 6: 2602. https://doi.org/10.3390/su17062602
APA Stylevan Hespen, R., Gijón Mancheño, A., Kleinhans, M., van Belzen, J., van Bijsterveldt, C. E. J., de Smit, J., Hu, Z., Borsje, B. W., Hofland, B., & Bouma, T. J. (2025). Unravelling Mangrove Storm Damage Resistance for Sustainable Flood Defense Safety Using 3D-Printed Mimics. Sustainability, 17(6), 2602. https://doi.org/10.3390/su17062602