Abstract
The synergistic convergence of digital and green finance (DGF) serves as a critical role for advancing ecological modernization in urban systems and carbon reduction performance (PCRP). Based on the symbiotic co-evolution of digital finance (DF) and green finance (GF), this study explored the developmental and evolutionary patterns, spatial effects, and influence mechanisms of DGF and PCRP in Chinese cities. The findings include the following: (1) Between 2011 and 2022, the levels of both DGF and PCRP increased and were generally higher in the eastern coastal cities than in the less developed western cities. (2) The spatial and temporal associations of DGF and PCRP showed a positive and intensifying relationship during this period, with most cities showing a positive correlation. (3) Spatial correlation was clearly positive, characterized by a clear trend of expansion and concentration of High-high aggregates and an overall banded distribution of all types of aggregates. The High-high clusters were mainly concentrated in the eastern cities and inland major cities; notably, the Low-low clusters were mostly distributed around the High-high clusters, with a relatively stable distribution. (4) In terms of spatial spillover effects, DGF not only contributed directly to PCRP but also indirectly advanced it through improving ESG performance, promoting green technology innovation and increasing public concern for the environment. In addition, the effect of DGF on PCRP was more pronounced in the eastern parts and non-resource cities. This study provides theoretical and empirical support for deepening DGF to promote PCRP at the city level.
1. Introduction
In the 21st century, air pollution and climate change are no longer peripheral issues but have become important challenges to economic society and sustainable human development [1,2]. Emissions of air pollutants have led to a deterioration in air quality, and climate change, particularly as a result of increased greenhouse gas, has led to rising global temperatures, extreme weather, and the destruction of ecosystems. These changes not only pose a threat to the natural environment but also have far-reaching implications for socio-economic structures and human life. In China, the energy structure characterized by “abundant coal, scarce oil, and limited natural gas” has imposed enormous environmental costs [3]. Especially in the “post-pandemic era”, economic recovery may pose greater challenges to the governance of pollutant emissions and the achievement of dual-carbon goals [4]. Accordingly, in 2022, the Ministry of Ecology and Environment and other departments jointly promulgated the “Implementation Plan for Synergistic Emission Reduction and Carbon Reduction” to give a top-level design for the deep coordination of improving ecological environment quality and achieving the dual-carbon target. The report of the 20th National Congress of the Communist Party of China further highlighted the importance of synergistic development carbon and pollution reduction. However, China remains the world’s leading carbon and pollution emitter major carbon and pollution emitter. The International Energy Agency (IEA) reported that China’s carbon dioxide emissions increased by 565 MT in 2023 compared to 2022, reaching 12.6 MT, which was about 35% of the global total and much higher than other countries and regions. According to data released by IQAir, the annual average PM2.5 in China was 32.5 μg/m3 in 2023, an increase of 6.3% compared to 2022, significantly exceeding the WHO safety threshold (5 μg/m3). There are many similarities between atmospheric pollution and CO2 in terms of sources, production, and spatial and temporal evolution [5], so the Chinese government continues to face the dual stresses and problems of enhancing air quality and mitigating CO2 emissions. China’s environmental protection will take a new step towards the synergistic management of pollution reduction and carbon abatement during the 14th Five-Year Plan period. Therefore, how to promote the synergistic enhancement of pollution reduction and carbon emission mitigation has become the key to alleviating environmental issues and an inevitable choice for the transition towards sustainable social development.
Under the “dual-carbon” objective, steady progress in the low-carbon transformation of the energy mix and the promotion of synergies between pollution reduction and carbon reduction will require substantial financial support. Although the government can provide a portion of the necessary funds through increased fiscal investment and tax subsidies [6], the capacity of fiscal support for pollution reduction and carbon mitigation is ultimately limited. So finance plays a crucial role in guiding capital flows and resource allocation [7]. However, due to issues such as information asymmetry in traditional financial sectors, a certain financial exclusion has already been exposed [8]. For instance, green technology innovation requires substantial capital investment, but traditional finance offers insufficient support due to high risks, thus posing financing challenges for green innovation. And, in remote areas, financial exclusion is mainly manifested in the scarcity of financial institution branches, the limited coverage of financial services, and information transmission barriers caused by geographical distance, which in turn affect the financial support for local green development projects. Therefore, there is an urgent need for a more inclusive and green financial system to promote green transformation and sustainable growth. As a result, China’s 6th Central Financial Work Conference proposed to center around major aspects of DF and GF and promote the integration of DF and GF scenarios. Furthermore, China occupies a leading position globally in technological domains, such as mobile payments, blockchain, and big data analytics, and is one of the world’s largest issuers of green bonds. DF and GF are becoming important market-based instruments. DF, as a new financial product in the digital economy, leverages digital technologies to alleviate information imbalances and reduce financial services costs, offering advantages that traditional finance cannot match [9]. GF provides new insights into utilizing financial instruments to achieve environmental goals, as evidenced by its impact on urban emission reduction strategies [10]. According to China’s Policy and Action on Climate Change 2024 Annual Report, over RMB 830 billion of green bonds were issued in 2023, and the balance of green loans in local and foreign currencies amounted to RMB 30.08 trillion. And, digital financial technology has helped to improve the efficiency and transparency of issuance. Therefore, as a fusion of financial “digitization” and “greening”, DGF not only makes GF more inclusive but also makes DF greener, which is crucial for improving ecological quality.
Currently, the existing literature extensively discusses pollution reduction and carbon mitigation within the background of digital finance and green finance. Firstly, studies of the role of DF and GF in reducing pollution and carbon mitigation primarily focus on two aspects: (1) There are studies on the impact of DF or GF on carbon reduction and environmental pollution. Some scholars believed that DF can significantly inhibit carbon emissions [11] and haze pollution [12] and alleviate environmental degradation by cultivating urban innovation capacity [13]. But some scholars found that DF had no significant synergistic policy effect on carbon emissions through empirical studies in Asia [14]. Other scholars constructed nonlinear models to reveal that the emission reduction effect had threshold characteristics [15]. There was a clear U-shaped connection between digital finance and the performance of carbon pollution collaborative governance [16]. Additionally, most scholars acknowledged the optimistic impact of GF on reducing pollution and carbon emission [17]. Ozili (2022) argued that DF was an innovative approach to environmental finance for sustainable development [18]. In addition to China, data from countries in South Asia, Southeast Asia, the Middle East, and Europe also showed that environmental sustainability benefited greatly from green financing [19]. (2) There are studies on the impact path of DF and GF on pollution reduction and carbon reduction. Scholars believed that these impacts can be transmitted through technological innovation [20], structural transformation [21], and optimized labor allocation [22]. Secondly, regarding the spatial spillover influences of DF or GF on pollution reduction and carbon emission mitigation, DF had a confident spatial spillover effect on pollution and carbon decreasing [23], while GF exhibited a spatial inhibition of carbon emissions [24]. Lastly, it is about the impact of the integration of DF and GF on reducing pollution and carbon emission. The EU’s use of blockchain technology to improve the transparency of the green bond market can better serve climate and environmental projects [25]. This convergence not only increases the transparency and credibility of green projects but also drives the effective application of green financial instruments through technological innovation. Studies in China showed that DGF had a significant positive impact on pollution and carbon reduction, mainly in the form of direct, transfer, and nonlinear effects [26,27].
In summary, scholars have made important findings in revealing the effect of digital or green finance on pollution and carbon abatement, the interaction between DF and GF, as well as the effects of DGF. These findings offer invaluable insights and serve as a crucial reference for this paper. Based on this, this paper systematically seeks the spatial spillover effects and influence pathways of DGF on PCPR, providing empirical and theoretical perspectives into the causal link between DGF and PCRP, with potential contributions possibly as follows: (1) Most of the existing literature discusses how to achieve pollution or carbon reduction in a fragmented manner, generally ignoring the nature of carbon emission and air pollution, which have the same root and origin [28], and most of the studies on pollution and carbon reduction focus on the impact of the absolute amount of carbon emission and air pollution, while carbon emission is expected to continue to rise in the next few years according to the study of [29], which cannot really solve the problem of efficiency by only focusing on the quantity. Therefore, this paper systematically estimates the pollution and carbon declining performance of Chinese cities from an efficiency perspective by constructing a body of assessment indicators. (2) Academics are more inclined to DF or GF, seldom explore the role of fusion of these two fields, and take less care of the spatial spillover effect of DGF. Therefore, whether the DGF can fully realize its dual green and inclusive character, become a strong tool for improving PCRP, and produce beneficial spatial spillover effects requires further empirical research. By conforming DGF and PCRP into a combined analytical framework, this paper discovers the effect of “1 + 1 > 2” and discusses the spatial positive externality of DGF and PCRP from the new perspective of spatial spillovers, which fills the gap in the literature between the two. (3) This paper focuses on the influence path of DGF to promote PCRP and uses the spatial mediation model to incorporate ESG performance, green technology innovation, and public environmental concern into the research framework, which innovatively reveals how DGF affects the specific mechanism of PCPR from a spatial perspective and enriches the theoretical framework of DGF driving PCRP. Moreover, this paper analyzes the heterogeneity of DGF according to the differences in resource endowment and geographic location, which provide a good basis for the government to make “right-sizing” measures to address the impact of DGF.
The following parts follow a conventional structure: Section 2 carries out a theoretical analysis and explores the spatial effects of DGF on PCRP and the mechanisms. Section 3 describes in detail the research methodology, including the corresponding model construction, the interpretation of the variables, and the spatial and temporal evolution of DGF and PCRP. Section 4 presents the empirical analyses. Finally, Section 5 summarizes and discusses the findings of this study, leading to policy recommendations.
2. Theoretical Analyses and Hypotheses
2.1. PCRP Effect of DGF
DGF is recognized as a supplement and interaction between DF and GF [30]. From the perspective of essential attributes, DF and GF are both important parts of the financial system, and DF can effectively promote the development of GF by reducing information imbalance and enhancing the transparency and efficiency of financial transactions. GF is able to promote the application of DF in the green field through policy guidance and financial support, so DF has natural green attributes [13]. Therefore, DGF has both inclusive and green functions. This integration not only reflects the consistency of their goals, namely, promoting sustainable economic progress and environmental protection, but also demonstrates their complementarity in terms of technological means and application scenarios. It serves as a crucial driving force for enhancing pollution and carbon reduction performance.
The intrinsic connection between DF and GF enables them to produce positive interactions on multiple levels, forming a virtuous cycle that jointly serves the total green conversion of economies and societies. The influence of DGF on PCRP can be researched primarily from the views of resource allocation and financing costs. From the perspective of resource allocation, DGF can optimize capital and energy resource allocation. Firstly, DGF optimizes capital resource allocation. GF optimizes market resource allocation by regulating capital flows [31], directing capital more effectively to enterprises and projects committed to reducing pollution emissions and lowering carbon footprints. DF utilizes digital technology to build efficient risk control and monitoring systems, providing a scientific basis for quantifying enterprises’ green development performance, thereby continuously enhancing the precision and effectiveness of GF resource allocation. Secondly, DGF optimizes energy resource allocation. The acquisition of energy is closely related to improvements in financial institution services. DGF can promote the digitization of energy systems through technologies such as the Internet of Things and big data analysis, directly optimizing energy allocation and use. This systematically reduces energy intensity and improves energy efficiency, thereby enhancing PCRP. From the perspective of financing costs, DGF impacts financing costs in both sides. On the one hand, for highly polluting and emitting enterprises, DGF can increase their financing costs and barriers to entry [32], constraining their production behaviors and prompting them to transition towards green and low-carbon operations. For example, green credit achieves pollution reduction and emission reduction by reducing the allocation of credit resources to high-energy-consumption and high-pollution enterprises. On the other hand, DGF helps financial institutions more accurately fund businesses that meet green environmental criteria [33], alleviating information asymmetry. This promotes green bond and green investment issuance, broadening financing channels and reducing financing costs for green and low-carbon enterprises.
On spatial effects, DGF, supported by digital technology, can break the time and space constraints on factor mobility, facilitating the flow of innovative and green production factors across different regions. Firstly, the development of GF exerts positive demonstration effects [34] and trickle-down effects [35] on surrounding cities by accelerating capital flows, technology transfers, and policy references. Secondly, DF can transcend geographical boundaries and break traditional market segmentation, thereby influencing surrounding cities. Furthermore, neighboring cities can draw on the green development experiences and skills of developed cities to enhance their collaborative carbon pollution control capabilities [36]. Lastly, carbon dioxide and atmospheric pollutant emissions share common sources and processes. Due to factors such as airflow, their emissions are spatially interdependent [37], making it feasible to achieve simultaneous reductions in both. Because of the above theoretical analysis, Hypothesis 1 is proposed in this paper.
Hypothesis 1:
DGF development has a positive impact on PCRP with significant spatial spillovers.
2.2. Mechanisms of Influence of DGF on PCRP
ESG manifestation is a mechanism of action by which DGF promotes PCRP. ESG performance is an important indicator of corporate sustainability, reflecting the performance of enterprises in environmental protection, social responsibility, and corporate governance [38]. And the ESG performance of a region fundamentally depends on a large allocation of green finance, which is conducive to the development of green infrastructure, advanced technology, and energy-saving projects [39]. GF can prioritize the allocation of capital flows to environmentally friendly enterprises and projects through tools such as green bonds and green credit [40], guiding enterprises to take on more environmental and social responsibilities, thus incentivizing them to improve their ESG performance. In addition, DF enhances corporate ESG performance by reducing corporate financing constraints [41] and strengthening external monitoring [42]. On the one hand, DF mitigates information asymmetry in financial services and improves the transparency of corporate environmental information. Generally speaking, better ESG performance is conducive to stabilizing company operations, improving performance, and shaping investor perceptions [43], so financial sectors are more inclined to invest their funds in companies with excellent ESG performance to achieve sound investment [44]. This skewed allocation of funds can encourage companies to focus more on ESG performance in order to obtain more financing opportunities. On the other hand, DF assesses and monitors companies’ ESG performance through digital means to strengthen external monitoring. This increased attention and concern from institutional investors leads companies to make further environmental disclosures, thus sustaining their focus on sustainable development and environmental issues. At the same time, with DGF’s support, some companies that have achieved significant results in their ESG performance are able to become industry or regional benchmarks and have a demonstration and leading effect on other companies. This demonstration effect will prompt other enterprises in the neighboring regions to follow suit, thus enhancing overall ESG performance in the wider region and forming a virtuous circle.
Improved ESG performance can help promote PCRP. ESG performance is critical for improving corporate environmental performance and green transformation and can shape a company’s sustainability efforts [43]. Robust ESG performance provides the necessary framework and resources for carbon neutrality [45]. For example, good ESG performance can improve a company’s brand value and reputation, attract more investors and consumers, and increase its market competitiveness. This enhanced reputation and competitiveness, in turn, will motivate companies to further increase their investment and efforts in pollution and carbon reduction, thus enhancing PCRP. On this basis, Hypothesis 2 of this study is formulated:
Hypothesis 2:
DGF enhances PCRP by improving ESG performance.
DGF can also enhance PCRP by promoting green technology innovation. DF provides a novel project financing platform for enterprises [46], which can help them accelerate the process of digital transformation by maximizing the distribution of financial resources [47]. And digital transformation can not only effectively reduce information asymmetry and regulatory costs but also promote enterprises to make substantial breakthroughs in the field of green innovation. Therefore, DF has a “structural” driving effect on technological innovation [48]. In addition, green R & D investment activities are more in line with the standards of green financial policy [49], which provides incentives for businesses to push green technology innovation. Therefore, the development of GF can effectively incentivize enterprises to choose green technology innovation strategies. Furthermore, DGF primarily promotes green technology innovation through capital allocation mechanisms and risk diversification mechanisms for green technology innovation. For one thing, the green orientation and financing facilitation of DGF can direct technology research and development capital towards industries with low energy consumption and high-efficiency green technological progress, which helps alleviate the challenges of financing green innovation [50]. For another, DGF facilitates the diversification of innovation risk and the validity of cross-regional allocation of innovation factors, thereby strengthening a company’s green innovation capabilities [51].
The improvement of green technology innovation will actively promote the enhancement of PCRP. Green innovation can significantly improve environmental and social performance [52], reducing pollutant and greenhouse gas emissions from individuals and enterprises in production, transportation, and usage. Additionally, the improvement of green technology innovation will promote the enhancement and escalation of the industrial chain, improving energy efficiency. Moreover, green innovation gradually demonstrates significant positive spatial correlation [53]. When enterprises in a region make breakthroughs in green technologies, these technologies can be rapidly disseminated to other regions by sharing resources, information, and knowledge through digital platforms and financial support, leading to green technology innovation and application in the neighborhood, and this technological spillover effect helps to enhance the capacity of the entire region to reduce pollution and carbon emissions. Accordingly, Hypothesis 3 of this study is formulated.
Hypothesis 3:
DGF enhances PCRP by promoting green technology innovation.
Public environmental attention is also a mechanism through which DGF enhances PCRP. As a medium, DGF facilitates information sharing between the government and society, provides innovative paths and opportunities for the public to conveniently access environmental information, cultivate environmental protection concepts, and practice green living, and widely disseminates environmental information through digital platforms to raise public awareness of and concern for environmental issues. Meanwhile, DGF lowers the threshold of public participation in green finance through digital platforms, enabling more people to support environmental protection by investing in green projects [54]. This broad public participation increases the attention and support of the entire society towards environmental protection.
Public environmental attention, as an informal environmental regulation, contributes to the enhancement of PCRP. It can effectively prompt local governments to focus more on environmental governance issues and promote urban environmental pollution through investments in environmental treatment and adjustments to industrial structures [55]. When public attention to environmental issues rises, it exerts greater pressure on corporate environmental behavior and government environmental policies. This pressure is transmitted to enterprises through social opinion and public participation, prompting them to increase investments in environmental protection and technological innovation to meet public environmental demands, thereby enhancing PCRP [56]. Accordingly, Hypothesis 4 of this study is formulated.
Hypothesis 4:
DGF enhances PCRP by increasing public environmental concern.
3. Research Methodology and Data Sources
3.1. Variable Selection and Measurement
3.1.1. Evaluation of the Level of DGF: Based on the Coupled Coordination Model
- (1)
- Digital Finance
DF possesses the dual attributes of digital technology and finance. With reference to existing research [57], this study chose the Peking University Digital Inclusive Finance Index to measure the level of urban digital finance development. Digital financial inclusion refers to a financial system that effectively and comprehensively serves society through digital channels such as cloud computing, big data, and artificial intelligence. The index reflects the level of digital inclusive finance development in Chinese provinces, cities, and counties through three dimensions.
- (2)
- Green Finance
GF refers to financial services that support the improvement of the environment, mitigate climate modify, and promote efficient resource utilization. Currently, there is no unified evaluation method for green finance in academia. Some scholars use single indicators such as green credit [58] or the green credit as a share of regional GDP [59] to estimate the level of urban green finance development. As research has progressed, other scholars have adopted a comprehensive indicator evaluation system, which mainly includes green securities, green investment, green insurance, and green credit [60]. Building upon this foundation and referencing existing research [61], this paper comprehensively evaluates the level of green finance development in Chinese cities using the entropy method, from seven aspects: green credit, green investment, green insurance, green bonds, green support, green funds, and green equity. Specific indicators are detailed in Table 1.

Table 1.
Green finance development indicator evaluation system.
- (3)
- Integration of digital finance and green finance
Presently, there is no united consensus in the academic community on the definition of green digital finance, and, thus, the estimation methods also show a diversified characteristic, mainly including the entropy method [62], interaction terms of DF and GF [63], and the coupling coordination model [26]. In this paper, DGF refers to the application of digital technology to optimize the resource allocation, risk management, and market transparency of GF, thereby more effectively supporting pollution reduction and carbon reduction goals, indicating the synergistic effect between the two systems of DF and GF. Therefore, this study attempts to indirectly reflect the development of DGF by using the coupling coordination model.
The coupling degree model can measure the extent of correlation and mutual influence between multiple systems, but a high coupling degree between systems does not necessarily indicate a high level of development for each system [64]. Therefore, this paper introduces a coupling coordination model to investigate the benign coupling degree of interaction between digital finance and green finance. The specific formula is as follows [65]:
The first step is to calculate the , as indicated by Equation (1):
where represents the coupling degree. The larger the value, the smaller the dispersion degree between subsystems, and the higher the coupling degree, conversely, the lower the coupling degree between subsystems. represents the number of subsystems, and represents the value of each subsystem.
In this paper, refers to digital finance, and refers to green finance.
Next, calculate the coordination index T value, as shown in Equation (3):
where and represent the weights. This paper considers digital finance and green finance to be equally important, so .
The third step is to calculate the coupling coordination degree value, as shown in Equation (4):
This paper combines the actual development situation, and DGF is categorized into four levels, as shown in Table 2.
Table 2.
Classification of the degree of coupled coordination.
The spatial distribution characteristics of the DGF in 2011 and 2022 are shown using ArcGIS 10.8 software (Figure 1). Overall, there were obvious spatial differences in the level of DGF among Chinese cities, with notable spatial agglomeration characteristics, and the level of DGF across cities exhibits a trend of convergence. In 2011, high levels of integration were concentrated in the eastern coastal regions, while the levels in the central and western regions were relatively low, with only a few cities falling into the category of low coupling coordination. By 2022, most cities had reached extreme coupling coordination, and the level of digital-green finance integration exhibited characteristics of “aggregation” and “differentiation”.
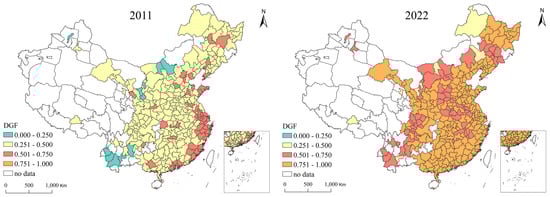
Figure 1.
Trends in the spatial evolution of DGF.
3.1.2. Evaluation of PCRP: Based on the Super-Efficiency Window DEA Model
The Data Envelopment Analysis (DEA) model can determine whether each decision-making unit (DMU) is relatively efficient. In the DEA window analysis framework, the PCRP of a decision-making unit in a certain period can be compared not only with the PCRP of other decision-making units in the same stage but also with its own efficiency in other periods [66]. Therefore, this paper combines the super-efficiency DEA and Window-DEA methods to introduce the super-efficiency Window-DEA model for assessing the PCRP of Chinese cities. We selected a window width of 3 [67] and constructed a PCRP input–output indicator system. Building upon existing research [4], we expanded the system of undesired outputs by incorporating four typical air pollutants (PM2.5, PM10, SO2, NO2) and CO2, which allows for a more accurate estimation of the development level of PCRP, as shown in Table 3.
Table 3.
PCRP input–output indicator system.
The characteristics of the spatial distribution of PCRP in 2011 and 2022 are shown using ArcGIS 10.8 software (Figure 2). In 2011, high values of PCRP were mainly concentrated in urban agglomerations such as the Yangtze River Delta and the Pearl River Delta, which occupy an important position in national strategies and have received policy support and top-level design from the national level. These regions also have a solid foundation and practice in regional collaboration, jointly advancing pollution reduction and carbon emission decrease efforts. By 2022, the PRCP of most regions had increased to varying degrees, with urban agglomerations such as the Beijing-Tianjin-Hebei, Yangtze River Delta, and Chengdu-Chongqing Economic Circle showing higher PCRP. High-value areas spread around the four major urban agglomerations, demonstrating obvious spatial agglomeration characteristics.
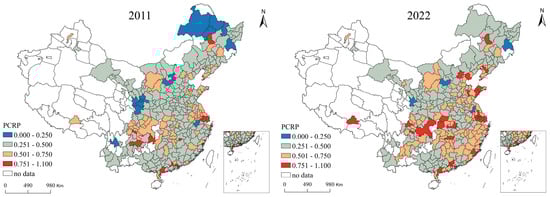
Figure 2.
Trends in the spatial evolution of PCRP.
3.1.3. Control Variables
Considering the impact of other factors on PCRP, the control variables selected in this study are as follows: (1) Urbanization rate (UR): This was measured by the proportion of urban population to total population. With the improvement of economic development, urbanization may consume more energy [69], leading to increased carbon and pollution emissions and thus lowering PCRP. (2) Human capital (HC): This was measured by the logarithm of the number of full-time teachers in institutions of higher education [70]. The level of human capital influences individuals’ tendency to exhibit stronger social responsibility and environmental awareness [71]. (3) Population density (PD): This was measured by the ratio of permanent urban residents to urban area. Urban population density may affect carbon and pollution emissions through scale effects or agglomeration effects [72]. (4) Urban openness (UO): This was measured by the proportion of FDI to actual urban GDP [73]. The impact of urban openness on the environment is controversial, mainly divided into two camps: the “Pollution Haven Hypothesis” [74] and the “Pollution Halo Hypothesis” [75]. Therefore, the impact of urban openness on PCRP is uncertain. (5) The level of economic development (PGDP): This was measured by the logarithm of per capita GDP. Cities with higher levels of economic development can provide better capital conditions to promote pollution reduction and carbon emission decrease. Furthermore, as economies develop, governments tend to adopt cleaner technologies and practices, thereby reducing per capita carbon emissions [76]. (6) Low-Carbon Policy Intensity (LCPI): a study conducted by Dong (2024) provides a dataset of China’s national-level-prefecture-level low-carbon policy intensity from 2007 to 2022 [77], and this paper uses the sum of the provincial-level and prefectural-level policy intensities in the dataset to measure the low-carbon policy intensity of cities. Policy intensity can reflect policy stringency and importance, and more low-carbon policies may cover more areas to promote emission reduction and pollution control. (7) Energy Conservation and Environmental Protection Expenditure (ECPE): This was measured by energy conservation and environmental protection expenditures in government fiscal expenditures. Energy conservation and environmental protection expenditure is the investment of government finance in key areas such as environmental management and pollution control, which has a positive effect on improving environmental quality.
3.1.4. Mechanism Variables
To further explore the channels of influence of DGF on PCRP, ESG, green technology innovation, and public environmental concern were chosen as mediating variables. (1) ESG performance (ESG): ESG is the business practice and performance of enterprises on various sustainability and ethical issues [78]. Based on stakeholder theory, financial institutions are more inclined to allocate resources to enterprises with good ESG performance to achieve sound investment. Therefore, DGF development will motivate enterprises to practice ESG and thus improve PCRP. Referring to the related literature [79], this paper adopts the Huazheng ESG rating as a proxy variable for ESG performance and aggregates corporate ESG performance to the city level according to the location of the firm. (2) Green technology innovation (GT): DGF is conducive to improving the technological innovation ecosystem [27], which can precisely direct social capital towards technological innovation areas. Green technology innovation serves as a crucial support for achieving green and low-carbon transformation. Patent data emphasize the key role of green technologies in reducing emissions. Therefore, in this paper, green technology innovation was measured by the number of green patent applications in each city [80]. (3) Public environmental concern (PEC): Public environmental concern can coordinate public environmental protection behavior and reflect the intensity of public environmental participation. DGF can further enhance the prevalence of public participation by increasing corporate transparency and alleviating information asymmetry, and enhancing the ability of stakeholders to monitor corporate behavior, thus promoting pollution reduction and emission reduction. Baidu Search Index is the weighted sum of the frequency of public searches for a keyword in the Baidu search engine, which can reflect the public’s concern for a specific topic and the trend of its attention. Therefore, this paper measures public environmental concern through the public’s combination of the Baidu search indexes for haze [81] and environmental pollution [55].
3.2. Spatio-Temporal Gray Scale Correlation Model
Gray correlation analysis is a factor analysis method whose basic idea is to determine the closeness of the relationship between different sequences based on the similarity of their curve geometries [82]. However, the traditional gray correlation model is mainly applicable to the correlation analysis of cross-sectional data and time-series data, and it cannot overcome the defect of the inconsistent order of gray relationships caused by changes in target ranking in panel data [83]. To address these restrictions, Sun et al. (2021) [84] built a gray spatio-temporal relational degree model. On the one hand, it analyzes the changes in observations over the time dimension from a dynamic perspective; on the other hand, it discusses the differences in observations over the spatial dimension from a static perspective, which can effectively measure the gray relational degree between two systems in both time and space dimensions [85]. The specific formula for calculating the incidence of spatio-temporal grayness is more complex and is not expressed here, but it can be found in Sun et al. (2021) [84]. Before calculating the gray relational coefficients, the indicators of each city were preprocessed using logarithmic transformation.
3.3. Construction of a Spatial Econometric Panel Model
3.3.1. Setting of the Spatial Weighting Matrix
The spatial weight matrix quantifies the interactions between geographic units. Spatial interaction effects are closely related to the distance between spatial units, and, generally, the further the distance, the weaker the spatial correlation. However, the traditional first-order geographic contiguity matrix assumes that spatial adjacency exists only when there is a common non-zero boundary shared. Yet cities like Zhoushan and Lhasa in the research sample do not have neighbors with common non-zero boundaries. Considering the driving force of DGF and the spatial connectivity of PCRP, this paper chose the inverse square of the distance between spatial units to construct the weight matrix. This implies that units farther away exert less influence on a given spatial unit. This means that the more distant unit has less influence on the spatial unit . The spatial weight matrix based on inverse distance can be defined by the following formula:
3.3.2. Bivariate Spatial Autocorrelation
To reveal the spatial response pattern between DGF and PCRP, the bivariate global spatial autocorrelation coefficients of the two were firstly calculated with the following formula [86].
where is the bivariate global autocorrelation index; is the total number of space units; is the inverse distance squared spatial weight matrix; and are the observed values of DGF and PCRP in spatial units and , respectively; and is the variance of all the samples.
Bivariate local spatial autocorrelation can further identify the spatial relevance features existing on different geographic units [87] and judge the spatial correlation between DGF and PCRP of different geographic units, which is expressed as follows [86]:
where is the local spatial relationship between the DGF and PCRP of spatial unit ; and are the variance standardized values of the observations of spatial units and j.
3.3.3. Spatial Panel Durbin Models
The First Law of Geography states that cities are always interconnected, and no city can exist independently of others [88]. Through geographic proximity and economic exchanges, spatial correlation between DGF and PCRP is inevitable. Existing studies have pointed out that spatial econometric models can avoid ignoring the spatial correlation between cities [89], and SDM is a more comprehensive structure of spatial econometric models [90]. Therefore, this study uses SDM, which is expressed as follows:
where is the explanatory variable, denoting the pollution and carbon reduction performance of city in year ; is the core explanatory variable, denoting the level of integration of digital and green finance of city in year ; denotes the set of control variables; denotes the spatial weight matrix; is the spatial regression coefficient of the explanatory variable; and are the regression coefficients of the core explanatory variable and the control variable, respectively; and denote the spatial regression coefficients of the core explanatory variable and the control variable, respectively; and , , and denote the area effect, time effect, and random error term, respectively.
3.3.4. Modeling of Spatial Mediating Effects
In order to test whether DGF can affect PCRP through ESG performance, technological innovation, and public environmental concern, this paper draws on JiangTing’s test for mediating effects (2022) [91] and combines Equation (8) to construct the following econometric model:
where is the mediating variable, which includes ESG performance, green technology innovation, and public scrutiny, and the other explained variables are the same as in the baseline regression equation.
3.4. Data Sources and Descriptive Statistics
Based on the availability and completeness of city-level data, this study excluded regions with significantly incomplete data, such as Hong Kong, Macao, Taiwan, Sansha, Laiwu, and others, ultimately obtaining panel data for 287 cities in China from 2011 to 2022. DF data were sourced from the Digital Financial Inclusion Index of the Institute of Digital Finance at Peking University. GF data were primarily derived from wind energy databases, the China City Statistical Yearbook, the China Financial Statistical Yearbook, as well as prefecture-level city statistical yearbooks and bulletins. Original carbon emission data were obtained from the CGER database, while original air pollution data were sourced from the China National Environmental Monitoring Center and China Weather Network. ESG performance data were from the HuaZheng ESG Ratings, excluding the special financial and insurance industries, Special Treatment (ST) companies, and enterprises with severe data deficiencies. The remaining data were primarily sourced from the China Energy Statistical Yearbook, China City Statistical Yearbook, as well as statistical yearbooks and bulletins of various provinces and municipalities. For a small amount of missing data, linear interpolation was used for imputation. To avoid estimation bias caused by excessively large numerical spans, non-proportion data among the control variables and mechanism variables were log-transformed after adding 1. Table 4 presents the statistical description of the data.
Table 4.
Descriptive statistics.
4. Analysis of Results
4.1. Spatio-Temporal Gray Correlation Between DGF and PCRP
Due to the observed significant spatio-temporal consistency between DGF and PCRP, a spatio-temporal gray relational model was employed to study their correlation. As shown in Figure 3a, the strength of the temporal correlation between DGF and PCRP exhibited an overall inverted N-shaped fluctuation trend, decreasing from 0.1127 in 2011 to 0.0450 in 2014, then rising to 0.0969 in 2016, and subsequently declining again, turning negative in 2022. This negative correlation in 2022 may be attributed to the compensating effect that offsets the overall DGF effect among cities. However, the annual average of temporal correlation is 0.0540, suggesting that enhancing DGF can effectively promote the increase in PCRP. In addition, the spatial correlation coefficients were divided into four intervals. Spatially distributed features were displayed using ArcGIS 10.8 software. Figure 3b reveals that DGF generally exhibited a positive correlation with PCRP, with 80.5755% of cities showing a positive relationship. The average spatial correlation intensity was 0.2122, which also indicated that an increase in DGF contributes to the rise in PCRP.
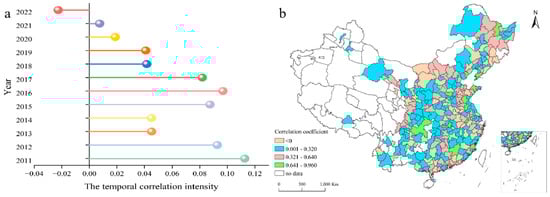
Figure 3.
Temporal gray correlation (a) and spatial gray correlation (b) between DGF and PCRP.
4.2. Spatial Spillover Effects of DGF on PCRP
4.2.1. Spatial Autocorrelation Between DGF and PCRP
This study calculated the univariate global Moran’s I for DGF and PCRP across Chinese urban units from 2011 to 2022 and employed GeoDa 1.22 software to compute the bivariate global Moran’s I for both indicators (Table 5). The results showed that DGF and PCRP exhibited significant spatial clustering characteristics, and, although the degree of spatial dependence showed a fluctuating and weakening trend, the univariate global Moran’s I was always positive and passed the test of significance of at least 1%, which suggested that the cities with higher DGF and PCRP tended to be spatially adjacent to each other, and the same was true for the cities with a lower level of development. Similarly, the bivariate global Moran’s I for DGF and PCRP demonstrated a significant positive spatial correlation, and the degree of spatial dependence overall exhibited an upward trend. This meant that an increase in DGF in a local area can lead to an improvement in PCRP in surrounding areas or cities with lower levels of DGF tended to have neighboring cities with poorer PCRP. This was due to the obvious upward trend and regional agglomeration of DGF, which may result in the concentration of resources and information within the region, thereby promoting the enhancement of PCRP in neighboring areas.
Table 5.
Univariate and bivariate Moran’s I for DGF and PCRP.
The bivariate global spatial autocorrelation cannot reveal the heterogeneous characteristics of local spaces. Therefore, this study utilized GeoDa 1.22 software to conduct a bivariate local spatial autocorrelation analysis, generating the LISA cluster map for DGF and PCRP across Chinese cities (Figure 4). From the figure, it can be seen that the various types of aggregates are generally distributed in a band. From 2011 to 2022, there was a clear trend of expansion and concentration in High-high clusters, which were mostly concentrated in eastern coastal areas and major inland cities. Low-low clusters were mostly distributed around High-high clusters, with relatively stable distribution. These areas may serve as the main destinations for the relocation of polluting industries from eastern coastal regions, leading to lower DGF and deteriorated environmental conditions. Low-high and High-low clusters were relatively scarce and mostly distributed in the west and northeast, exhibiting a gradual expansion but tending towards fragmentation.
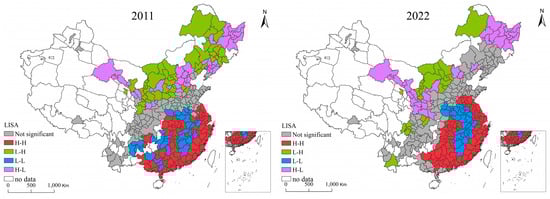
Figure 4.
Bivariate local space association types for DGF and PCRP.
4.2.2. Selection of Spatial Measurement Models
This paper constructed a spatial panel econometric model for DGF and PCRP based on an inverse distance squared spatial weight matrix. The optimal choice of the spatial panel econometric model was determined through LM, LR, Wald, and Hausman tests conducted on the sample data, with the results detailed in Table 6. Based on the test results and existing studies [92], this paper ultimately chose the SDM with fixed effects to explore the impact of DGF on PCRP.
Table 6.
Selection test of spatial metrology model.
4.2.3. Benchmark Regression Results
In order to avoid the problem of multicollinearity, this paper conducted the variance inflation factor test, and the results are shown in Table 7: the variance inflation factor of each variable was much less than 10, and the average value was 1.51. Therefore, there is no serious problem of multicollinearity.
Table 7.
Variance inflation factor test.
According to the research findings of LeSage (2008), the coefficients of spatial lagged explanatory variables were no longer suitable for measuring the spatial impact of independent variables on dependent variables. Instead, spatial effects should be analyzed in terms of direct effects, indirect effects, and total effects [93]. Following this approach, this study explored the spatial effects of DGF on PCRP in terms of direct, indirect, and total effects, as shown in Table 8. Under the inverse distance squared spatial weight matrix, the regression coefficient of the spatial lagged term (rho) for the dependent variable was 0.5612, and it passed the significance test at the 1% level. This indicated that DGF had a positive spatial spillover effect, meaning that an increase in DGF in one city could drive the development of PCRP in neighboring cities.
Table 8.
Decomposition results for the spatial effect of DGF on PCRP.
The direct effect estimate in column (1) of Table 8 was 0.0856 and significant at the 5% level, indicating that DGF can significantly promote the improvement of a destination’s own PCRP. This may be attributed to the following reasons: Firstly, DGF leveraged technologies such as big data analytics, artificial intelligence, and blockchain to more accurately identify and assessed environmental risks, optimizing the allocation of funds. This directed capital flows more towards enterprises or projects with genuine potential to achieve emission reduction targets, thereby enhancing resource utilization efficiency and reducing carbon pollution emissions. Secondly, digital tools simplified the evaluation process for green projects, reducing information asymmetry and transaction costs. For enterprises committed to environmental protection and emission reduction, it became easier to obtain low-cost funding support, which helped these enterprises expand production scale or engage in technological innovation to achieve better pollution reduction and carbon emission decrease effects. The indirect effect coefficient in column (2) was 0.5369 and significant at the 1% level, suggesting that DGF had a positive spillover effect on the PCRP of neighboring cities. This may be due to digital platforms facilitating communication and cooperation among different regions, promoting the sharing of best practices and technology transfer. When the DGF system in one region was mature, it can drive neighboring regions to jointly participate in pollution reduction and carbon emission decrease initiatives, creating a positive demonstration effect and synergy. Meanwhile, column (3) showed the regression results for the total effect, representing the sum of the direct and indirect effects. It can be interpreted as the average impact of changes in a region’s DGF on the PCRP of all regions, and it was significantly positive at the 1% level, indicating that the development of DGF promotes PCRP.
Among the control variables, the direct impact coefficients of urban human capital level, urban openness, and economic development level were significantly positive. However, the indirect effect coefficient of urban openness was significantly negative. This result indicated that local human capital accumulation, urban openness, and economic development can improve energy utilization efficiency, promote green technology innovation, and significantly enhance the local PCRP. Nonetheless, urban openness inhibited the PCRP of neighboring areas through the siphon effect. This occurred because urban openness facilitated the flow of technology and capital, leading to higher local requirements for green development and stricter environmental regulations. Industries with higher environmental costs that cannot be transformed and upgraded in the short term may relocate from areas with stringent environmental regulations to areas with more lenient regulations. Such relocations may increase the environmental pressure on the receiving areas and reduce their PCRP. Additionally, the direct impact coefficients of urbanization and population density were significantly negative, suggesting that the process of urbanization and population concentration may increase the burden on local environmental governance and reduce governance efficiency, thereby hindering PCRP. The impact of low-carbon policy intensity and government expenditure on energy conservation and environmental protection is not significant.
Furthermore, this paper conducted regression analyses on PCRP using DF and GF separately, finding that the combination of DGF has a “1 + 1 > 2” effect on PCRP. As shown in Table 9, column (1), the direct effect coefficient of DF on PCRP was negative, while the indirect effect coefficient was positive, both significant at the 1%. This indicated that the development of DF hindered the improvement of local PCRP in the short term. This may be due to the fact that reliance on digital equipment and remote data processing required corresponding infrastructure support, which further expanded energy demand and increased pollution emissions [94]. Neighboring cities, however, did not bear the negative impact of digital infrastructure construction but benefited from the technological advancements and resource optimization brought about by DF development, receiving technology spillovers and capital flows. Additionally, as shown in Table 9, column (2), the direct effect coefficient of GF on PCRP was optimistic and significant at the 1%, but the indirect effect was not significant. GF is a financial activity oriented towards sustainable development, with the core objective of supporting environmental protection and energy-saving emission-reduction projects by directing funds to environmentally friendly enterprises and projects. Therefore, the development of GF can promote the improvement of PCRP. However, the implementation and effects of green financial policies may have a lag, and it may be insufficient to observe significant impacts on pollution reduction and carbon emission mitigation in neighboring cities in the short term [95].
Table 9.
Decomposition results for the spatial effects of DF and GF on PCRP.
4.3. Robustness Tests
In order to ensure the reliability of the results, a series of robustness tests were carried out in this paper, and the results are shown in Table 10.
Table 10.
Robustness tests.
- (1)
- Replace explained variable: The super-efficiency SMB was used to re-estimate the PCRP, and column (1) of Table 10 shows the estimation results, which are consistent with the results of the baseline regression, where the DGF still has a significant positive effect on the PCRP improvement.
- (2)
- Replace explanatory variable: Using DF and GF interactions to re-estimate the level of DGF, column (2) of Table 10 shows that the results are roughly the same as those of the benchmark regression results, and the enhancement of digital-green convergence promotes the improvement of the PCRP, which further suggests that the results of the benchmark regression are reliable.
- (3)
- Use different spatial matrices: The standardized binary spatial matrix, the GDP economic distance spatial matrix, and the KNN3 spatial matrix were re-used for the regressions, respectively. And the results in column (3)–(5) of Table 10 show that the choice of spatial weight matrix does not affect the regression results.
- (4)
- Use different spatial measurement models: This paper re-estimated the effect of DGF on PCRP using a spatial lag model and a spatial error model, respectively, and the results in rows (6)–(7) of Table 10 show that the choice of spatial measurement model does not affect the regression results.
4.4. Endogeneity Test
In addition to the possible bi-directional causality between DGF and PCRP, the omitted variables may also lead to endogeneity problems in the economic model, so this paper adopts the generalized spatial two-stage least square (GS2SLS) model to mitigate endogeneity [96]. In this paper, the DGF with one period lag is chosen as an instrumental variable (DGF_lag) [97]. On one hand, with close correlation to DGF, the lagged variables have an impact on PCRP through present values. On the other hand, the DGF_lag will not be affected by current PCRP. The test results shown in Table 11 indicate that DGF still significantly promotes PCPR after overcoming the endogeneity problem.
Table 11.
Endogeneity test.
4.5. Further Analyses
4.5.1. Mechanism Analysis
Columns (1) to (3) in Table 12, respectively, demonstrated the mediation effects of ESG performance, green technology innovation, and public supervision. According to Table 12, the direct effect coefficients, indirect effect coefficients, and total effect coefficients of DGF on ESG performance, green technology innovation, and public supervision were all positive and significant. This indicated that the development of DGF had enhanced ESG performance, green technology innovation, and public supervision in both local and surrounding areas. In other words, ESG performance, green technology innovation, and public supervision played intermediary roles in promoting PCRP through DGF. Firstly, ESG performance can effectively achieve PCRP [98]. As a key tool for promoting sustainable development, ESG encourages companies to actively participate in environmental governance, thereby improving their environmental performance and profitability, ultimately reducing emission intensity and realizing dual benefits for both the environment and the economy. Secondly, the development of DGF continuously attracts capital and high-end talent into green industries [35], enabling PCRP to allocate financial resources to upgrade and replace environmentally sustainable and efficient production equipment, driving green technology innovation, achieving industrial chain transformation and upgrading, and improving energy utilization efficiency, thereby enhancing PCRP. Thirdly, DGF promoted environmental information disclosure and enhanced the public awareness of environmental issues. Public attention to the environment helps to improve transparency and social responsibility], ensuring the effective utilization of resources [16] and thus promoting the improvement of PCRP.
Table 12.
Mechanism analysis.
4.5.2. Bootstrap Testing
To further test the mediation effect, this paper adopted the bootstrap method and repeated the sampling 1000 times. The specific test results are shown in Table 13. p-values were significant at the 5% and 1% levels, respectively, and the bias-corrected confidence intervals all did not contain 0 at the 95% confidence level, which indicated that the mediation effect is significant.
Table 13.
Bootstrap tests.
In conclusion, the development of DGF promotes the improvement of PCRP. And the development of DGF can promote the PCRP by improving ESG performance, enhancing green technology innovation and promoting public environmental concern.
4.5.3. Heterogeneity Analysis
In this study, heterogeneity analysis was conducted based on differences influenced by resource endowments and geographical locations. In the process of advancing the realization of the “dual carbon” goals and the transformation of the energy structure, China, due to its profound resource base, still primarily relies on fossil fuels. At the same time, differences in resource endowments among cities may affect the actions and effectiveness of pollution reduction and carbon emission mitigation. Therefore, based on the “National Plan for Sustainable Development of Resource-Based Cities (2013–2020)”, prefecture-level cities were divided into two categories: resource-based and non-resource-based cities. Columns (1) and (2) of Table 14 showed that, although the direct effect coefficients are significant in both types of cities, the indirect effect coefficients and total effect coefficients were not significant in non-resource-based cities compared to resource-based cities. This was because, in recent years, due to the strong support from the state for the high-quality development of resource-based cities, they had been prompted to undergo industrial restructuring and upgrading and to raise environmental standards, thereby making gradual progress in green transformation and development. However, resource-based cities may face challenges in rapidly curbing pollution and carbon emissions in surrounding areas due to their specific resource dependence and economic development models. In addition, most resource-based cities were economically underdeveloped and lack the necessary technical support and green investments for PCRP, so the radiation effect of their digital-green integration had not yet emerged. Therefore, for these cities, the anticipated synergistic spatial spillover effect of DGF on PCRP remained elusive.
Table 14.
Heterogeneity analysis.
To promote the coordinated development of DGF with PCRP in Eastern and Western China, projects such as the “East Data, West Computing” initiative and the “Implementation Plan for Synergistic Enhancement of Pollution Reduction and Carbon Emission Mitigation” have been launched. However, eastern regions have consistently led non-eastern regions in DGF and pollution reduction and carbon emission mitigation efforts, and eastern regions have advantages in economics, technological innovation, and energy transformation development [27]. Therefore, this study divided Chinese cities into eastern and non-eastern regions to explore the impact of DGF on PCRP. Columns (3) and (4) of Table 14 presented the relevant results. In eastern regions, governments had taken the lead in promoting the transformation of the energy structure by using clean energy to replace traditional fossil fuels, resulting in significant direct effects. Due to their economic status and advantages, eastern regions can play a “helper” role for neighboring regions.
5. Conclusions, Discussion, and Policy Implications
5.1. Conclusions
Using panel data from 287 cities, this paper analyzed the evolutionary characteristics and impacts of DGF and PCRP in Chinese cities from five perspectives: spatio-temporal evolution, spatial correlation, spatial effects, mechanism tests, and heterogeneity discussion. Here are the results of this study:
- (1)
- DGF and PCRP both showed an upward trend. DGF gradually improved and concentrated at a higher level, and the high values of PCRP were mainly clustered in the urban agglomerations, such as the Pearl River Delta and the Yangtze River Delta, and diffused around the urban agglomerations.
- (2)
- DGF and PCRP showed significant spatial clustering characteristics, and various types of aggregates were generally distributed in bands. H-H aggregates had a clear tendency to expand and concentrate, and L-L aggregates were mostly distributed around the H-H aggregation area, with a relatively stable distribution.
- (3)
- DGF had a beneficial spatial spillover effect on PCRP, and DGF not only promoted local RRCP but also drove PCRP in the surrounding areas, as confirmed by a series of robustness tests.
- (4)
- DGF strongly contributed to the city’s PCRP by improving ESG performance, innovating green technologies, and enhancing public environmental concerns.
- (5)
- Regional location and resource endowment differences all contributed to the heterogeneity of DGF’s impact on PCRP. Simply put, DGF had a greater impact on PCRP in eastern regions and non-resource cities.
5.2. Discussion
China is currently undergoing the dual pressures of economic development and the synergistic enhancement of pollution reduction and carbon emissions lowering. DGF, as an organic integration of the “digitization” and “greening” of financial development, aims at green and low-carbon growth. By leveraging digital technology and platforms, it promotes cost reduction and efficiency enhancement in green finance, thus better serving PCPR. Although existing studies have examined the role of DF and GF in promoting pollution reduction and lowering carbon emissions [16], research on the spatial spillover effects and mechanisms between DGF and PCRP remains limited. Based on revealing the spatiotemporal evolution trends and spatial agglomeration relationships between DGF and PCRP in Chinese cities, this study explores the spatial spillover effects of DGF on PCRP. It also introduces improvements in ESG performance, green technology innovation, and enhanced public environmental awareness as intermediary factors to discuss the spatial pathways through which DGF influences PCRP. On the one hand, between 2011 and 2022, both DGF and PCRP have seen certain degrees of improvement, which is closely related to the policy systems and regional collaborative development initiatives promoted by China to advance sustainable development. For example, the “east data, west computing” project facilitated the integration of digital technology and green finance by optimizing the layout of data centers. However, the PCRP of some cities remains “locked” without significant improvement. The underlying reason may be that China’s economic growth is firmly anchored in the carbon-based energy system, and the energy consumption structure dominated by fossil fuels is difficult to change in the short term [99]. To rapidly drive economic growth in the early stages, China mainly relied on fossil fuels, giving rise to many high-pollution and high-energy-consumption industries. This has led to the technology relied upon by such large-scale energy systems gradually becoming the dominant technology for economic development. By integrating society and the economy, this technology forms a technology–institution complex, triggering a symbiotic internal inertia within the system, resulting in technological lock-in and path dependency [100]. This then gradually becomes socialized in daily life and absorbed into practices and habits [101], ultimately leading to “lock-in”. On the other hand, there exists a significant positive spatial correlation between DGF and PCRP. This positive spatial correlation indicates that the development of DGF can not only enhance local PCRP but also drive the green transformation of surrounding areas through spatial spillover effects, forming a virtuous cycle of regional collaborative development. Therefore, DGF has the potential to become a “sharp sword” for breaking the “lock-in”.
This study further verifies the effect of the development of DGF on PCRP and has an obvious spatial spillover effect. In addition, after the robustness and endogenous tests, DGF still plays a positive role in promoting PCRP, which further confirms the conjecture of Hypothesis 1. This geographical proximity and connectivity facilitate the exchange of vital information, advanced knowledge, and cutting-edge technologies, thereby contributing to environmental protection and sustainable development. It plays a crucial role in promoting regional collaboration for PCRP. DF platforms break the geographical constraints of traditional finance, enabling resources such as capital, technology, and talent to flow and be allocated within a broader scope. The DGF system in developed regions can attract more resources and allocate them to surrounding areas through project cooperation, investments, and other means, enhancing the overall PCRP of the region. DGF also uses digital means to more accurately identify and assess the risks and benefits of green projects, thereby guiding capital flows to projects and enterprises with significant pollution reduction and carbon emissions lowering effects. This flow of capital not only improves local PCRP but also drives green transformation in surrounding areas through economic ties between regions. However, there are differences in the spatial spillovers from DGF to PCRP due to differences in geographic location and resource endowment. The eastern region has advantages in economic development, technological innovation and energy transition and can better utilize DGF to promote green transition. Moreover, since resource-based cities mainly rely on local minerals and other resources for development, the dependence of industrial development on resources remains strong, thus making it more difficult to improve PCRP and leading to a weaker spillover capacity of DGF. In addition, factors such as urbanization, population density, and the opening of cities to the outside world also have a certain impact on PCRP. Urbanization is usually accompanied by increased energy consumption and environmental pollution, while, for neighboring cities, the pressure brought by urbanization may be mainly concentrated locally, with a weak external spillover effect. The increase in population density may cause traffic congestion and industrial concentration, thus negatively affecting the local PCRP, but the impact on the neighboring areas is smaller. The introduction of foreign capital usually brings advanced technology and management experience, which is conducive to promoting local green transformation and technological innovation. However, the introduction of foreign capital may lead to high environmental standards, forcing high-emission and high-pollution enterprises to move to the neighboring areas, increasing the environmental pressure on the neighboring areas.
DGF significantly promotes the enhancement of urban PCRP by improving ESG performance, innovating green technologies, and increasing public environmental awareness. Firstly, DF platforms enhance the transparency of corporate environmental information disclosure, strengthening the investor and societal oversight of enterprises. This increased transparency encourages companies to prioritize ESG performance to gain greater social recognition and funding support. Good ESG performance can reduce corporate financing costs and attract more green capital, thereby promoting green transformation, reducing pollution emissions, and improving performance. Secondly, DGF can precisely direct funds to green technology research and application projects, supporting enterprises in innovating in areas such as energy conservation, emission reduction, and clean energy. For example, Carbon Capture and Storage technology plays a crucial role in reducing emissions from industrial processes and power generation by capturing carbon dioxide and storing it safely [102]. Additionally, green technology projects supported by DGF often have strong demonstration effects, driving green technology innovation and application in surrounding areas through technology diffusion, enhancing the overall pollution reduction and carbon reduction capabilities of the region. Thirdly, DF tools lower the threshold for public participation in GF, enabling more people to support green projects through investment, thereby increasing public awareness and responsibility towards environmental issues. Enhanced public environmental awareness forms a powerful social oversight force, prompting enterprises and governments to adopt more proactive environmental governance measures and promoting the achievement of pollution reduction and carbon reduction goals.
Due to differences in economic structures, policy frameworks and environmental conditions, China’s conclusions may not be fully applicable to other countries or regions, but they are of some relevance. Some scholars have used data from other countries or regions to verify the important role of green finance for environmental sustainability [26]. Research for the European Union found that the use of blockchain technology to improve the transparency of the green bond market can work better for climate and environmental projects [33]. Therefore, the results of this paper for China’s DGF to promote PCRP enhancement have some similarities with the findings of other countries or regions, especially low-income countries.
This study has several limitations that warrant further attention. First, the assessment of DGF and PCRP needs to be improved. Due to the lack of consensus on a harmonized indicator set for DGF and PCRP and limited data availability, only selected key representative indicators were used in this study. However, these indicators may not fully summarize all dimensions of DGF and PCRP, which may limit the robustness of the analysis. Future studies should incorporate data from a wider range of sources to achieve a more comprehensive, multidimensional assessment. Second, the afferent pathway between DGF and PCRP should be improved. There may be other transmission paths between DGF and PCRP, such as regional investment policies. Future research should consider more factors to explain some of the effects between DGF and PCRP. Third, there is a need to increase the extensibility of this study’s findings. Since this paper only uses data from Chinese cities, the findings lack a certain degree of extensibility. Future research will consider using a wider range of data to increase the general applicability of the findings.
5.3. Policy Implications
- (1)
- It is necessary to establish a synergistic mechanism for regional digital green integration and development, give full play to the clustering effect of financial resources, and continuously improve the application environment of DGF. The government should formulate and improve the corresponding DGF support policies, as well as form a financial synergistic development pattern by establishing a cross-regional DGF and GF cooperation platform. Meanwhile, it continues to expand the policy boundaries of DGF, tilting towards green areas such as energy conservation and emission reduction, clean energy, etc., and accelerating the enhancement of PCRP. For example, the government can encourage financial institutions to issue green bonds, expand the scale of green credit, and make use of the development of the carbon finance market to incentivize enterprises to reduce carbon emissions and enhance the efficiency of credit resource allocation in green finance.
- (2)
- It is necessary to maximize the facilitating role of DGF on ESG, green technology innovation and public scrutiny, so as to effectively enhance the PCRP. First, companies should be guided to strengthen ESG disclosure and link ESG performance to green credit and bond issuance. Second, it must focus on R&D and investment in green innovation. For example, innovation centers should be established in resource-rich areas to incubate green technologies and promote their diffusion to other regions. Finally, the government must give full play to the reasonable role of public supervision, establish a sound feedback and processing mechanism for public supervision, and form an effective closed loop of public supervision to guide digital finance towards green goals and provide broader social support for the city’s PCRP.
- (3)
- It is necessary to harden the exchange of regional experience and cultivate green digital financial talents. Regions with higher levels of DGF should actively play a leading role, actively summarize and share their own experience of synergistic development, and help and drive regions with relatively low levels of DGF while developing themselves. For example, regions can use Internet technology to establish a green digital financial resource base and make clear the development framework of technology sharing, data interoperability, and joint training of talents. In addition, regions should increase their efforts in technology and talent building. They should promote cooperation between universities, research institutes, financial institutions, and technology enterprises, so as to establish joint training mechanisms and cultivate more world-class leading talents and innovation teams in the fields of digital finance and green finance.
- (4)
- It is necessary to formulate differentiated policies with the full consideration of regional characteristics. DGF has a significant spillover effect, and each region should gradually create a novel model that meets its own development based on differences in economic development and resource endowment. The government should increase the construction of digital infrastructure in the central and western regions, improve the coverage of digital financial services, and provide financial support for the green transformation of resource-oriented cities, so as to promote the transformation of traditional industries in the green and low-carbon direction. The eastern region can utilize its own advantages to explore new modes of DGF by setting up pilot zones for green financial innovation and reform. For resource-based cities, the government needs to incorporate DGF into urban development planning and incentivize enterprises to participate in green finance by means of corporate carbon accounts and other means to carry out clean technology transformation, so as to reduce their dependence on local minerals and other resources.
Author Contributions
Conceptualization, Z.L.; Methodology, P.S.; Software, P.S.; Formal analysis, P.C. and Z.L.; Data curation, P.C. and P.S.; Writing—original draft, P.C.; Writing—review & editing, Z.L.; Supervision, Z.L. All authors have read and agreed to the published version of the manuscript.
Funding
This research were funded by the Graduate Student Innovation Program of the College of Business, Yangzhou University, grant number SXYYJSKC202401, and the National Science Foundation of China, grant number 42301189.
Institutional Review Board Statement
Not applicable.
Informed Consent Statement
Not applicable.
Data Availability Statement
The data presented in this study are available on request from the corresponding author.
Conflicts of Interest
The author declares no conflicts of interest.
References
- Bai, C.Q.; Du, K.R.; Yu, Y.; Feng, C. Understanding the trend of total factor carbon productivity in the world: Insights from convergence analysis. Energy Econ. 2019, 8, 698–708. [Google Scholar] [CrossRef]
- Wang, W.J.; Bao, B.P.; Yu, C.J. External demand, digitalisation and corporate carbon performance. World Econ. Stud. 2024, 9, 77–91+136. [Google Scholar]
- Wang, Z.W.; Sun, H.; Zhang, X.F.; Ding, C.X.; Gong, Y.Y. Can an energy-rights trading system realise the double environmental benefit of reducing pollution and carbon? Ind. Econ. Res. 2023, 4, 15–26+39. [Google Scholar]
- Zhang, X.C.; Cao, X.; Song, L.H. Study on the Measurement of Pollution and Carbon Reduction Efficiency and Influencing Factors in China—Based on the Super-Efficient SBM-Tobit Mode. Ecol. Econ. 2023, 39, 174–183. [Google Scholar]
- Vandyck, T.; Keramidas, K.; Kitous, A.; Spadaro, J.V.; Dingenen, R.V.; Holland, M.; Saveyn, B. Air quality co-benefits for human health and agriculture counterbalance costs to meet Paris Agreement pledges. Nat. Commun. 2018, 9, 4939. [Google Scholar] [CrossRef]
- Wu, C.X. Study on the Synergy Effect of Low Carbon Economic Development in China. J. Manag. World 2021, 37, 105–117. [Google Scholar]
- Li, S.J.; Wang, S.J. Examining the effects of socioeconomic development on China’s carbon productivity: A panel data analysis. Sci. Total Environ. 2019, 659, 681–690. [Google Scholar] [CrossRef]
- Wu, H.Y.; Yin, Y.K.; Li, G.X.; Ye, X.X. Digital finance, capital-biased and labor-biased technical progress: Important grips for mitigating carbon emission inequality. J. Environ. Manag. 2024, 371, 123198. [Google Scholar] [CrossRef]
- Shi, Y.R.; Yang, B. The coupling and coordinated development of digital finance and green finance under the vision of “dual carbon” and the examination of carbon emission reduction effect. Sustain. Futures 2024, 7, 100217. [Google Scholar] [CrossRef]
- Xu, X.K.; Li, J.S. Can green bonds reduce the carbon emissions of cities in China? Econ. Lett. 2023, 226, 111099. [Google Scholar] [CrossRef]
- Yang, P.; Lv, Y.Q.; Chen, X.D.; Lv, J. Digital finance, natural resource constraints and firms’ low-carbon behavior: Evidence from listed companies. Resour. Policy 2024, 89, 104637. [Google Scholar] [CrossRef]
- Wang, K.L.; Zhu, R.R.; Cheng, Y.H. Does the Development of Digital Finance Contribute to Haze Pollution Control? Evidence from China. Energies 2022, 15, 2660. [Google Scholar] [CrossRef]
- Liao, H.J.; Zhang, J.R.; Gong, R.Z.; Zhang, W. The mitigating effect of digital inclusive finance development on urban environmental pollution: Insights from innovation capacity and financing constraints. Int. Rev. Financ. Anal. 2025, 97, 103815. [Google Scholar] [CrossRef]
- Le, T.H.; Le, H.C.; Farhad, T.H. Does financial inclusion impact CO2 emissions? Evidence from Asia. Financ. Res. Lett. 2020, 34, 101451. [Google Scholar] [CrossRef]
- Fan, Q.Q.; Feng, S.X. Mechanisms and effects of digital finance on carbon emissions. China Popul. Resour. Environ. 2022, 32, 70–82. [Google Scholar]
- Li, Z.H.; Yuan, B.B.; Wang, Y.; Qian, J.W.; Wu, H.T. The role of digital finance on the synergistic governance of pollution & carbon: Evidence from Chinese cities. Sustain. Cities Soc. 2024, 115, 105812. [Google Scholar]
- Fan, L.; Peng, B.B.; Lin, Z.G.; Zou, H.Y.; Du, H.B. The effects of green finance on pollution and carbon reduction: Evidence from China’s industrial firms. Int. Rev. Econ. Financ. 2024, 95, 103490. [Google Scholar] [CrossRef]
- Ozili, P.K. Green finance research around the world: A review of literature. Int. J. Green Econ. 2022, 16, 10048432. [Google Scholar] [CrossRef]
- Soha, K.; Ahsan, A.; Ismat, N.; Martina, H.; Furrukh, B. Green finance development and environmental sustainability: A panel data analysis. Front. Environ. Sci. 2022, 10, 1039705. [Google Scholar]
- Liu, C.Y.; Xu, Y. Does digital inclusive finance enhance the inclusiveness of green development: A perspective of capital financing and technological innovation. J. China Univ. Geosci. (Soc. Sci. Ed.) 2023, 23, 81–99. [Google Scholar]
- Li, Y.J.; Chen, B.; Fang, D.L.; Zhang, B.Y.; Bai, J.H.; Liu, G.Y.; Zhang, Y. Drivers of energy-related PM2.5 emissions in the Jing-Jin-Ji region between 2002 and 2015. Appl. Energy 2021, 288, 116668. [Google Scholar] [CrossRef]
- Lei, T.Y.; Luo, X.; Jiang, J.J.; Zou, K. Emission reduction effect of digital finance: Evidence from China. Environ. Sci. Pollut. Res. 2023, 30, 62032–62050. [Google Scholar] [CrossRef] [PubMed]
- Bu, Y.; Gao, J.C.; Zhang, W.; Ai, M.Y. The impact of digital inclusive finance on the collaborative reduction of pollutant and carbon emissions: Spatial spillover and mechanism analysis. J. Environ. Manag. 2024, 365, 121550. [Google Scholar] [CrossRef] [PubMed]
- Zhang, C.H.; Wang, C.; Jin, H.H.; Xu, M.; Balezentis, T.; Agnusdei, L. The impact of green finance on energy transition and carbon emission targets: Exploring the double threshold and spatial spillover effects among the regions. Struct. Change Econ. Dyn. 2025, 73, 1–10. [Google Scholar] [CrossRef]
- Christodoulou, P.; Psillaki, M.; Sklias, G.; Chatzichristofis, S.A. A blockchain-based framework for effective monitoring of EU Green Bonds. Financ. Res. Lett. 2023, 58, 104397. [Google Scholar] [CrossRef]
- Yin, Q.M.; Huang, Y.B.; Ding, C.H.; Jing, X.D. Towards sustainable development: Can green digital finance become an accelerator for reducing pollution and carbon emissions in China? Sustain. Cities Soc. 2024, 114, 105722. [Google Scholar] [CrossRef]
- Shi, Y.R.; Yang, B. How digital finance and green finance can synergize to improve urban energy use efficiency? New evidence from China. Energy Strategy Rev. 2024, 55, 101553. [Google Scholar] [CrossRef]
- Feng, S. Study on the Legal Mechanism for Synergising Carbon Reduction, Pollution Reduction, Green Expansion and Growth. J. China Univ. Geosci. (Soc. Sci. Ed.) 2024, 24, 61–75. [Google Scholar]
- Zhao, X.; Ma, X.W.; Chen, B.Y.; Shang, Y.P.; Song, M.L. Challenges toward carbon neutrality in China: Strategies and countermeasures, Resources. Conserv. Recycl. 2022, 176, 105959. [Google Scholar] [CrossRef]
- Taghizadeh-Hesary, F.; Hyun, S. Green Digital Finance and Sustainable Development Goals; Springer Nature: Berlin/Heidelberg, Germany, 2022. [Google Scholar]
- Zhang, A.X.; Deng, R.R.; Wu, Y.F. Does the green credit policy reduce the carbon emission intensity of heavily polluting industries?—Evidence from China’s industrial sectors. J. Environ. Manag. 2022, 311, 114815. [Google Scholar] [CrossRef]
- Liu, H.D.; Yao, P.B.; Latif, S.; Aslam, S.; Nadeem, L. Impact of Green financing, FinTech, and financial inclusion on energy efficiency. Environ. Sci. Pollut. Res. 2022, 29, 18955–18966. [Google Scholar] [CrossRef] [PubMed]
- Zhang, D.Y.; Vigne, S.A. The causal effect on firm performance of China’s financing—Pollution emission reduction policy: Firm-level evidence. J. Environ. Manag. 2021, 279, 111609. [Google Scholar] [CrossRef] [PubMed]
- Li, H.; Tong, M.H.; Zhang, G.J. Carbon Emission Reduction Effect of Green Finance Reform and Innovation Pilot Zones—Based on the Perspective of Spatial Spillover Effect and Urban Heterogeneity. Stat. Res. 2024, 41, 44–58. [Google Scholar]
- Li, Y.T.; Xu, Y.G. Impact of green finance on China’s pollution reduction and carbon efficiency: Based on the spatial panel model. Int. Rev. Econ. Financ. 2024, 94, 103382. [Google Scholar] [CrossRef]
- Xu, J.J.; Wang, J.C.; Li, R.; Gu, M.X. Is green finance fostering high-quality energy development in China? A spatial spillover perspective. Energy Strategy Rev. 2023, 50, 101201. [Google Scholar] [CrossRef]
- Dong, Z.Y.Z.; Xia, C.Y.; Fang, K.; Zhang, W.W. Effect of the carbon emissions trading policy on the co-benefits of carbon emissions reduction and air pollution control. Energy Policy 2022, 165, 112998. [Google Scholar] [CrossRef]
- Qian, S.T.; Yu, W.Z. Green finance and environmental, social, and governance performance. Int. Rev. Econ. Financ. 2024, 89, 1185–1202. [Google Scholar] [CrossRef]
- Pimonenko, T. The role of green finance in attaining environmental sustainability within a country’s ESG performance. J. Innov. Knowl. 2025, 10, 100674. [Google Scholar]
- Zhang, H.; Lai, J. Greening through ESG: Do ESG ratings improve corporate environmental performance in China? Int. Rev. Econ. Financ. 2024, 96, 103726. [Google Scholar] [CrossRef]
- Mu, W.W.; Tao, Y.Q.; Ye, Y.W. Digital finance and corporate ESG. Financ. Res. Lett. 2023, 51, 103426. [Google Scholar] [CrossRef]
- Ren, X.H.; Zeng, G.D.; Zhao, Y. Digital finance and corporate ESG performance: Empirical evidence from listed companies in China. Pac. -Basin Financ. J. 2023, 79, 102019. [Google Scholar] [CrossRef]
- Leite, B.J.; Uysal, V.B. Does ESG matter to investors? ESG scores and the stock price response to new information. Glob. Financ. J. 2023, 57, 100851. [Google Scholar] [CrossRef]
- Fan, M.; Liu, J.; Tajeddini, K.; Khaskheliet, M.B. Digital technology application and enterprise competitiveness: The mediating role of ESG performance and green technology innovation. Env. Dev Sustain 2023, 1–31. [Google Scholar] [CrossRef]
- Xie, Y.M. The interactive impact of green finance, ESG performance, and carbon neutrality. J. Clean. Prod. 2024, 456, 142269. [Google Scholar] [CrossRef]
- Wang, W.W. Digital finance and firm green innovation: The role of media and executives. Financ. Res. Lett. 2025, 74, 106794. [Google Scholar] [CrossRef]
- Guo, B.N.; Feng, Y.; Lin, J. Digital inclusive finance and digital transformation of enterprises. Financ. Res. Lett. 2023, 57, 104270. [Google Scholar] [CrossRef]
- Tang, S.; Wu, X.C.; Zhu, J. Digital Finance and Corporate Technological Innovation—Structural Characteristics, Mechanism Identification and Differences in Effects under Financial Regulation. J. Manag. World 2020, 36, 52–66+9. [Google Scholar]
- Yu, C.H.; Wu, X.Q.; Zhang, D.Y.; Chen, S.; Zhao, J.S. Demand for green finance: Resolving financing constraints on green innovation in China. Energy Policy 2021, 153, 112255. [Google Scholar] [CrossRef]
- Xiong, L.; Yan, S.; Yang, M. Financial development, environmental regulation and industrial green technology innovation—A study based on the biased endogenous growth perspective. China Ind. Econ. 2023, 12, 99–116. [Google Scholar]
- Hao, Y.; Wang, C.X.; Yan, G.Y.; Irfan, M.; Chang, C.P. Identifying the nexus among environmental performance, digital finance, and green innovation: New evidence from prefecture-level cities in China. J. Environ. Manag. 2023, 335, 117554. [Google Scholar] [CrossRef]
- Wang, X.; Wang, Y. Study on Green Credit Policies for Green Innovation. J. Manag. World 2021, 6, 33–39. [Google Scholar]
- Zhao, N. Does green credit promote regional green technology innovation?—Based on regional green patent data. Econ. Probl. 2021, 6, 33–39. [Google Scholar]
- Han, X.F.; Li, J.J. The Dynamic Pollution and Carbon Reduction Effects of Digital Financial Development—A New Perspective Based on Binary Environmental Constraints. J. China Univ. Geosci. (Soc. Sci. Ed.) 2024, 24, 102–116. [Google Scholar]
- Zheng, S.Q.; Wang, G.H.; Sun, W.Z.; Luo, D.L. Public demands and urban environmental governance. J. Manag. World 2013, 6, 72–84. [Google Scholar]
- Wu, Z.X.; Zeng, J.H.; Liu, H.X.; Li, C.X. Mechanisms and spatial effects of green finance for pollution control and emission reduction. Econ. Geogr. 2023, 43, 128–138. [Google Scholar]
- Xu, T.; Yang, G.D.; Chen, T.Q. The role of green finance and digital inclusive finance in promoting economic sustainable development: A perspective from new quality productivity. J. Environ. Manag. 2024, 370, 122892. [Google Scholar] [CrossRef]
- Li, C.X.; Liu, K.L.; Ma, S.R. Spatial effects of the impact of green finance development on the transformation of provincial energy consumption structure. Econ. Geogr. 2024, 44, 148–157. [Google Scholar]
- Wang, X.Y.; Wang, Q. Research on the impact of green finance on the upgrading of China’s regional industrial structure from the perspective of sustainable development. Resour. Policy 2021, 74, 102436. [Google Scholar] [CrossRef]
- DongFang, S.Q.; Fu, Y. A study on the spatio-temporal evolution characteristics and convergence of green finance development in China. Ecol. Econ. 2024, 40, 166–175. [Google Scholar]
- Zhang, S.L.; Dou, W.; Ji, R.B.; Afthanorhan, A.; Hao, Y. Can green finance promote the low-carbon transformation of the energy system? New evidence from city-level data in China. J. Environ. Manag. 2024, 365, 121577. [Google Scholar]
- Lee, C.C.; Li, M.Y.; Li, X.H.; Song, H.P. More green digital finance with less energy poverty? The key role of climate risk. Energy Econ. 2025, 141, 108144. [Google Scholar]
- Du, M.F.; Zhang, Y.J. The synergistic carbon emission reduction advantage of green finance and digital finance. Environ. Impact Assess. Rev. 2025, 112, 107795. [Google Scholar] [CrossRef]
- Shen, L.; Zhang, H.Y. The Evolution of Spatio-Temporal Patterns and Convergence of Coupling and Coordination of Green Finance and High-Quality Economic Development in China. Chin. J. Manag. Sci. 2025, 33, 50–60. [Google Scholar]
- Wang, S.J.; Kong, W.; Ren, L.; Dai, B.T. Misconceptions and corrections of domestic coupled coordination degree models. J. Nat. Resour. 2021, 36, 793–810. [Google Scholar]
- Wang, F.; Feng, G.F. Interprovincial Energy and Environmental Efficiency Assessment in China Based on DEA Window Models. China Ind. Econ. 2013, 7, 56–68. [Google Scholar]
- Halkos, G.E.; Tzeremes, N.G. Exploring the existence of Kuznets curve in countries’ environmental efficiency using DEA window analysis. Ecol. Econ. 2009, 68, 2168–2176. [Google Scholar]
- Zhang, J.; Wu, G.Y.; Zhang, J.P. Estimating China’s Interprovincial Physical Capital Stock: 1952-2000. Econ. Res. J. 2004, 10, 35–44. [Google Scholar]
- Zhao, J.; Zhao, Z.R.; Zhang, H.B. The impact of growth, energy and financial development on environmental pollution in China: New evidence from a spatial econometric analysis. Energy Econ. 2019, 93, 104506. [Google Scholar]
- Dian, J.; Song, T.; Li, S.L. Facilitating or inhibiting? Spatial effects of the digital economy affecting urban green technology innovation. Energy Econ. 2024, 129, 107223. [Google Scholar]
- Yuan, Q.; Wang, R.Q.; Tang, H.C.; Ma, X.; Zeng, X.Y. A study on the potential of higher education in reducing carbon intensity. PLoS ONE 2024, 19, e0309546. [Google Scholar]
- Glaeser, E.L.; Kahn, M.E. The greenness of cities: Carbon dioxide emissions and urban development. J. Urban Econ. 2010, 67, 404–418. [Google Scholar] [CrossRef]
- He, X.X.; Ruan, J.J. Study on the Efficiency Improvement of Urban Green Economy Driven by Fintech and Digital Economy—Based on the Perspectives of “Enabling” and “Synergising”. Ecol. Econ. 2024, 40, 80–89+107. [Google Scholar]
- Monica, S.; Neha, S. Demystifying pollution haven hypothesis: Role of FDI. J. Bus. Res. 2021, 123, 516–528. [Google Scholar]
- Ozlem, K.F.; Atis, S. Does foreign direct investment affect environmental degradation: Evidence from largest carbon intense countries. PLoS ONE 2024, 19, e0314232. [Google Scholar]
- Hunjra, A.I.; Bouri, E.; Azam, M.; Azam, R.I.; Dai, J.P. Economic growth and environmental sustainability in developing economies. Res. Int. Bus. Financ. 2024, 70, 102341. [Google Scholar] [CrossRef]
- Dong, X.Y.; Wang, C.; Zhang, F.; Zhang, H.W.; Xia, C.Q. China’s low-carbon policy intensity dataset from national- to prefecture-level over 2007–2022. Sci. Data 2024, 11, 213. [Google Scholar]
- Li, T.T.; Wang, K.; Sueyoshi, T.; Wang, D.D. ESG: Research progress and future prospects. Sustainability 2021, 13, 11663. [Google Scholar] [CrossRef]
- Fang, X.M.; Hu, D. Corporate ESG Performance and Innovation—Evidence from A-share Listed Companies. Econ. Res. J. 2023, 58, 91–106. [Google Scholar]
- Shao, S.; Fan, M.T.; Yang, L.L. Economic Structural Adjustment, Green Technology Progress and China’s Low-Carbon Transition Development—An Empirical Examination Based on the Perspectives of Overall Technology Frontier and Spatial Spillover Effects. J. Manag. World 2022, 38, 46–69+4–10. [Google Scholar]
- Wu, L.B.; Yang, M.M.; Sun, K.G. The impact of public environmental concern on corporate and government environmental governance. China Popul. Resour. Environ. 2022, 32, 1–14. [Google Scholar]
- Liu, S.F.; Yang, Y.J. Grey Systems Theory and Its Applications; Science Press: Beijing, China, 2010. [Google Scholar]
- Li, Z.J.; Zheng, X.; Sun, D.Q. The Influencing Effects of Industrial Eco-Efficiency on Carbon Emissions in the Yangtze River Delta. Energies 2021, 14, 8169. [Google Scholar] [CrossRef]
- Sun, J.; Dang, Y.G.; Zhu, X.Y.; Wang, J.J.; Shang, Z.G. A grey spatiotemporal incidence model with application to factors causing air pollution. Sci. Total Environ. 2021, 759, 143576. [Google Scholar] [CrossRef]
- Li, Z.J.; Zhang, W.J.; Sarwar, S.; Hu, M.J. The spatio-temporal interactive effects between ecological urbanization and industrial ecologization in the Yangtze River Delta region. Sustain. Dev. 2023, 31, 3254–3271. [Google Scholar] [CrossRef]
- Xu, D.; Huang, Z.F.; Huang, R. The spatial effects of haze on tourism flows of Chinese cities: Empirical research based on the spatial panel econometric model. Acta Geogr. Sin. 2019, 74, 814–830. [Google Scholar]
- Yin, S.G.; Jiang, X.Y.; Jiang, H.N. The relationship between housing price, innovation ability and urban quality in the Yangtze River Delta region based on the PVAR model. Geogr. Res. 2023, 42, 2738–2758. [Google Scholar]
- Tobler, W.R. A Computer Movie Simulating Urban Growth in the Detroit Region. Econ. Geogr. 1970, 46, 234–240. [Google Scholar] [CrossRef]
- Anselin, L. Thirty years of spatial econometrics. Pap. Reg. Sci. 2010, 89, 3–26. [Google Scholar] [CrossRef]
- Bu, Y.; Wang, E.; Qiu, Y.Y.; Möst, D. Impact assessment of population migration on energy consumption and carbon emissions in China: A spatial econometric investigation. Environ. Impact Assess. Rev. 2022, 93, 106744. [Google Scholar] [CrossRef]
- Jiang, T. Mediating and Moderating Effects in Empirical Studies of Causal Inference. China Ind. Econ. 2022, 5, 100–120. [Google Scholar]
- Shi, W.W.; Zhang, L. Does Technological Innovation Promote Haze Pollution Control? New Evidence Based on Panel Threshold Model and Spatial Econometric Model. Front. Environ. Sci. 2022, 9, 800460. [Google Scholar] [CrossRef]
- Lesage, J. An Introduction to Spatial Econometrics. Rev. D’économie Ind. 2008, 123, 19–44. [Google Scholar] [CrossRef]
- Hittinger, E.; Jaramillo, P. Internet of Things: Energy boon or bane? Science 2019, 364, 326–328. [Google Scholar] [CrossRef] [PubMed]
- Ma, Y.Y.; Yao, W.Y.; Jiang, L.; Xue, Y.W. Impact of Green Finance Reform and Innovation Pilot Zone Policies on Urban Pollution Reduction and Carbon Reduction and the Mechanism of Action. China Popul. Resour. Environ. 2024, 34, 45–55. [Google Scholar]
- Drukker, D.M.; PruchaI, R.; Raciborski, R. Maximum likelihood and generalized spatial two-stage least-squares estimators for a spatial-autoregressive model with spatial-autoregressive disturbances. Stata J. 2013, 13, 221–241. [Google Scholar] [CrossRef]
- Guo, Q.T.; Dong, Y.; Feng, B.; Zhang, H. Can green finance development promote total-factor energy efficiency? Empirical evidence from China based on a spatial Durbin model. Energy Policy 2023, 177, 113523. [Google Scholar] [CrossRef]
- Ma, X.Y.; Zhou, A.M.; Chi, C.Y. ESG performance and green total factor productivity. Financ. Res. Lett. 2025, 73, 106630. [Google Scholar] [CrossRef]
- Zhu, Y.Y.; Rao, H.C. Does low carbon city pilot promote urban carbon unlocking?—A heterogeneity analysis based on machine learning. Cities 2024, 147, 104815. [Google Scholar] [CrossRef]
- Unruh, G.C. Escaping carbon lock-in. Energy Policy 2002, 30, 317–325. [Google Scholar] [CrossRef]
- Unruh, G.C. The Real Stranded Assets of Carbon Lock-In. One Earth 2019, 1, 399–401. [Google Scholar] [CrossRef]
- Amara, D.B.; Qiao, J.J. From economic growth to inclusive green growth: How do carbon emissions, eco-innovation and international collaboration develop economic growth and tackle climate change? J. Clean. Prod. 2023, 425, 138986. [Google Scholar] [CrossRef]
Disclaimer/Publisher’s Note: The statements, opinions and data contained in all publications are solely those of the individual author(s) and contributor(s) and not of MDPI and/or the editor(s). MDPI and/or the editor(s) disclaim responsibility for any injury to people or property resulting from any ideas, methods, instructions or products referred to in the content. |
© 2025 by the authors. Licensee MDPI, Basel, Switzerland. This article is an open access article distributed under the terms and conditions of the Creative Commons Attribution (CC BY) license (https://creativecommons.org/licenses/by/4.0/).