Article

The Joint Effects of Firm’s Globalization and ESG Rating on Financial Performance: Evidence from Food Industry in Taiwan

1
Department of International Business, National Kaohsiung University of Science and Technology, Kaohsiung 807, Taiwan
2
Department of Finance, National Chung Hsing University, Taichung 40227, Taiwan
*
Author to whom correspondence should be addressed.
Sustainability 2025, 17(6), 2580; https://doi.org/10.3390/su17062580
Submission received: 27 January 2025 / Revised: 3 March 2025 / Accepted: 7 March 2025 / Published: 14 March 2025

Abstract

:
The internationalization process helps firms accumulate business knowledge and experience; however, firms also enjoy the benefit of decreasing risk due to diversification. The Taiwanese food industry has encountered some difficulties in internationalization, including insufficient production capacity, high tariffs, the lack of long-term planning by the government, and inadequate support from internal organizations. Overall, it is relatively problematic for the food industry to achieve internationalization, and Environmental, Social, and Governance (ESG) is the trend of sustainable development for enterprises to fulfill. This paper empirically explores the joint impact of the degree of internationalization and ESG ratings on the financial performance of the Taiwanese food industry from 2015 to 2021. Our empirical results found that international diversification and ESG performance have joint positive and significant effects on the return on assets (ROA), return on equity (ROE), and return on sales (ROS) of the food industry, respectively. This means that the higher the internationalization of overseas companies in the food industry, the better the ESG performance would significantly improve its financial performance.

1. Introduction

The Taiwanese food industry has encountered many complex and diversified challenges in recent years. These include persistent food safety concerns, the growing impact of extreme climate events, the disruptions caused by the COVID-19 pandemic, escalating raw material costs, and increasing geopolitical uncertainties. These factors have placed significant operational pressure on the industry across all supply chain segments, underscoring the urgent need for strategic resilience and adaptability in the face of an increasingly volatile global environment. To reduce business risks and enhance long-term sustainable resilience, more and more food industries are beginning to focus on sustainable development in environmental, social, and governance (ESG) aspects [1,2]. Internationally renowned large-scale enterprises such as Nestlé have already acted ahead of the curve and as industry leaders. For example, Nestlé began promoting sustainable development in 2006 and is committed to achieving sustainability, low-carbon, and environmental protection goals. Lizovskaya and Moldovan state that export-oriented firms, in particular, must meet stricter global ESG standards. Institutional support and regulatory incentives are crucial for accelerating ESG adoption. Firms integrating sustainability strategically will strengthen their competitiveness and resilience [3]. Porechenkova and Wang examine the evolution of CSR reporting in the U.S. food and beverage industry, highlighting a growing emphasis on sustainability, ethical sourcing, and health-conscious initiatives [4]. Companies increasingly prioritize waste reduction, water conservation, and sustainable packaging while enhancing transparency in nutritional information and responsible marketing. The study identifies a shift toward data-driven CSR reporting with measurable sustainability goals, strengthening stakeholder trust and corporate reputation. Proactive CSR strategies are now essential for maintaining competitive advantage [4]. Regarding Indian industries, Paridhi and Ritika examine the impact of Environmental, Social, and Governance (ESG) disclosures on corporate financial performance (CFP) with notable insights into the food sector and suggest that food companies with strong ESG disclosures experience improved profitability, enhanced brand reputation, and greater investor confidence [5]. Key ESG factors influencing financial performance include sustainable sourcing, waste management, and ethical labor practices. However, challenges such as compliance costs and regulatory inconsistencies persist. The study underscores ESG reporting as a strategic tool for long-term value creation [5]. Boiral et al. examine ESG risk management in agri-food companies, emphasizing challenges like carbon emissions, resource depletion, labor rights, and food safety [6]. The study highlights proactive strategies such as transparency, stakeholder engagement, and third-party certifications to mitigate reputational and regulatory risks. Effective ESG integration enhances corporate resilience and competitiveness [6]. Moreover, Taiwan’s Uni-President Enterprise Co., Ltd. (Tainan City, Taiwan), Taishan Enterprise Co., Ltd. (Changhua County, Taiwan), Tai Tong Yi Co., Ltd. (Tainan City, Taiwan), and Black Pine Co., Ltd. (Taipei City, Taiwan) have implemented energy resource management, carbon inventory, social welfare, and risk management controls in ESG. Uni-President Enterprise Co., Ltd., Tai Tong Yi Co., Ltd., and Black Pine Co., Ltd. have specifically assessed and reviewed management based on climate risk identification. Venkatraman and Ramanujam [7] use data collection methods to measure corporate performance by reflecting the achievement of corporate economic goals. Financial performance indicators are used as the basis for performance measurement. This financial indicator includes revenue growth rate, net profit rate, assets return rate, and pre-tax net loss growth rate.
Moreover, the Taiwanese food industry faces significant challenges in international expansion due to restrictive policies and high tariffs, which inflate costs and create a cost-performance dilemma, particularly for small and medium-sized enterprises. These barriers place Taiwanese products at a competitive disadvantage compared to countries with favorable trade agreements and add operational costs to meet regulatory requirements and adapt to foreign markets [8]. However, companies can succeed internationally by adopting strategic approaches such as targeting niche and premium markets, leveraging regional free trade agreements, forming joint ventures with local partners, and emphasizing strong brand differentiation that highlights Taiwanese products’ cultural uniqueness and quality [9]. Government support through subsidies, financial assistance, and policy reforms can also ease the burden of internationalization, as observed in successful agricultural and food export strategies [10]. While these efforts may entail significant upfront costs and risks, long-term strategy and scalable business models, supported by effective government policies, can help companies build brand equity, establish market presence, and achieve sustainable growth [11]. Success under such restrictive conditions is ultimately challenging but feasible with deliberate planning, collaboration, and innovation.
However, Johanson and Wiedersheim-Paul [12] indicated that when a company operates internationally, it accumulates more international experience and knowledge, and the related risks and uncertainties gradually decrease. At the same time, as sales, profits, and market opportunities continue to expand in international operations, companies desire greater visibility and control over their operating performance. Therefore, enterprises gradually increase the human, material, and resources invested in international operations. This increase is called the improvement of the internationalization level of the enterprise. Although Taiwan’s food industry has advantages in the production and management technology of MIT (Made in Taiwan), food needs help to achieve widespread sales in the global market. This situation might be due to multiple factors. First, Taiwan’s food industry needs more production capacity to meet global demand. Secondly, structural barriers such as high tariffs also limit the international competitiveness of products. In addition, the government needs to improve in long-term planning and national support and provide sufficient support for the internationalization of the food industry. At the same time, Taiwan’s food industry is restricted from investing overseas, limiting its ability to expand into international markets. All these factors make Taiwan’s food industry face difficulties and challenges in its pursuit of internationalization.
Because most of the past research and literature have discussed the impact of internationalization and firm’s performance on enterprises, especially in the food industry, there currently needs to be more ESG studies on the effects of internationalization and financial performance on enterprises. In particular, consumers and investors are increasingly paying more attention to corporate social responsibility and sustainable development performance in the modern business environment [13,14]. ESG factors involve environmental, social, and corporate governance performance, including reducing environmental impact, food safety management, harmonious labor-employer relations, promoting social welfare, risk management control and ethical operations, etc. Excellent environment, social, and governance (ESG) performance can promote a listed firm’s improved market and financial performance. Compared with crucial financial performance, investor confidence in ESG performance is more critical and active in affecting market performance (Zhang et al.) [15]. Specifically, Sandberg et al. [16] aimed to investigate how ESG ratings impact financial performance in the European food industry from 2017 to 2020 and found that firms with higher ESG ratings are associated with better economic performance. In addition, internationalization is one of the strategies companies use to expand their business in the global market. Due to the increasingly higher industry competition in the worldwide food market, companies need to understand the impact of internationalization on their operating performance and further understand the current international emphasis on the environment.
In general, in the past, scholars have conducted many studies on the impact of internationalization on business performance. Still, there have been few studies on the impact of ESG on financial performance. In addition, there are many studies on the internationalization of Taiwan’s food industry and ESG in terms of financial performance. The effect is relatively rare, so this study focuses on exploring the impact of internationalization and ESG on the business performance of Taiwan’s food industry. The internationalization of the food industry includes not only import and export trade but also overseas investment. Therefore, this study uses the amount of overseas investment in the food industry as a standard to measure the degree of internationalization. The ESG measurement standard is compiled from each company’s sustainability reports. Operating performance will be calculated by the return on total assets (ROA), total return on equity (ROE), and return on total sales (ROS), which measure a company’s operating performance. Despite extensive research on the relationship between ESG performance and financial outcomes, as well as the impact of international diversification on firm performance, several critical gaps remain: (1) There is a lack of comprehensive studies investigating the interaction between ESG performance and international diversification, particularly their combined influence on financial outcomes. Understanding this interplay is essential for assessing the synergies between sustainability practices and globalization. (2) There is an absence of industry-specific analyses focusing on the food sector, where ESG performance and global operations are particularly critical. The food industry faces unique challenges, such as complex supply chains, stringent environmental regulations, and increasing consumer demand for sustainable practices, making it a vital study area. (3) There is a need to examine specific dimensions of ESG (environmental, social, and governance) and their differential impacts on financial performance, especially when integrated with international diversification strategies. This nuanced approach can reveal which ESG factors contribute most significantly to a firm’s success in global markets. By addressing these gaps, our study provides novel insights into the intersection of sustainability and globalization. This contribution advances the theoretical discourse on ESG and internationalization while offering actionable implications for managerial decision-making in the food industry. In this sector, sustainable practices and global strategies are essential for long-term competitiveness.
The significance of this study lies in addressing critical questions at the intersection of ESG performance and international diversification. Specifically, how do ESG performance and international diversification jointly influence financial performance metrics such as return on assets (ROA), return on equity (ROE), and return on sales (ROS)? Understanding these combined effects provides insights into how firms can leverage both dimensions to enhance operational and financial outcomes. Are there specific ESG dimensions (e.g., environmental, social, or governance) that amplify or moderate the financial benefits of international diversification? This question highlights the importance of disentangling the unique contributions of each ESG component to determine which aspects create the most outstanding value when aligned with global strategies. Why is the interplay between ESG and international diversification particularly relevant in the food industry? The food sector faces heightened exposure to environmental, regulatory, and reputational pressures, making it a compelling context to examine how these factors influence firm performance. By addressing these questions, the study contributes to advancing the understanding of how firms can strategically align sustainability practices with international growth initiatives. This alignment not only fosters superior financial outcomes but also reinforces the importance of ESG integration in navigating the challenges of globalization, particularly in industries like food that operate under intense scrutiny.
Therefore, this study explores the following two research questions: firstly, we empirically explore whether the degree of a firm’s internationalization affects the financial performance of the food industry. Secondly, we empirically investigate whether the joint internationalization and ESG rating affect the financial performance of the Taiwanese food industry. Based on the Taiwanese food industry from 2015 to 2021, we find that both international diversification and ESG performance exert a joint positive and statistically significant influence on key financial metrics, including ROA, ROE, and ROS, respectively. Specifically, our findings indicate that higher levels of internationalization among firms in the food industry are associated with improved ESG performance, which, in turn, significantly enhances financial outcomes. This suggests that a strategic focus on international expansion, coupled with strong ESG practices, can lead to superior financial performance in the food sector.
The remainder of this paper is organized as follows. Section 2 provides literature review and presents the hypotheses development. Section 3 describes our sample and empirical methods. Section 4 presents our empirical results and analysis. Finally, Section 5 concludes and offers directions for further research.

2. Literature Review and Hypothesis Development

2.1. Theoretical Foundation

This study is grounded in two complementary theoretical perspectives: the resource-based view (RBV) and stakeholder theory. Together, these frameworks provide a robust foundation for analyzing the joint impact of environmental, social, and governance (ESG) performance and international diversification on corporate financial performance. The RBV highlights how ESG and international diversification can be valuable strategic resources, enhancing firms’ competitive advantage and operational efficiency. Meanwhile, stakeholder theory underscores the growing importance of aligning corporate activities with the expectations of diverse stakeholder groups, particularly in globalization. By integrating these perspectives, this study offers a comprehensive lens to evaluate the interplay between sustainability and global expansion as drivers of superior financial outcomes.
First, the RBV posits that a firm’s sustainable competitive advantage arises from its unique resources and capabilities that are valuable, rare, inimitable, and non-substitutable (VRIN). Superior ESG performance reflects a firm’s ability to integrate environmental stewardship, social responsibility, and strong governance into its operations. These capabilities can reduce regulatory and reputational risks, foster operational efficiencies, and enhance brand equity, collectively improving financial outcomes. Expanding into international markets provides firms access to broader customer bases, diversified revenue streams, and opportunities for economies of scale. When effectively combined with ESG excellence, international diversification enhances a firm’s ability to navigate complex global markets, meet diverse stakeholder expectations, and mitigate cross-border risks. Together, ESG performance and international diversification can serve as complementary strategic resources, enabling firms to achieve superior operational and financial performance while fostering sustainable competitive advantages.
Second, Stakeholder Theory: Stakeholder theory underscores the growing importance of addressing the needs and expectations of diverse groups, including investors, customers, employees, and regulators, who are directly or indirectly affected by a firm’s activities. In an era of heightened social and environmental awareness, stakeholders increasingly demand that firms demonstrate accountability and transparency in their sustainability practices. Firms with robust ESG performance are better positioned to build trust, strengthen stakeholder relationships, and enhance their legitimacy in domestic and international markets. International diversification exposes firms to cultural, regulatory, and market-specific expectations. Companies that align their operations with ESG principles can more effectively navigate these complexities, securing stakeholder approval and sustaining long-term performance.
By integrating the RBV and stakeholder theory, this study provides a nuanced theoretical lens to explore how the interplay between ESG performance and international diversification creates strategic synergies. These synergies enable firms to enhance financial outcomes while meeting the evolving expectations of stakeholders in an increasingly interconnected and sustainability-driven global economy.

2.2. The Impact of Internationalization on Firm Performance

Welch and Luostarinen [17] stated that the internationalization of enterprises involves the growth of internal and external enterprise resources, in which the development of international subcontracting contracts and relative trade are closely related to the internationalization of enterprises. The success of an enterprise’s internationalization often depends on the results of increasing its internal resources. In other words, firm internationalization is an integral process involving firms’ outward and inward movements. As companies accumulate knowledge and experience in international operations, their awareness of the risks and uncertainties of international operations will gradually decrease. At the same time, because international operations can bring benefits such as increased sales, improved profits, and market expansion, companies will want to control these operating results further and invest more human and material resources in international operations. This gradually increasing degree of international involvement is the internationalization of enterprises (Johanson and Wiedersheim-Paul) [18].
Internationalization processing provides enterprises with opportunities to leverage their competitive advantages in overseas markets, reduce transaction risks, achieve economies of scale, and obtain cost-advantageous production factors or rare resources, thereby making significant contributions to the organization’s performance and competitiveness (Grant; Hymer; Kogut) [19,20,21]. Another viewpoint is from Industrial Organization Theory, which explains the internationalization behavior of enterprises from the perspective of incomplete markets. Companies investing overseas need unique competitive advantages, and the market they choose to invest in should have a certain degree of market imperfect competition so that these advantages can be fully utilized and converted into profits, which means there is less competition. Or there may be barriers to entry, and manufacturers can control the market through overseas investment, further reducing the chance of competitors appearing (Hymer) [20].
Internationalization is regarded as an essential strategy for the growth and competitiveness of enterprises, and this view has been widely recognized in the past literature (Lu and Beamish; Filatotchev and Piesse; Bowen et al.) [22,23,24]. The reason why companies conduct internationalization and overseas investment is because they have exclusive advantages; that is, they have unique advantages that other peers do not have and can use these advantages to extend to overseas markets to obtain profits (Knickerbocker) [25]; Some are discussed from transaction cost theory (Williamson) [26] or internalization theory (Buckley and Casson) [27]. In the case of market imperfections, enterprises may face higher transaction costs when conducting market transactions. To reduce these costs, overseas investment can internalize the external market, allowing enterprises to conduct external market transactions under corporate-level control, thereby decreasing organizational transaction costs. At the same time, companies can take advantage of their unique advantages, such as technical knowledge, management, and marketing skills, and apply them to overseas markets (Allen and Pantzalis; Pantzalis; Bobillo et al.) [28,29,30]. Under such interest considerations, companies are motivated to conduct international operations to improve their performance.

2.3. ESG and Firm’s Performance

ESG is the abbreviation of three indicators from “Environmental, Social, and Governance”. Environmental refers to a company’s view on environmental sustainability, including energy policy, carbon footprint, waste disposal, and land development. The social aspect (Society) focuses on the relationship between the company, its suppliers, and employees, including caring about labor health and welfare policies, maintaining supplier relationships, and ensuring the consistency of corporate values. The corporate governance level (Governance) includes the company’s decision-making structure, the protection of the rights and interests of minority shareholders, the independence of board members, and the remuneration of senior managers.
Venkatraman and Ramanujam [7] applied operating variables, such as market share, sales revenue growth rate, return on investment, and other variables, to measure performance and conducted measurement analysis. The empirical result obtained was the weighted proportion of profitability, pre-tax. Gande et al. [31] indicated that financial indicators mainly measure the economic status and substantive performance of enterprises and evaluate the impact of the economy. Profitability has many limitations as a measurement variable, but it is still the most important method for measuring performance. In addition, Venkatraman and Ramanujam [7] also proposed three performance measurement indicators. Using data collection methods to measure corporate performance can reflect the achievement of corporate economic goals. Financial performance indicators are used as the basis for performance measurement. Financial indicators include revenue growth rate, profit rate, net profit rate, return on assets, pre-tax net loss growth rate, etc.
Gande et al. [31] indicated that financial indicators mainly measure enterprises’ economic status and substantive performance and evaluate the impact of the internationalization of enterprises on operating performance. Many scholars use three indicators to analyze corporate performance indicators, namely return on assets (ROA), return on equity (ROE), and return on sales (ROS). Moreover, regarding non-financial measurement indicators, when measuring a company’s operating performance, although traditional indicators can provide some information about the company’s profitability and performance in the international market, they cannot fully reflect its specific risks, opportunities, and value-creating activities in the internationalization process.
Sullivan [32] proposed nine facets to assess enterprises’ internationalization degree. These three dimensions are performance level, structure level, and attitude level. Sullivan used factor analysis to refine these nine variables into five factors, which were used as indicators to measure the degree of internationalization. He then used these indicators to sum up and calculate the firm’s internationalization degree. In the past, most scholars used the indicators proposed by Sullivan to measure the degree of internationalization of enterprises. For example, Gomes and Ramaswamy [33] used three variables for evaluation: Foreign Sales to Total Sales, Foreign Assets to Total Assets, and the number of overseas subsidiaries. A positive but moderately significant relationship exists between ESG ratings and financial performance, reflected specifically in financial performance measured through ROA and ROE (Sandberg et al.) [16].
Regarding the role of financial constraints, Falavigna [34] indicated firms’ access to external financial resources to support such strategies. Moreover, Xu and Zhu [35] addressed the role of information asymmetry and found that the cost of external financing for the firm increases due to the higher risks for lenders, limiting their access to the capital market, as well as the ESG strategies adopted by these firms to support the collection of financial resources through the disclosure of key information.

2.4. Testable Hypotheses

This study investigates the relationship between a firm’s degree of internationalization, its Environmental, Social, and Governance (ESG) rating, and their joint impact on financial performance. The hypotheses are as follows:
H1. 
The degree of internationalization of a firm positively impacts its financial performance.
The positive relationship between internationalization and financial performance is well-documented in the literature. A meta-analysis of 15,648 entrepreneurial firms revealed a generally positive association between the degree of internationalization and financial performance. The strength of this relationship depends on factors like the firm’s knowledge intensity and the scope of internationalization [36]. Additionally, systematic reviews of internationalization studies have highlighted the complexities of this relationship, including the role of industry type, firm size, and market context [37]. For SMEs, leveraging finance, information technology, and network ties plays a crucial role in enhancing their internationalization success. These factors not only complement the internationalization process but also mitigate risks in foreign markets [38]. Despite the overall positive trend, the relationship is not universally linear. Contextual variables, such as home- and host-country institutions and firm-specific resources, can influence the outcomes of internationalization [39]. Theoretical approaches, such as the S-curve hypothesis, suggest that firms experience diminishing returns at very high levels of internationalization due to the complexity of managing diverse markets [40].
H2. 
A company’s ESG rating score positively impacts its financial performance.
High ESG ratings are increasingly recognized as key drivers of financial performance. Firms that prioritize ESG practices attract socially responsible investors, achieve operational efficiencies, and enhance their long-term stability. While empirical evidence on ESG performance is extensive, it often highlights a positive correlation with financial indicators such as Return on Equity (ROE) and Return on Assets (ROA) [41]. Born global firms operating in emerging economies also demonstrate that internationalization strategies combined with ESG practices lead to financial growth and enhanced innovation performance, particularly when operating in markets with stable institutional environments [42].
H3. 
The joint effect of a firm’s degree of internationalization and its ESG rating score positively impacts financial performance.
The combined impact of internationalization and ESG strategies remains an underexplored area, but the literature suggests potential synergies. Firms that integrate internationalization with robust ESG practices may experience amplified financial benefits through enhanced brand reputation, alignment with global regulatory standards, and the ability to attract environmentally conscious consumers. Recent systematic reviews emphasize that internationalized firms can leverage network effects, social capital, and sustainability practices to improve financial performance in foreign markets. The ability to integrate ESG initiatives into international operations also mitigates compliance risks and enhances competitiveness [43]. However, the interaction between these factors may be moderated by institutional quality and market conditions. For instance, firms from emerging markets that adopt ESG and internationalization strategies need to adapt to varied regulatory environments to achieve consistent performance gains [37].

3. Data and Methods

3.1. Sample

The sample period of this paper covers 2015 to 2021 and is based on public-listed companies in Taiwan’s food industry. The data of various variables were collected from the Taiwan Economic Journal (TEJ) database. They were organized based on the established environmental aspects, social aspects, and corporate governance as the data for research and analysis. Our ESG quantification scores derived from internationally recognized industry standards and weighted according to sector-specific relevance, along with incident violation adjustments to ensure a comprehensive assessment of corporate sustainability practices. The ESG quantification score consists of two key components: the initial ESG score, which measures firm performance across environmental (E), social (S), and governance (G) dimensions, and the incident violation adjustment score, which penalizes firms for ESG-related infractions, thereby reinforcing corporate accountability. The environmental score evaluates sustainability initiatives such as carbon footprint reduction and resource efficiency, the social score assesses corporate responsibility in labor practices and stakeholder engagement, and the governance score examines board independence, risk oversight, and transparency. The incident violation score adjusts final ESG ratings based on corporate misconduct’s severity, recurrence, and regulatory consequences. By integrating quantitative ESG performance metrics with risk-based accountability mechanisms, the ESG framework provides a transparent, data-driven, and investor-focused evaluation, enabling market participants and regulators to assess corporate sustainability performance and risk exposure more precisely. The final firm’s samples included 22 sample companies. Our sample is representative of the food industry in Taiwan and a sub-sample of the population so that our successive transferability of empirical evidence is convincing.

3.2. Empirical Model

Based on previous studies that explore corporate financial performance, such as Chen et al.; Liu et al.; Chen and Keefe; Kuang et al. [44,45,46,47] as well as Sun and Zou [48] and others to set up the following empirical model. We use Cross-sectional time-series FGLS regression to perform parameter estimation based on the Panel Data Model:
P e r f o r m a n c e i , t = α + β × I n t e r n a t i o n a l i z a t i o n i , t + γ × E S G   R a t i n g i , t + r = 1 3 ϕ r × C o n t r o l s i , t r + ( F i r m   D u m m y ) i + Y e a r   D u m m y t + ε i , t
P e r f o r m a n c e i , t = α + β × I n t e r n a t i o n a l i z a t i o n i , t + γ × E S G   R a t i n g i , t + δ × I n t e r n a t i o n a l i z a t i o n × E S G   R a t i n g i , t + r = 1 3 ϕ r × C o n t r o l s i , t r + ( F i r m   D u m m y ) i + Y e a r   D u m m y t + ε i , t
where P e r f o r m a n c e i , t stands for firm’s financial performance measures including the following three types: return on assets (ROA) (=net profit before tax/total assets), return on equity (ROE) (=earnings after tax/total equity), and return on sales (ROS) (=net profit/total sales). I n t e r n a t i o n a l i z a t i o n i , t represents firm’s degree of globalization and proxied with the number of oversea subsidiaries. E S G   R a t i n g i , t is the firm’s ESG scores of rating performance and could be subdivided into the following three components: environment, society, and corporate governance. C o n t r o l s i , t r stands for firm’s controlling variables and mainly includes the following variables: the ratio of research and development expense, debt ratio and the natural logarithm of total assets. (Firm Dummy)i is the individual firm fixed effect and Y e a r   D u m m y t is year fixed effect while εi,t is the error term. Specifically, Firm fixed effects (FFE) are a critical econometric tool in accounting and finance research, offering robust control for unobserved, time-invariant firm-specific characteristics that could bias regression estimates. Breuer and DeHaan highlight that FFE effectively eliminates confounding influences such as corporate governance structures, managerial expertise, and industry positioning, ensuring that within-firm variation rather than cross-sectional differences drive estimated relationships [49]. This approach mitigates omitted variable bias, strengthens causal inference, and enhances the precision of coefficient estimates. By isolating within-firm changes over time, FFE reduces spurious correlations that arise from unobserved heterogeneity, making them particularly valuable in studies on corporate decision-making, financial performance, and regulatory impacts. While FFE may reduce statistical power due to limited within-firm variation, their ability to improve identification and mitigate endogeneity underscores their importance in empirical research [49].
Although ESG is gradually receiving attention worldwide, companies often need help with difficulties such as measurement methods and insufficient information when evaluating ESG performance, resulting in the inadequate reliability, consistency, and completeness of ESG information. However, the unified ESG scoring standard makes it hard to confirm the extent of corporate implementation. Therefore, verification by sustainable scoring agencies can give companies a comprehensive ESG score, thus creating incentives to implement ESG. This paper uses the TEJ database to incorporate the three pillars of ESG into 16 topics and subdivide these 16 topics into three measurement variables (Table 1). From a theoretical standpoint, relying exclusively on a short time series for empirical testing is insufficient to draw definitive conclusions due to the inability to capture long-term dynamics and the increased vulnerability to biases. By employing robustness tests and alternative modeling approaches, researchers can improve the reliability and validity of their results. Ideally, extending the time series or incorporating cross-sectional data into a panel framework provides a more comprehensive empirical foundation for analysis. Therefore, we employ the panel generalized least squares (GLS) method to conduct the empirical estimation, ensuring robust and efficient handling of heteroscedasticity and autocorrelation in the data [50]. To address the likely high serial correlation of error terms within the same firm, standard errors are clustered at the firm level across all regressions. This approach aligns with established practices in the literature [51,52] to ensure robust and reliable statistical inferences.

4. Empirical Results and Analysis

4.1. Descriptive Statistical Analysis

Table 2 presents the descriptive statistics for the variables used in this study, highlighting variations in corporate performance, ESG ratings, and firm-level characteristics. The company operating performance indicators, including return on total assets (ROA), return on total equity (ROE), and return on sales (ROS), have mean values of 6.618%, 10.564%, and 24.564%, respectively, with standard deviations of 5.902, 9.874, and 12.810, indicating substantial variability across firms. The number of overseas subsidiaries averages 7.344, with a standard deviation of 12.931, reflecting significant differences in international expansion. The ESG performance scores, encompassing total ESG score (60.009), environmental score (59.944), social score (64.112), and corporate governance score (55.164), exhibit standard deviations of 8.279, 13.423, 11.202, and 9.753, suggesting moderate dispersion in sustainability practices. Among control variables, the natural logarithm of R&D expense rate (0.587), debt ratio (40.890), and total assets (8.678) demonstrate standard deviations of 0.693, 16.532, and 0.823, respectively, with the debt ratio showing the most significant variability. These findings underscore the heterogeneity in financial performance, international presence, and ESG engagement among the sampled food companies, emphasizing the need for further investigation into the determinants of these variations.
The analysis of Relative Importance in Table 2 highlights the significant role of ESG performance in driving corporate digital transformation, surpassing financial indicators. The social (1282), ESG overall (1200), environmental (1199), and corporate governance (1103) scores exhibit the highest relative importance, suggesting that firms with strong sustainability commitments are more inclined to adopt digitalization, driven by regulatory requirements, investor expectations, and the alignment between ESG initiatives and technological advancements. In contrast, return on total assets (132) and return on equity (211) display lower importance, indicating that profitability alone is not the primary driver of digital transformation. International diversification (147) and debt ratio (818) show moderate influence, implying that firms with global operations and financial leverage may utilize digitalization for efficiency and risk management. Notably, the R&D expense rate (12) is of the lowest importance, suggesting that external pressures drive digital transformation more than internal innovation. These findings emphasize ESG’s increasing role in shaping corporate digital strategies.
The ANOVA analysis in Panel E examines differences in firm characteristics across low, medium, and high ESG-ranked firms, revealing significant variations in firm size and international diversification, while financial performance, R&D expenditure, and leverage remain unaffected. The results indicate that total sales per employee (Ln (total sales per employee), F-statistics = 16.000, p-value = 0.000) is highly significant at the 1% level. This suggests that firms with larger total sales per employee tend to achieve higher ESG scores, likely due to their more excellent resources for sustainability initiatives and regulatory compliance. Additionally, the number of overseas subsidiaries (F-statistics = 4.030, p-value = 0.020) is significant at the 5% level, implying that firms with more fabulous international presence may face more substantial ESG regulatory pressures, driving higher sustainability commitments. However, financial performance indicators—including ROA, ROE, and ROS—along with R&D expenditure and debt ratio show no statistically significant differences, indicating that ESG performance does not necessarily correlate with profitability, innovation investment, or leverage. These findings suggest that more prominent and internationally diversified firms are more likely to adopt higher ESG standards, while financial performance remains independent of ESG commitments, offering critical insights for investors, regulators, and corporate decision-makers assessing ESG integration in corporate strategies.

4.2. Fundamental Analysis

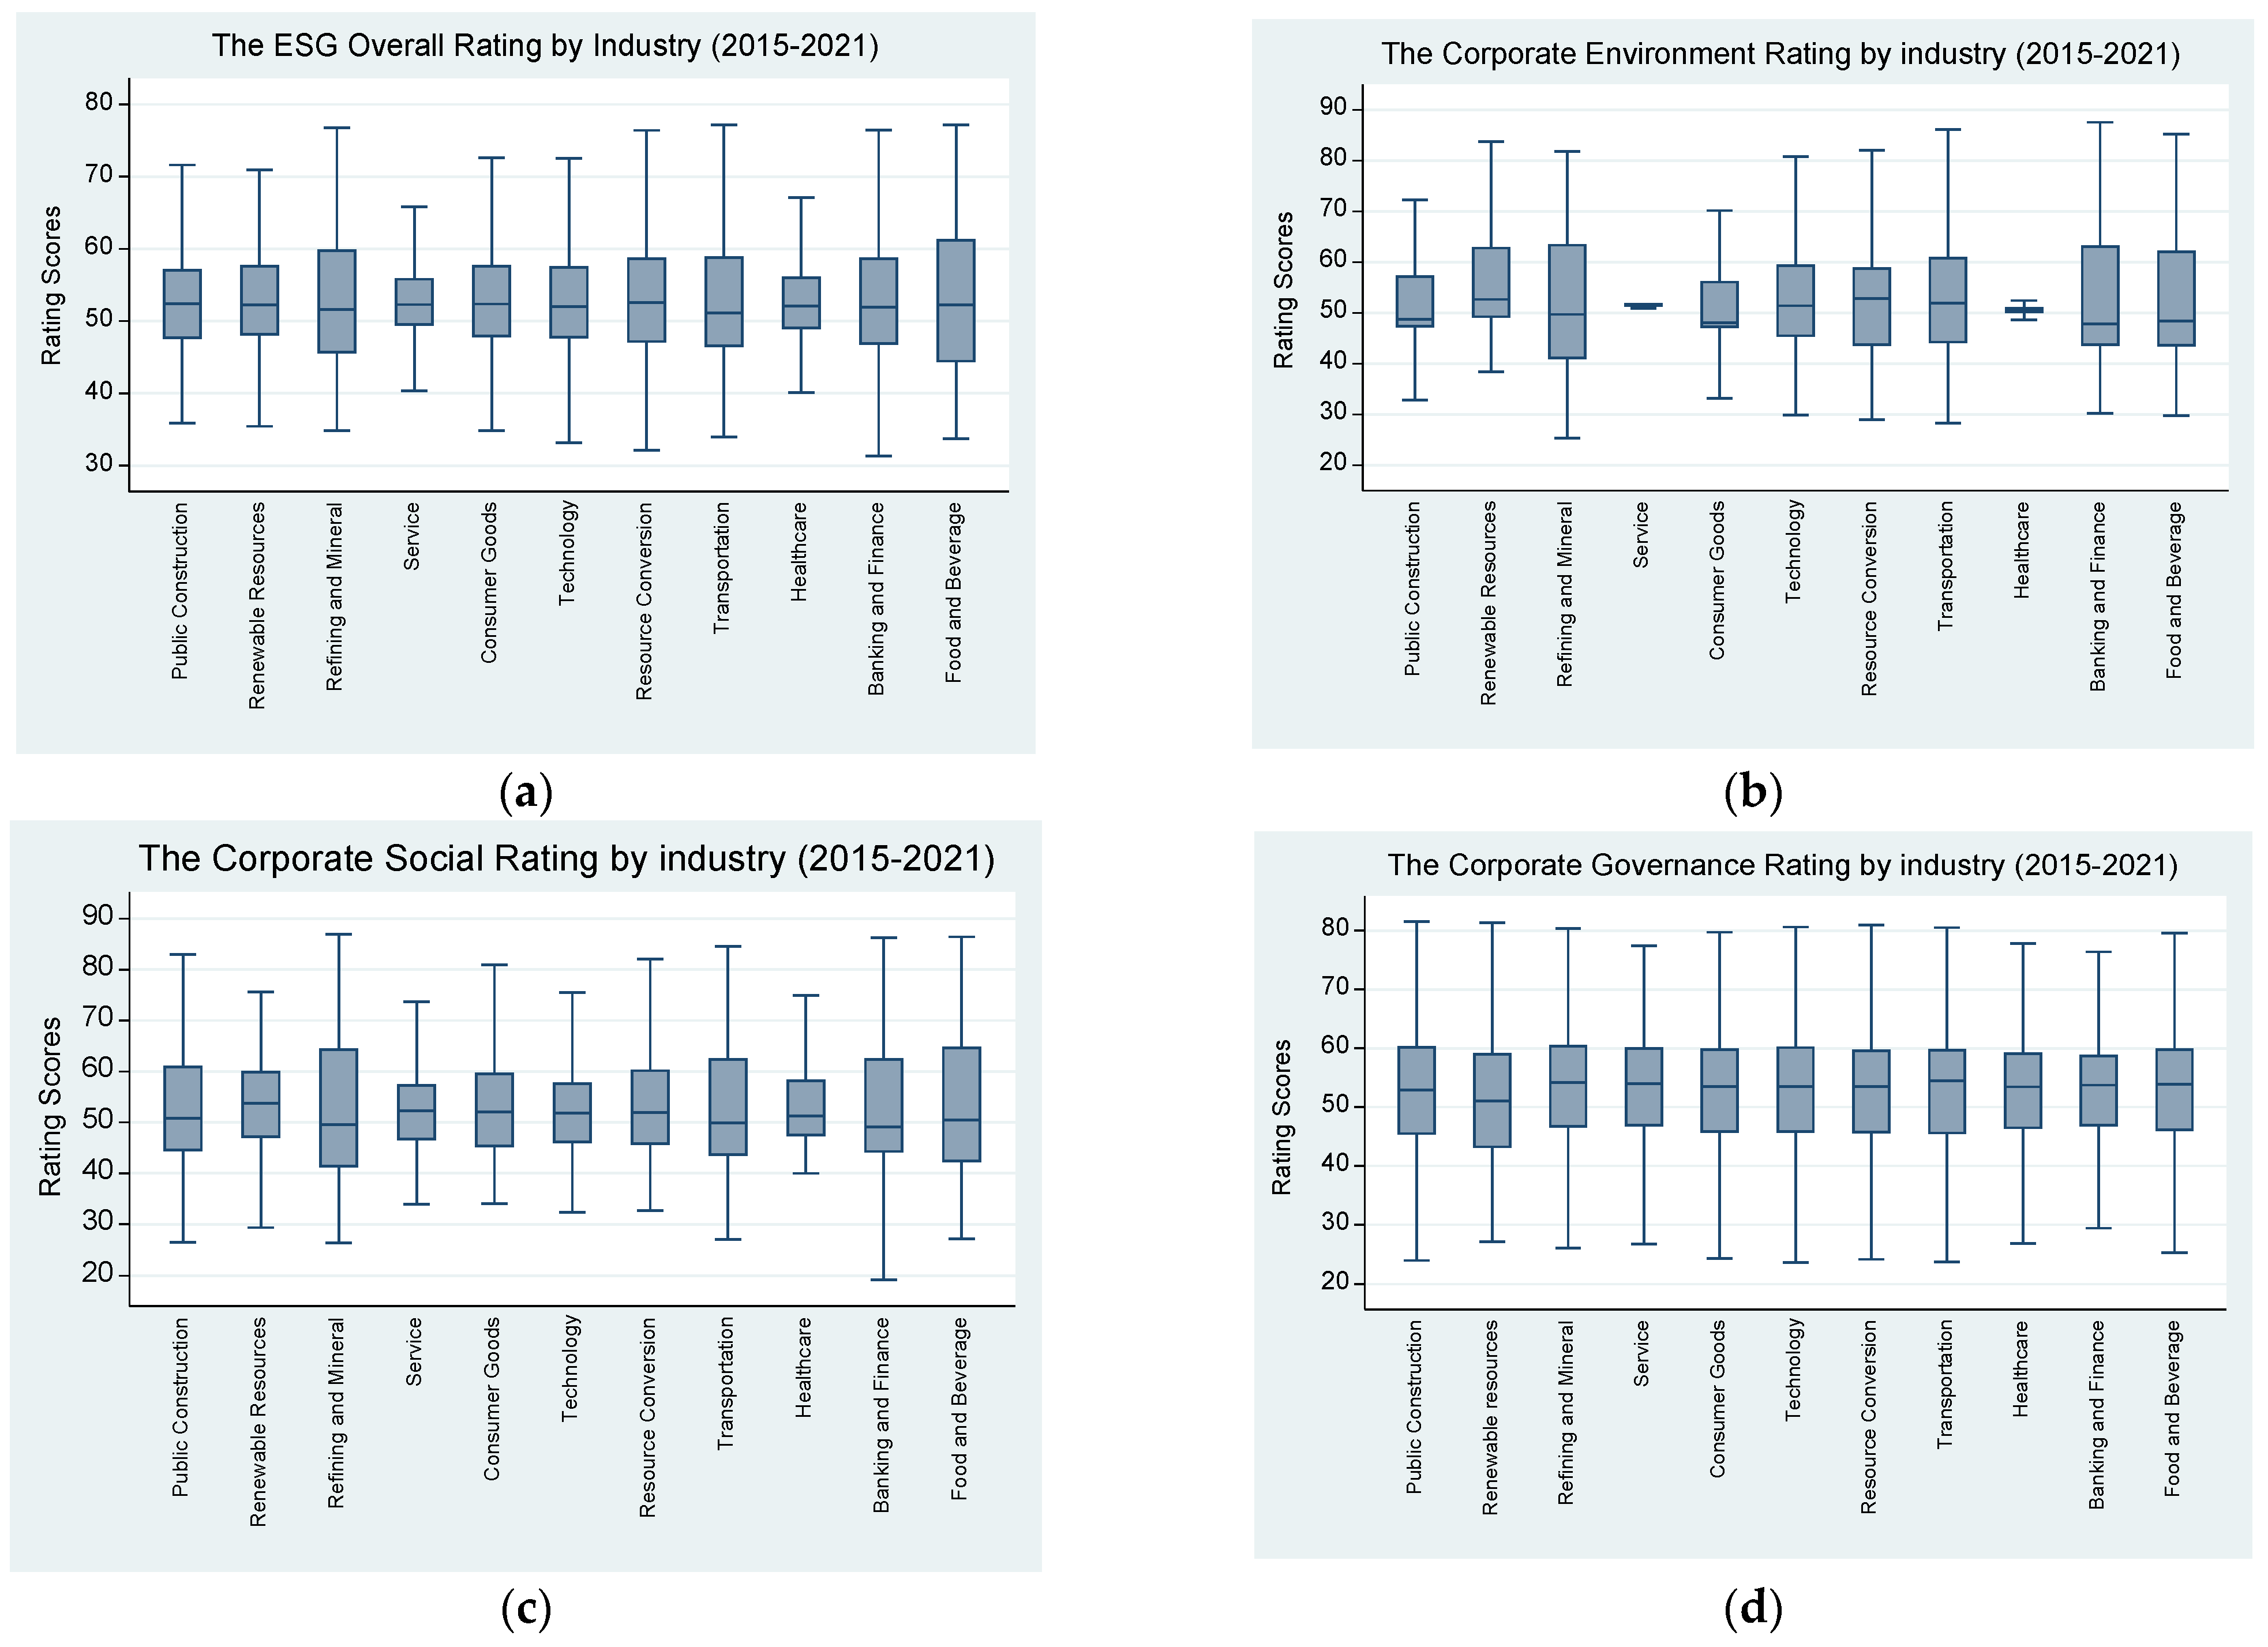
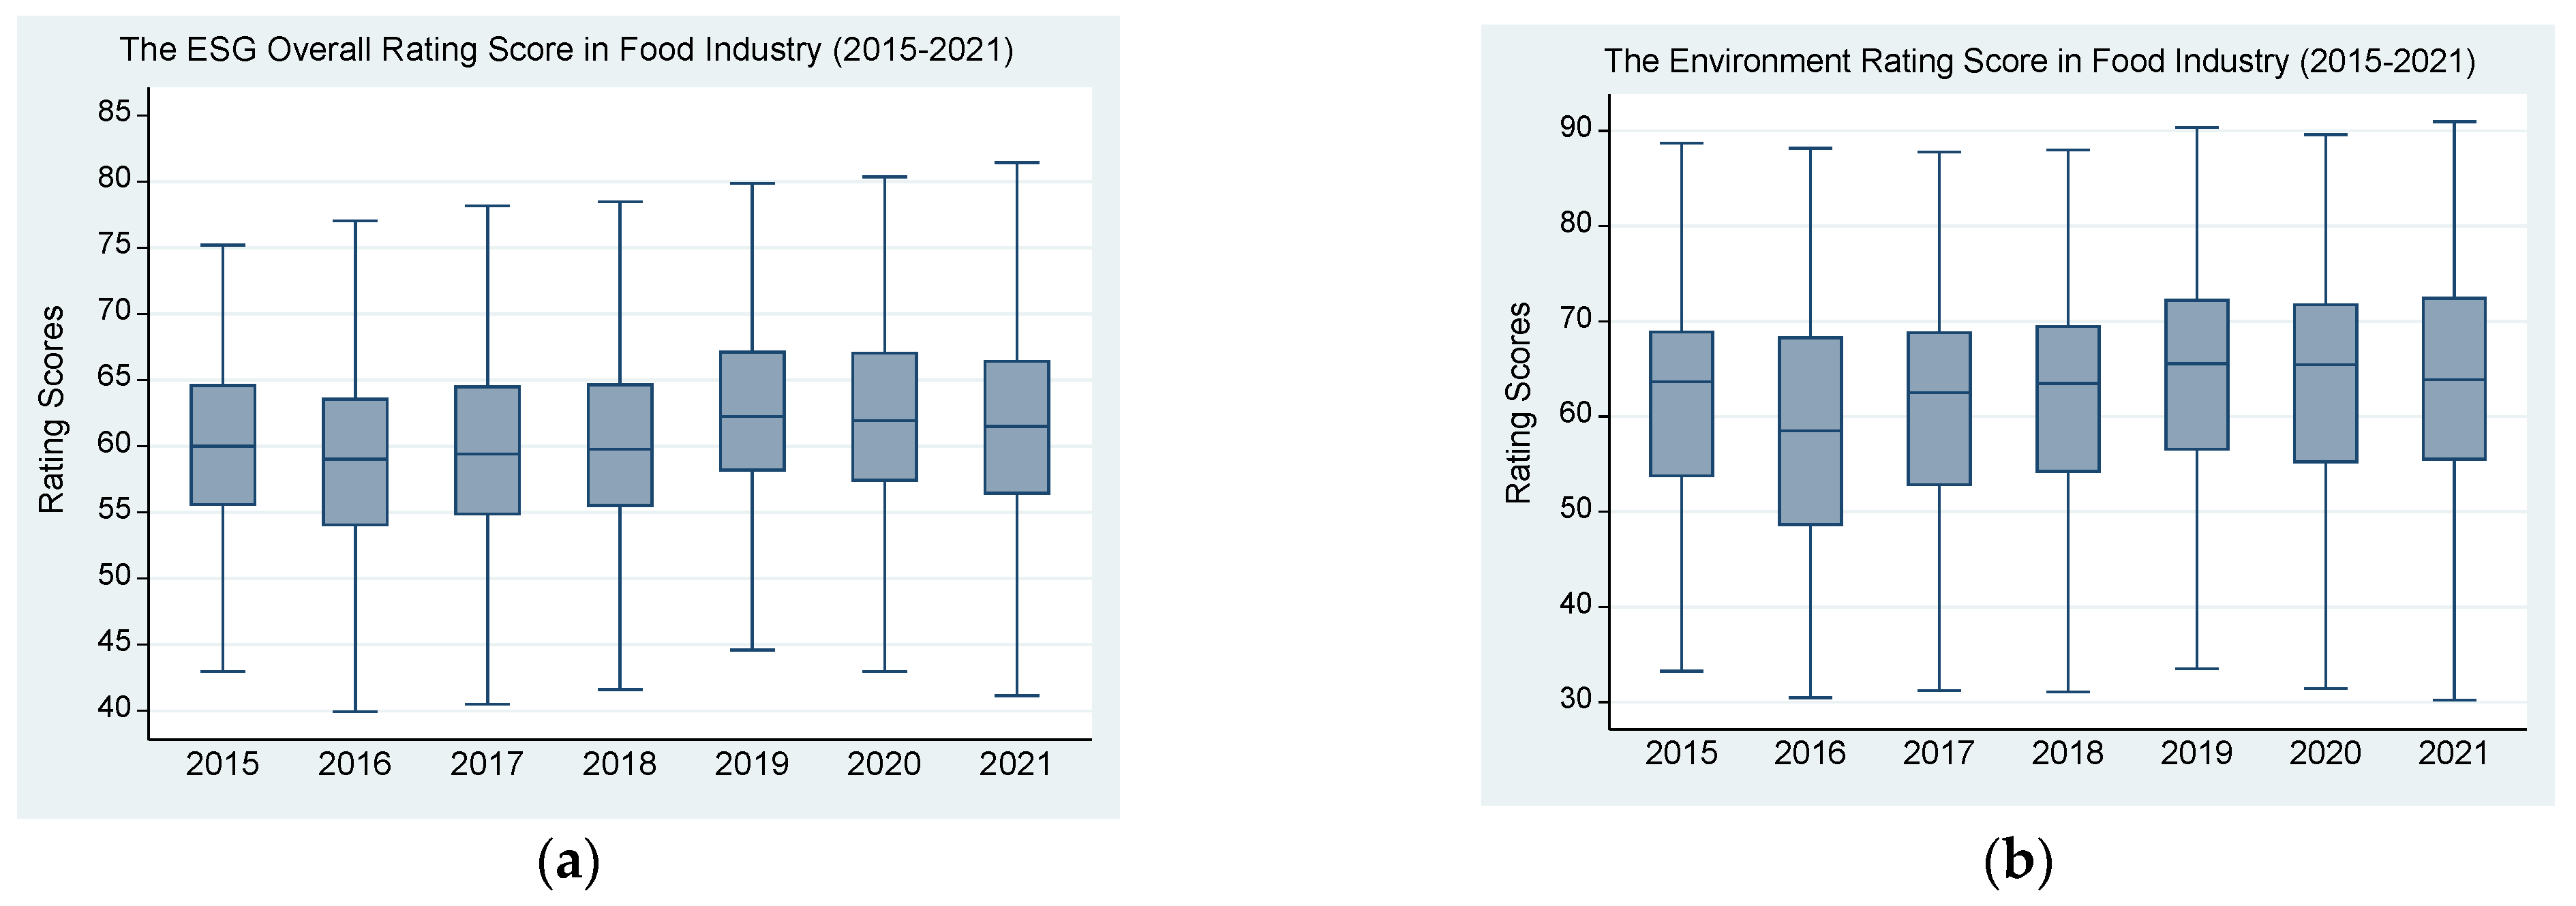
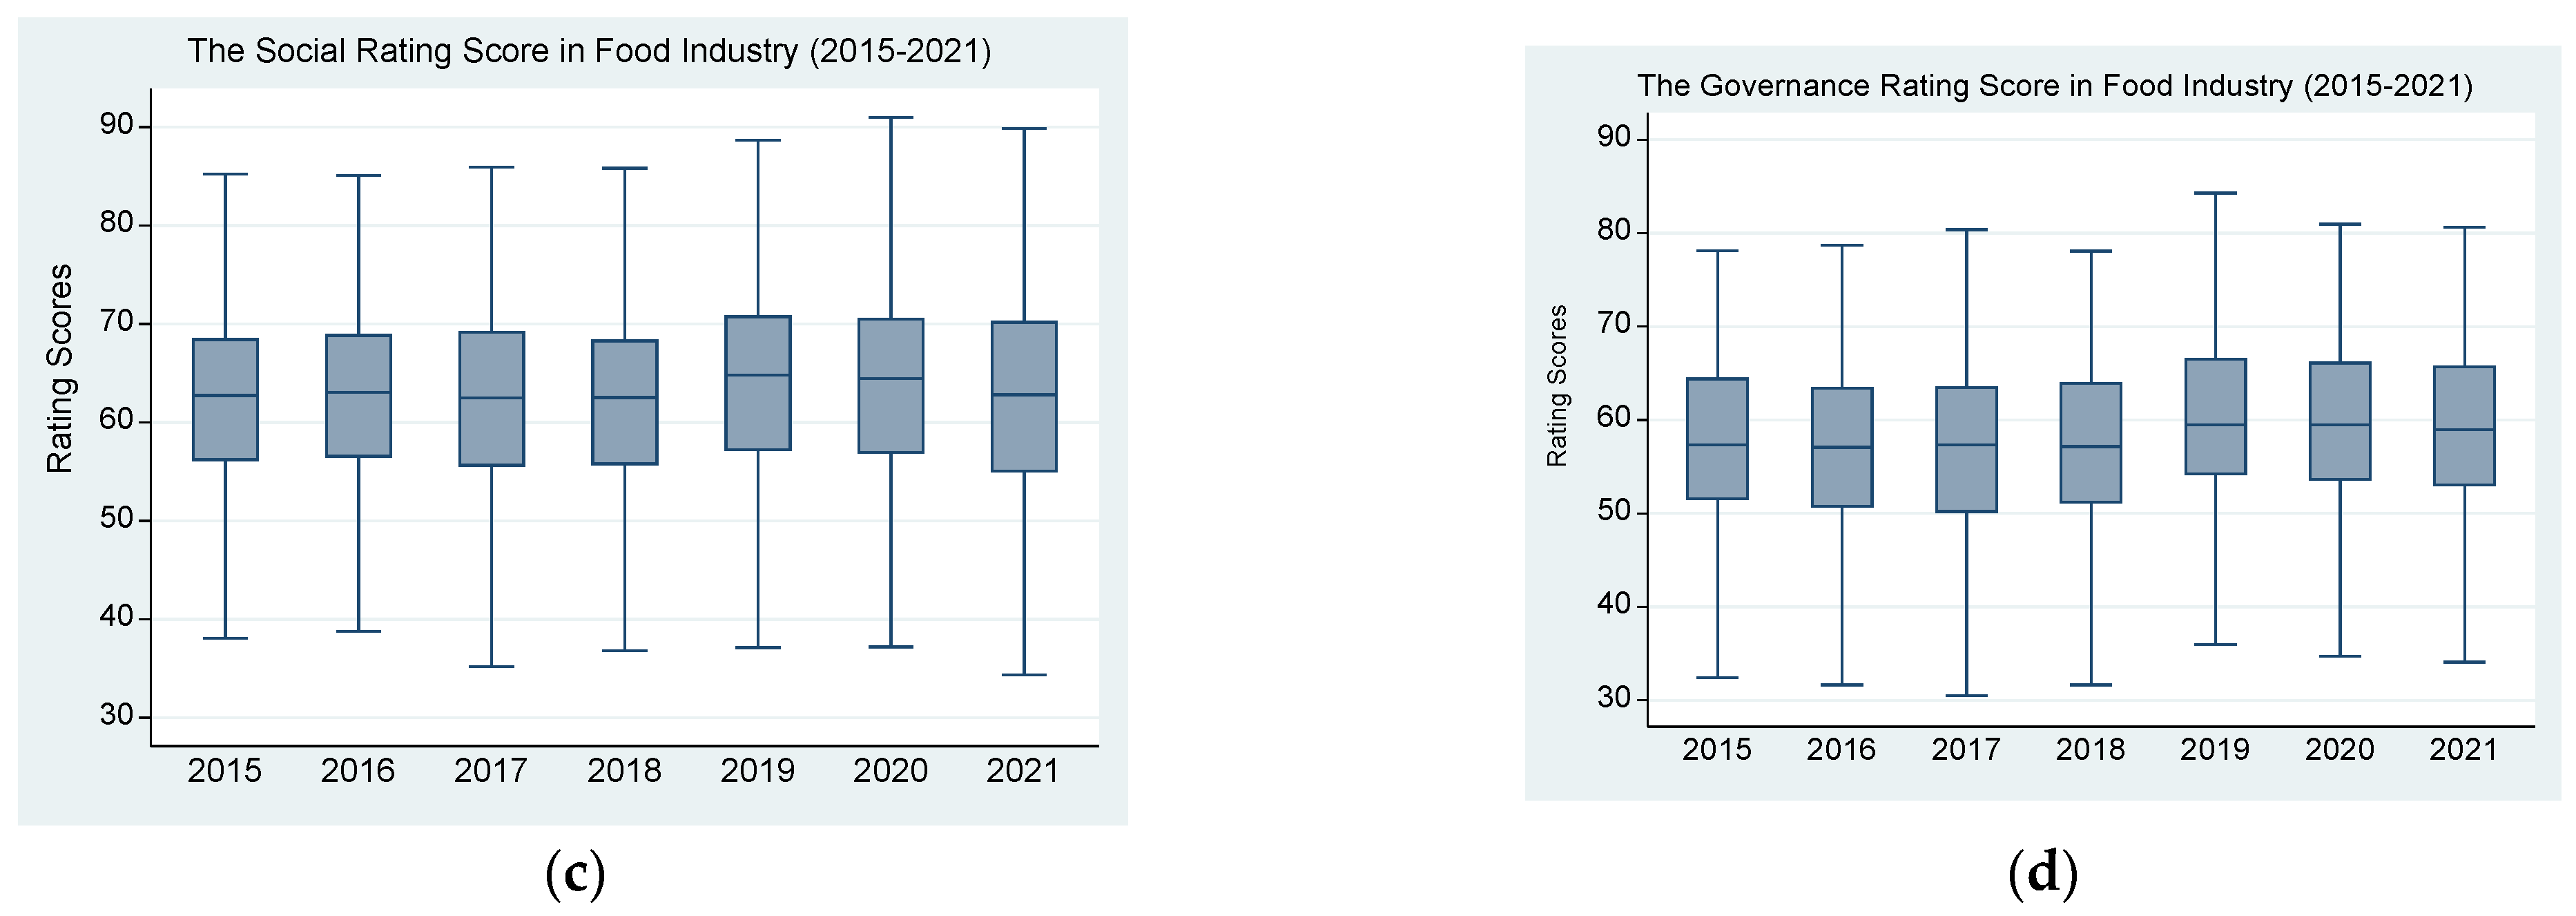
4.2.1. Time Trend and Distribution on ESG Rating Scores in the Food Industry

Table 3 presents ESG overall and component rating scores for sample food companies, the mean of ESG overall scores is 60.009, while UNI company shows the highest ESG overall scores of 74.404 in comparison to the lowest ones of 40 for Shin Tai Industry. Moreover, the mean test results at the 1% significance level (p < 0.01) in Table 3 confirm the statistical robustness of ESG performance variations among sampled food companies. The mean ESG overall score (60.009), environmental score (59.944), social score (64.112), and governance score (55.164) are all statistically significant, with p-values of 0.0000 at 1%, indicating that these differences are unlikely to be random. Notably, the social score (64.112) is the highest, suggesting that firms prioritize labor practices, stakeholder engagement, and corporate social responsibility. In contrast, the governance score (55.164) is the lowest, pointing to potential deficiencies in board independence, risk oversight, and corporate transparency. The statistical significance of these mean test results reinforces the materiality of ESG factors in corporate sustainability evaluations. For investors, policymakers, and financial analysts, these findings offer key insights into ESG-driven financial performance, risk management, and long-term value creation in the food industry.
According to the analysis of ESG overall rating scores of various industries in Taiwan from 2015 to 2021, as shown in Figure 1a, it can be observed that the difference between the maximum and minimum values is about 10 points, while the difference in the median is relatively tiny. Especially in the food and beverage industry, the difference between maximum and minimum values is enormous. However, the upper, median, and lower quartiles are relatively evenly distributed relative to other industries. These data show apparent differences in ESG ratings between different sectors, and the differences in medians are relatively small, which means that most industries have relatively average performance on ESG indicators. Especially in the food and beverage industry, the difference between the maximum and minimum values of ESG indicators is enormous, which may mean that the ESG performance of companies in the food and beverage industry varies widely.
According to Figure 1b, we can observe the comparison of scores of various industries in Taiwan on the environmental aspect (E) from 2015 to 2021. In the service and healthcare industries, the maximum and minimum values almost overlap, which means that the scores of the two industries in the environmental dimension are relatively even. In the food and beverage industry, the difference between the maximum and minimum values is about 50 points, and the median score of this industry is lower than that of other industries. In other words, these data show significant differences in the environmental aspects of different industries. Companies’ performance in ecological excellence is relatively average in the service and healthcare industries. However, companies in the food and beverage industry have significant differences in their scores on the ecological dimension, and the median score is relatively low. This may mean that in the food and beverage industry, some companies have achieved better performance in environmental protection, while others have more incredible room for improvement.
According to Figure 1c, we can see the comparison of the scores of various industries in Taiwan regarding social components from 2015 to 2021. Regarding social factors, the gap between each sector’s maximum and minimum values is about 20 points, but the median is relatively even. This means that the scores between industries’ scores are minor on the social dimension, and the median scores are relatively close. This may mean that in terms of social aspects, enterprises in various industries sector social responsibility results in Taiwan generally have similar performance levels and have achieved better social responsibility results.
According to Figure 1d, we can observe the comparison of governance scores of various industries in Taiwan from 2015 to 2021. The maximum value, minimum value, median, and upper quartile can be seen. The lower quartile is much more average than the environmental and social aspects. The maximum and minimum values reflect that some companies have achieved high governance achievements in specific industries, while others have poor performance. The median, upper, and lower quartile show the middle value and upper and lower bounds of the overall governance level. Compared with environmental and social aspects, the differences in these governance indicators reflect the importance that different industries attach to governance, the measures taken, and their effectiveness. These data show that there are differences in governance among sectors, room for improvement in Taiwan, and room for improvement in the overall governance level—the difference in governance among industries in Taiwan.
As shown in Figure 2a, the annual distribution of the total ESG overall rating score of Taiwan’s food industry from 2015 to 2021 has grown steadily from 2016 to 2019 and has experienced a slight decline from 2020 to 2021. The possible reason is COVID-19; the epidemic during this period may have a particular impact on the ESG performance of companies. In responding to the pandemic, companies may face operational difficulties, personnel management issues, and supply chain disruptions. These factors may hurt their ESG performance.
Figure 2b shows the annual changes in environmental aspects of Taiwan’s food industry from 2015 to 2021. Starting in 2016, the median gradually increased, implying an improvement in overall environmental performance. However, there is still a significant difference between the maximum and minimum values, about 50 points. This means there is a particular imbalance in environmental performance in the food industry. Some companies have achieved outstanding environmental achievements, while others, such as ecological ones, are outstanding and have more room for improvement. This difference may be due to differences in the environmental management and execution capabilities of different companies.
As shown in Figure 2c, we can observe the annual distribution of the social aspects of Taiwan’s food industry from 2015 to 2021. We can observe that the difference between the maximum and minimum values in each year gradually increases, while the median part is relatively average. This trend may reflect the differences in social responsibility among different companies in the food industry, and some companies are more outstanding in this regard. At the same time, the relative stability of the median indicates that, overall, companies in the food industry have achieved a certain average level in social aspects, but there is still room for improvement.
According to Figure 2d, it can be seen that the annual analysis of the governance aspects of Taiwan’s food industry from 2015 to 2021 shows that the governance aspect scores of the food industry show a slow growth trend, which shows that during this period, the food industry of companies has gradually strengthened their performance in terms of governance. Although differences still exist, the overall trend focuses on improving governance aspects to improve corporate governance levels.

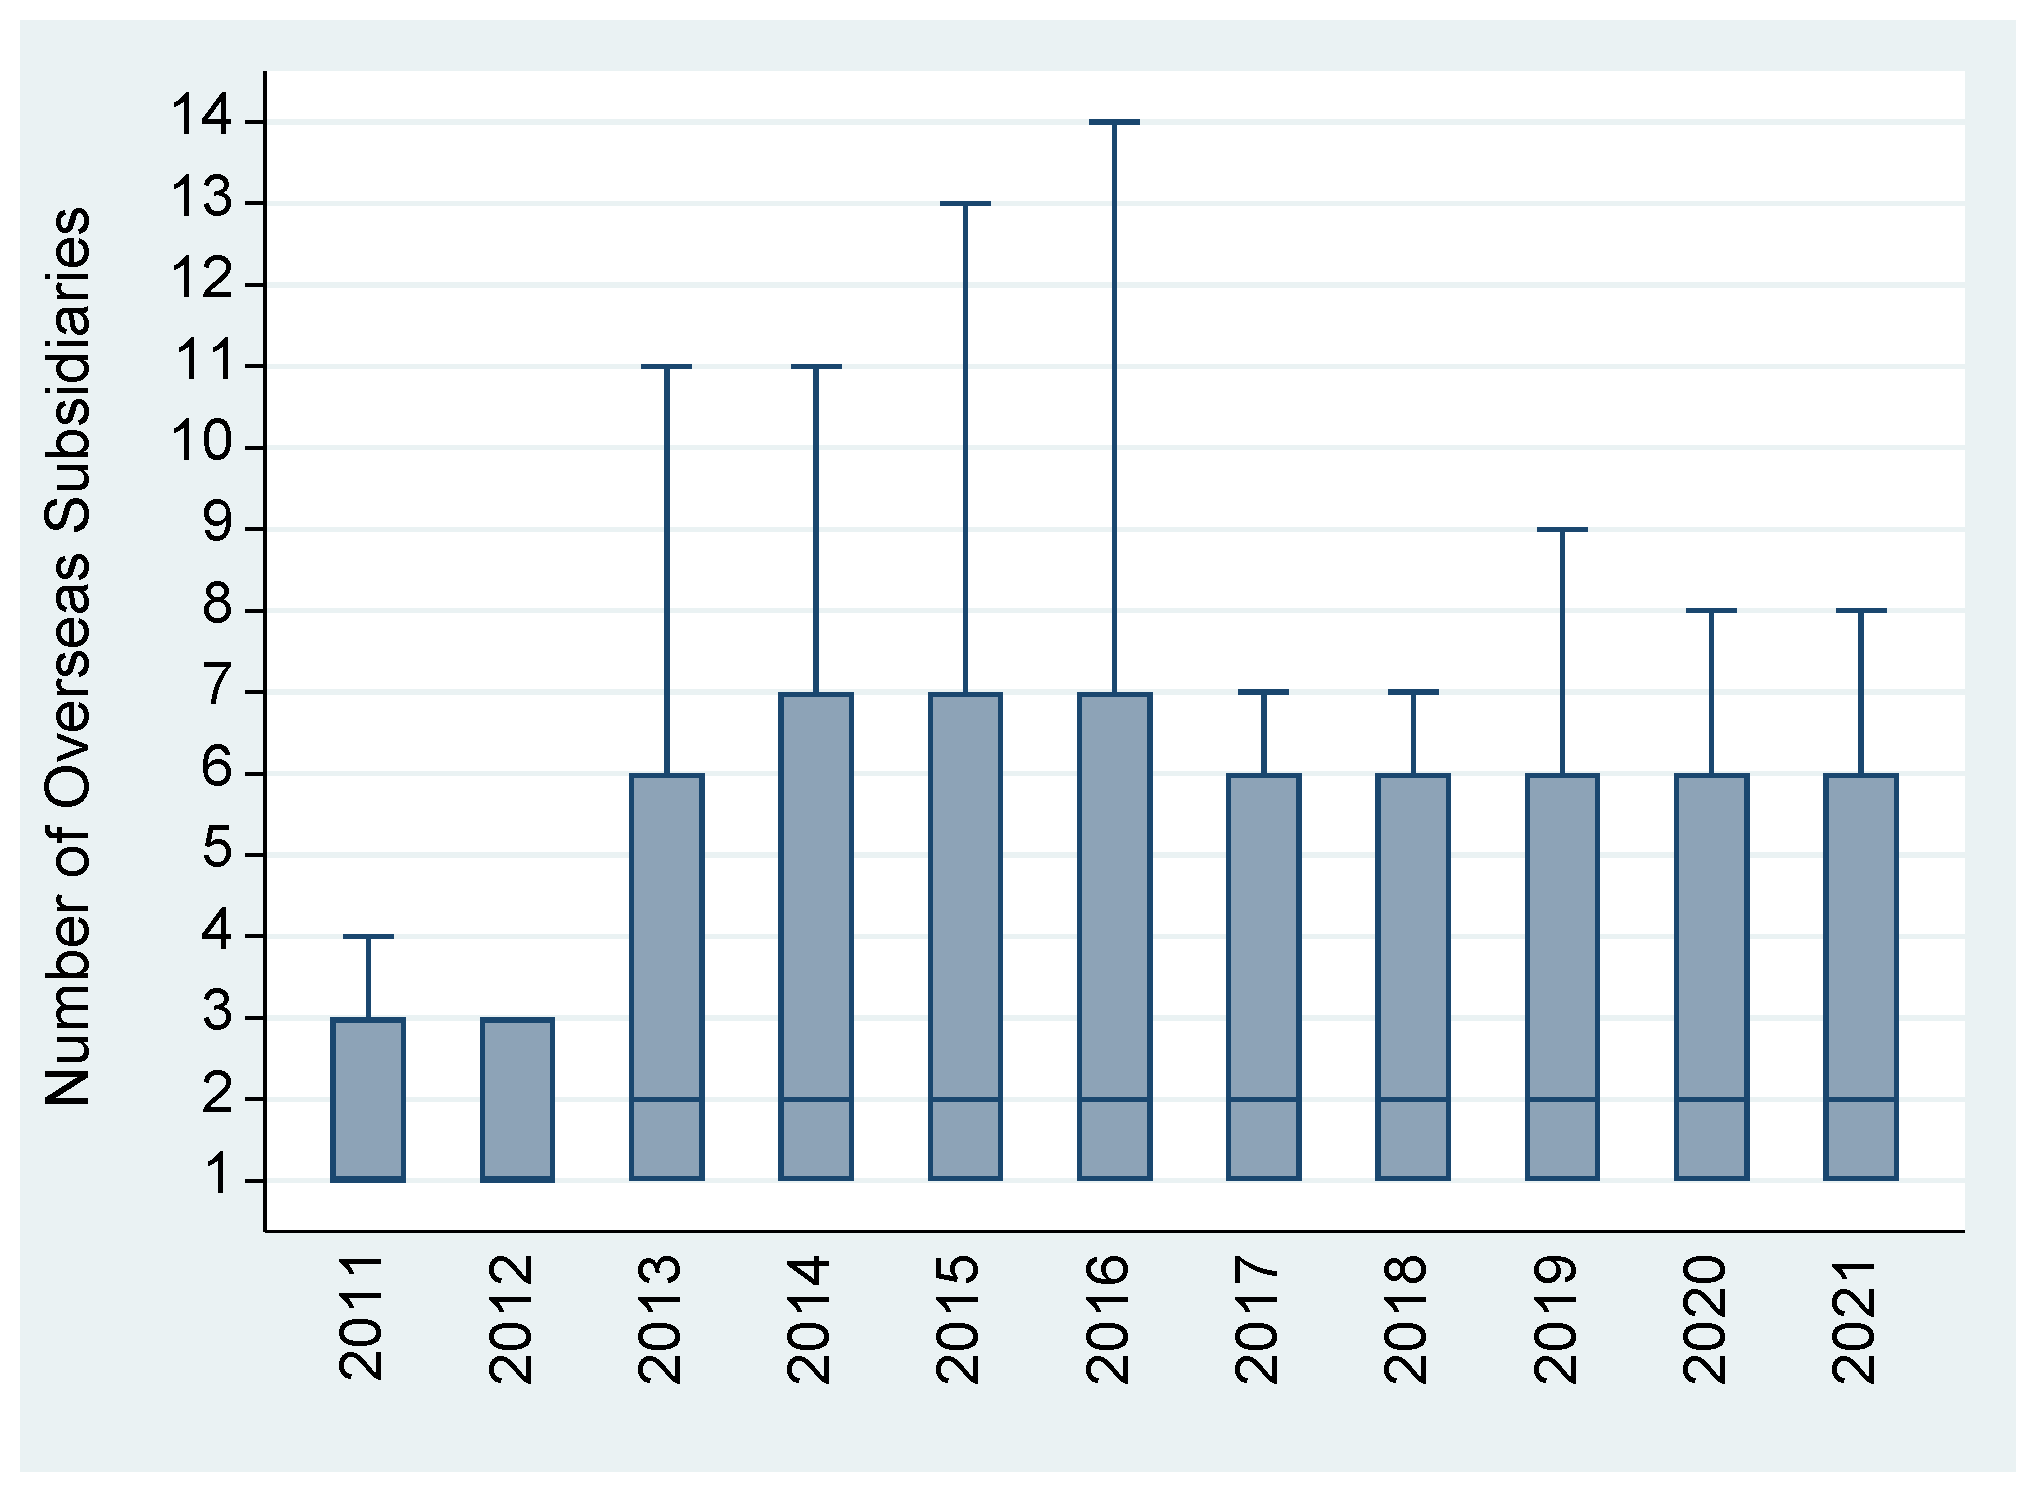
4.2.2. Time Trend and Distribution on International Diversification of Food Manufacturers

As shown in Figure 3, we can see the distribution of the number of overseas subsidiaries of the sample companies from 2011 to 2021. The number of overseas subsidiaries increased from 2013 to 2016, which may indicate that the company further expanded its international operations during this period. Business, however, after 2016, the number of overseas subsidiaries decreased significantly, which may imply that the company’s expansion plans in overseas markets have slowed or stopped. In addition, Table 4 shows the distribution countries of overseas subsidiaries in the food industry from 2015 to 2021. The countries with the most significant proportions are the Cayman Islands, the British Virgin Islands, and Hong Kong. Their ratios are 13.96, 23.4, and 26.6 respectively. It can be seen that Hong Kong ranks first, which should be highly related to its proximity to the Taiwan headquarters. The tax havens of the Cayman Islands and the British Virgin Islands are among the first choices for the food industry to open overseas company registration.
Figure 4a shows the relationship between ESG performance and food companies’ ROA from 2015 to 2021. The graph shows a positive relationship, which means that the better the overall ESG performance of food companies, the higher the return on ROA. Figure 4b presents the relationship between environmental performance and ROA of a sample food company. The graph shows that better environmental performance of a food company can slightly increase the return on total assets. Figure 4c also shows similar results; that is, better performance in the social aspect of a food company can slightly increase the return on total assets. In comparison, Figure 4d shows that better performance in the corporate governance aspect of a food company can significantly increase the ROA. Moreover, Figure 5a shows the relationship between overall ESG performance and food companies’ ROE from 2015 to 2021. The graph shows a significant positive relationship, which means that the better the overall ESG performance of food companies, the greater the ROE. The total return on sales in comparison, Figure 5b,c shows that better performance in the environment and social components of a food company can significantly increase the shows at the ROE, Figure 5d shows that better performance in the corporate governance aspect of a food company can significantly increase the shows at the similar trend.
Figure 6a shows the relationship between ESG performance and food companies’ ROS from 2015 to 2021. The graph shows a significant positive relationship, which means that the better the overall ESG performance of food companies, the higher the ROS; however, Figure 6b,c show firms with higher environmental and social components perform higher ROS. Figure 6d shows that better performance in a food company’s corporate aspect can significantly increase the relationship between a sample food company’s environmental performance and ROS. Finally, Figure 7a shows the relationship between the number of overseas food companies and the ROA. The graph shows a positive relationship, which means that the more overseas companies a food company has, the more it can increase ROA. Furthermore, Figure 7b shows that the more overseas companies a food company has, the more significant the ROE would be. Similarly, Figure 7c shows that the more overseas companies a food company has, the more critical ROS it will be.

4.3. The Joint Impact of International Diversification and ESG on Firm’s Performance

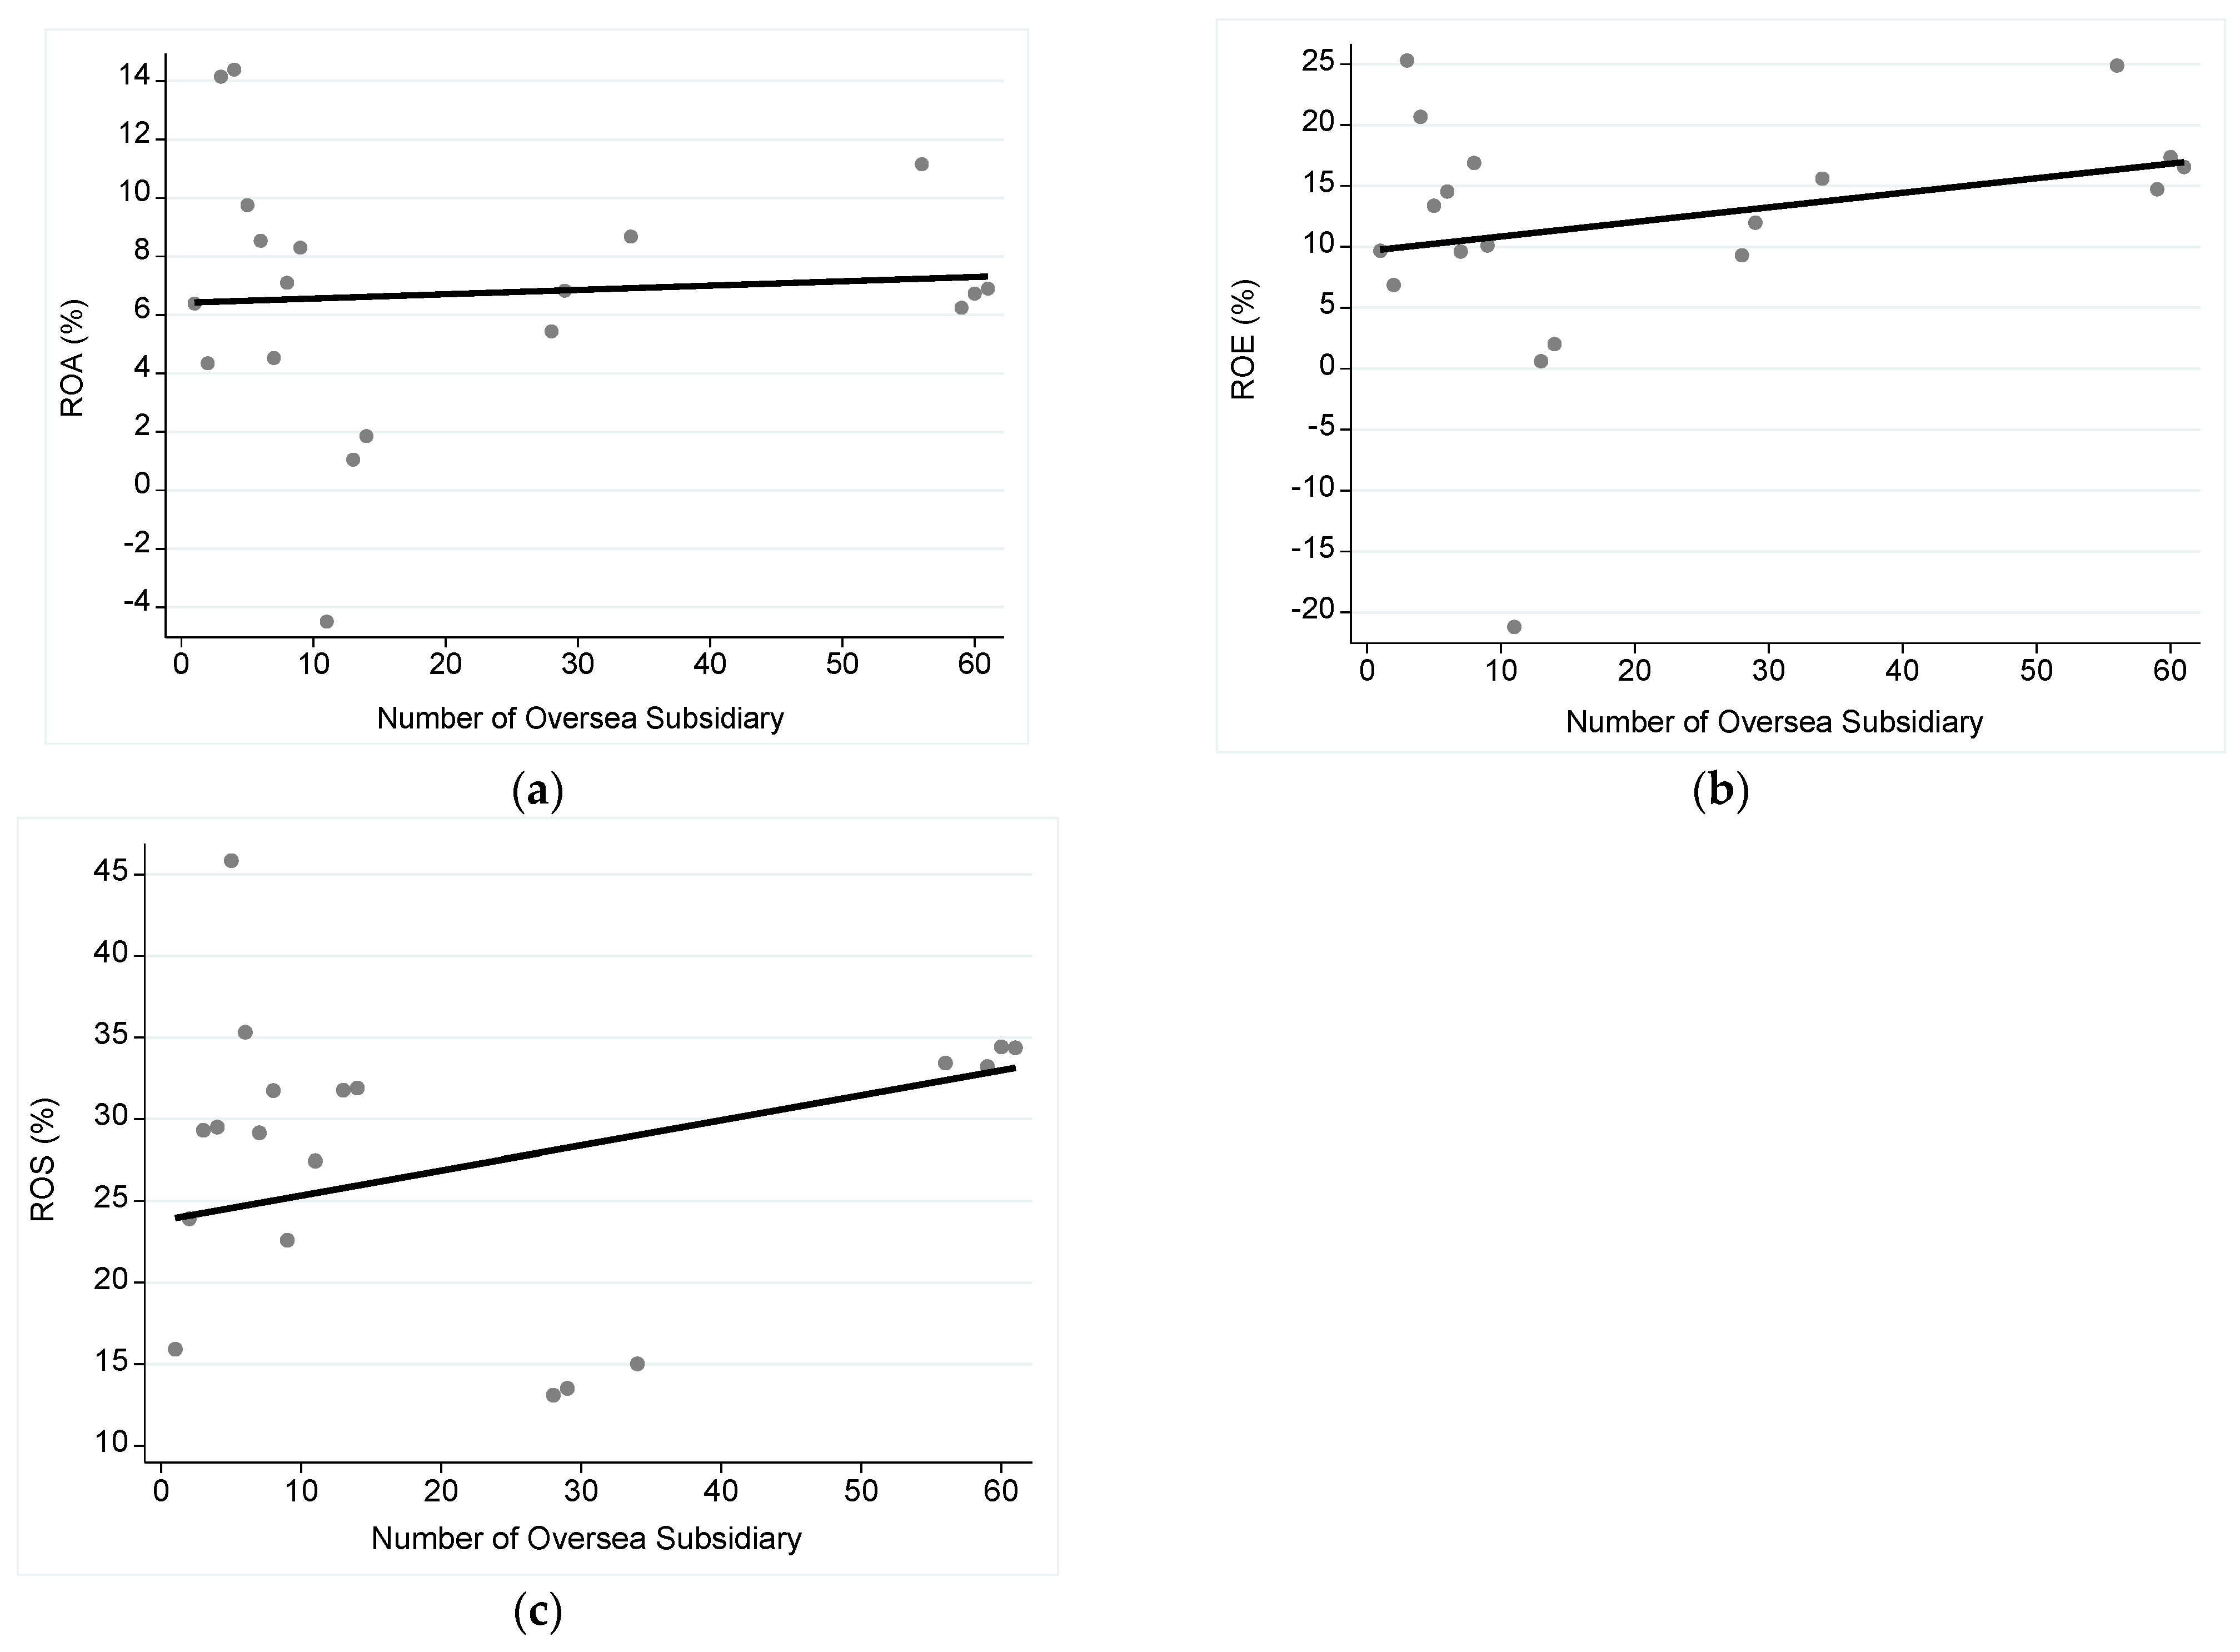
4.3.1. The Direct Impact of International Diversification on the Financial Performance

Table 5 shows the estimated results of the impact of international diversification on the operating performance of the food industry, showing whether using return on ROA, ROE, and ROS, respectively, as a company financial performance indicator, it can be found that the number of overseas companies of a sample food company has a positive and significant impact on operating performance, which means that the more overseas companies a sample food company has, the more its operating performance will be significantly improved. Regarding company control variables, a higher research and development expense ratio can improve operating performance, while a higher debt ratio can reduce operating performance. In particular, the total assets of the food industry have different effects on the company’s operating performance. When the scale of a food company becomes more extensive, it can significantly increase the ROA and the ROE. Still, it will dramatically reduce the ROS.

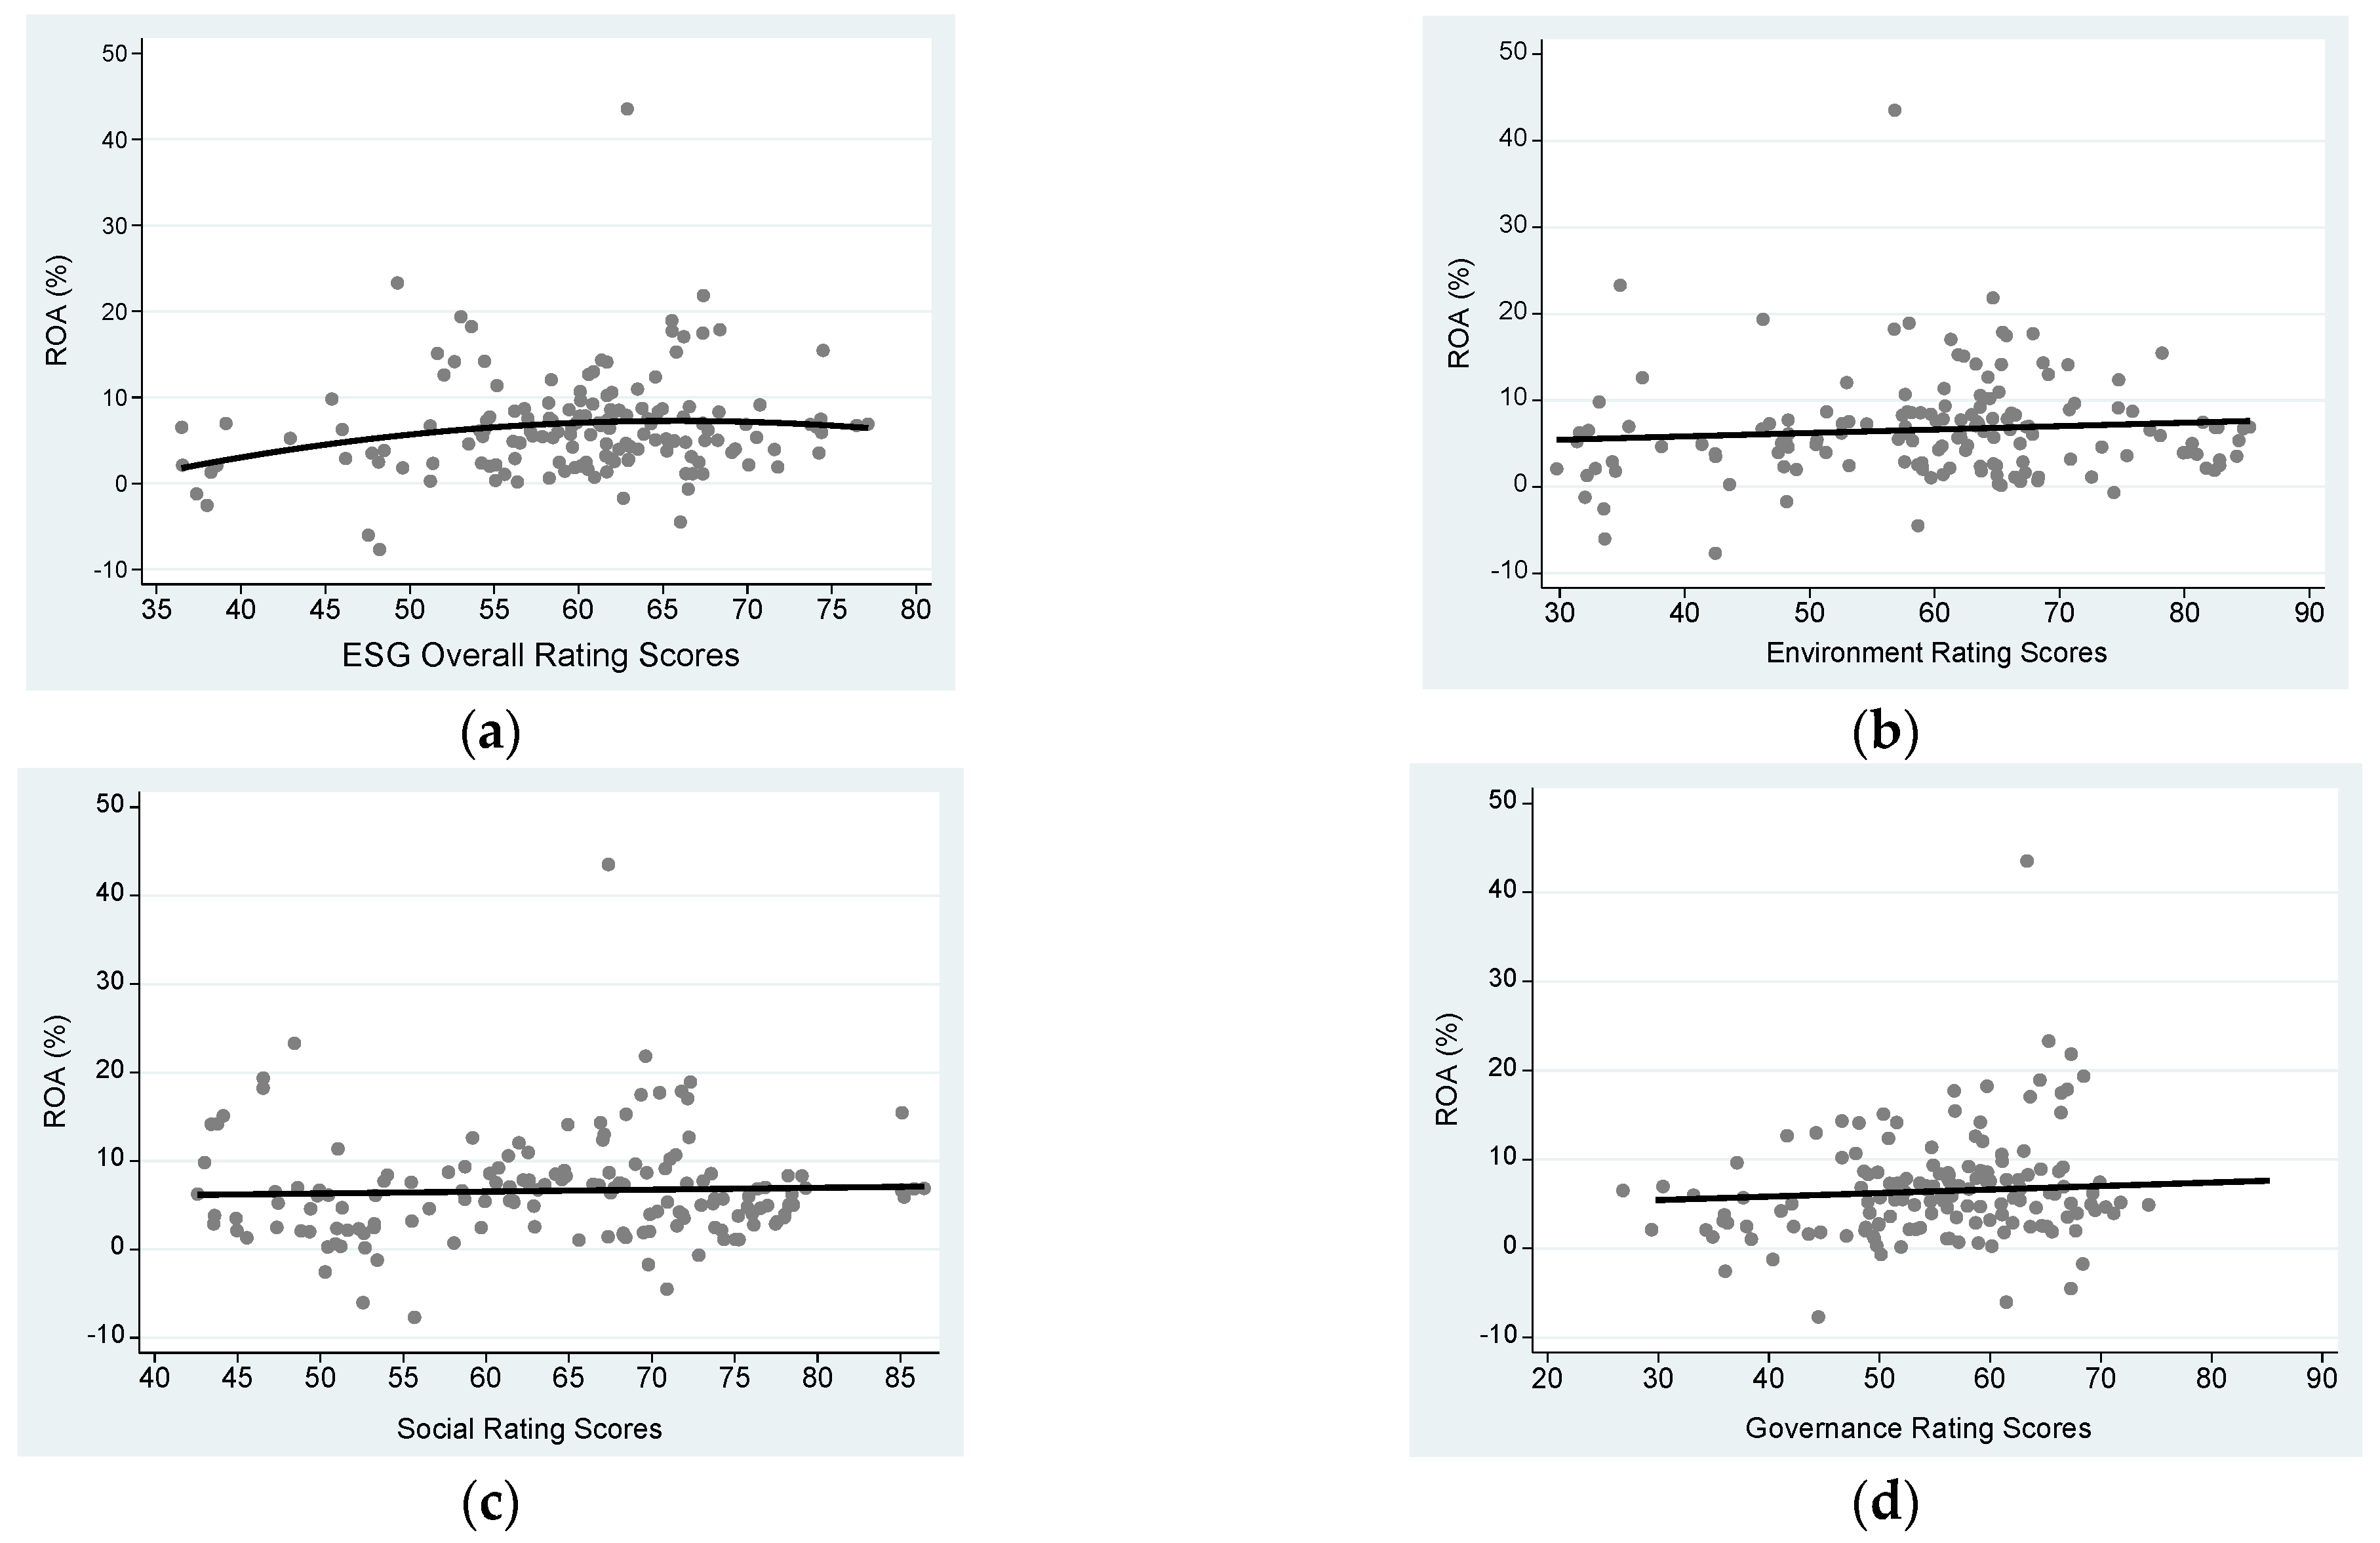
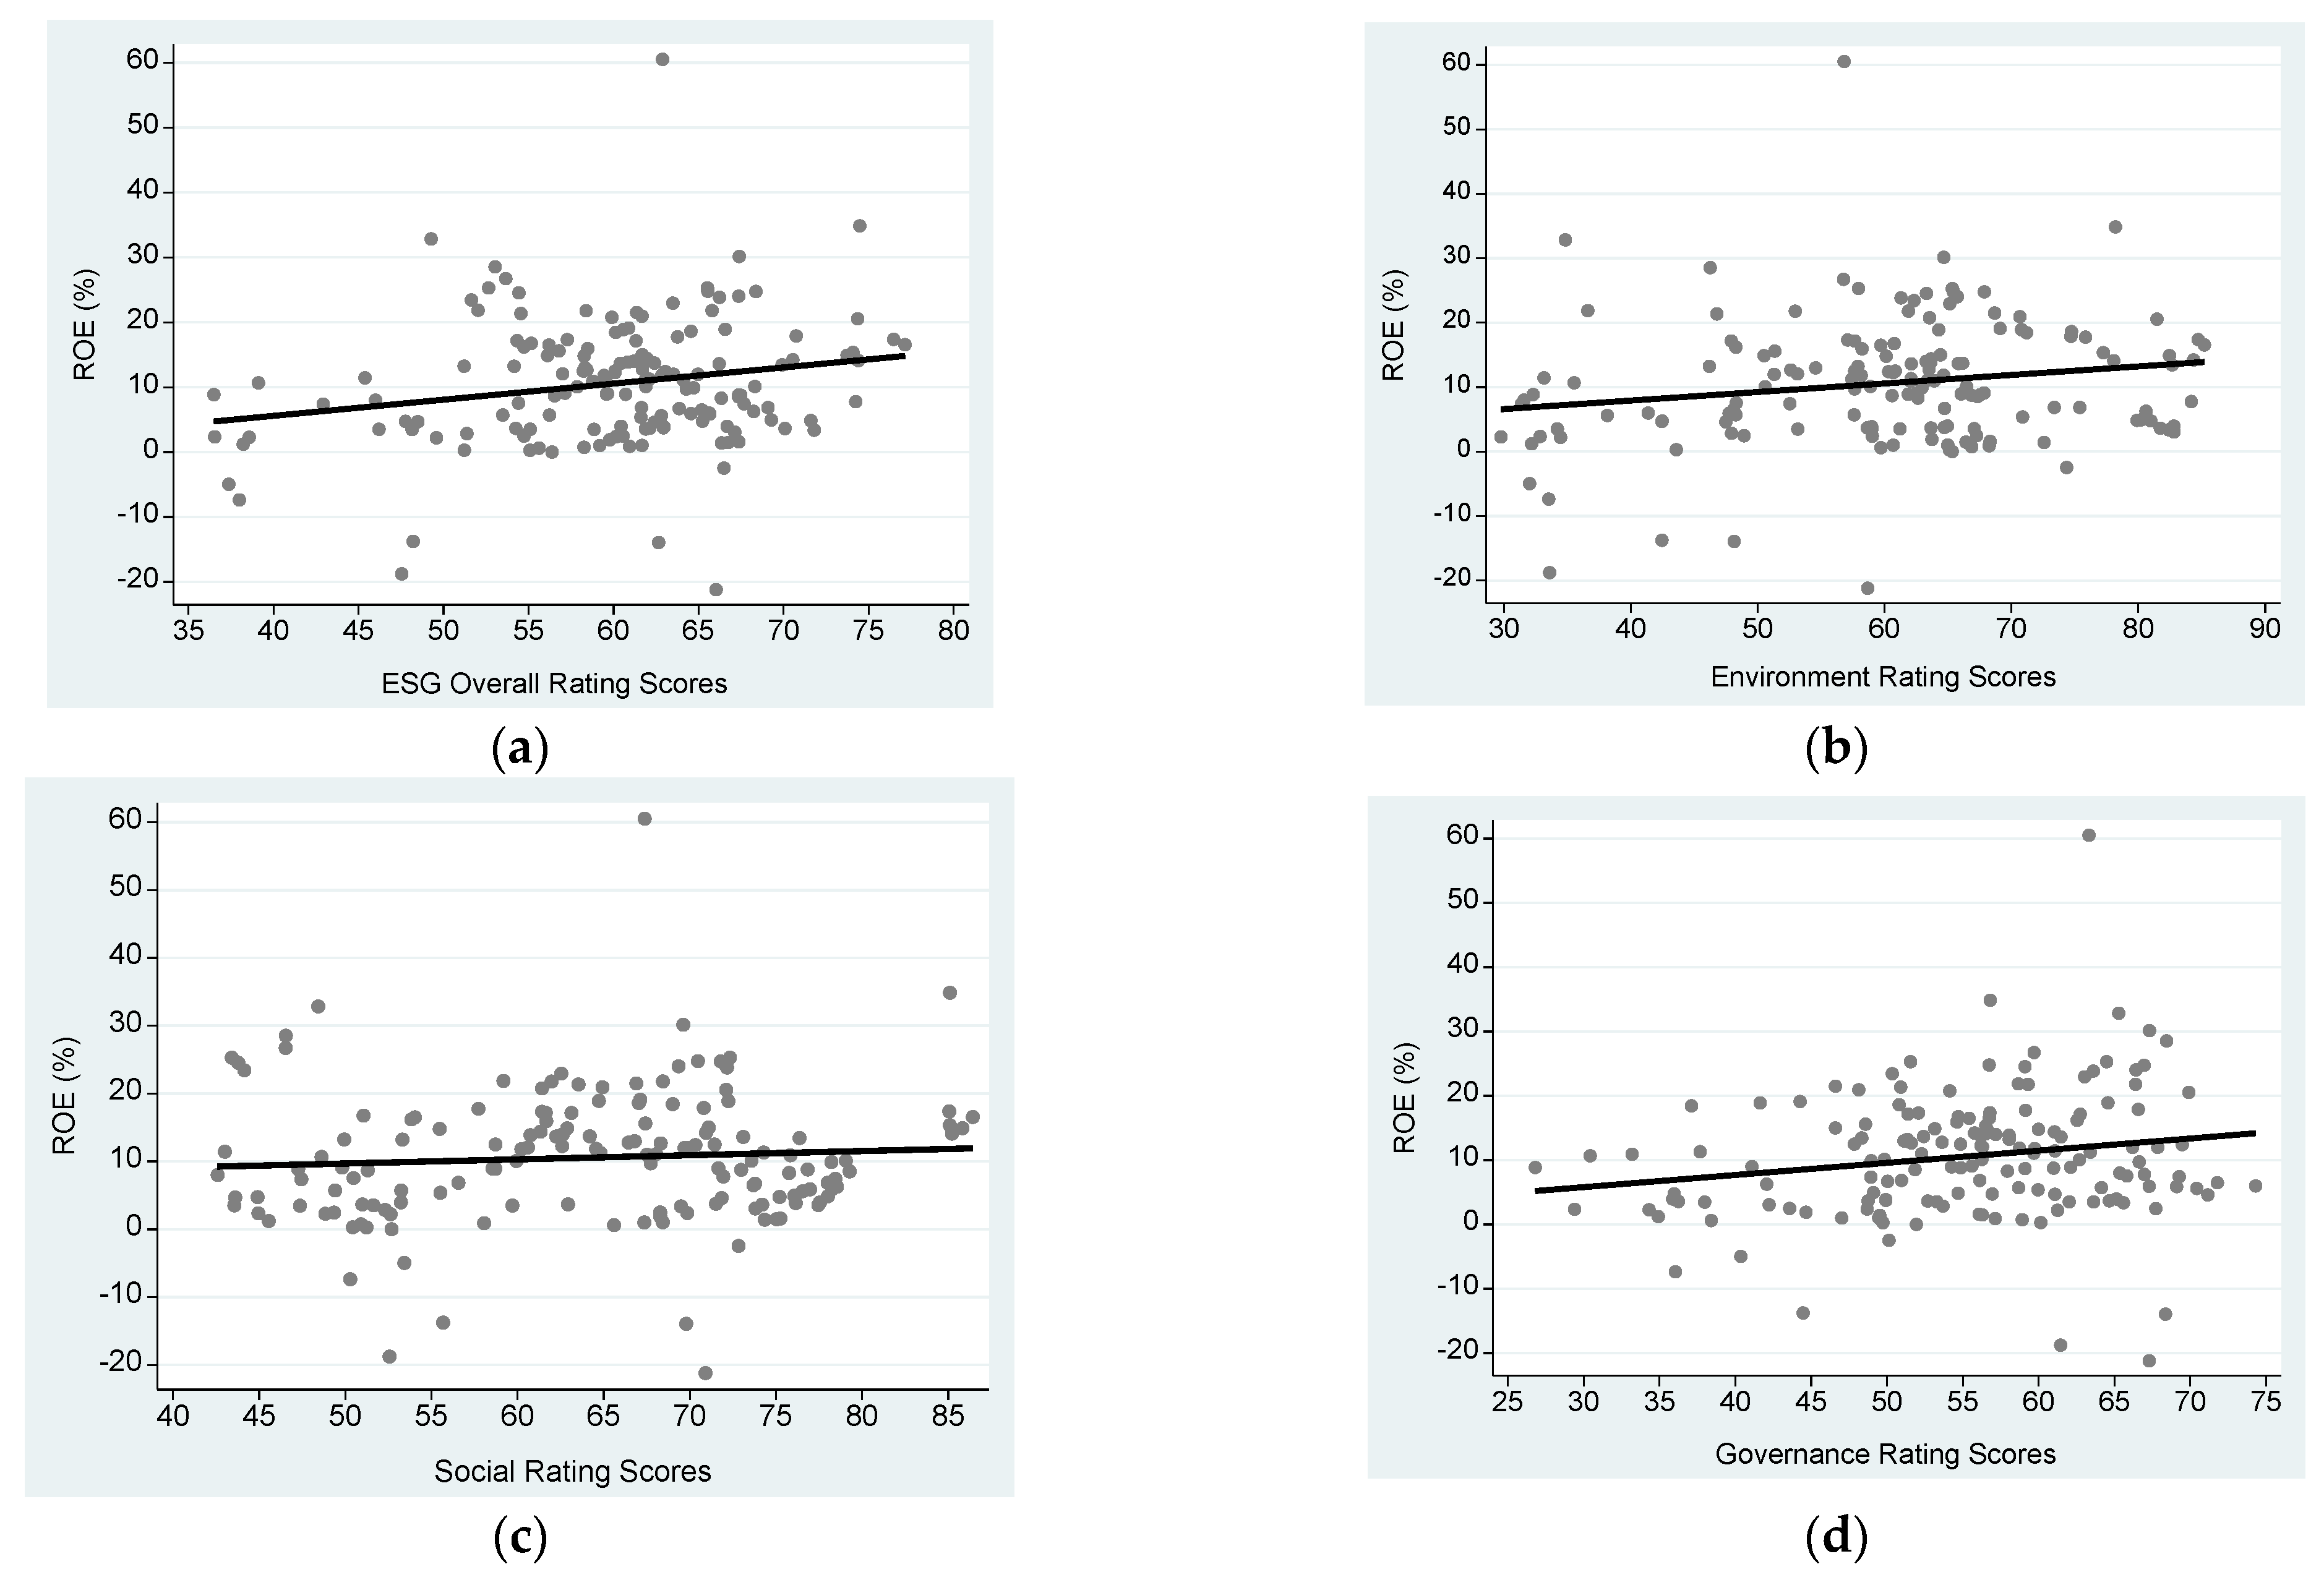
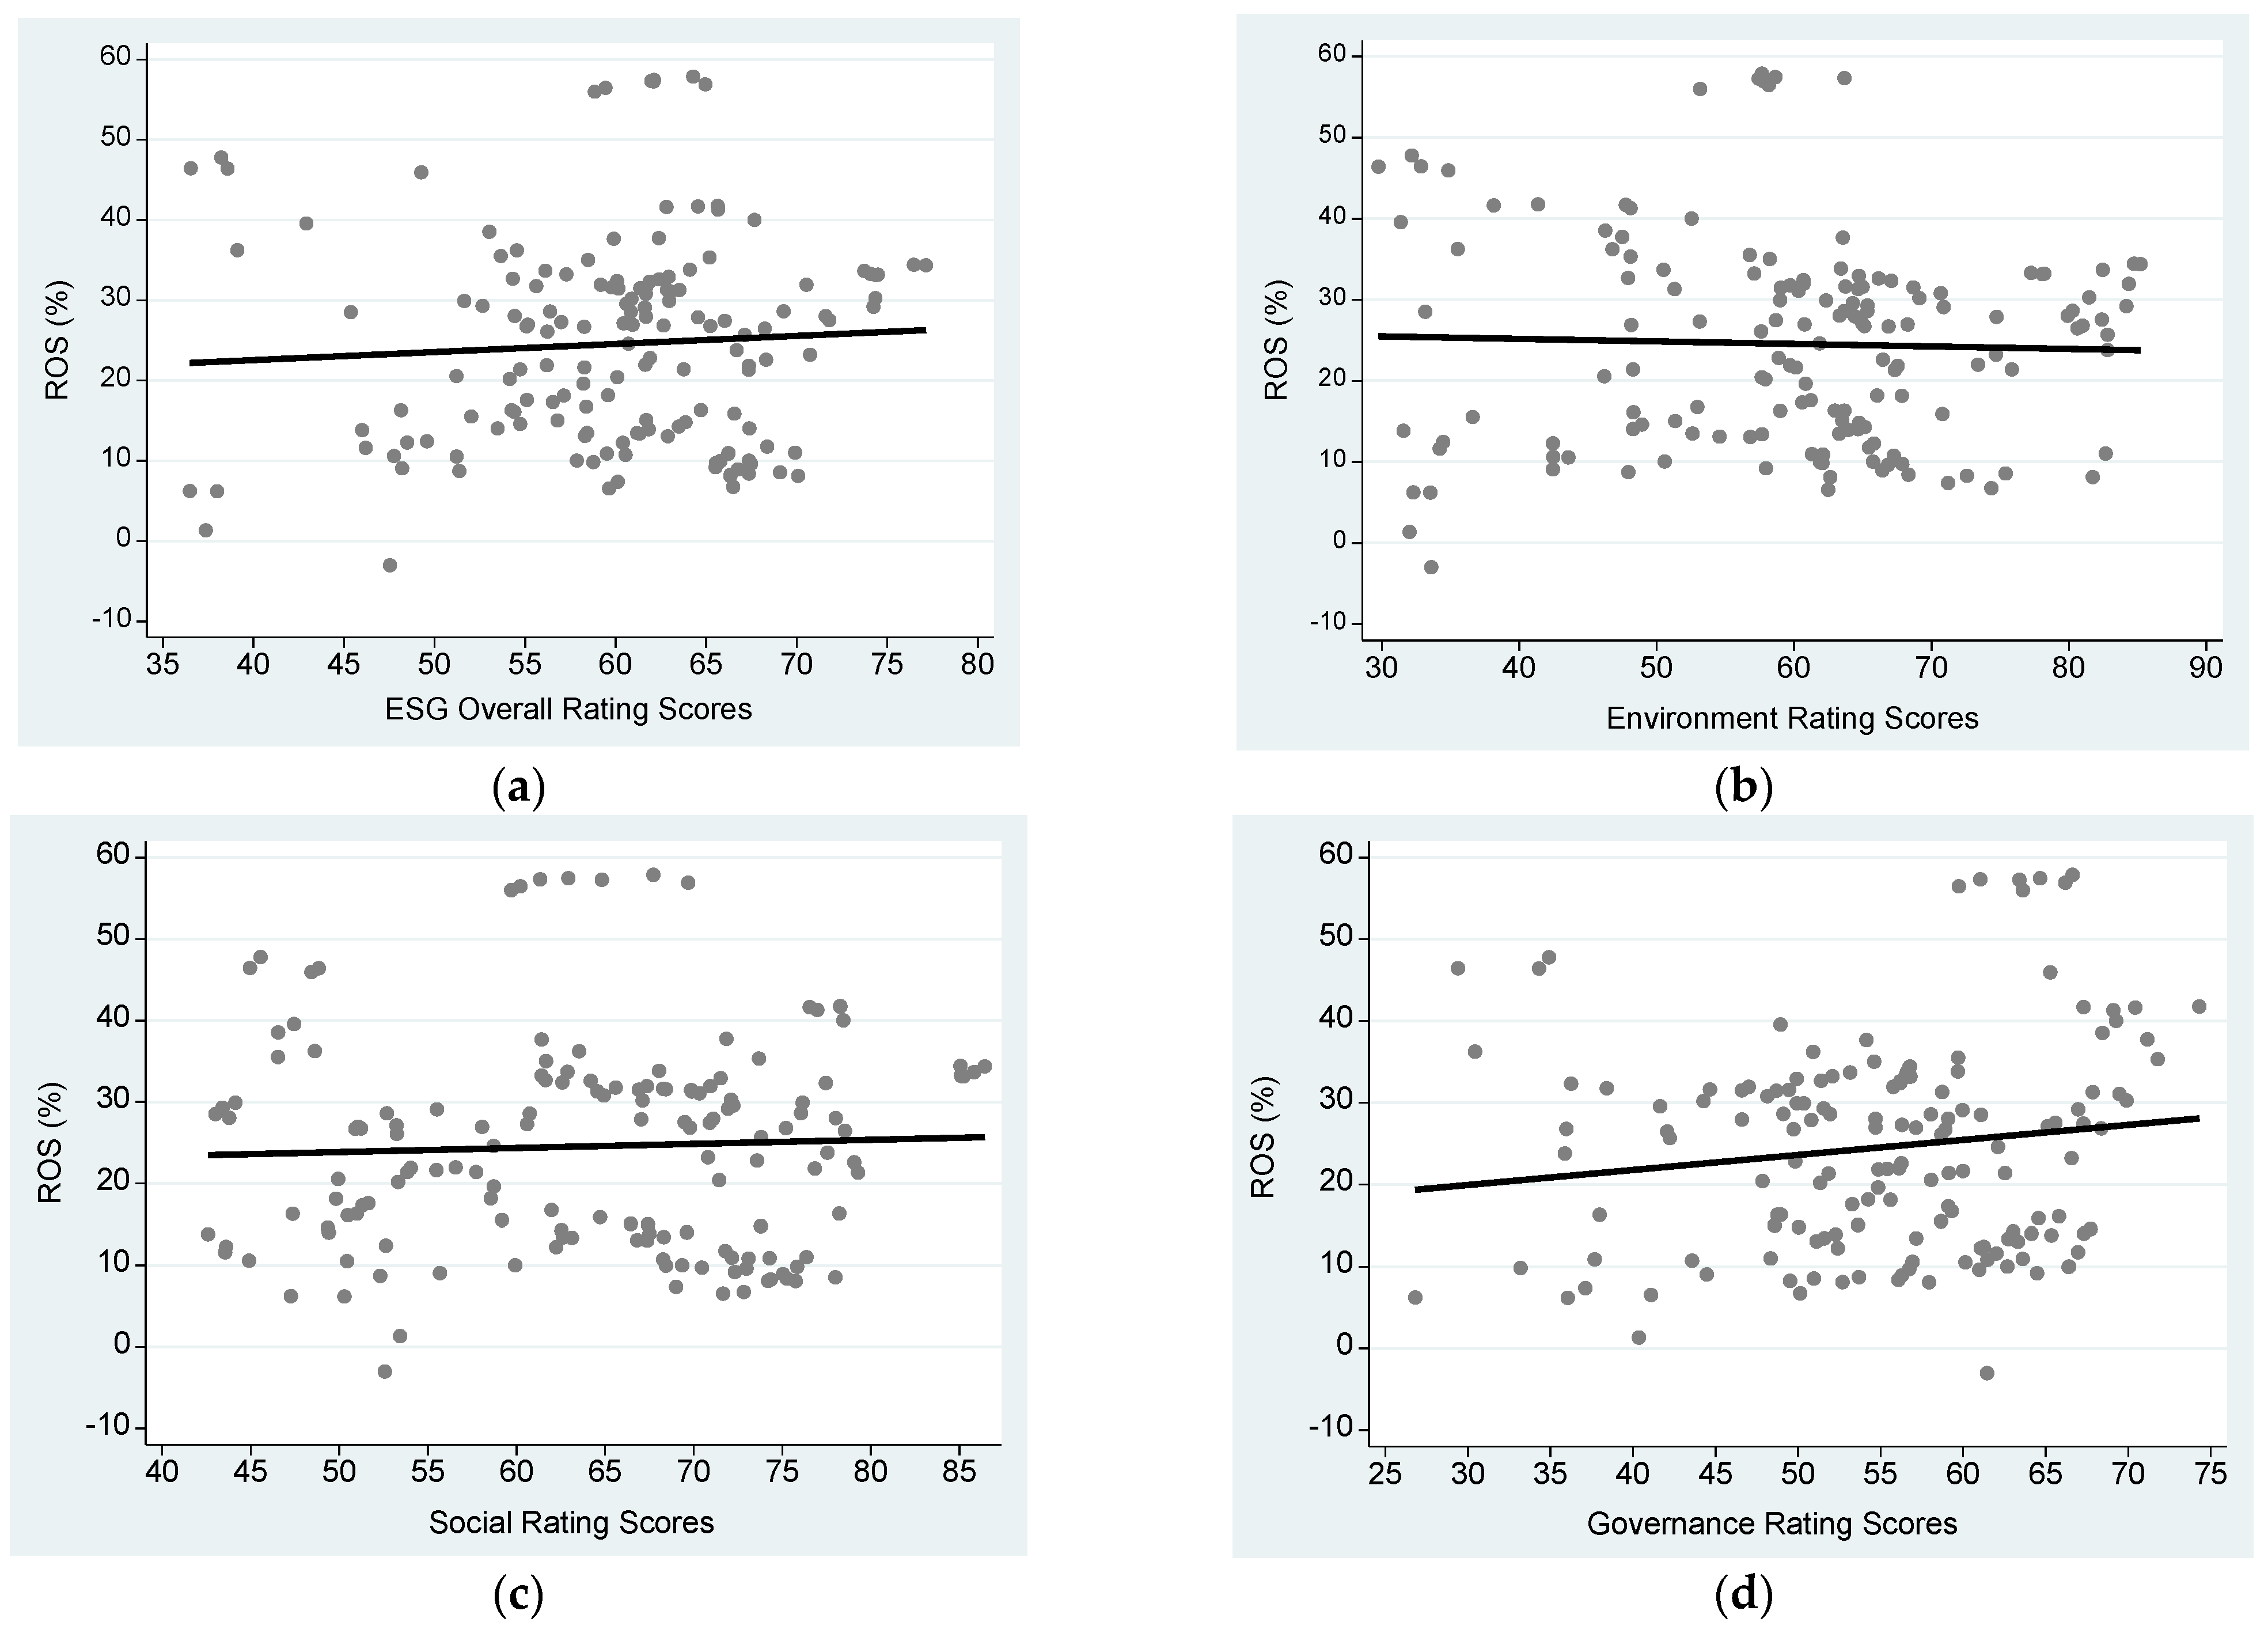
4.3.2. The Direct Impact of ESG Rating Scores on the Financial Performance

Based on the estimation results in Table 6, first of all, the estimation results of the impact of overall ESG performance on the operating performance of the food industry show that regardless of using ROA, ROE, and ROS as a company operating performance indicator, it can be found that the overall ESG performance of the sample food companies has a positive and significant impact on operating performance, which means that the better the overall ESG performance of the sample food companies will significantly improve their operating performance. In addition to social aspect scores, better environmental and governance performance of food companies can dramatically increase ROA, ROE, and ROS.

4.3.3. The Joint Impact of International Diversification and ESG Performance on the Financial Performance

According to the estimation results in Table 7, when the number of overseas companies of food industry companies is more significant, and the overall ESG performance is better, no matter whether the return on ROA, ROE, and total sales are used, respectively. When ROS is used as a company’s financial performance indicator, it can be found that the overall ESG performance of the sample food companies has a positive and significant impact on economic performance, which means that the better the overall ESG performance of the sample food companies will significantly improve their operating performance. At the same time, when a food company has more overseas companies and better environmental, social, and governance performance, it can significantly enhance the ROA, ROE, and ROS.

4.4. Endogeneity Tests: Instrumental Variable Method

Endogeneity is a critical issue in empirical finance research, as it leads to biased and inconsistent estimates, ultimately undermining causal inference. This problem arises due to omitted variable bias, simultaneity, and measurement error, making adopting appropriate econometric methods for correction essential. While Propensity Score Matching (PSM) and the Heckman selection model are commonly used in empirical studies, they are unsuitable for addressing endogeneity, particularly in small sample sizes. PSM relies on balancing observable characteristics but does not correct for unobservable confounders, often prevalent in finance research. Similarly, the Heckman model is primarily designed to address sample selection bias rather than general endogeneity concerns, and it requires substantial exclusion restrictions, which are difficult to validate in small datasets. Additionally, both methods are sensitive to model specification, and in small samples, their estimates tend to suffer from high standard errors and unreliable inference. In contrast, the Instrumental Variable (IV) method is more robust for addressing endogeneity, mainly when a strong instrument is available. The IV approach corrects for both observable and unobservable confounders, making it a powerful tool for establishing causality in finance studies. Unlike PSM, it does not discard observations, preserving sample size—a crucial advantage when dealing with limited data. However, weak instruments can lead to biased estimates and inflated standard errors in small sample settings.
This study examines the causal impact of internationalization and ESG ratings on financial performance in the food industry using the instrumental variable (IV) method to address potential endogeneity concerns. As shown at Panel A in Table 8, the results demonstrate that internationalization, measured by the number of overseas subsidiaries, has a significant positive effect on ROA, ROE, and ROS. Similarly, corporate governance scores exhibit a strong positive relationship with financial performance, reinforcing the role of transparent leadership and board effectiveness in driving firm profitability. To address endogeneity concerns, several robustness checks were conducted. First, the IV estimation strategy was validated through weak instrument tests, with high F-statistics (ranging from 5.74 to 52.18, all significant at p = 0.000) confirming instrument strength. Additionally, firm and year-fixed effects were included to control for unobserved heterogeneity and time-specific shocks, further strengthening the reliability of the findings. The results remain robust when alternative ESG components (environmental and social scores) are examined separately, although their financial impact is less consistent. These findings suggest that while internationalization and corporate governance have an immediate and direct effect on financial performance, environmental and social factors may require longer time horizons or regulatory incentives to yield measurable economic benefits. These insights provide valuable implications for corporate decision-makers and policymakers, emphasizing that strategic internationalization and governance improvements drive financial success in the food industry.
This study investigates the joint impact of internationalization and ESG ratings on financial performance in the food industry while addressing endogeneity concerns through an instrumental variable (IV) approach. The findings from Panel B of Table 8 confirm that internationalization, measured by the number of overseas subsidiaries, significantly enhances financial performance across ROA, ROE, and ROS. Furthermore, the interaction between internationalization and corporate governance scores positively impacts firm profitability, highlighting the role of transparent decision-making, strong oversight mechanisms, and investor protection in amplifying the benefits of global expansion. However, the interaction effects between internationalization and environmental or social scores do not consistently exhibit strong financial significance. This suggests that while sustainability initiatives are increasingly emphasized, their immediate financial benefits may be contingent on regulatory frameworks and industry-specific dynamics. To ensure robustness and mitigate endogeneity concerns, empirical tests were conducted. The IV estimation strategy effectively addresses simultaneity and omitted variable bias, confirming the causal relationship between internationalization, ESG ratings, and financial performance. The high F-statistics validate the strength and relevance of the instruments, mitigating concerns of weak instrument bias. Additionally, the inclusion of firm and year-fixed effects controls for unobserved heterogeneity and macroeconomic influences ensures the stability of the findings across model specifications. These results provide key implications for corporate decision-makers, investors, and policymakers, emphasizing that food companies seeking to maximize the financial benefits of internationalization should prioritize governance improvements. While ESG factors are growing in importance, policymakers may need to strengthen regulatory incentives to ensure that environmental and social sustainability efforts translate into financial success. Future research should further explore the long-term financial effects of ESG integration within internationalization strategies, particularly in response to evolving regulatory landscapes and shifting consumer preferences.

5. Managerial and Policy Implications

5.1. Managerial Implications

Given the well-documented positive relationship between ESG performance and key financial metrics such as return on assets (ROA), return on equity (ROE), and return on sales (ROS), managers must integrate ESG considerations into their core strategic frameworks. This requires defining clear, measurable ESG objectives that align with corporate goals while ensuring consistent monitoring and transparent reporting to stakeholders. The pronounced disparity in environmental performance across companies within the sector underscores the need for focused managerial interventions. Investments in renewable energy, waste reduction initiatives, and sustainable supply chain practices can significantly enhance environmental outcomes. Additionally, fostering collaborations with suppliers and local farmers to implement sustainable sourcing strategies offers a pathway to strengthening both environmental performance and stakeholder trust. Social responsibility, a critical yet often underutilized dimension within the food industry, demands greater managerial attention. Prioritizing initiatives that promote employee welfare, strengthen community engagement, and build consumer trust—such as adopting fair labor practices, conducting safety education programs, and contributing to local development projects—can enhance social performance. These efforts improve ESG scores and foster a strong reputation in both domestic and international markets, creating a competitive edge in the increasingly sustainability-conscious business environment.
Governance excellence strongly correlates with financial performance, highlighting the critical importance of robust governance frameworks. To foster trust among investors and stakeholders, managers must prioritize transparency, ethical leadership, and comprehensive risk management practices. Regular board evaluations and governance audits are essential to ensure sustained improvements and accountability over time. Expanding operations into high-growth markets, particularly in Hong Kong and Southeast Asia, represents a strategic opportunity for Taiwan’s food companies. Managers should focus on identifying markets that align with their competitive strengths while carefully balancing regulatory compliance and operational risks. Additionally, reducing dependence on tax havens is essential for promoting long-term sustainability and enhancing corporate reputation in the global marketplace. The COVID-19 pandemic has exposed vulnerabilities in supply chains and operational continuity, underscoring the urgent need for proactive risk management. To mitigate future disruptions, managers should prioritize investments in digitized supply chain systems, diversify supplier bases, and implement comprehensive contingency plans. Establishing crisis management teams dedicated to ensuring ESG continuity will enable companies to sustain performance and adapt to unforeseen challenges, reinforcing resilience and stakeholder confidence during periods of uncertainty.
Companies with strong ESG performance should proactively communicate their achievements to stakeholders, positioning these accomplishments as a key competitive differentiator. By showcasing sustainability efforts in marketing campaigns and investor communications, companies can attract eco-conscious consumers and responsible investors, driving market share growth and increased capital inflows. To maintain a competitive edge, it is imperative for managers to regularly benchmark their ESG performance against industry leaders, leveraging insights from advanced ESG analytics tools. Adopting data-driven approaches allows for accurate performance assessments, identifying critical gaps, and implementing timely corrective actions. These measures ensure that corporate strategies align with evolving global standards and stakeholder expectations, further strengthening the company’s position in a sustainability-driven marketplace.

5.2. Policy Implications

The significant disparities in environmental, social, and governance (ESG) performance among Taiwan’s food companies underscore an urgent need for targeted government interventions. Policymakers should implement sector-specific ESG standards supported by performance-based incentives such as tax reductions or grants for companies achieving measurable improvements. Mandating uniform ESG reporting standards across the food industry would enhance transparency and comparability, facilitating better benchmarking and greater accountability. Given the pronounced gap in environmental scores within the sector, prioritizing environmental sustainability initiatives is crucial. Policymakers should introduce subsidies to encourage the adoption of green technologies and provide support for resource-efficient practices, enabling companies to bridge the performance gap. Furthermore, fostering public-private partnerships can catalyze sharing sustainable innovations, ensuring smaller firms benefit from industry advancements. Such targeted interventions would elevate the overall ESG performance of Taiwan’s food sector and strengthen its global competitiveness in the sustainability-driven marketplace.
Effective governance is a cornerstone of long-term financial performance and ESG excellence. Policymakers should enforce robust corporate governance regulations, including mandatory disclosures on governance practices, diversity metrics, and ethical supply chain management. Establishing a national “ESG Governance Certification” program to recognize companies with exemplary practices could set a benchmark for others, driving higher governance standards across the industry. As Taiwan’s food companies expand internationally, policymakers must develop supportive frameworks to facilitate global operations. This includes introducing export promotion programs, streamlining regulatory procedures, and providing financial assistance to ease access to overseas markets. At the same time, addressing the reliance on tax havens, such as the Cayman Islands and the British Virgin Islands, is critical to ensuring compliance with international corporate governance norms and enhancing global credibility. The COVID-19 pandemic has underscored the vulnerabilities in ESG performance and operational continuity during global disruptions. This highlights the urgent need for a comprehensive, industry-wide resilience strategy. Policymakers should establish contingency plans that include supply chain stabilization funds, workforce management solutions, and incentives for adopting advanced technologies. These measures will enable Taiwan’s food industry to maintain operational sustainability and adaptability in future crises, ensuring its competitiveness and long-term viability.

6. Conclusions, Limitation and Future Research

6.1. Concluding Remarks

The intersection of international diversification and ESG performance represents a critical area of focus for firms striving for competitive advantages in today’s globalized and sustainability-driven economy. This study investigates how these two strategic dimensions collectively influence financial outcomes within the food industry, which faces unique challenges such as stringent regulatory requirements, environmental concerns, and supply chain complexities. Using data from 2015 to 2021, the analysis reveals that international diversification and ESG performance jointly exert a positive and statistically significant impact on key financial metrics, including return on assets (ROA), return on equity (ROE), and return on sales (ROS). Firms with broader global market operations and stronger ESG commitments consistently outperform their peers, demonstrating superior financial performance. This synergy highlights the dual capacity of international diversification and robust ESG integration to enhance operational efficiency, mitigate risks, and drive financial excellence. The findings underscore the strategic importance of aligning ESG principles with global expansion efforts. By harmonizing these approaches, firms in the food industry can achieve sustainable growth, create long-term value, and position themselves as leaders in both financial and sustainability performance. This study reaffirms the need for policymakers and corporate leaders to support and adopt strategies that integrate ESG priorities with international business growth to address global challenges while securing enduring success.

6.2. Limitations and Future Research

While the study provides valuable insights, several limitations must be addressed. The six-year dataset (2015–2021) may not fully capture long-term trends or cyclical dynamics, particularly given the disruptions of the COVID-19 pandemic. Future research should extend the time frame to validate the findings across different economic conditions and business cycles. Additionally, the focus on financial metrics like ROA, ROE, and ROS may overlook other critical dimensions of success, such as stakeholder engagement and brand reputation. Future studies could incorporate non-financial indicators to provide a more holistic view of corporate performance.
Regarding our sample size of 22 companies for estimation, this might raise concerns regarding the generalizability of the findings, the study’s methodological design mitigates this limitation by employing firm fixed effects (FFE), which control for unobserved, time-invariant firm characteristics. This approach ensures that estimated relationships are derived from within-firm variations rather than cross-sectional differences, thereby enhancing internal validity. Moreover, the sample selection is based on well-defined industry and firm-specific criteria, ensuring relevance to the research context. While a larger sample could improve external validity, prior studies in finance and accounting demonstrate that focused analyses on smaller yet highly relevant samples yield meaningful insights. Additionally, the econometric framework strengthens causal inference and mitigates biases associated with omitted variable concerns. As a result, despite the limited sample size, the study provides robust empirical evidence that can serve as a foundation for future research, expanding the analysis across broader datasets.
Moreover, the findings are industry-specific, and their generalizability to other sectors remains uncertain. Cross-industry comparisons could uncover sectoral nuances and provide a broader understanding of how ESG integration and international diversification influence outcomes in varying contexts. Finally, future research could explore the mediating and moderating roles of organizational culture, leadership quality, and market conditions to better understand the mechanisms driving the observed synergies.

Author Contributions

Conceptualization, S.-H.C., H.-C.H. and S.-T.L.; Methodology, S.-H.C., H.-C.H. and S.-T.L.; Software, S.-H.C., H.-C.H. and S.-T.L.; Validation, S.-H.C., H.-C.H. and S.-T.L.; Formal Analysis, S.-H.C. and S.-T.L.; Investigation, S.-H.C., H.-C.H. and S.-T.L.; Data Curation, S.-H.C. and S.-T.L.; Writing—original draft, S.-H.C. and S.-T.L.; Writing—Review & Editing, S.-H.C., H.-C.H. and S.-T.L.; Visualization, S.-H.C. and S.-T.L.; Supervision, H.-C.H. All authors have read and agreed to the published version of the manuscript.

Funding

The authors receive no funding for this research.

Institutional Review Board Statement

Not applicable.

Informed Consent Statement

Not applicable.

Data Availability Statement

Data will be made available on request.

Acknowledgments

We sincerely thank the three referees for their valuable comments, which significantly improved the exposition of this paper.

Conflicts of Interest

The authors declare that they have no known competing financial interests or personal relationships that could have appeared to influence the work reported in this paper.

References

  1. Gallo, A.; Operato, L.; Masoero, G.; Panzeri, A.; Rondoni, N. The integrated ESG approach to assess sustainability: An application in the food and beverage sector. In Proceedings of the Changeable, Agile, Reconfigurable and Virtual Production Conference and the World Mass Customization & Personalization Conference, Bologna, Italy, 20–23 June 2023; pp. 423–431. [Google Scholar]
  2. Pinedo-Lopez, J.; Baena-Navarro, R.E.; Carriazo-Regino, Y.; Urrea-Ortiz, A.C.; Reyes-Guevara, D.L. Sustainability strategies: A proposal for food sector SMEs, based on the integration of life cycle assessment and ESG strategies. J. Infrastruct. Policy Dev. 2024, 8, 1–30. [Google Scholar] [CrossRef]
  3. Lizovskaya, V.V.; Moldovan, A.A. CSR and ESG Transformation of Russian Brands: Cases of Food Industry Companies. In Finance, Economics, and Industry for Sustainable Development, Proceedings of the ECOOP ’87: European Conference on Object-Oriented Programming, Paris, France, 15–17 June 1987; Rumyantseva, A., Anyigba, H., Sintsova, E., Vasilenko, N.V., Eds.; Springer Proceedings in Business and Economics; Springer: Cham, Switzerland, 2024. [Google Scholar]
  4. Porechenkova, V.; Wang, Y. CSR Reporting Practices: A Cross-Time Comparison of the Food & Beverage and Energy Industries in the US Through Topic Modeling. Corp. Reput. Rev. 2024, 1–17. [Google Scholar]
  5. Paridhi; Ritika. Impact of ESG Disclosures on Corporate Financial Performance: An Industry-Specific Analysis of Indian Firms. Bus. Strategy Dev. 2025, 8, e70055. [Google Scholar] [CrossRef]
  6. Boiral, O.; Brotherton, M.C.; Talbot, D.; Guillaumie, L. Assessing and managing environmental, social, and governance risks in agri-food companies. Corp. Soc. Responsib. Environ. Manag. 2024, 31, 5690–5708. [Google Scholar] [CrossRef]
  7. Venkatraman, N.; Ramanujam, V. Measurement of business performance in strategy research: A comparison of approaches. Acad. Manag. Rev. 1986, 11, 801–814. [Google Scholar] [CrossRef]
  8. Yang, M. The Situation of Taiwan’s Agricultural Trade and Export Strategy; FFTC Agricultural Policy Platform: Taipei, Taiwan, 2017. [Google Scholar]
  9. Muhamad, N.; Adham, K.A.; Said, M.F.; Nasir, N.M. Exploring internationalization of Halal Taiwan: Analysis of Taiwan’s halal food products in Malaysia. Geogr. Malays. J. Soc. Space 2020, 16, 151–163. [Google Scholar] [CrossRef]
  10. Huang, T.Y.; Huatuco, L.H. Agri-Food Supply Chain for Mitigation of Volatilities in the Role of Intermediary: A Case Study of a Mushroom Trading Company in Taiwan. In Sustainable Design and Manufacturing; Springer Proceedings in Business and Economics; Springer: Crete, Greece, 2016; pp. 447–454. [Google Scholar]
  11. Huang, C.C.; Li, S.P.; Lai, J.C.; Chan, Y.K.; Hsieh, M.Y. Research on the international sustainable practice of the Taiwanese food and agricultural education law under the current global food security challenges. Foods 2023, 12, 2785. [Google Scholar] [CrossRef]
  12. Johanson, J.; Wiedersheim-Paul, F. Internationalization of the firm-Four Swedish cases. J. Manag. 1975, 12, 26–35. [Google Scholar] [CrossRef]
  13. Fallah Shayan, N.; Mohabbati-Kalejahi, N.; Alavi, S.; Zahed, M.A. Sustainable development goals (SDGs) as a framework for corporate social responsibility (CSR). Sustainability 2022, 14, 1222. [Google Scholar] [CrossRef]
  14. Kim, J.Y. Effects of CSR motives on authenticity and attitude in the food and beverage franchise sectors. Korean J. Franch. Manag. 2023, 14, 1–16. [Google Scholar]
  15. Zhang, C.; Zhang, Y.; Chen, Y. ESG Implementation, Investor Confidence and Listed Companies’ Performance. J. Environ. Econ. 2021, 6, 22–39. [Google Scholar]
  16. Sandberg, H.; Alnoor, A.; Tiberius, V. Environmental, social, and governance ratings and financial performance: Evidence from the European food industry. Bus. Strategy Environ. 2023, 32, 2471–2489. [Google Scholar] [CrossRef]
  17. Welch, L.S.; Luostarinen, R. Internationalization: Evolution of a concept. J. Gen. Manag. 1988, 14, 34–55. [Google Scholar] [CrossRef]
  18. Johanson, J.; Wiedersheim-Paul, F. The Internationalization of the Firm—Four Swedish Cases 1. In International Business; Routledge: Abingdon, UK, 2017; pp. 127–144. [Google Scholar]
  19. Grant, R.M. Multinationality and performance among British manufacturing companies. J. Int. Bus. Stud. 1987, 18, 79–89. [Google Scholar] [CrossRef]
  20. Hymer, S.H. The International Operations of National Firms, a Study of Direct Foreign Investment; Massachusetts Institute of Technology: Cambridge, MA, USA, 1960. [Google Scholar]
  21. Kogut, B. Designing global strategies: Comparative and competitive value-added chains. Sloan Manag. Rev. 1985, 26, 15. [Google Scholar]
  22. Bowen, H.P.; Baker, H.K.; Powell, G.E. Globalization and diversification strategy: A managerial perspective. Scand. J. Manag. 2015, 31, 25–39. [Google Scholar] [CrossRef]
  23. Filatotchev, I.; Piesse, J. R&D, internationalization and growth of newly listed firms: European evidence. J. Int. Bus. Stud. 2009, 40, 1260–1276. [Google Scholar]
  24. Lu, J.W.; Beamish, P.W. International diversification and firm performance: The S-curve hypothesis. Acad. Manag. J. 2004, 47, 598–609. [Google Scholar] [CrossRef]
  25. Knickerbocker, F.T. Oligopolistic reaction and multinational enterprise. Int. Exec. 1973, 15, 7–9. [Google Scholar] [CrossRef]
  26. Williamson, O. The Economic Institutions of Capitalism; Free Press: New York, NY, USA, 1985. [Google Scholar]
  27. Buckley, P.; Casson, M. The Future of the Multinational Enterprise; Homes & Meier: London, UK, 1976. [Google Scholar]
  28. Allen, L.; Pantzalis, C. Valuation of the operating flexibility of multinational corporations. J. Int. Bus. Stud. 1996, 27, 633–653. [Google Scholar] [CrossRef]
  29. Bobillo, A.M.; López-Iturriaga, F.; Tejerina-Gaite, F. Firm performance and international diversification: The internal and external competitive advantages. Int. Bus. Rev. 2010, 19, 607–618. [Google Scholar] [CrossRef]
  30. Pantzalis, C. Does location matter? An empirical analysis of geographic scope and MNC market valuation. J. Int. Bus. Stud. 2001, 32, 133–155. [Google Scholar] [CrossRef]
  31. Gande, A.; Schenzler, C.; Senbet, L.W. Valuation effects of global diversification. J. Int. Bus. Stud. 2009, 40, 1515–1532. [Google Scholar] [CrossRef]
  32. Sullivan, D. Measuring the degree of internationalization of a firm. J. Int. Bus. Stud. 1994, 25, 325–342. [Google Scholar] [CrossRef]
  33. Gomes, L.; Ramaswamy, K. An empirical examination of the form of the relationship between multinationality and performance. J. Int. Bus. Stud. 1999, 30, 173–187. [Google Scholar] [CrossRef]
  34. Falavigna, G.; Giannini, V.; Ippoliti, R. Internationalization and financial constraints: Opportunities, obstacles, and strategies. Int. Econ. 2024, 179, 100510. [Google Scholar] [CrossRef]
  35. Xu, Y.; Zhu, N. The Effect of Environmental, Social, and Governance (ESG) Performance on Corporate Financial Performance in China: Based on the Perspective of Innovation and Financial Constraints. Sustainability 2024, 16, 3329. [Google Scholar] [CrossRef]
  36. Schwens, C.; Zapkau, F.B.; Bierwerth, M.; Isidor, R.; Knight, G.; Kabst, R. International entrepreneurship: A meta-analysis on the internationalization and performance relationship. Entrep. Theory Pract. 2018, 42, 734–768. [Google Scholar] [CrossRef]
  37. Nguyen, Q.T.K.; Kim, S. The multinationality and performance relationship: Revisiting the literature and exploring the implications. Int. Bus. Rev. 2020, 29, 101670. [Google Scholar] [CrossRef]
  38. Anwar, M.; Li, S.; Al-Omush, A.; Al-Nimer, M. SMEs’ internationalization: Mapping the field through finance, ITC, and social ties. Sustainability 2023, 15, 3162. [Google Scholar] [CrossRef]
  39. Lindner, T.; Klein, F.; Schmidt, S. The effect of internationalization on firm capital structure: A meta-analysis and exploration of institutional contingencies. Int. Bus. Rev. 2018, 27, 1239–1252. [Google Scholar] [CrossRef]
  40. Schmuck, A.; Lagerström, K.; Sallis, J.E. Patterns of inconsistency: A literature review of empirical studies on the multinationality–performance relationship. Crit. Perspect. Int. Bus. 2022, 18, 123–145. [Google Scholar] [CrossRef]
  41. Jiang, G.; Kotabe, M.; Zhang, F.; Hao, A.; Paul, J.; Wang, C. The determinants and performance of early internationalizing firms: A literature review and research agenda. Int. Bus. Rev. 2020, 29, 101662. [Google Scholar] [CrossRef]
  42. Zonta, T.C.; Amal, M. Internationalization and innovation: The case of a born global from Brazil. Int. J. Emerg. Mark. 2018, 13, 137–155. [Google Scholar] [CrossRef]
  43. Calheiros-Lobo, N.; Vasconcelos Ferreira, J.; Au-Yong-Oliveira, M. SME internationalization and export performance: A systematic review with bibliometric analysis. Sustainability 2023, 15, 8473. [Google Scholar] [CrossRef]
  44. Chen, Y.C.; Hung, M.; Wang, Y. The effect of mandatory CSR disclosure on firm profitability and social externalities: Evidence from China. J. Account. Econ. 2018, 65, 169–190. [Google Scholar] [CrossRef]
  45. Chen, Z.; Keefe, M.O.C. Rookie directors and firm performance: Evidence from China. J. Corp. Financ. 2020, 60, 101511. [Google Scholar] [CrossRef]
  46. Kuang, C.; Liu, Z.; Zhu, W. Need for speed: High-speed rail and firm performance. J. Corp. Financ. 2021, 66, 101830. [Google Scholar] [CrossRef]
  47. Liu, Y.; Wei, Z.; Xie, F. Do women directorsimprove firm performance in China. J. Corp. Financ. 2014, 28, 169–184. [Google Scholar] [CrossRef]
  48. Sun, R.; Zou, G. Political connection, CEO gender, and firm performance. J. Corp. Financ. 2021, 71, 101918. [Google Scholar] [CrossRef]
  49. Breuer, M.; DeHaan, E.D. Using and interpreting fixed effects models. J. Account. Res. 2024, 62, 1183–1226. [Google Scholar] [CrossRef]
  50. Greene, W.H. Econometric Analysis, 7th ed.; Pearson Education: London, UK, 2012. [Google Scholar]
  51. Adams, R.B.; Almeida, H.; Ferreira, D. Understanding the relationship between founder-CEOs and firm performance. J. Financ. Econ. 2009, 92, 197–221. [Google Scholar] [CrossRef]
  52. Cai, J.; Liu, Y.; Qian, Y. Corporate social responsibility and firm value: A comparative study of U.S. and European firms. J. Bus. Ethics 2016, 136, 687–707. [Google Scholar]
Figure 1. Comparison of ESG overall and components rating scores by various industries (2015–2021). (a) ESG overall rating scores, (b) Environment (E) rating scores, (c) Social (S) rating scores, (d) Corporate governance (G) rating scores.
Sustainability 17 02580 g001
Figure 2. Trend of ESG overall and components rating scores in food industry (2015–2021). (a) ESG overall rating scores, (b) Environment (E) rating scores, (c) Social (S) rating scores, (d) Corporate governance (G) rating scores.
Sustainability 17 02580 g002aSustainability 17 02580 g002b
Figure 3. Distribution of the number of overseas subsidiaries in food companies from 2011 to 2021.
Sustainability 17 02580 g003
Figure 4. Relationship between ROA and ESG overall and components rating scores in food companies from 2015 to 2021. (a) ESG overall rating scores, (b) Environment (E) rating scores, (c) Social (S) rating scores, (d) Corporate governance (G) rating scores.
Sustainability 17 02580 g004
Figure 5. Relationship between ROE and ESG overall and components rating scores in food companies from 2015 to 2021. (a) ESG overall rating scores, (b) Environment (E) rating scores, (c) Social (S) rating scores, (d) Corporate governance (G) rating scores.
Sustainability 17 02580 g005
Figure 6. Relationship between ROS and ESG overall and components rating scores in food companies from 2015 to 2021. (a) ESG overall rating scores, (b) Environment (E) rating scores, (c) Social (S) rating scores, (d) Corporate governance (G) rating scores.
Sustainability 17 02580 g006
Figure 7. Relationship between the number of overseas subsidiaries in food companies and financial performance from 2015 to 2021. (a) ROA, (b) ROE, (c) ROS.
Sustainability 17 02580 g007
Table 1. ESG component indicators.
PillarsEnvironment (S)Society (S)Governance (G)
Topics
(16 items)
Greenhouse Gas EmissionsHuman Rights and Community RelationsBusiness Model and Level of Innovation
Energy ManagementData SecurityLeadership Management
Water and Wastewater ManagementProduct Quality and SafetyControl and Seats
Waste and Toxic Substances ManagementEmployee Information StatisticsThe Equitable Treatment of Shareholders
Ecological ImpactEmployee Health and SafetyInformation Transparency of Corporate Governance
Employee Diversity
Source: TEJ database (www.tejwin.com (accessed on 31 May 2022)).
Table 2. Descriptive Statistics.
VariablesObservationsMeanStandard Deviation10%
Percentile
Median90%
Percentile
Relative Importance
Panel A: Company operating performance
  Return on total assets (ROA) (%)1546.6185.9021.1306.02514.150132
  Return on total equity (ROE) (%)15410.5649.8741.22010.08521.870211
  Total return on sales (ROS) (%)15424.56412.8109.21026.28540.020491
Panel B: International diversification
    Number of overseas subsidiaries1547.34412.9311.0002.00014.000147
Panel C: Firm’s ESG rating performance
  ESG overall scores15460.0098.27948.49061.06569.0801200
  Environmental scores15459.94413.42338.15061.97078.2001199
  Social scores15464.11211.20248.43066.63077.5501282
  Corporate governance scores15455.1649.75341.09056.27566.9701103
Panel D: Firm’s level controlling variables
Research and development expense rate (%)1540.5870.6930.0000.3151.66012
Debt ratio (%)15440.89016.53219.15040.49563.540818
Ln (total assets)1548.6780.8237.5758.5729.570174
Panel E: ANOVA testing
VariablesESG-ranked groups ANOVA
Low (30%)Medium (40%)High (30%)F-statstics(p-value)
ESG < 58.358.3 < = ESG < 63.51ESG < = 63.51
Return on total assets (ROA) (%)5.6157.0987.159 1.140(0.323)
Return on total equity (ROE) (%)9.07911.27711.362 0.890(0.414)
Total return on sales (ROS) (%)22.66427.33223.800 1.850(0.161)
Number of overseas subsidiaries3.6737.66010.712 4.030 **(0.020)
Research and development expense rate (%)0.6640.5250.570 0.530(0.588)
Debt ratio (%)40.80942.16539.746 0.270(0.763)
Ln (total assets)8.3488.5339.146 16.000 ***(0.000)
Note: This table is compiled by authors. Relative Importance is calculated by dividing the arithmetic mean by 5 and multiplying by 100 to clarify the importance of each variable in digital transformation among different companies. ** and *** stand for the statistical significance at the 1 percent and 5 percent levels, respectively.
Table 3. ESG overall and component rating scores for sample food companies.
CompanyESG Overall ScoresEnvironment Scores Social ScoresGovernance Scores
Jiage61.76769.32166.55747.739
Nanqiao56.69754.52660.83153.566
CP Group60.48158.89362.34659.697
Tairoun49.67342.17746.69661.289
Wei Chuan67.94766.64170.63767.919
Ve Wong61.13961.93162.77958.177
Greatwall59.35157.68666.38751.924
TTET66.60063.55070.59464.559
Oceanic46.66338.36752.05653.063
Ten Ren61.96058.07363.77663.613
Hunya58.26766.02153.24356.789
AGV60.32761.68969.59946.866
Taisun57.67162.42755.48755.593
Fwusow68.00374.49375.15052.001
FOPCO62.58364.20173.23447.066
UNI74.40481.46383.38156.53
LHIHC64.79763.64776.03051.38
Lian Hwa Foods58.43760.39156.45159.006
Taiyen64.84446.21476.29670.479
Shin Tai Industry40.00036.14147.15334.684
Sunjuice51.43751.71445.12459.357
HeySong67.14979.20776.66442.313
Mean60.009 *59.944 *64.112 *55.164 *
p-value (1%)(0.0000)(0.0000)(0.0000)(0.0000)
Source: This table is compiled by authors. * indicates the significance at the level of statistical significance (p-value) at the 1% level.
Table 4. Distribution of overseas subsidiaries in the food industry by country (2015–2021).
Overseas Subsidiary CountriesNumberPercentage (%)Overseas Subsidiary CountriesNumberPercentage (%)
Brunei60.40Philippines302.01
Switzerland70.47Malaysia302.01
Myanmar70.47USA392.62
Spain70.47Singapore573.83
India90.60Thailand684.56
South Korea110.74Vietnam966.44
Panama110.74Samoa1016.78
Cambodia130.87cayman islands20813.96
Japan201.34British Virgin Islands34823.4
Indonesia251.68Hong Kong39726.6
Source: This table is compiled by authors.
Table 5. The impact of firm’s internationalization on financial performance.
VariablesFirm’s Financial Performance Measures
ROA (%)ROE (%)ROS (%)
Number of overseas subsidiaries0.070 ***0.166 ***0.221 ***
(3.332)(3.955)(6.024)
Research and development expense rate (%)0.8782.023 *7.204 ***
(1.618)(1.911)(15.288)
Debt ratio (%)−0.077 ***−0.008−0.155 ***
(−3.849)(−0.210)(−7.317)
Ln (total assets)1.783 ***3.271 ***−6.942 ***
(4.651)(5.765)(−12.700)
Constant−6.962 **−20.082 ***85.692 ***
(−2.052)(−3.926)(16.644)
Firm Fixed EffectYesYesYes
Year Fixed EffectYesYesYes
Observations154154154
χ236.826 ***44.893 ***1047.229 ***
Note: The values in ( ) are t-statistics; *, **, and *** represent statistical significance at the trust level of 10%, 5%, and 1%, respectively.
Table 6. The impact of ESG performance on financial performance.
VariablesFirm’s Financial Performance Measures
ROA (%) ROE (%)ROA (%)
Panel A: Firm’s ESG overall scores
ESG overall scores0.074 **0.164 ***0.496 ***
(2.035)(2.704)(11.043)
Research and development expense rate (%)0.2801.0176.735 ***
(0.554)(0.998)(20.321)
Debt ratio (%)−0.048 **0.056−0.123 ***
(−2.569)(1.552)(−7.354)
Ln (total assets)1.289 ***2.038 ***−9.609 ***
(3.075)(3.269)(−16.959)
constant−7.214 **−19.490 ***79.395 ***
(−2.104)(−3.714)(14.781)
Firm Fixed EffectYesYesYes
Year Fixed EffectYesYesYes
Observations154154154
χ229.595 ***34.238 ***1421.277 ***
Panel B: Firm’s Environment rating scores
Environment rating scores0.042 *0.109 ***0.188 ***
(1.737)(2.596)(5.883)
Research and development expense rate (%)0.4301.4547.248 ***
(0.848)(1.495)(13.681)
Debt ratio (%)−0.052 ***0.043−0.112 ***
(−2.767)(1.188)(−5.206)
Ln (total assets)1.384 ***2.055 ***−8.876 ***
(3.378)(3.369)(−16.405)
constant−6.079 *−16.176 ***90.547 ***
(−1.769)(−3.091)(17.038)
Firm Fixed EffectYesYesYes
Year Fixed EffectYesYesYes
Observations154154154
χ227.801 ***31.089 ***772.180 ***
Panel C: Firm’s Social rating scores
Social rating scores−0.022−0.0170.336 ***
(−0.722)(−0.312)(11.317)
Research and development expense rate (%)0.2961.1335.905 ***
(0.604)(1.161)(15.888)
Debt ratio (%)−0.048 ***0.063 *−0.108 ***
(−2.734)(1.836)(−6.555)
Ln (total assets)1.918 ***3.140 ***−9.837 ***
(4.320)(4.526)(−20.324)
constant−6.843 **−18.751 ***89.456 ***
(−1.965)(−3.498)(21.049)
Firm Fixed EffectYesYesYes
Year Fixed EffectYesYesYes
Observations154154154
χ231.075 ***29.935 ***1524.893 ***
Panel D: Firm’s Governance rating scores
Governance rating scores0.115 ***0.182 ***0.077 **
(3.888)(3.838)(2.088)
Research and development expense rate (%)0.0650.6397.407 ***
(0.130)(0.637)(15.943)
Debt ratio (%)−0.053 ***0.056 *−0.105 ***
(−2.999)(1.714)(−5.601)
Ln (total assets)1.564 ***2.721 ***−8.333 ***
(4.304)(4.962)(−14.550)
constant−10.957 ***−25.090 ***92.642 ***
(−3.171)(−4.717)(17.478)
Firm Fixed EffectYesYesYes
Year Fixed EffectYesYesYes
Observations154154154
χ246.210 ***46.423 ***1090.562 ***
Note: The values in ( ) are t-statistics; *, **, and *** represent statistical significance at the trust level of 10%, 5%, and 1%, respectively.
Table 7. The joint impact of internationalization and ESG rating scores on financial performance.
VariablesFirm’s Financial Performance Measures
ROA (%)ROE (%)ROA (%)
Panel A: Firm’s ESG overall scores
Number of overseas subsidiaries * ESG overall scores0.093 ***0.236 ***0.317 ***
(3.125)(3.898)(7.988)
Research and development expense rate (%)0.8061.932 *7.327 ***
(1.486)(1.825)(15.689)
Debt ratio (%)−0.075 ***−0.005−0.158 ***
(−3.724)(−0.137)(−7.517)
Ln (total assets)1.746 ***3.195 ***−7.062 ***
(4.570)(5.655)(−13.309)
Constant−6.621 *−19.359 ***86.942 ***
(−1.959)(−3.800)(17.272)
Firm Fixed EffectYesYesYes
Year Fixed EffectYesYesYes
Observations154154154
χ235.790 ***44.489 ***1058.401 ***
Panel B: Firm’s Environment rating scores
Number of overseas subsidiaries * Environment rating scores0.080 ***0.211 ***0.294 ***
(2.826)(3.599)(9.538)
Research and development expense rate (%)0.7611.883 *7.387 ***
(1.403)(1.780)(15.753)
Debt ratio (%)−0.072 ***−0.001−0.160 ***
(−3.624)(−0.023)(−7.599)
Ln (total assets)1.726 ***3.144 ***−7.106 ***
(4.517)(5.566)(−13.514)
Constant−6.457 *−18.958 ***87.426 ***
(−1.909)(−3.722)(17.479)
Firm Fixed EffectYesYesYes
Year Fixed EffectYesYesYes
Observations154154154
χ234.488 ***42.274 ***1067.359 ***
Panel C: Firm’s Social rating scores
Number of overseas subsidiaries * Social rating scores0.082 ***0.208 ***0.277 ***
(3.162)(3.907)(7.446)
Research and development expense rate (%)0.8001.929 *7.309 ***
(1.482)(1.823)(15.709)
Debt ratio (%)−0.073 ***−0.002−0.157 ***
(−3.686)(−0.065)(−7.448)
Ln (total assets)1.747 ***3.192 ***−7.067 ***
(4.568)(5.641)(−13.258)
Constant−6.659 **−19.402 ***86.957 ***
(−1.968)(−3.803)(17.216)
Year Fixed EffectYesYesYes
Observations154154154
χ235.834 ***44.809 ***1054.973 ***
Panel D: Firm’s Governance rating scores
Number of overseas subsidiaries * Governance rating scores0.130 ***0.312 ***0.419 ***
(3.416)(4.143)(7.141)
Research and development expense rate (%)0.8631.966 *7.276 ***
(1.588)(1.855)(15.551)
Debt ratio (%)−0.079 ***−0.013−0.158 ***
(−3.905)(−0.345)(−7.473)
Ln (total assets)1.777 ***3.267 ***−7.039 ***
(4.657)(5.788)(−13.207)
Constant−6.839 **−19.848 ***86.649 ***
(−2.027)(−3.900)(17.166)
Firm Fixed EffectYesYesYes
Year Fixed EffectYesYesYes
Observations154154154
χ237.488 ***46.044 ***1055.602 ***
Note: The values in ( ) are t-statistics; *, **, and *** represent statistical significance at the trust level of 10%, 5%, and 1%, respectively.
Table 8. Endogeneity tests: Instrumental variable method.
Panel A. Direct impact of internationalization and ESG rating scores on financial performance of food company using Instrumental variable method
VariablesFinancial Performance Measures Financial Performance Measures Financial Performance Measures Financial Performance Measures Financial Performance Measures
ROAROEROSROAROEROSROAROEROSROAROEROSROAROEROS
Model (1)Model (2)Model (3)Model (1)Model (2)Model (3)Model (1)Model (2)Model (3)Model (1)Model (2)Model (3)Model (1)Model (2)Model (3)
Constant−39.600 ***−65.085 ***95.947 *** −18.827 ***−39.883 ***85.438 *** −16.021 ***−32.316 ***106.310 *** −20.966 ***−55.631 ***101.953 *** −47.450 **−101.398 **48.329
(−2.674)(−2.975)(8.808) (−2.935)(−3.504)(9.333) (−2.924)(−3.136)(7.242) (−2.632)(−2.741)(12.000) (−2.129)(−2.157)(1.168)
Number of overseas subsidiaries0.881 ***1.503 ***0.434 **
(2.837)(3.637)(2.295)
ESG overall scores 0.290 **0.715 ***0.810 ***
(2.075)(2.876)(4.052)
Environmental scores 0.263 ***0.591 ***0.469 **
(3.121)(3.725)(1.978)
Social scores 0.388 ***1.021 ***0.243 **
(2.885)(2.918)(2.286)
Corporate governance scores 0.604 *1.142 *1.233 *
(1.826)(1.772)(1.685)
Research and development expense rate (%)2.859 **4.831 **6.441 *** 1.1341.8505.936 *** −0.2250.5284.401 ** −1.731−2.5165.628 *** 0.0601.2461.303
(2.241)(2.207)(5.266) (1.649)(1.499)(6.036) (−0.273)(0.342)(2.234) (−1.501)(−1.016)(5.519) (0.035)(0.360)(0.496)
debt_ratio−0.248 ***−0.371 ***−0.223 *** −0.110 ***−0.076−0.186 *** −0.112 ***−0.097−0.179 *** −0.132 ***−0.221 ***−0.149 *** −0.114 *−0.158−0.026
(−4.287)(−3.601)(−3.731) (−3.717)(−1.412)(−4.378) (−3.506)(−1.623)(−3.098) (−3.895)(−3.190)(−3.582) (−1.892)(−1.298)(−0.252)
Ln (Total assets)5.554 ***8.865 ***−7.980 *** 1.366 *1.099−12.139 *** 1.267 *1.182−12.130 *** 0.9471.101−10.393 *** 2.888 *6.258 *−10.541 ***
(3.508)(3.728)(−6.665) (1.753)(0.794)(−10.909) (1.874)(0.930)(−5.887) (0.941)(0.463)(−9.984) (1.880)(1.866)(−4.592)
Firm fixed effectYesYesYes YesYesYes YesYesYes YesYesYes YesYesYes
Year fixed effectYesYesYes YesYesYes YesYesYes YesYesYes YesYesYes
Observations154154154 154154154 154154154 154154154 154154154
Adjuested R20.0680.0880.491 0.1430.0710.613 0.1250.0770.510 0.1390.0600.606 0.1330.0750.269
F-statistics6.978 ***5.744 ***30.299 *** 8.893 ***5.854 ***52.185 *** 9.503 ***6.641 ***12.248 *** 9.504 ***7.074 ***42.118 *** 5.970 ***5.048 ***7.519 ***
(p-value)(0.000)(0.000)(0.000) (0.000)(0.000)(0.000) (0.000)(0.000)(0.000) (0.000)(0.000)(0.000) (0.000)(0.000)(0.000)
Panel B. The joint impact of internationalization and ESG rating scores on financial performance of food company using Instrumental variable method
VariablesFinancial Performance Measures Financial Performance Measures Financial Performance Measures Financial Performance Measures
ROAROEROSROAROEROSROAROEROSROAROEROS
Model (1)Model (2)Model (3)Model (1)Model (2)Model (3)Model (1)Model (2)Model (3)Model (1)Model (2)Model (3)
Constant −39.248 **−64.090 ***96.835 *** −36.404 **−62.976 **96.558 *** −30.408 ***−50.832 ***99.328 *** −26.041 ***−49.058 ***98.616 ***
(−2.514)(−2.751)(8.717) (−2.269)(−2.488)(7.678) (−2.693)(−2.954)(11.478) (−3.198)(−3.412)(11.357)
Number of overseas subsidiaries × ESG overall scores 1.308 ***2.237 ***0.666 **
(2.639)(3.387)(2.355)
Number of overseas subsidiaries × Environmental scores 1.270 **2.248 ***0.786 **
(2.444)(3.090)(2.429)
Number of overseas subsidiaries × Social scores 0.930 ***1.612 ***0.387 **
(3.455)(4.265)(2.165)
Number of overseas subsidiaries × Corporate governance scores 1.111 ***2.061 ***0.532 **
(4.801)(5.043)(2.156)
Research and development expense rate (%) 2.905 **4.816 **6.276 *** 3.042 **4.914 **5.867 *** 2.934 **5.269 **7.210 *** 2.804 ***5.103 ***7.158 ***
(2.200)(2.107)(5.037) (2.191)(2.022)(4.376) (2.438)(2.574)(6.463) (2.732)(2.816)(6.540)
Debt ratio (%) −0.244 ***−0.373 ***−0.224 *** −0.246 ***−0.383 ***−0.232 *** −0.246 ***−0.345 ***−0.212 *** −0.251 ***−0.330 ***−0.213 ***
(−4.203)(−3.566)(−3.766) (−4.097)(−3.537)(−3.746) (−4.371)(−3.457)(−3.774) (−4.762)(−3.540)(−3.774)
Ln (total assets) 5.515 ***8.794 ***−8.066 *** 5.182 ***8.657 ***−8.053 *** 4.659 ***7.358 ***−8.339 *** 4.241 ***7.122 ***−8.264 ***
(3.309)(3.478)(−6.612) (3.023)(3.163)(−5.864) (3.773)(3.877)(−8.688) (4.688)(4.458)(−8.565)
Firm fixed effect YesYesYes YesYesYes YesYesYes YesYesYes
Year fixed effect YesYesYes YesYesYes YesYesYes YesYesYes
Observations 154154154 154154154 154154154 154154154
Adjusted R2 0.0600.0840.487 0.0520.0790.434 0.0750.0890.543 0.1020.1000.545
F-statistics 6.785 ***5.451 ***28.017 *** 6.525 ***5.147 ***21.695 *** 7.291 ***6.473 ***43.789 *** 9.485 ***8.286 ***44.738 ***
(p-value) (0.000)(0.000)(0.000) (0.000)(0.000)(0.000) (0.000)(0.000)(0.000) (0.000)(0.000)(0.000)
Note: The robust t-statistics are reported in parentheses. ***, **, and * indicate statistical significance at the 1%, 5%, and 10% levels, respectively.
Disclaimer/Publisher’s Note: The statements, opinions and data contained in all publications are solely those of the individual author(s) and contributor(s) and not of MDPI and/or the editor(s). MDPI and/or the editor(s) disclaim responsibility for any injury to people or property resulting from any ideas, methods, instructions or products referred to in the content.

