1. Introduction
Activated carbon (AC) has been known for over a hundred years as a vital material used across various industries. Its broad application stems from its unique structural properties, such as its extensive surface area and functional groups, which can be tailored based on the raw materials, activation agents, and production techniques employed [
1,
2,
3]. AC is indispensable in refining processes due to its properties. AC is indispensable in refining processes and is used as a support for enzymes in enzyme immobilization due to its properties [
4]. In recent years, there has been a significant shift toward using sustainable and economical sources to produce activated carbon. Agricultural byproducts such as peanut shells [
5], bamboo [
6], orange peel [
7], olive [
1,
8], rice straw [
9], chicken manure [
10], and other biomass materials have become increasingly alternatives for this purpose. Also, agro-industrial wastes were examined for the synthesis of activated carbon [
11]. This approach reduces production costs and offers a greener alternative to conventional methods, making AC production more accessible and economically viable. This approach reduces production costs by utilizing feedstocks and offers an alternative to conventional fossil-derived activated carbons. While chemical activation with basic agents such as KOH requires high temperatures and thorough washing to remove residual compounds, it also enhances pore development and achieves higher surface areas compared to acidic activation methods such as H
3PO
4. The choice of activation method depends on the intended application, with KOH being particularly advantageous for microporous carbon structures used in gas adsorption and energy storage applications.
Biochar, produced by the thermochemical pyrolysis of organic biomass, has been evaluated as a valuable precursor in the development of activated carbon. As a carbon-rich material, biochar is increasingly recognized for its capacity to serve as a long-term carbon storage solution, helping to mitigate greenhouse gas emissions [
12], and has the potential to be used as a soil amendment, contributing to carbon sequestration while enhancing soil health. Biochar is derived from a diverse range of biomass sources, including agricultural residues (such as wheat straw, bagasse, and rice husks), woody materials, food waste, and animal manure [
13]. Pyrolysis is a widely employed method for converting agricultural residues into biochar, offering a sustainable and profitable approach to producing activated carbon.
Pyrolysis is used to convert agricultural residues into biochar to make a sustainable and profitable source material for the production of activated carbon.
Biochar’s properties can be tailored through modification techniques, enhancing its suitability for various applications and contributing to its environmental benefits. Converting biomass into biochar has gained momentum due to its ability to reduce CO
2 emissions during production [
14,
15]. Primarily, biochar was viewed as a source of renewable energy, used for generating heat and powering various processes. However, its applications have expanded in energy production [
16]. Nowadays, biochar plays a crucial role in a range of sectors, including water treatment and air purification, as well as serving as a sustainable fuel alternative for cooking. Besides these applications, biochar provides environmental advantages like minimizing nitrate leaching into soils and effectively capturing both organic and inorganic pollutants [
17,
18,
19]. It has also been demonstrated to lower methane and carbon emissions and offers an efficient means of removing heavy metals from stormwater runoff, further enhancing its environmental value [
13].
The utility of activated carbon extends to numerous fields, including but not limited to the purification of liquids and gases, protection against hazardous substances, the recovery of solvents, and acting as a support material in catalytic processes [
10]. Also, AC is increasingly being investigated for advanced applications such as energy storage [
20], biomedical devices [
21], and environmental remediation due to its high adsorptive capacity, which is directly linked to its internal porosity and surface characteristics. The development of high-performance activated carbon depends on several critical factors, such as the choice of precursor material, the activation temperature, and the duration of the activation process [
22]. Despite the availability of low-cost biomass sources, the complexity of commercial production processes can be a barrier, especially in regions with limited technological capabilities [
23]. Focusing on locally available biomass can potentially address these challenges and promote the wider adoption of AC technologies.
Activated carbon can be produced through two methods: chemical and physical activation. Chemical activation involves treating the raw material with chemical agents at relatively low temperatures, simultaneously carbonizing and activating the material to enhance its pore structure and surface area, while physical activation is a two-step process, where the material is first carbonized and then activated using gases like steam or CO
2 at higher temperatures [
24,
25,
26]. Chemical activation is preferred due to its efficiency in achieving activated carbons with higher surface areas, better-developed pore structures, and higher carbon yields. This method also operates at lower temperatures and within shorter timeframes, which can be advantageous regarding energy consumption and production efficiency. Commonly utilized chemicals in this process include ZnCl
2 [
27,
28], KOH [
29], H
3PO
4 [
30,
31], NaOH [
32], Na
2CO
3 [
33], H
2SO
4 [
34], and K
2CO
3 [
35].
Among these, potassium hydroxide (KOH) is widely regarded in scientific literature as an exceptionally effective activating agent in producing activated carbon. Its use is particularly favored due to its ability to produce materials with significantly higher surface areas compared to other activation methods and highly microporous structures [
9,
23]. These characteristics are important for applications requiring superior adsorption capacities and enhanced properties of electrochemical, making KOH-activated carbon a preferred material in fields such as energy storage and environmental remediation.
One of the key advantages of KOH is its role in promoting the formation of hydroxyl (-OH) functional groups on the surface of activated carbon. These functional groups contribute to the overall reactivity and adsorption efficiency of the material. Compared to other chemical activating agents, KOH stands out because of its effectiveness in creating a well-developed pore structure [
36]. Among various chemical activating agents, KOH is particularly effective in producing high-surface-area activated carbons with a well-developed microporous structure. While other activators such as H
3PO
4 and ZnCl
2 also promote porosity, KOH activation is known for its ability to generate a higher proportion of micropores, making it suitable for applications requiring high adsorption capacities, such as gas storage and supercapacitors [
36]. This effectiveness is due to the capability of potassium to form intercalation compounds with carbon, which facilitates the expansion and opening of the carbon structure during activation. Moreover, KOH undergoes a series of chemical reactions that further enhance pore formation. Specifically, KOH is partially converted to potassium oxide (K
2O), which, under the presence of carbon, reduces to potassium (K). This reduction process is accompanied by carbon gasification, which results in the release of CO
2 and the creation of additional pores within the carbon matrix [
36].
The cumulative influence of these reactions is the development of a highly porous and reactive activated carbon material, with properties that are often superior to those produced using other activating agents. These reactions collectively contribute to the development of highly porous and chemically reactive activated carbon. While phosphoric acid (H
3PO
4) activation is known for producing high yields and facilitating mild activation conditions, KOH activation is particularly effective in generating extensive microporosity and higher specific surface areas. This makes KOH-activated carbons highly suitable for applications in gas adsorption, supercapacitors, and energy storage, where micropore structure plays a crucial role [
37].
In this study, the conversion of biochar derived from biomass into high-performance activated carbon through chemical activation using potassium hydroxide (KOH) under a nitrogen (N2) atmosphere is investigated. This research aims to analyze the impact of KOH activation on the physical and chemical properties of biochar, including surface area, porosity, and chemical composition, to optimize the production of activated carbon with improved adsorption capabilities and to help develop sustainable, efficient, and cost-effective methods for producing activated carbon from renewable biomass sources.
2. Materials and Methods
2.1. Materials
The biochar used in the experiments was sourced from an Austrian company, Sonnenerde GmbH, Riedlingsdorf, Austria. The primary feedstock for its production consisted of woody residues from composting, along with pre-dried sunflower seed shells that had a moisture content of around 10%. The pyrolysis process for this feedstock was conducted using a “T-cracker”-type autothermal auger reactor produced by NGE, operating at temperatures exceeding 800 °C.
2.2. Determination of Particle Size Distribution
The particle size of bulk materials significantly affects various process-specific properties, necessitating the measurement of average particle size and distribution width. Laser diffraction (LD) particle size analysis was employed for biochar characterization, with samples presented as aerodispersion.
2.2.1. Sample Preparation
The biochar sample, stored dry and protected from sunlight, was gently shaken for homogeneity, and a representative 30 g mixed sample was extracted. This sample was divided into three aliquots of approximately 10 g each: the first for instrument parameter adjustment and the second and third for particle size analysis.
2.2.2. Instrumental Analysis
LD analysis used a Malvern Instruments from Malvern, UK, Mastersizer 2000 with a He-Ne laser (633 nm) and a blue solid-state light source (466 nm). The multi-zone detector provided a grain size spectrum from 0.02 µm to 2000 µm across 50 size classes. A Scirocco 2000 dry dispersion unit was employed for sample dispersion.
2.2.3. Measurement Procedure
Each aliquot was evenly spread as a triangular mound on a sample tray and processed with the following parameters: 8 mm dispersion slit width, 2 bar dispersion air pressure, and 50% tray vibration intensity. These settings ensured consistent sample flow. The LD analysis for each sample involved three serial measurements, each consisting of 12,000 individual measurements over 12 s (i.e., device standard for one series).
2.2.4. LD Particle Size Analysis
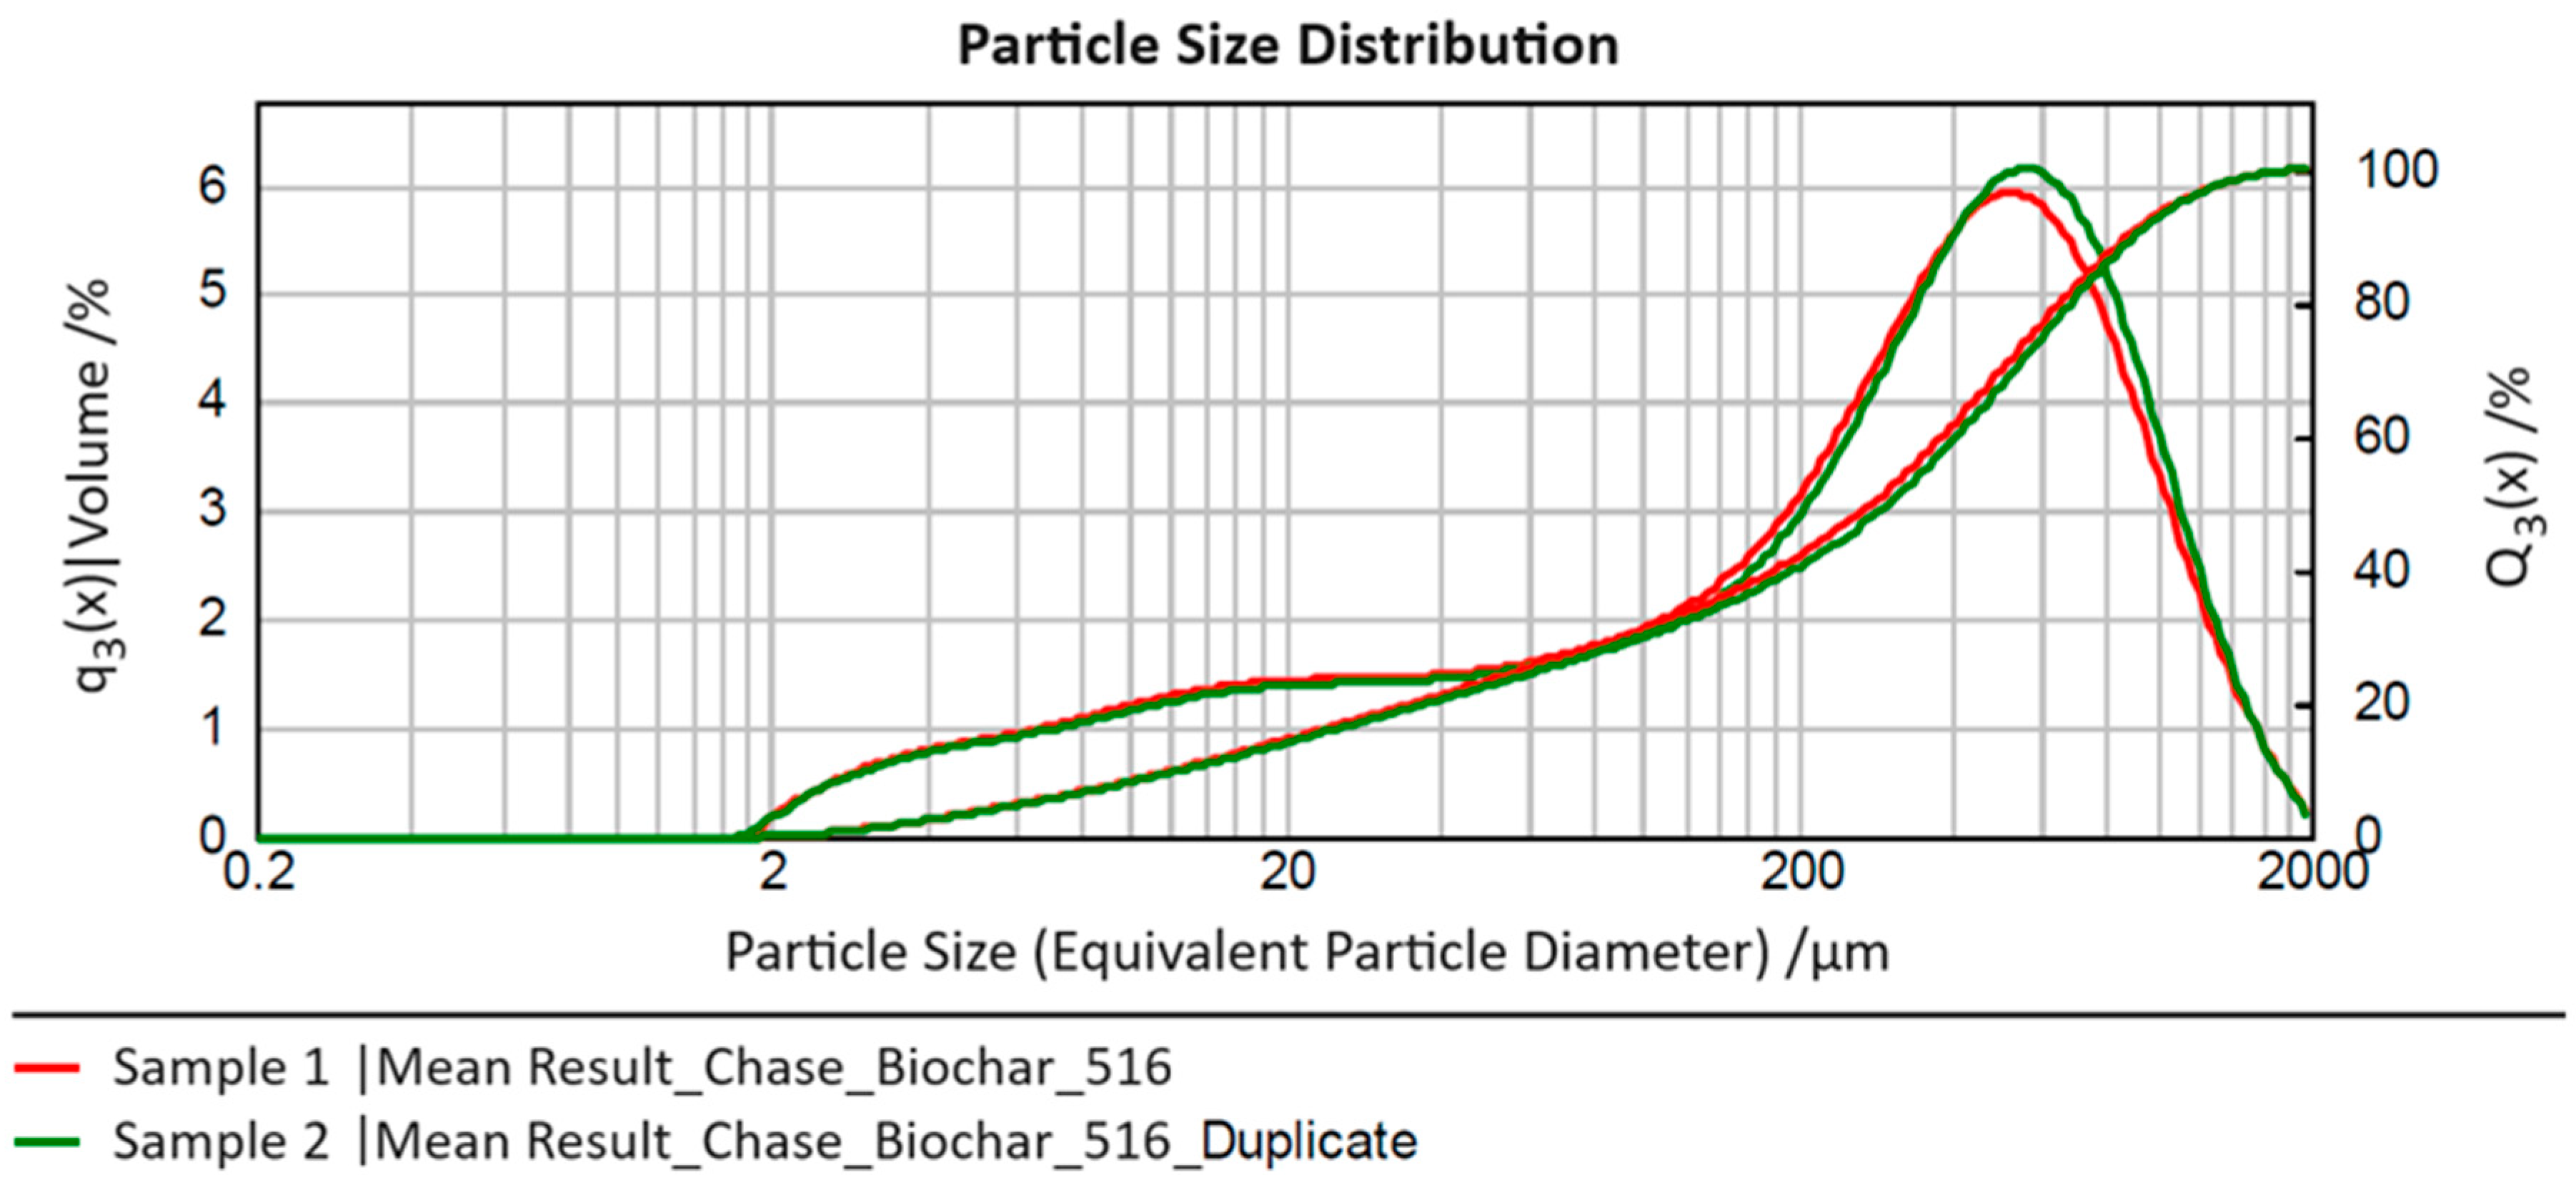
Figure 1 presents the volume-based particle size distributions averaged from three sub-series of measurements for the two conducted series (“sample” and “duplicate”) in the form of their relative distribution density “q
3(x)” and cumulative distribution curve “Q
3(x)”, where “x” denotes the equivalent particle diameter determined in the analyses.
The two measured samples show very good agreement in particle characteristics across the entire measurement range. In the size range of approximately 300–600 µm, the density function for Sample 2 (“duplicate”) exhibits a right shift compared to Sample 1, with its maximum slightly higher. However, both effects are negligible. For both measurements, a comparably broad particle size range (three orders of magnitude) from approximately 2 to 2000 µm is observed, with 80% of particles (i.e., the size range x10,3–x90,3) falling between roughly 10 and 1000 µm (average for Sample 1: 12–886 µm; average for Sample 2: 13–913 µm). This range (spanning two orders of magnitude) should be considered for process design. The median (x50,3) for both distributions is around an equivalent particle diameter of 300 µm (Sample 1: 280 µm; Sample 2: 302 µm), representing the typical particle size in the measured original sample.
Additionally, for process considerations, it is noteworthy that the left tail of the distribution extends over a broader range with a similar probability of occurrence (1–2% in the particle size classes between approximately 5 and 100 µm). This suggests that it may be beneficial to separate a fine fraction below 100 µm from the biochar before its use to potentially remove interfering fine particles or create an additional “material type” for the investigation of process behavior.
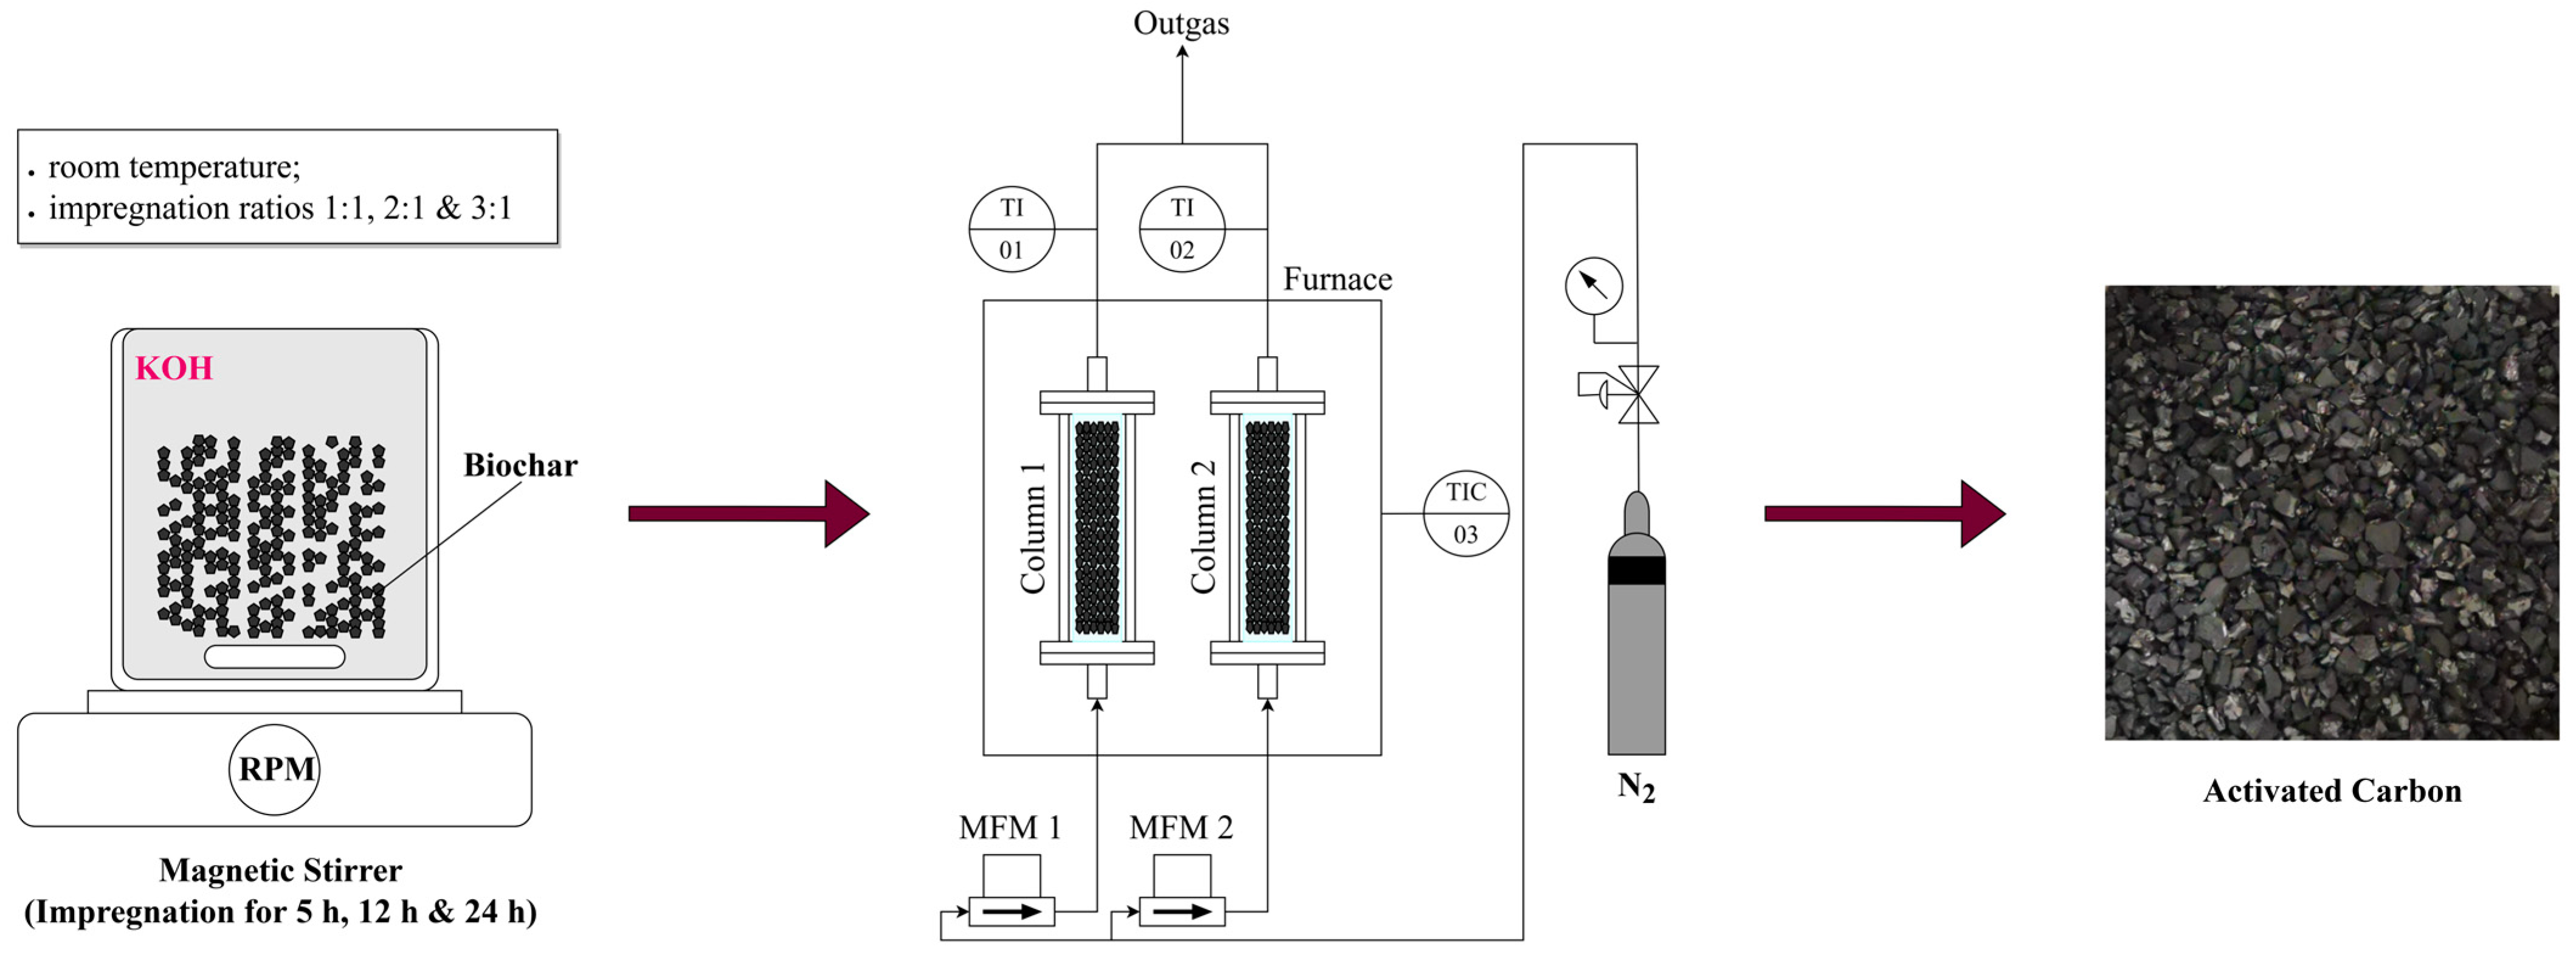
2.3. Activation Process of Biochar to Activated Carbon
The activation process of biochar to activated carbon consists of two steps. The first step is chemical activation, followed by carbonization, as illustrated in
Figure 2. The chemical activation of raw biochar was performed using potassium hydroxide (KOH) as the activating agent. The impregnation ratio, defined as the weight ratio of KOH to biochar, was varied to assess its effect on the activation process. The ratios tested included 1:1, 2:1, and 3:1. For the activation, 200 mL of distilled water was first prepared, and the appropriate amount of KOH, ranging from 20 to 60 g, depending on the impregnation ratio, was dissolved in the water. After the KOH was fully dissolved, 20 g of raw biochar was added to the solution. The mixture was then stirred continuously for 5 h. To further investigate the influence of stirring duration on the surface area, total pore volume, and other properties, the optimal impregnation ratio was also subjected to extended stirring periods of 12 and 24 h.
Following impregnation, the mixtures were filtered, and the resulting solids were dried until constant weight. The dried biochar samples were then subjected to carbonization. Each sample was placed in a quartz glass container, which was then positioned inside a stainless-steel reactor with dimensions of 300 mm in length and 20 mm in internal diameter. The reactor was heated in an electric furnace under a nitrogen atmosphere to prevent oxidation. Approximately 15 g of the impregnated material was loaded into each reactor. The samples were heated to final carbonization temperatures of 600 °C, 700 °C, 750 °C, and 800 °C at a heating rate of 10 °C/min, with a nitrogen flow rate of 300 mL/min. Upon reaching the target temperature, the samples were held at this temperature for one hour to complete the carbonization process. Following carbonization, the activated biochar samples were treated with 200 mL of 0.1 M hydrochloric acid (HCl) solution to remove any residual activating agent. After the acid treatment, the samples were thoroughly rinsed with distilled water until the pH of the wash water stabilized within a neutral range of 6–7. The final activated carbon products were then dried at 105 °C for 12 h to ensure the complete removal of any remaining moisture. The yield of activated carbon was determined by dividing the dry weight of the resulting activated carbon by the dry weight of the original biochar and then multiplying the result by 100 to express it as a percentage.
2.4. Sample Characterization
The raw biochar and activated carbon samples were degassed at less than 10 Pa and 300 °C for 2 h using a Microtrac BELPREP II (Montgomeryville, PA, USA). The surface and pore characteristics were then analyzed through N2 adsorption at 77 K using a BELSORP MAX X device, with measurements taken across a relative pressure range of 10−2 to 0.99 P/P₀. These data were used to calculate the pore size, pore volume, and surface area using Microtrac’s BELMASTER Version 7.4.3.1 software. The Brunauer–Emmet–Teller (BET) surface area was determined following the Rouquerol criteria, while pore size distributions were calculated using the NLDFT model for slit pores in carbon materials.
The morphology of the AC surface was determined using Scanning Electron Microscopy (SEM) using an FEI Quanta FEG250, with samples mounted on aluminum stubs using carbon tape. To enhance conductivity, samples were coated in a Q150T S sputter coater at 15 mA for 5–10 min. Elemental analysis was conducted by energy-dispersive X-ray spectroscopy (EDX) on the same microscope.
Fourier Transform Infrared (FTIR) spectroscopy was used to determine surface functional groups. Spectra were monitored in the 4000 to 400 cm−1 range using a VERTEX 70 spectrometer, with 64 scans captured at a 2 cm−1 resolution.
The efficiency of activated biochar was investigated through simultaneous thermal analysis (STA—TGA/DSC—Thermogravimetric Analysis with Differential Scanning Calorimetry) using a NETZSCH STA 449c TGA/DSC analyzer (Selb, Germany) and NETZSCH Proteus software (Version 8.0.2) for data processing. The focus of the analysis was on the adsorption capabilities of the activated biochar for carbon dioxide (CO2) diluted in an inert He gas stream (total gas flow rate 100 Nml/min) at a constant sample temperature of 30 °C. The sample size was ~20 mg in 6.8 mm Al2O3 crucibles. Various concentrations of CO2 were employed to assess their impact on the adsorption process; a settling time of 20 min was introduced to reach equilibrium at each concentration step. This approach aims to elucidate the relationship between CO2 concentration and the adsorption efficiency of biochar, providing insights into its potential applications in carbon capture technologies.
3. Results
3.1. Effects of KOH on the Yield of Activated Carbons
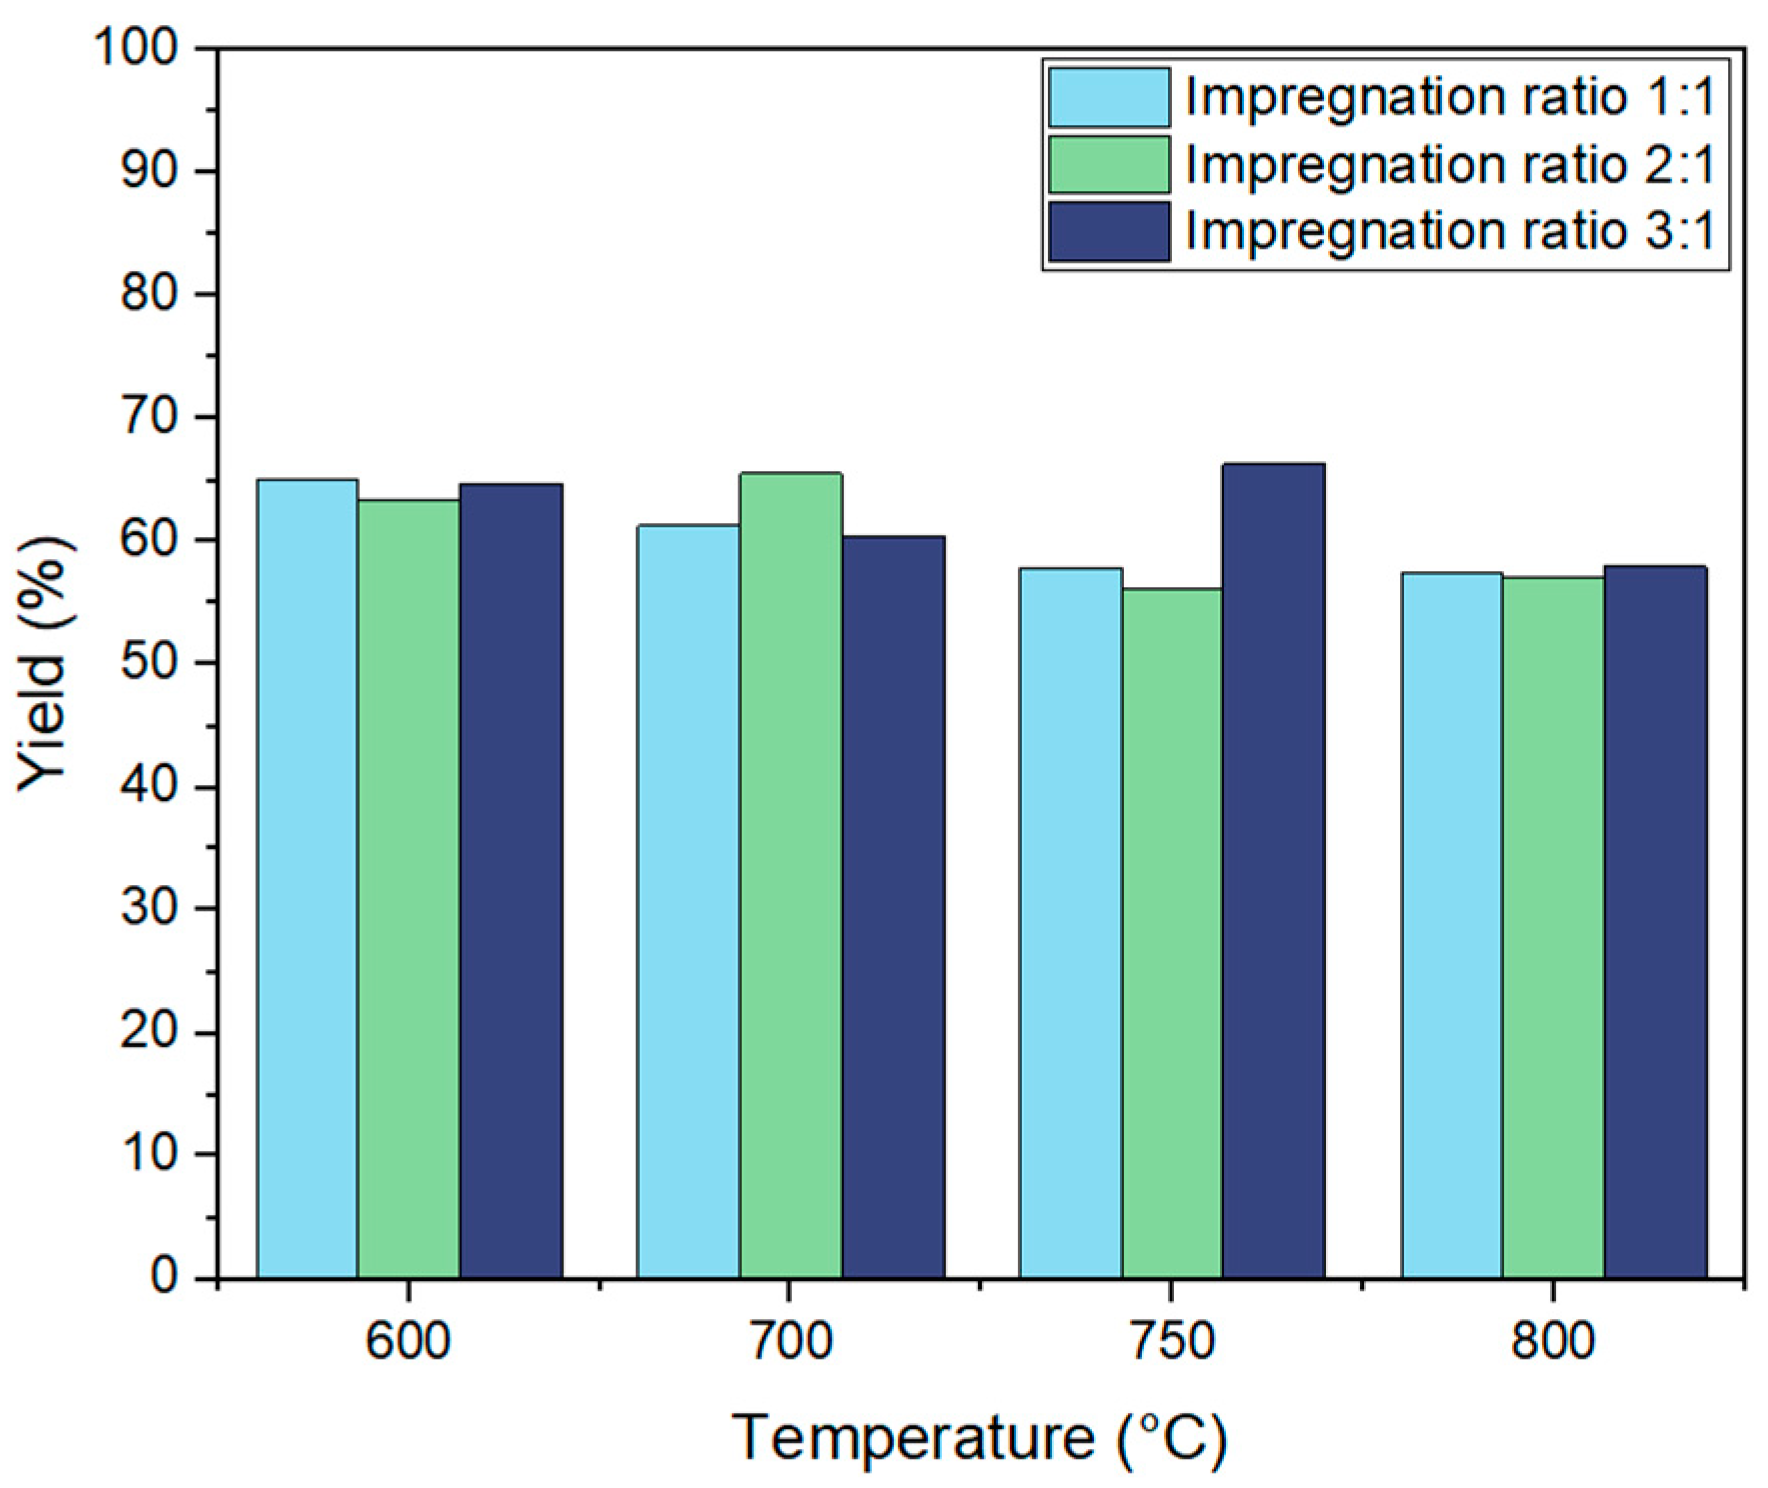
The yield of activated carbon derived from biochar through KOH activation was systematically examined under varying activation temperatures (600 °C, 700 °C, 750 °C, and 800 °C) and impregnation ratios (1:1, 2:1, and 3:1). As shown in
Figure 3, activation temperature significantly influenced the yield of the resulting activated carbon.
Previous research suggests that increasing activation temperatures generally leads to lower carbon yield, as the thermal degradation of biochar results in the release of volatile compounds and intensified carbon gasification [
38]. This trend was observed in our study, where the yield decreased across all impregnation ratios as temperature increased. For example, at a 1:1 ratio, the yield dropped from 61.2% at 600 °C to 55.7% at 800 °C, while at a 3:1 ratio, the yield declined from 64.8% at 600 °C to 58% at 800 °C. The highest yield observed across all conditions was 66.3% at 750 °C with a 3:1 ratio, suggesting that, at intermediate temperatures, activation reactions optimize porosity while minimizing excessive carbon loss. The observed yield at 750 °C with a 3:1 ratio was enhanced to 66.3%, suggesting that, at this temperature, activation reactions optimize porosity while minimizing excessive carbon loss. But this requires more investigation to validate these results.
Despite the reduction in yield, increasing temperature enhanced the BET surface area, indicating improved micropore development. For instance, at 800 °C, the BET surface area peaked at 498 m2/g for the 3:1 ratio, illustrating that although higher temperatures led to greater burn-off, they also promoted a more developed pore structure. Conversely, lower temperatures (e.g., 600 °C) retained more carbon but did not always maximize BET surface area, particularly at 2:1 and 3:1 impregnation ratios, where the lower reaction intensity limited pore formation.
The impregnation ratio of KOH to biochar significantly influenced yield trends by controlling the extent of chemical activation and the potassium catalysis of carbon gasification. Literature findings indicate that increasing the KOH-to-biochar ratio generally enhances yield by promoting more efficient activation and facilitating carbon restructuring [
39]. Our results support this trend, as yield values increased with higher KOH ratios across most temperature conditions.
For the 3:1 impregnation ratio, yields remained relatively high across temperatures, starting at 64.8% at 600 °C, then slightly decreasing to 60.5% at 700 °C, peaking at 66.3% at 750 °C, and finally dropping to 58% at 800 °C. This trend aligns with the proposed catalytic role of potassium ions on the carbon surface, which enhances activation efficiency. However, at higher temperatures (800 °C), aggressive gasification leads to increased carbon loss, resulting in a yield drop despite the high impregnation ratio.
3.2. Surface Area and Pore Size Distribution
The surface area of activated carbon is measured using BET equipment BELSORP MAX X. This method uses nitrogen at 77 K to measure gas adsorption. BET analysis provides important information about the porosity and surface characteristics of the activated carbon.
The surface area is one of the important factors for determining the adsorption properties of activated carbon, as it directly relates to the ability of a material to adsorb different substances.
A higher BET surface area usually means there are more available adsorption sites, making the material more effective for gas and water purification applications. At an activation temperature of 600 °C, an increase in the impregnation ratio of KOH to biochar leads to a decrease in the surface area. However, at 800 °C, the surface area increases as the impregnation ratio increases. The change in surface area with the increase in the KOH-to-biochar impregnation ratio at different activation temperatures can be attributed to the varying chemical and physical processes that occur during the activation process. At 600 °C, the higher impregnation ratio may lead to a more pronounced chemical reaction or pore structure collapse, resulting in a decreased surface area.
In contrast, at 800 °C, the increase in impregnation ratio may promote the formation of more porous structures, leading to an increased surface area. These changes are influenced by the temperature and the chemical reactions during the activation process.
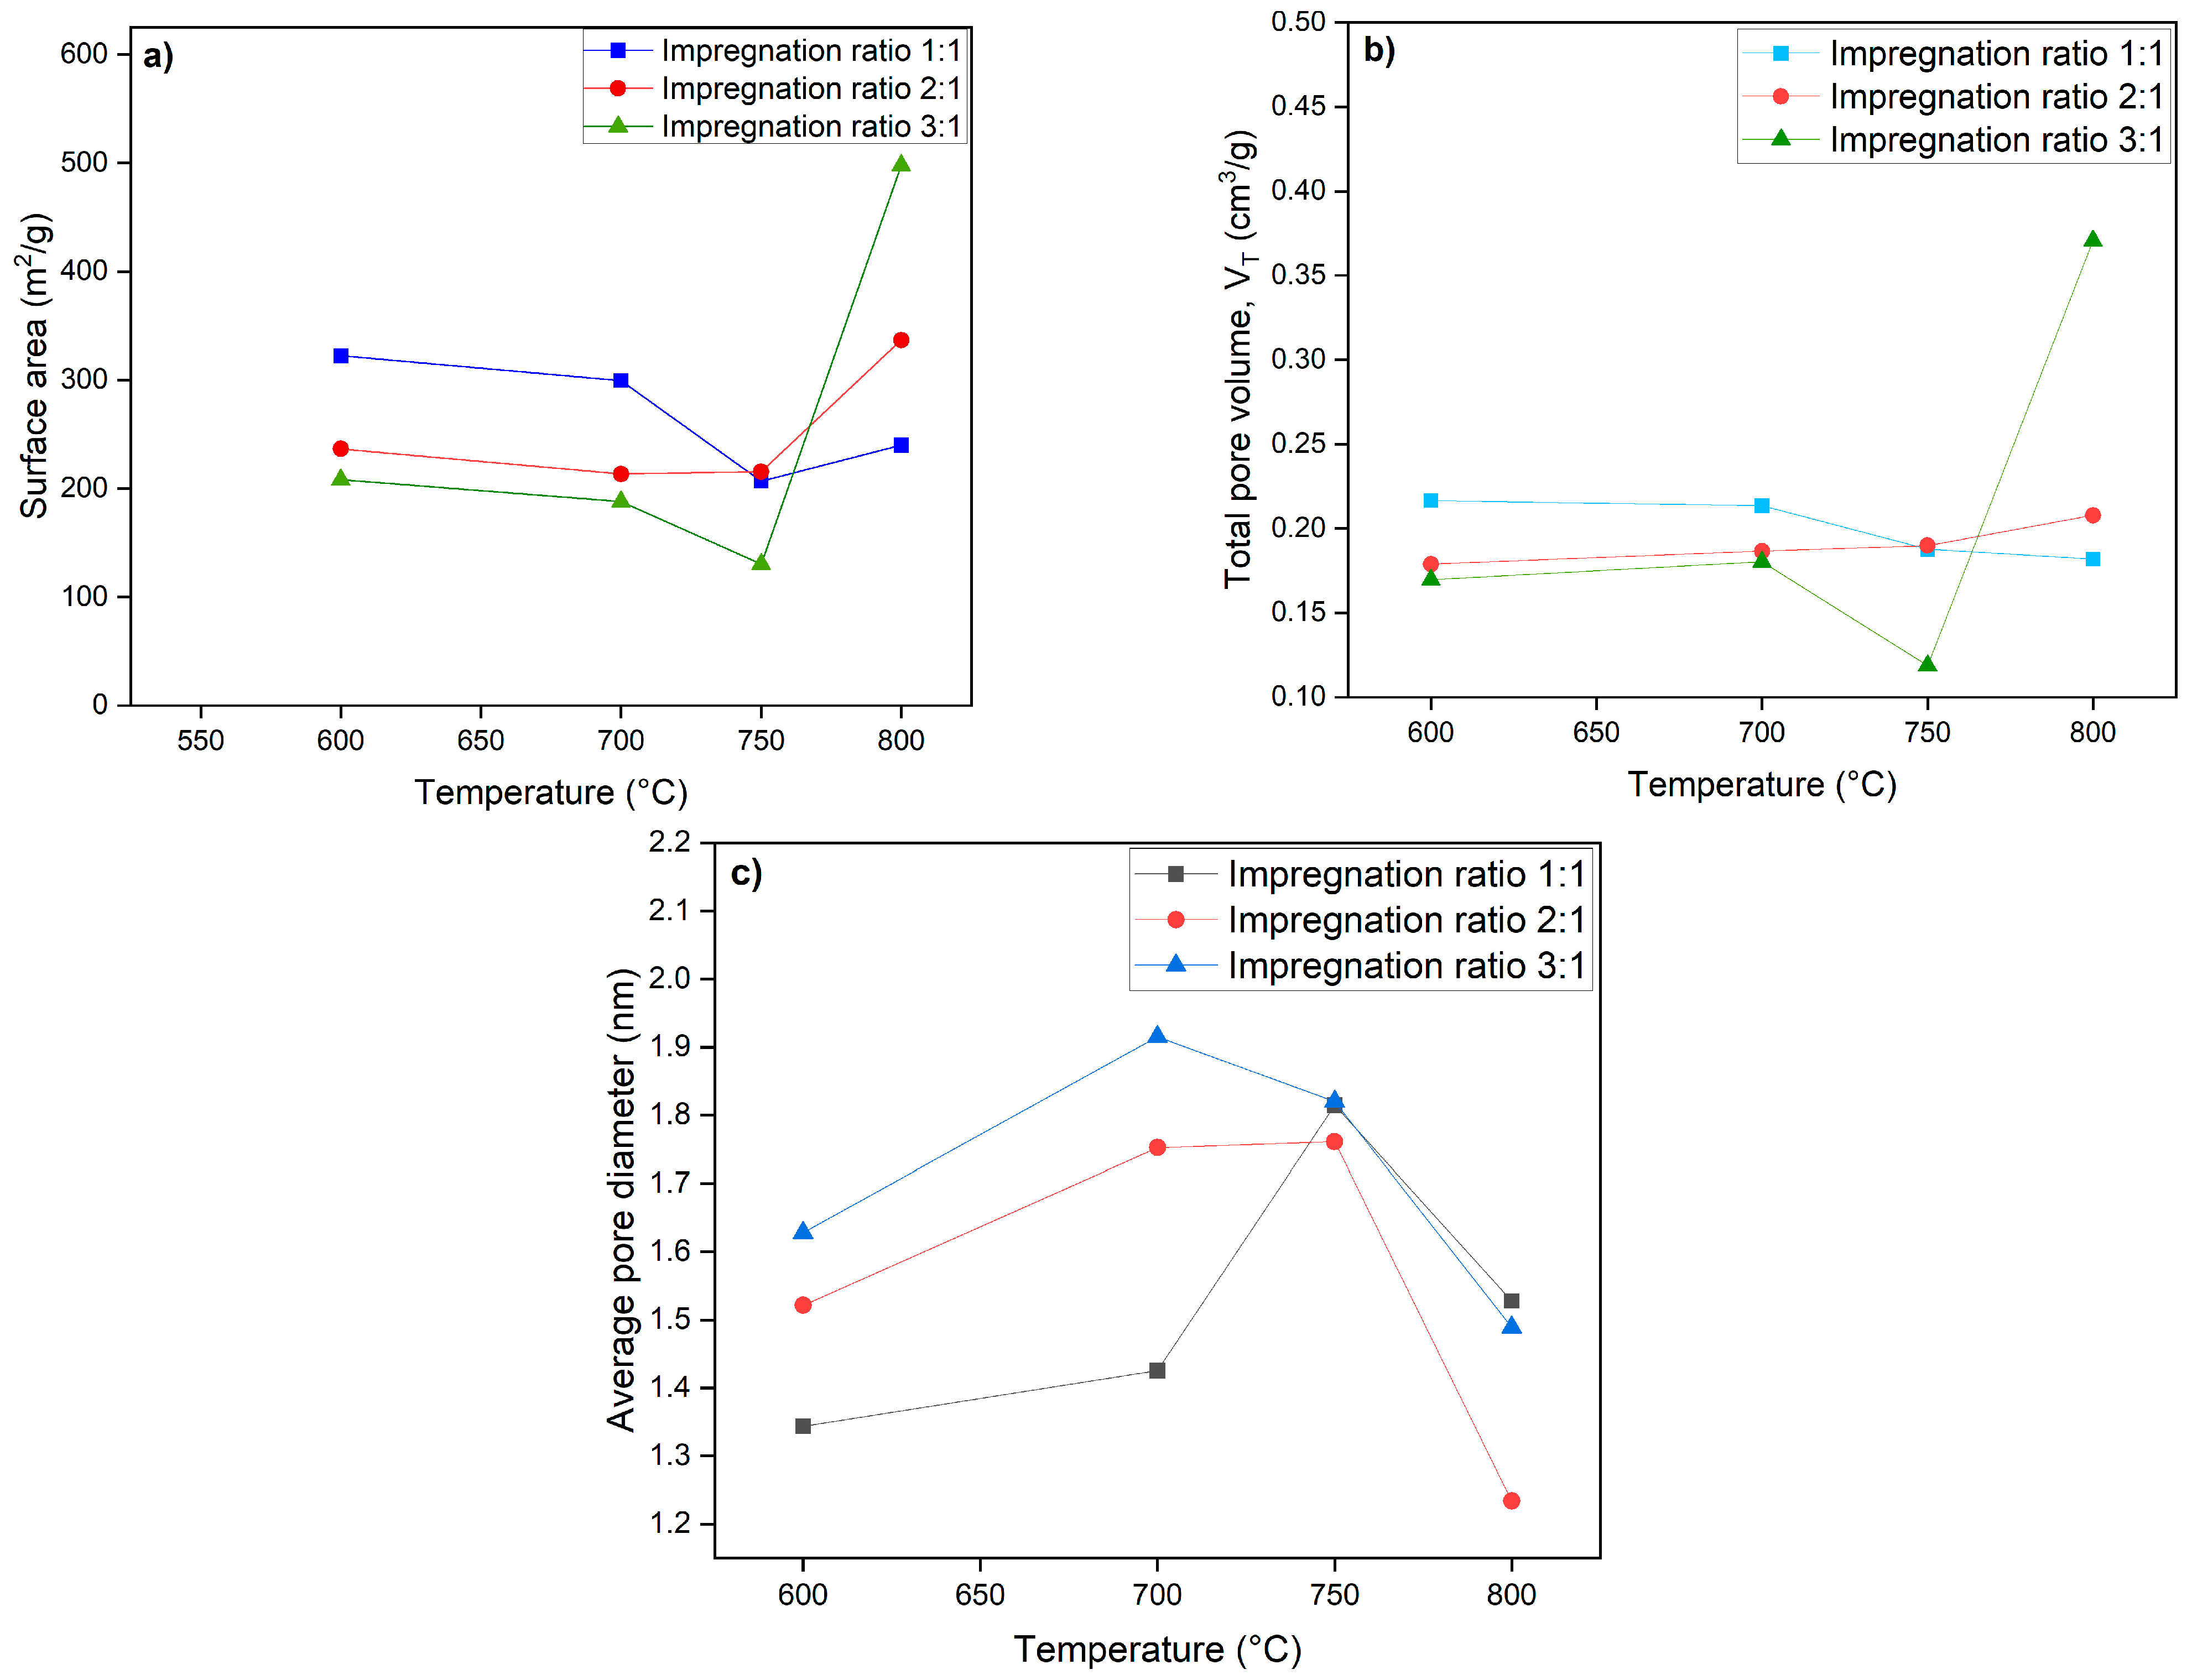
As illustrated in
Figure 4, the surface area of activated carbon at 600 °C and 700 °C is greatest, with an impregnation ratio of 1:1 (KOH: biochar), followed by a ratio of 2:1, and is lowest at a ratio of 3:1. This decrease in surface area at a 3:1 ratio indicates that a higher concentration of KOH may lead to an over-activation of the biochar, reducing its structural integrity and limiting pore formation. Conversely, the 2:1 ratio appears to provide a moderate level of activation that still promotes surface area but perhaps does not achieve the same efficiency as the 1:1 ratio at these temperatures. However, at 750 °C, a decrease in surface area is observed across all impregnation ratios. This may be due to excessive heat leading to the shrinkage of pores or the collapse of the biochar structure, diminishing the surface area.
Interestingly, at 800 °C, the results reverse, showing an increase in surface area at the 3:1 ratio, with the average pore diameter decreasing, which indicates that higher temperatures can unlock new pore structures or facilitate different activation mechanisms that might not be present at lower temperatures. The results indicate that the impregnation ratio significantly influences the surface area of biochar at various carbonization temperatures.
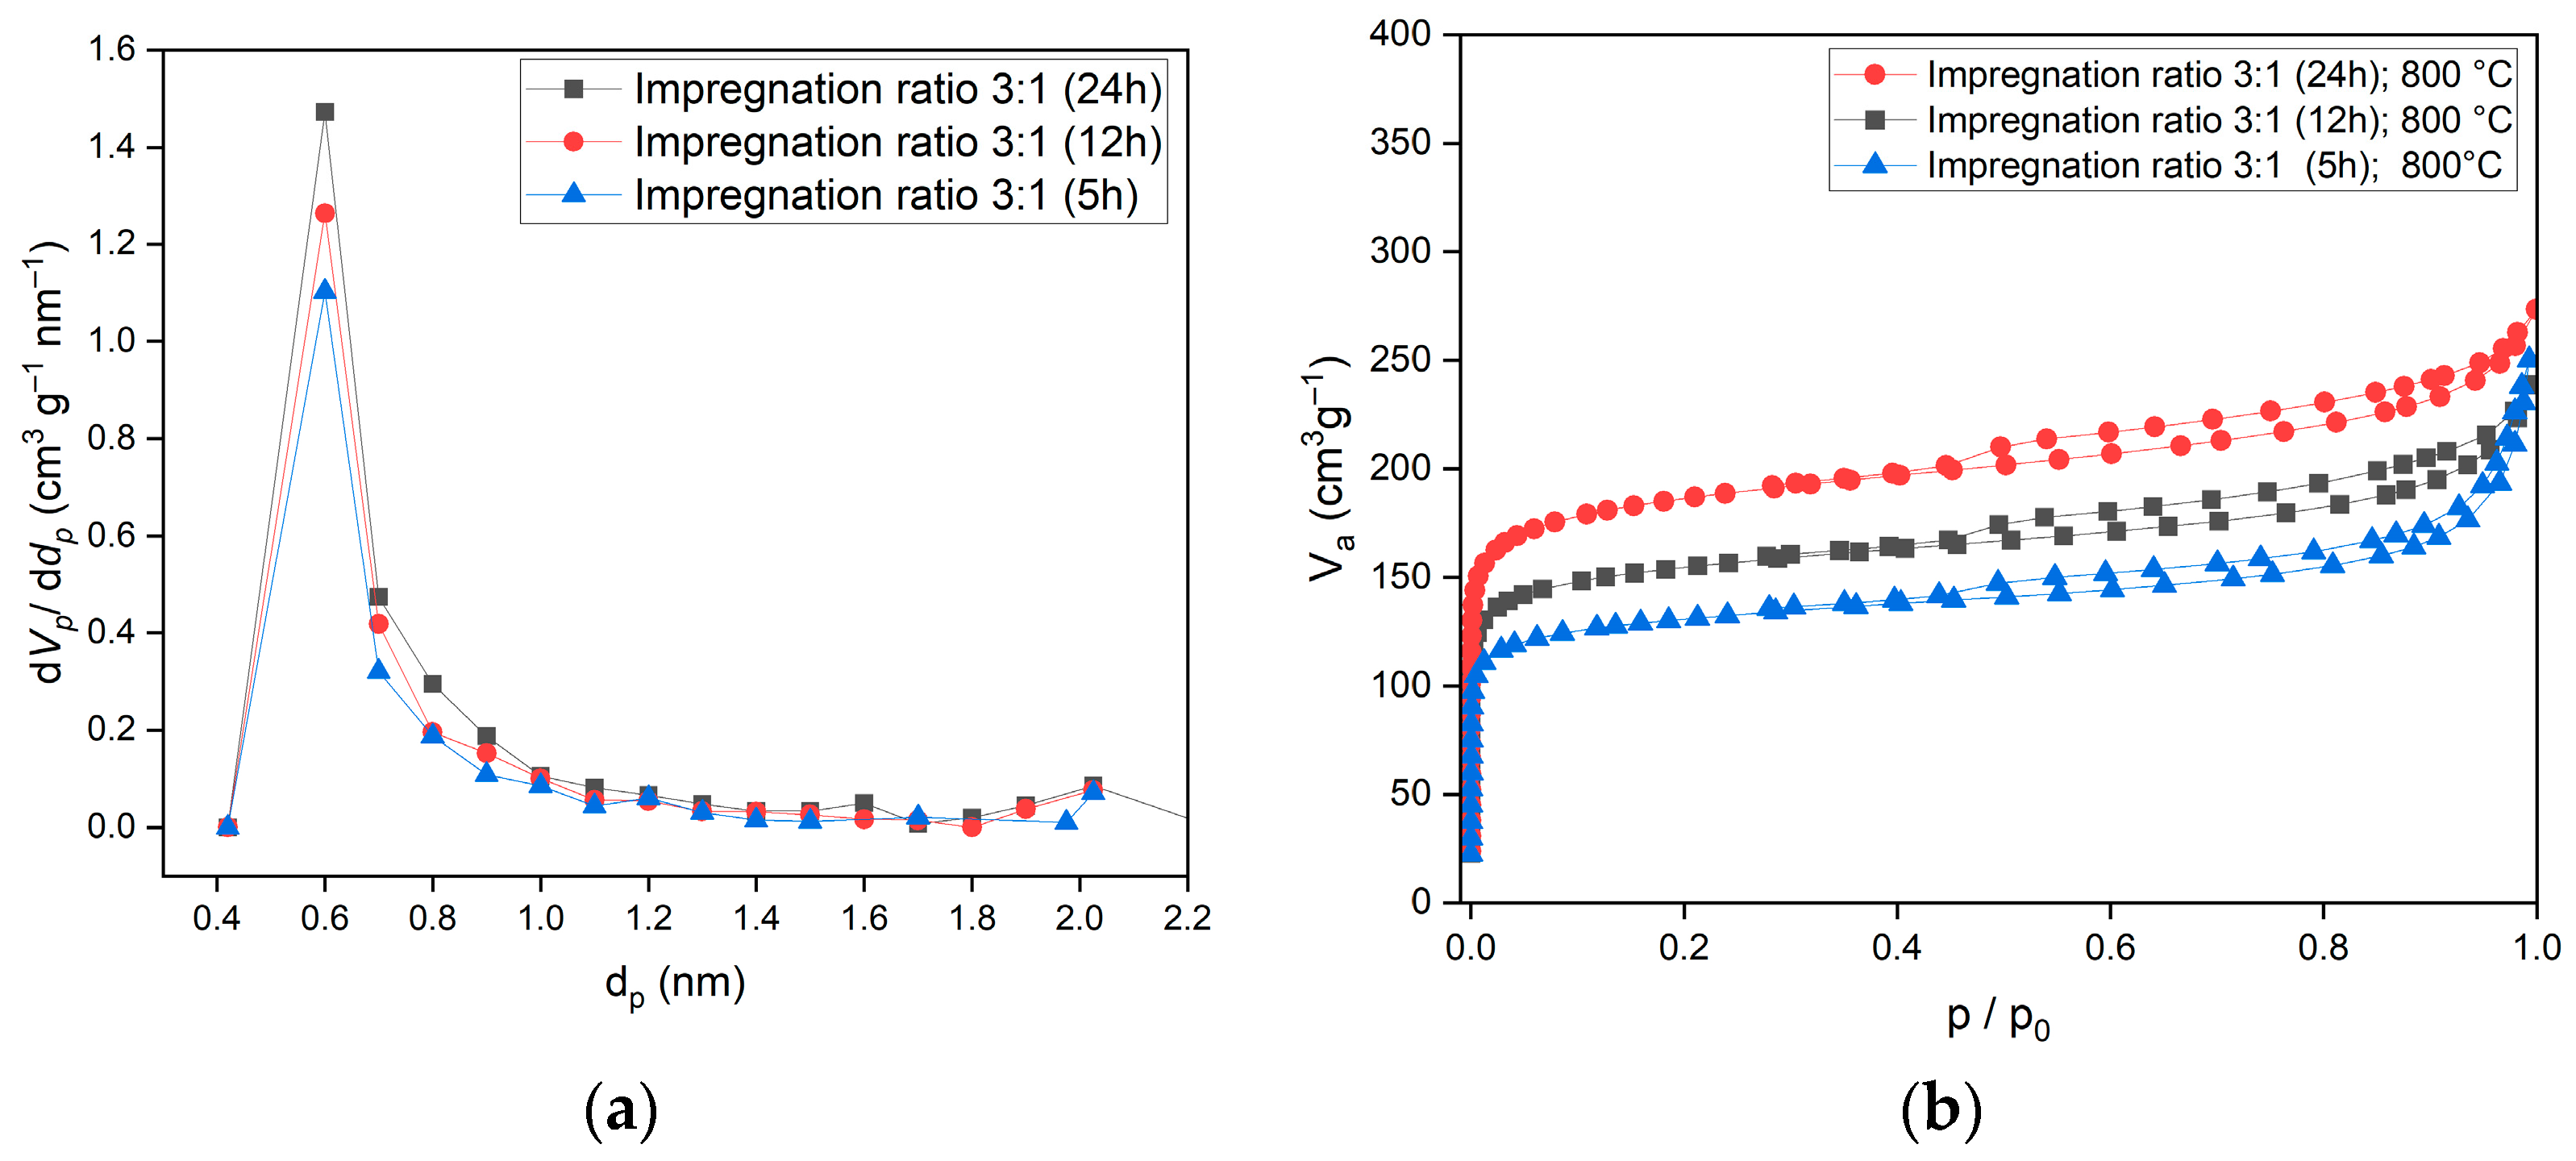
The effect of time was examined at 5 h, 12 h, and 24 h, as represented in
Table 1. As activation time increases, the prolonged contact of biochar to KOH enhances the extent of chemical reactions, allowing for greater pore development. The extended contact time facilitates deeper etching of the carbon matrix, progressively increasing the available surface area. Additionally, as new pores form, they expose more reactive sites, accelerating further activation and pore expansion. This self-reinforcing process contributes to the continuous increase in BET surface area observed with longer activation times. The optimal impregnation ratio for activated carbon was determined to be 3:1, processed at 800 °C for 24 h. BET analysis of the activated carbon under this condition showed a specific surface area of 708 m
2/g, a total pore volume of 0.41 cm
3/g, and a pore size of 1.16 nm. The high specific surface area and microporous structure of the activated carbon indicate excellent potential for gas adsorption applications, particularly for CO
2 and CH
4. Compared to commercial activated carbons, the surface area is within the typical range (600–1200), which confirms the efficiency of the chemical activation process of biochar.
The adsorption isotherm was classified as Type I, which indicates a microporous structure, as shown in
Figure 5. The presence of micropores correlates with the Type I isotherm, demonstrating strong adsorption capacity at low pressures, which is beneficial for energy storage and efficiency.
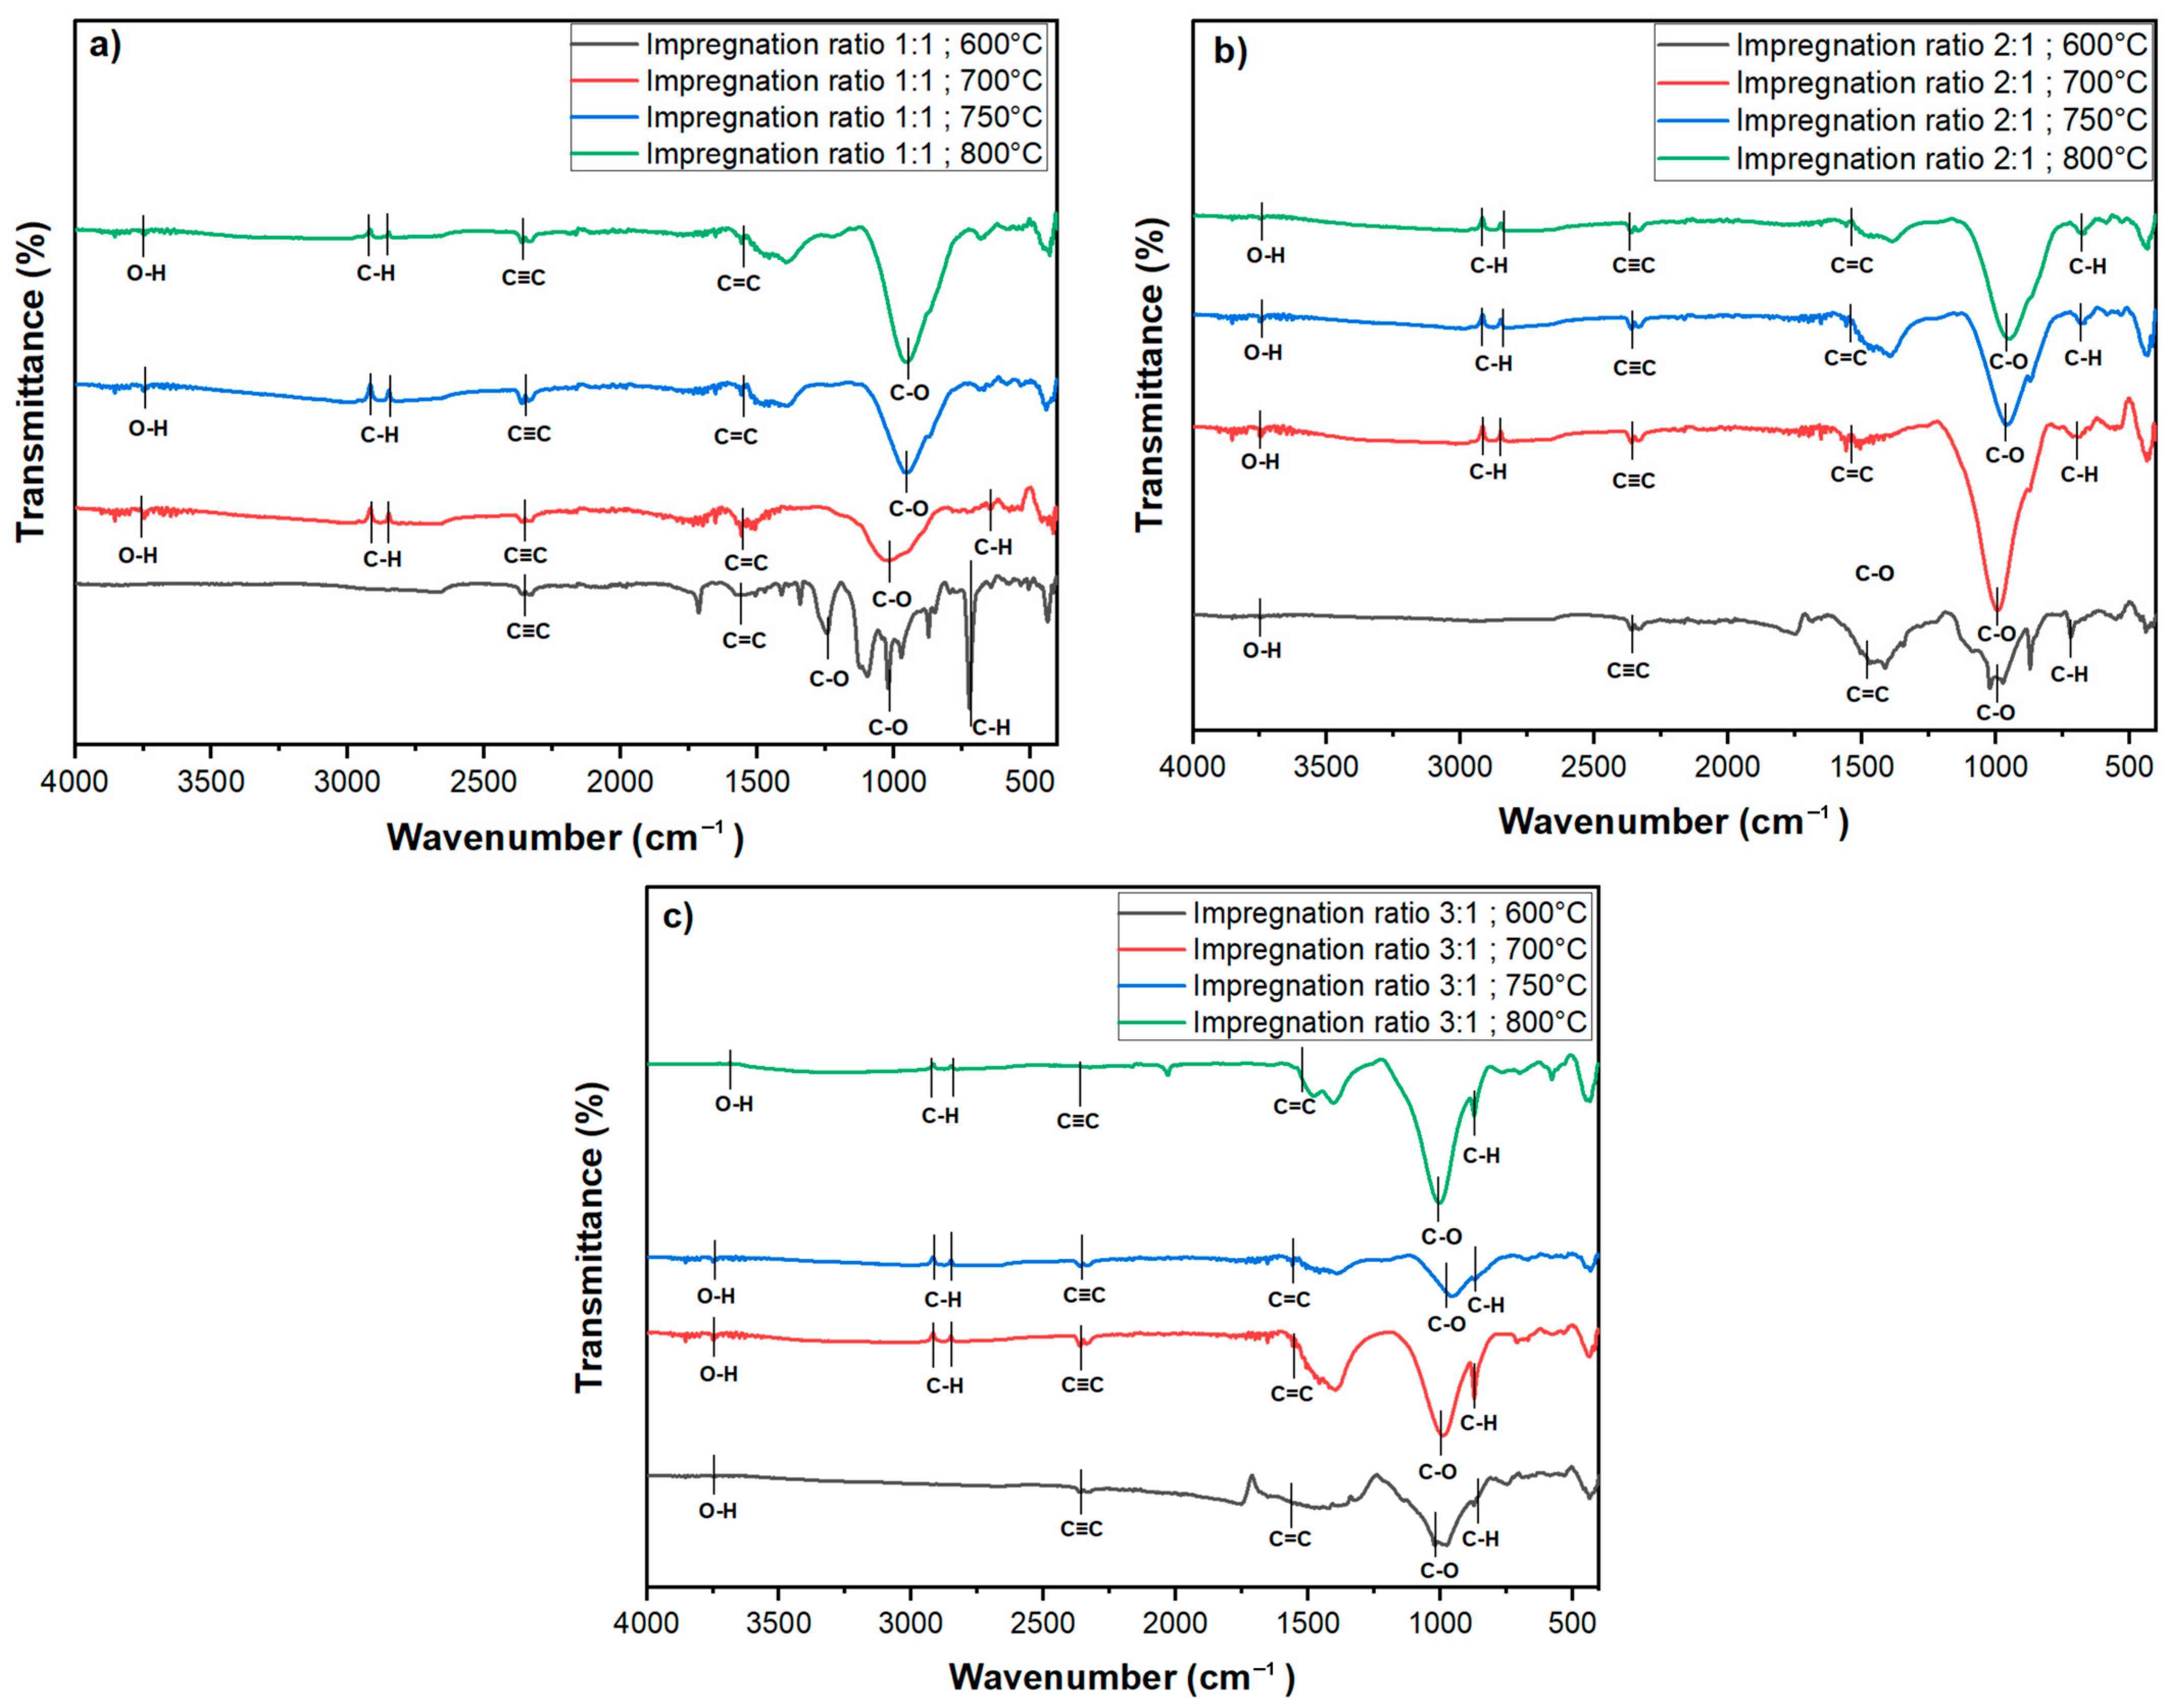
3.3. Surface Functional Groups
FTIR was conducted to examine the surface functional groups of the chemically activated carbon samples. The spectra were recorded in the wavenumber range of 4000–400 cm
−1, as shown in
Figure 6. The FTIR spectra for all activated carbon samples exhibit several characteristic peaks, which provide insights into the chemical transformations induced by KOH activation at various temperatures and impregnation ratios.
A broad, weak peak observed around 3700 cm
−1 corresponds to the O-H stretching vibrations of hydroxyl groups [
28,
40]. The presence of these hydroxyl groups suggests that surface-bound hydroxyls are retained during the activation process, which likely contributes to the enhanced hydrophilicity of the activated carbon. In the range of 2900–2860 cm⁻
1, smaller peaks are visible, attributed to asymmetric C-H stretching vibrations representing methylene (-CH
2) and methyl (-CH
3) groups [
41,
42]. These peaks indicate the presence of aliphatic chains, though their relatively low intensity suggests that these aliphatic compounds are not dominant functional groups on the activated carbon surface. A distinct peak at approximately 2347 cm
−1 corresponds to the stretching vibrations of alkynes (C≡C) [
3]. This peak is consistent across all impregnation ratios and temperatures, except for the sample activated at 800 °C with a 3:1 impregnation ratio, as shown in
Figure 6b, where the band is significantly weaker. The reduction in or absence of this peak at higher temperatures indicates a possible breakdown or gasification of triple bonds under extreme thermal conditions, particularly when higher KOH concentrations are used.
The peak observed at 1537 cm
−1 is characteristic of C=C stretching vibrations, signaling the presence of aromatic rings in the carbon matrix [
3,
6]. This indicates that KOH activation facilitates the formation of stable aromatic structures, which are essential for the enhanced adsorption capacity and thermal stability of activated carbon. Furthermore, the wavenumber range between 1300 and 900 cm
−1 corresponds to C-O stretching vibrations typically found in acids, phenols, esters, and alcohols, which are common in oxidized carbons [
43,
44]. These peaks are present across all impregnation ratios and temperatures but are notably smaller for samples treated at 700 °C and 600 °C with a 3:1 impregnation ratio, indicating a diminished presence of secondary alcohol or ether groups. The reduction in the intensity of these peaks at higher temperatures suggests that thermal activation reduces the oxygen-containing functional groups, potentially increasing hydrophobicity and improving pore structure. In contrast, for the 1:1 impregnation ratio, these peaks remain sharper across all temperatures, particularly at lower temperatures. Sharp peaks at 723 cm
−1 and 655 cm
−1 are attributed to C-H bending vibrations in benzene derivatives.
The FTIR results represent that the temperature and impregnation ratio play significant roles in determining the surface morphology of the activated carbon. The weakening or disappearance of specific functional groups at higher temperatures and impregnation ratios indicates the breakdown of volatile components, contributing to the overall structural modification of the activated carbon. The presence of hydroxyl groups contributes to increased hydrophilicity, while the stable aromatic structures enhance both the adsorption capacity and thermal stability. Higher temperatures result in the reduction of oxygen-containing functional groups, leading to improved pore structure and increased hydrophobicity. Furthermore, the formation of stable aromatic structures, as indicated by the presence of C=C stretching vibrations, enhances the adsorption capacity and thermal stability of the activated carbon.
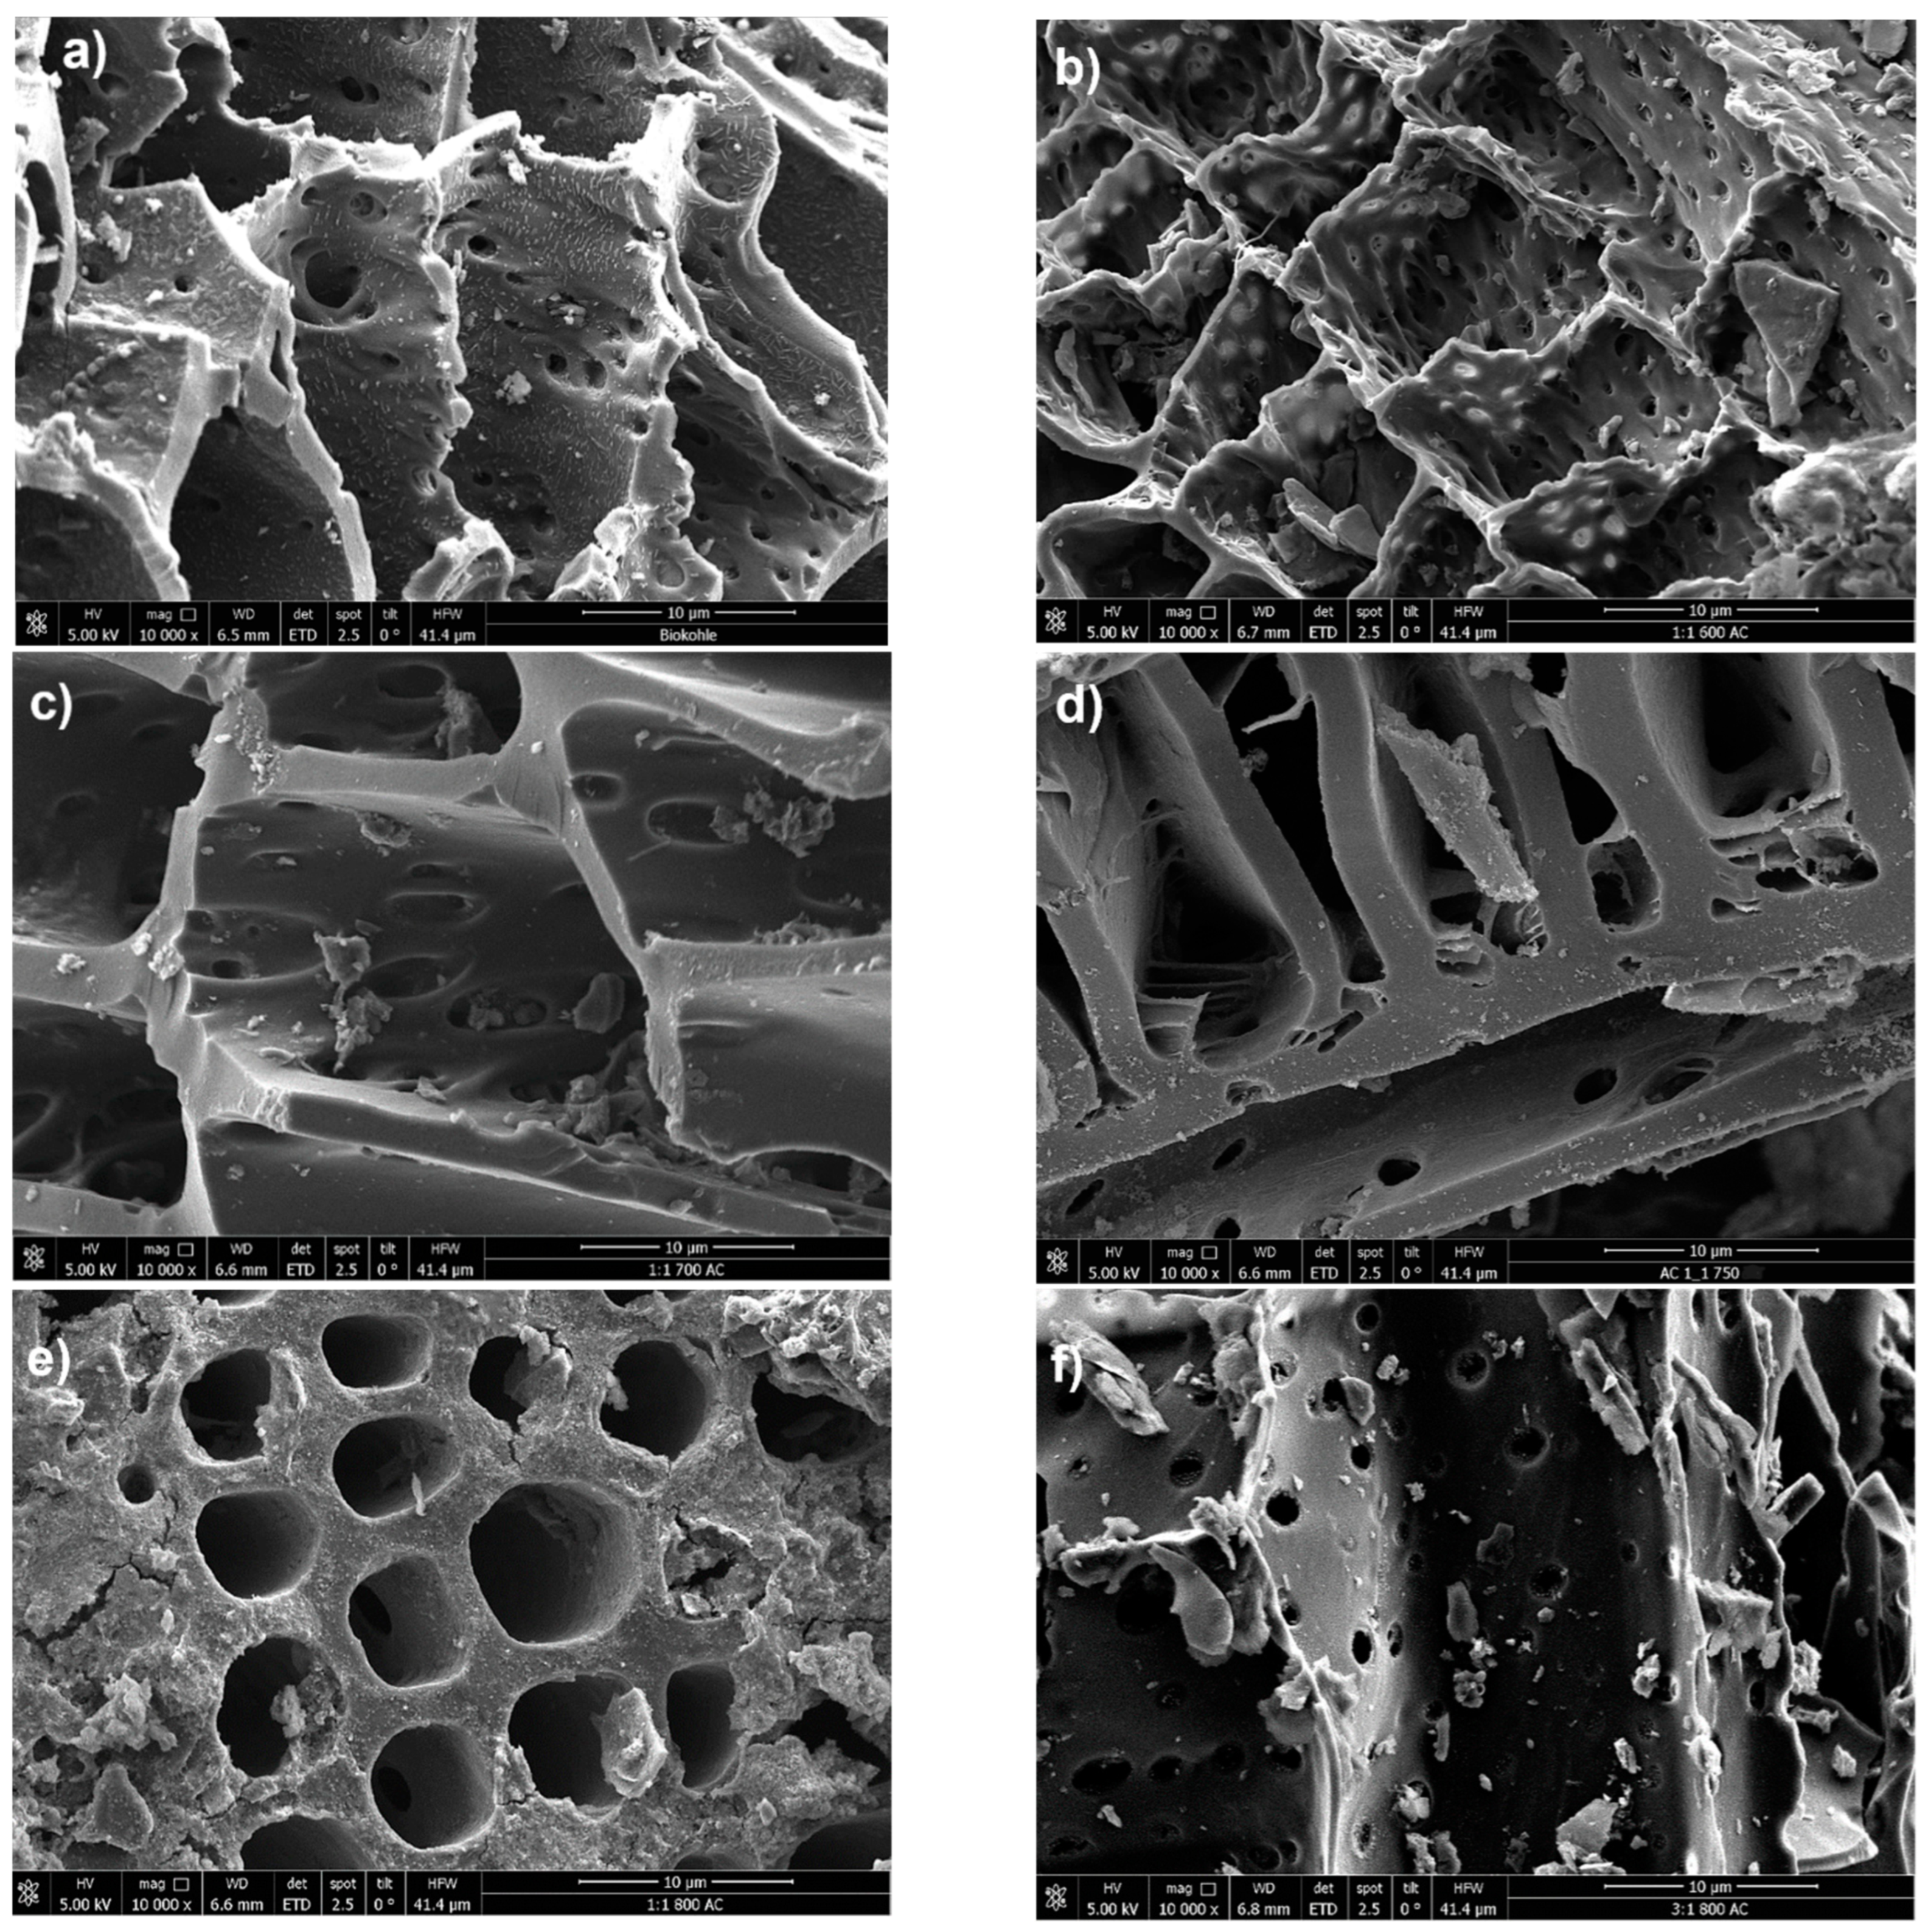
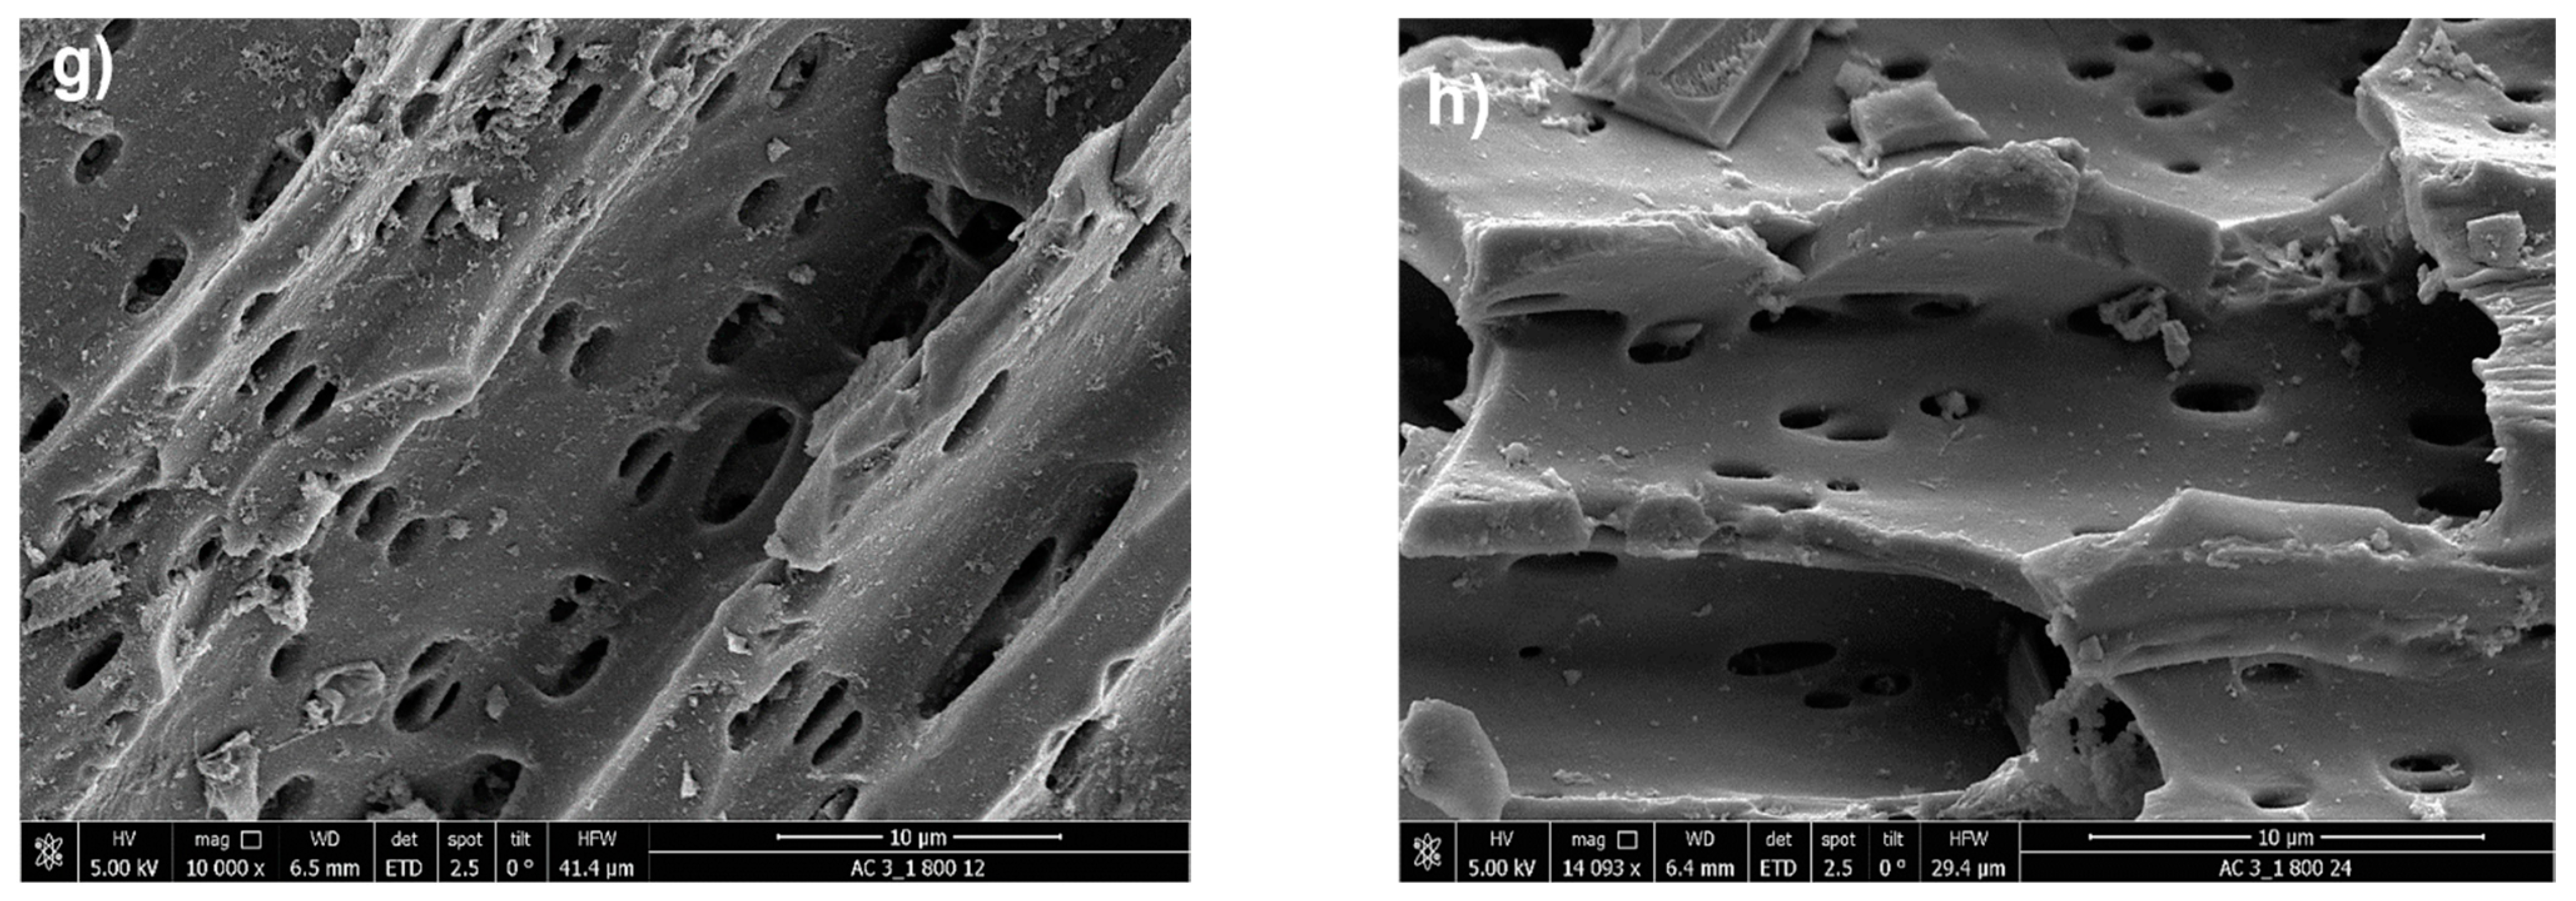
3.4. Surface Morphology and EDX
The morphological analysis of the chemically activated carbon samples and the raw biochar was conducted using Scanning Electron Microscopy (SEM) to evaluate the impact of KOH activation. The SEM image in
Figure 7a shows the untreated biochar, displaying a relatively rough surface texture with a visible porous structure, though small particles or impurities are present on the surface.
Highly exothermic reactions are a consequence of the subsequent activation process, including the reaction of KOH with carbon/raw biochar at elevated temperatures. This significantly alters the structural morphology, as observed in
Figure 7b–h. These images correspond to activation temperatures ranging from 600 °C to 800 °C.
Figure 7b shows the activated carbon treated at 600 °C with an impregnation ratio of 1:1. The wall of the pores appears more refined compared to the raw biochar, with a noticeable increase in both the size and number of pores, indicating enhanced porosity. Despite that, some regions still exhibit residual particles or structures, which may be remnants of the original material or byproducts of the activation process. At an elevated temperature of 700 °C, the SEM image in
Figure 7c reveals further refinement and smoothness of the pore walls, suggesting more advanced pore development. The increased activation temperature appears to contribute to the collapse of smaller pores while expanding larger ones, resulting in a modified pore size distribution and increased pore volume.
Figure 7e illustrates the activated carbon at 800 °C with an impregnation ratio of 1:1, showing an even greater increase in pore volume. This phenomenon can be associated with the activation process with KOH, where the elevated energy input promotes a near-violent disintegration of the carbon matrix as KOH penetrates and intercalates within the structure [
25]. This breakdown is further intensified by partial gasification due to the reactive oxygen released from the hydroxide. The mechanisms of KOH intercalation and subsequent “explosive” disintegration, coupled with gasification, likely account for the more developed porosity observed in the treated biochars compared to the untreated sample. In
Figure 7f, the activation is again conducted at 800 °C, but with a higher impregnation ratio of 3:1. The morphology discloses a more heterogeneous pore structure comprising both mesopores and micropores. The diverse pore network enhances the material’s ability to adsorb molecules of various sizes.
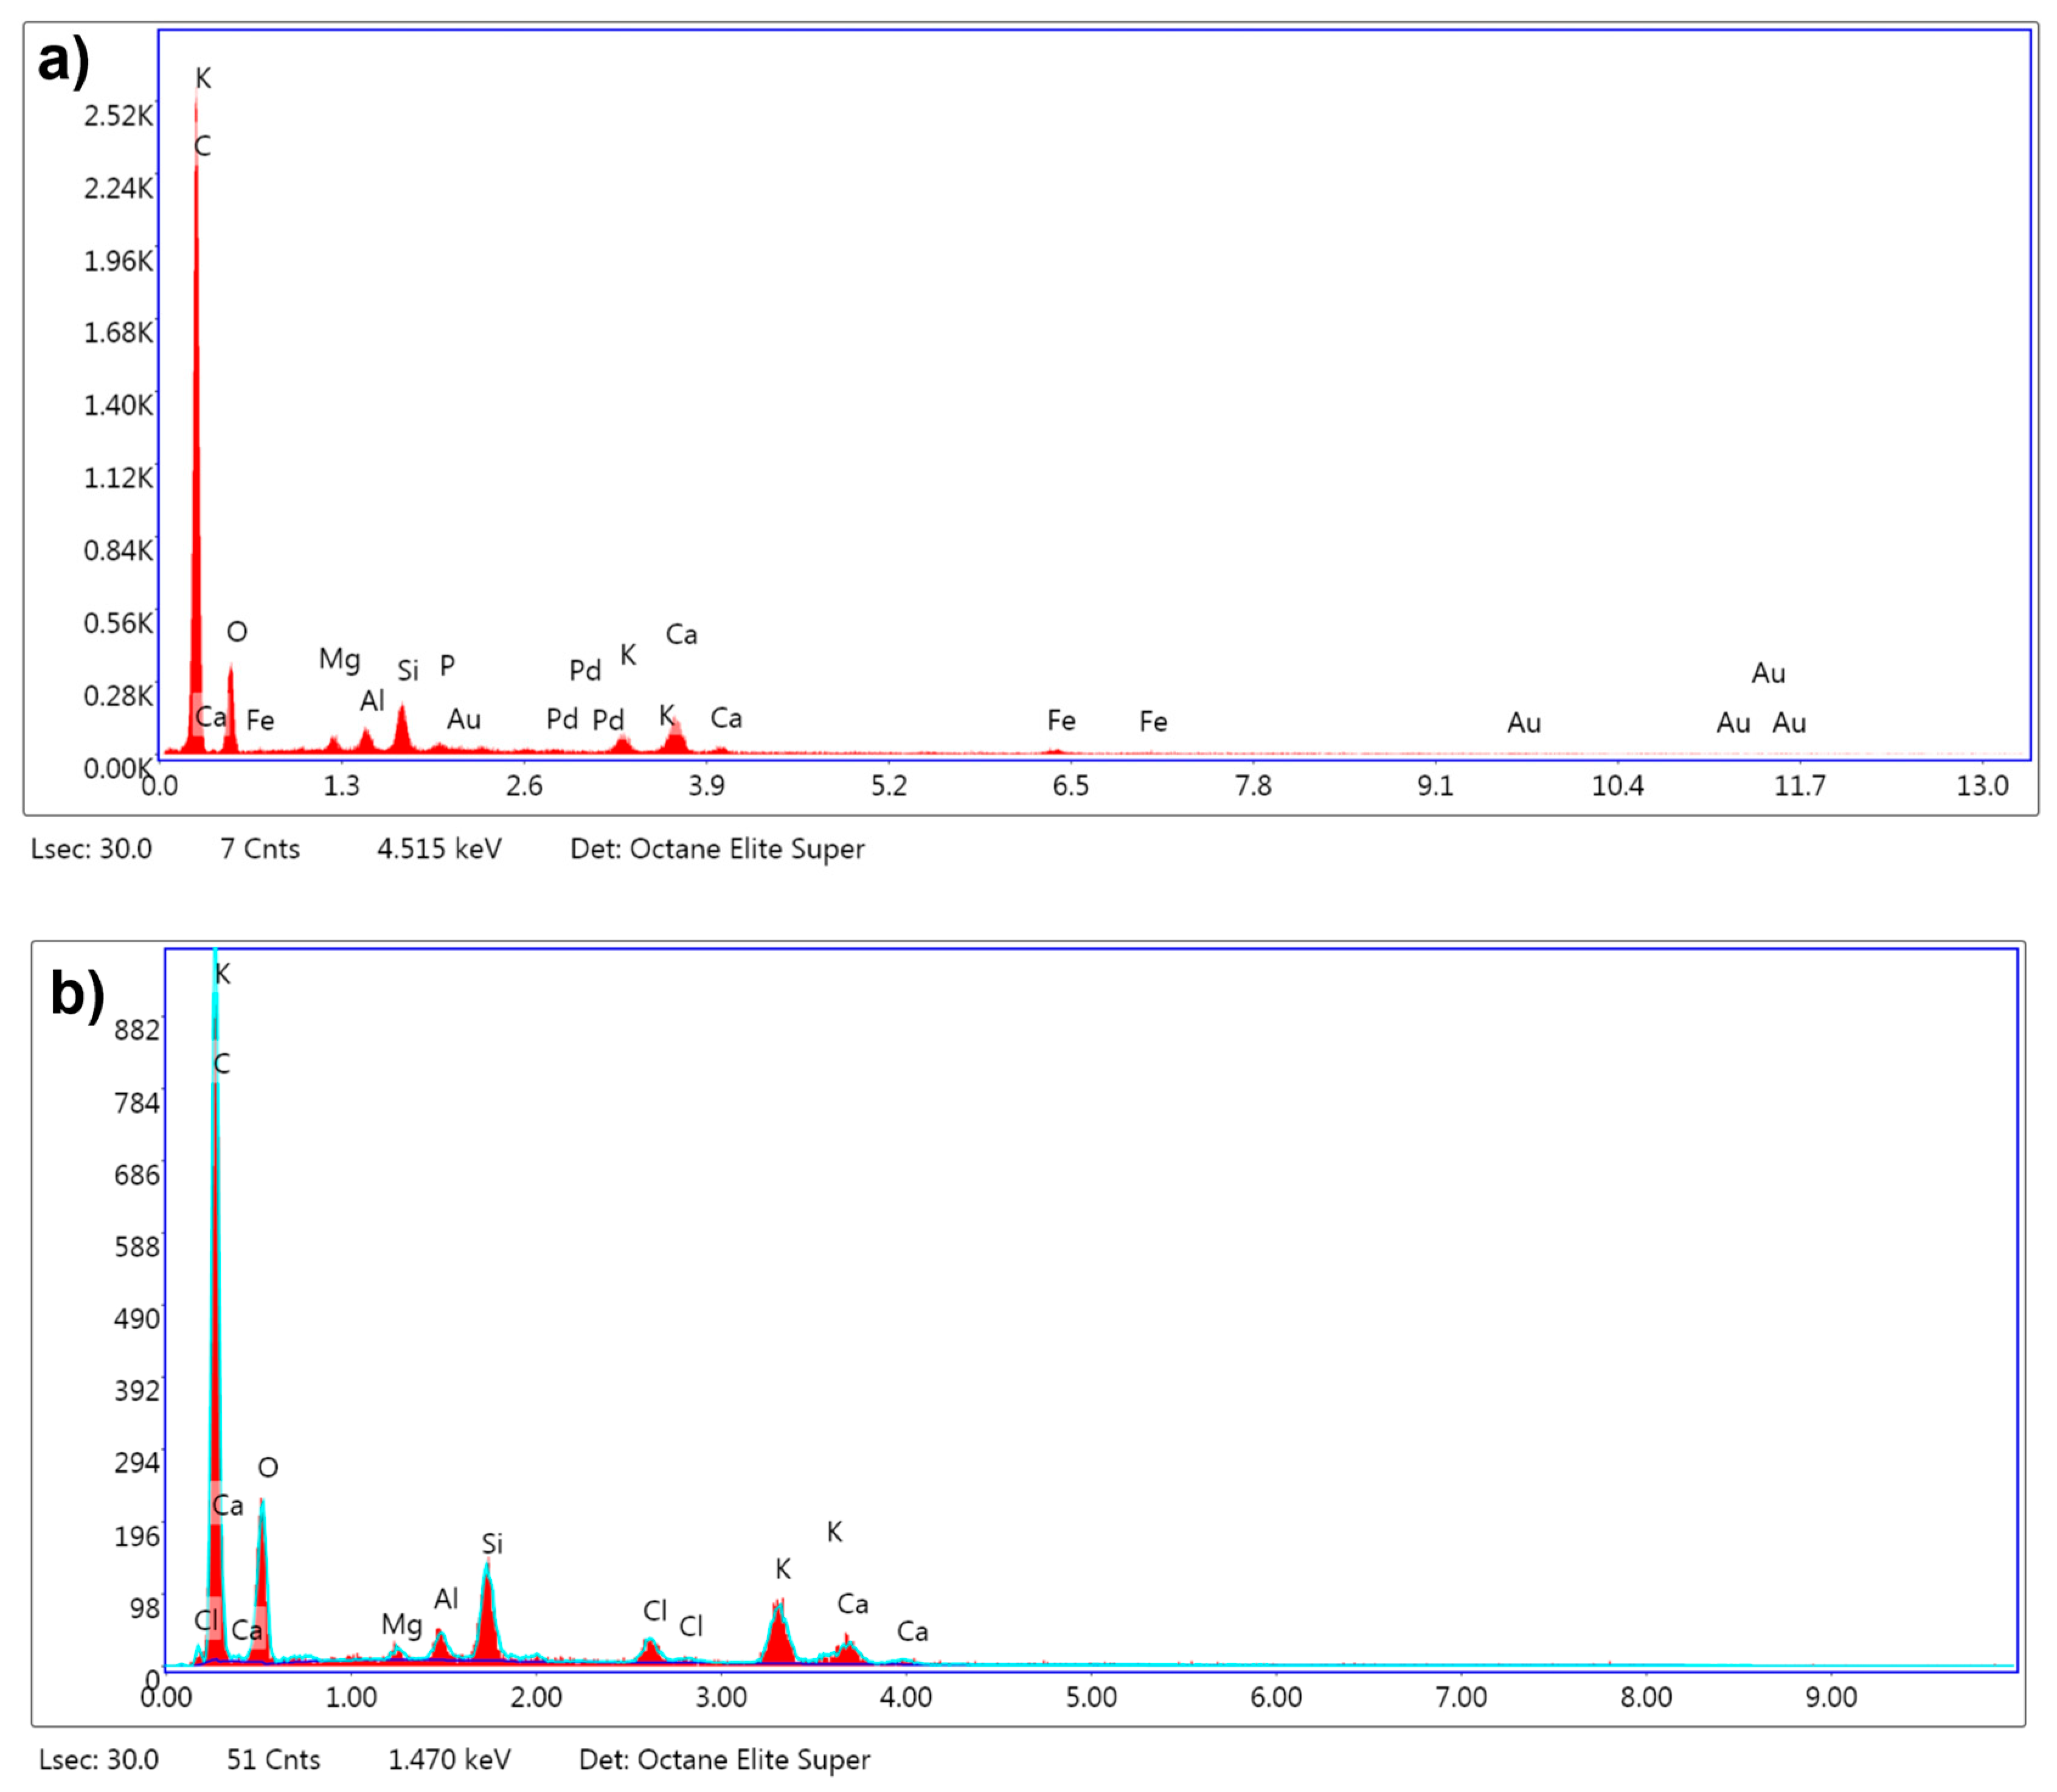
The EDX analysis revealed substantial changes in the elemental composition of the biochar following chemical activation with KOH at 800 °C, using an impregnation ratio of 3:1 under a nitrogen atmosphere. In its untreated form, as shown in
Figure 8a, the biochar predominantly consisted of carbon, comprising 73.9% of the total mass, indicative of its organic nature, with oxygen accounting for 16.1%. Upon activation, as depicted in
Figure 8b, the carbon content declined to 61.4%, likely due to partial oxidation and gasification processes at elevated temperatures, which resulted in the release of carbon species such as CO and CO
2. Although carbon is reduced, the remaining carbon has the potential to enhance the structural morphology and adsorption performance of the activated carbon. This potential is due to the predicted exhibition of an elevated degree of graphitization and thermal stability.
The increase in oxygen content to 19.0% after activation suggests the formation of oxygen-containing functional groups, such as hydroxyl and carboxyl groups; this can also be observed in the FTIR analysis shown in
Figure 6. These functional groups enhance the adsorption properties of the biochar by providing active sites for polar interactions and chemical reactions. The results indicated potassium enrichment from 1.5% to 7.6%, implying the incorporation of potassium compounds, such as potassium carbonate, originating from the KOH used during activation [
38]. The significantly higher BET surface area observed at 800 °C (498 m
2/g) implies the effective development of a porous structure and elucidates that this incorporation plays a pivotal role in promoting pore formation. The detection of chlorine in the activated carbon, which was absent in the untreated sample, can be attributed to residual chlorine from the post-activation washing step with hydrochloric acid (HCl). In the experimental procedure, the activated carbon samples were washed with a solution composed of 0.1 M HCl to remove residual activating agents, followed by thorough rinsing with distilled water until the pH stabilized within a neutral range. The presence of chlorine suggests that traces of the acid treatment may have remained, despite the rinsing process.
Although it is well documented that acid washing with HCl [
45] can effectively remove inorganic elements from carbon materials, the EDX results showed that certain inorganic elements, such as potassium, silicon, and aluminum, were still in the activated biochar. This indicates that while the acid treatment successfully eliminated some components, such as gold (Au), palladium (Pd), and iron (Fe), which were detected in the untreated biochar, other elements may have been retained due to their incorporation into the carbon structure during activation or the formation of stable compounds that were less susceptible to removal by the acid washing process.
The observed changes in elemental composition, increased oxygen content, and surface enrichment with potassium prove that the activation process produced a high-quality activated carbon with improved surface chemistry and porosity. These modifications make the biochar suitable for adsorption applications, validating the effectiveness of the chemical activation and post-treatment methods employed in this study.
3.5. STA (TGA/DSC)
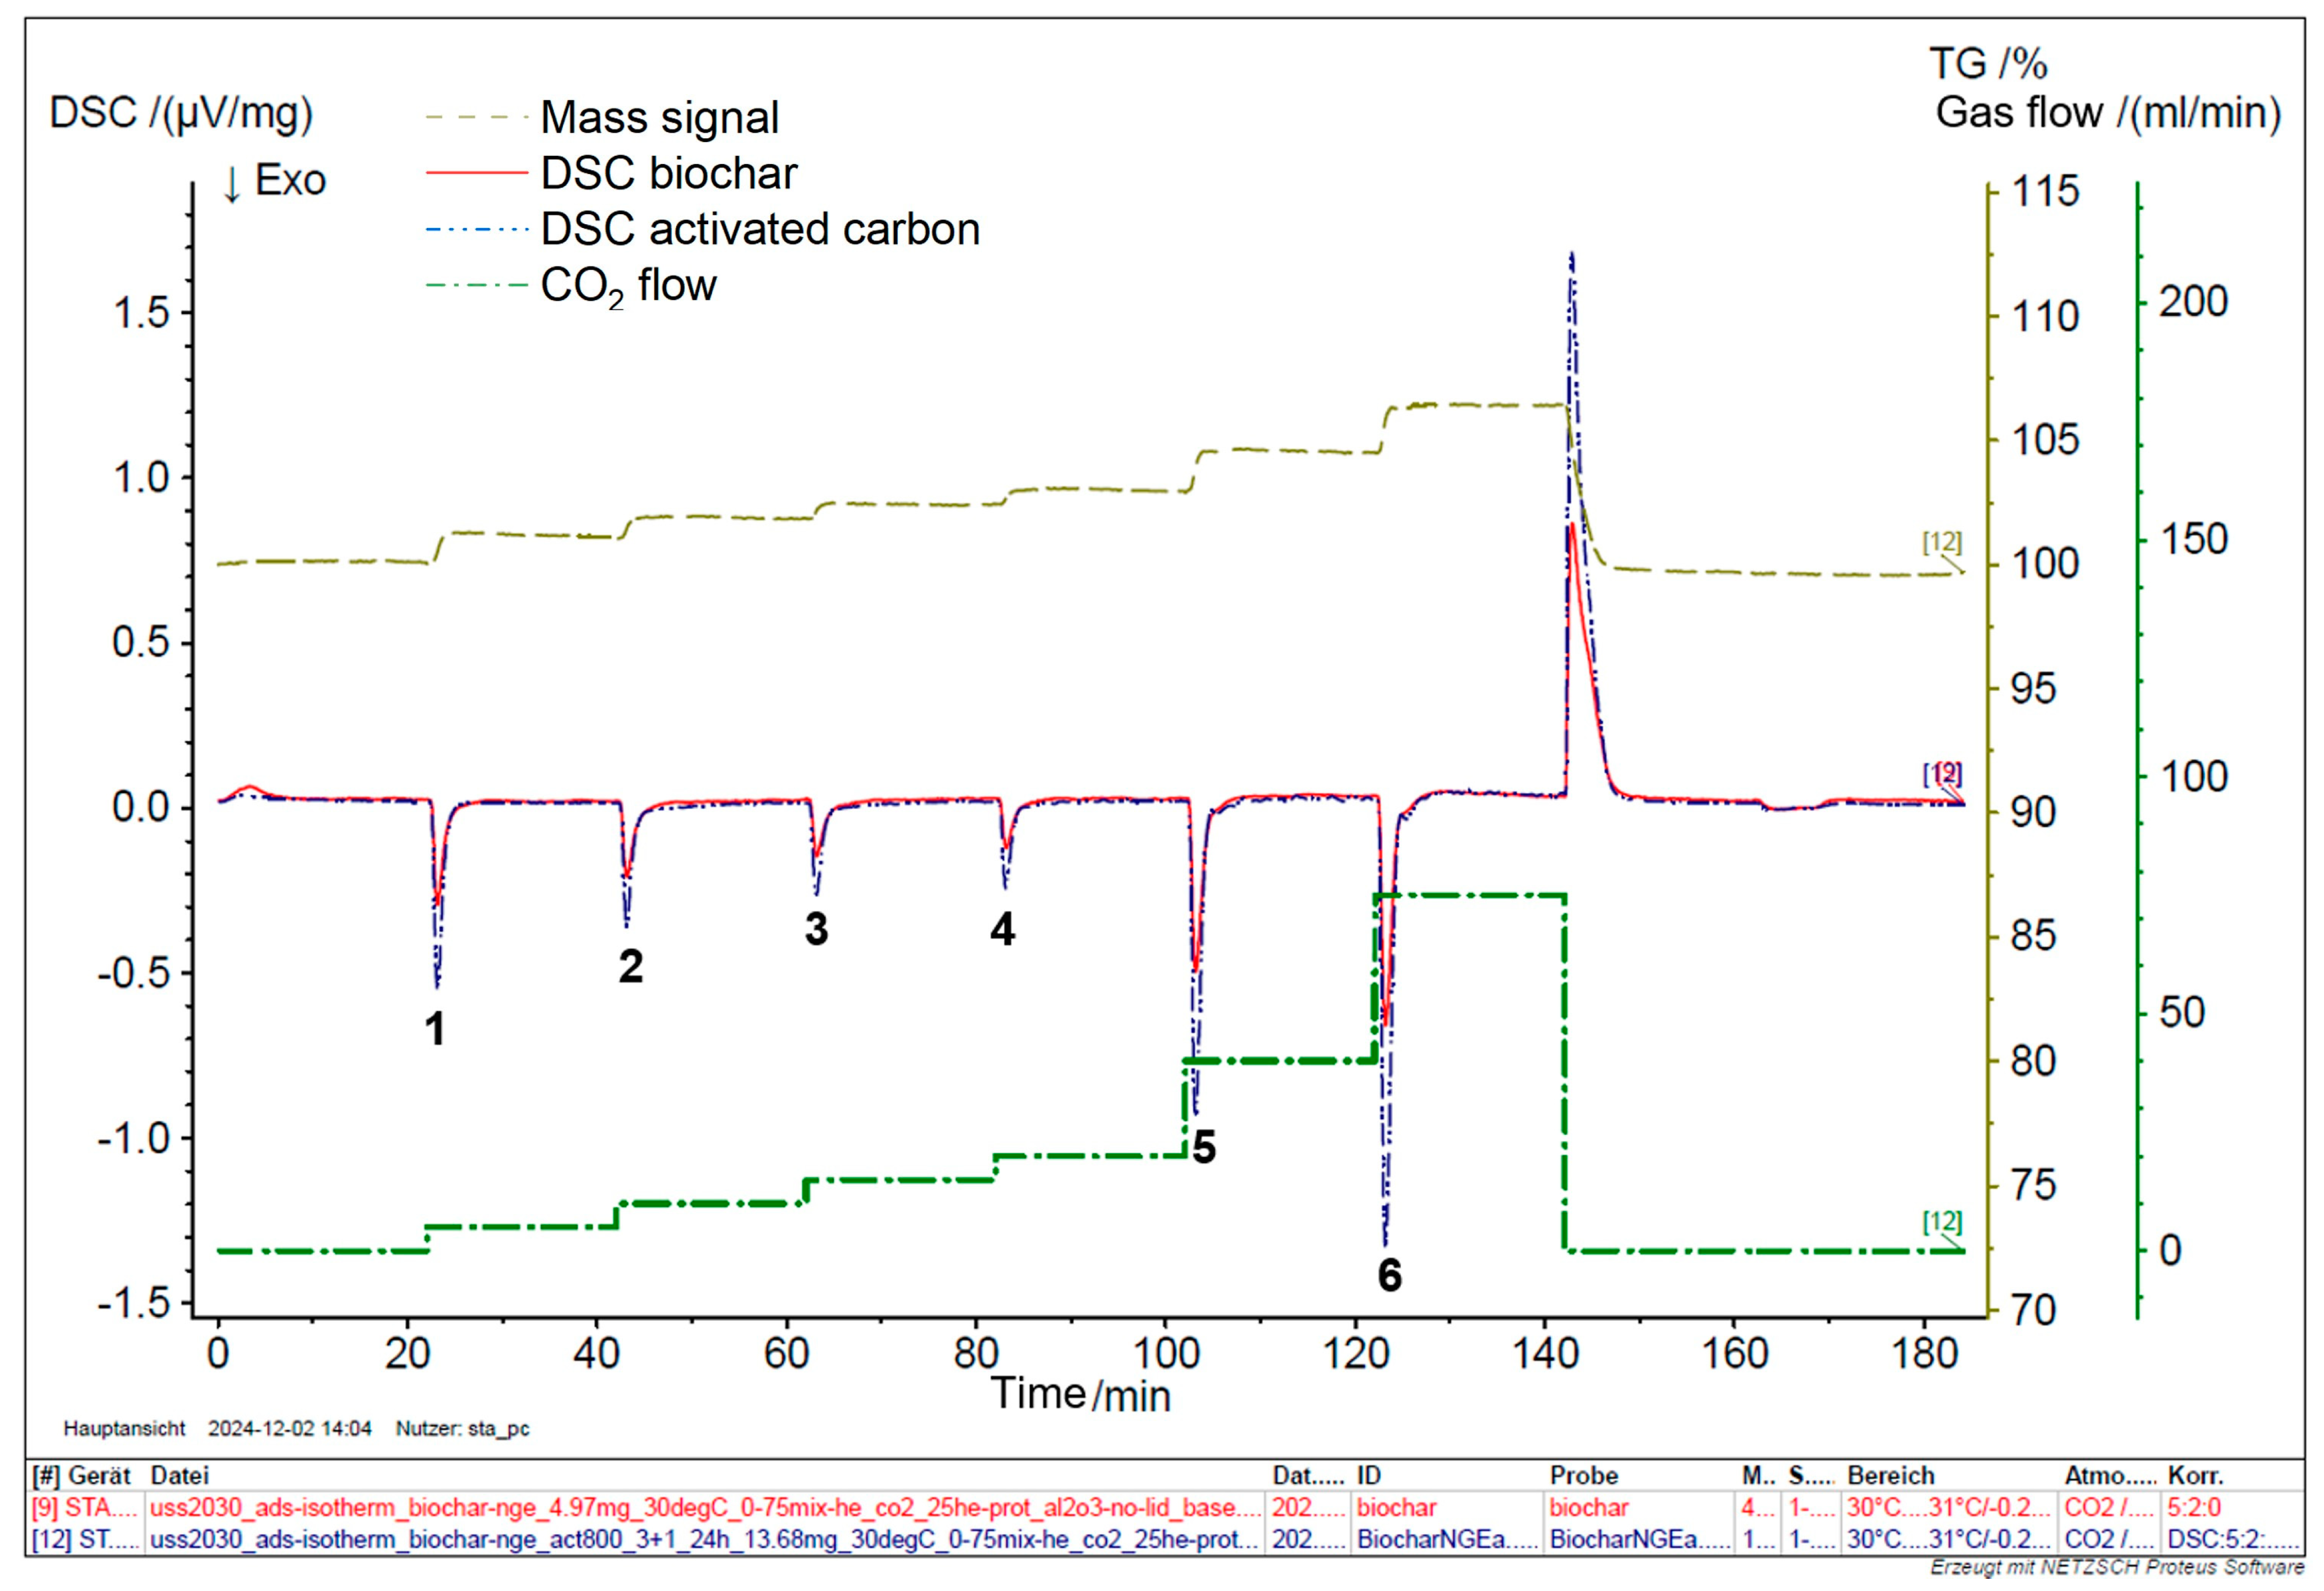
The Differential Scanning Calorimetry (DSC) analysis of raw and activated biochar was conducted systematically to evaluate their adsorption performance across various CO
2 concentrations, focusing on the impact of activation on enhancing this performance. A mixture of CO
2 and He was introduced to biochar and activated carbon at flow rates of 5, 10, 15, 20, 40, and 75 % at a temperature of 30 °C. The DSC analysis reveals that the thermal behavior of raw biochar is less pronounced compared to that of activated biochar. The activation process carried out under controlled conditions—specifically at 800 °C with a 3:1 impregnation ratio for 24 h—resulted in a substantial improvement in CO
2 adsorption properties, as shown in
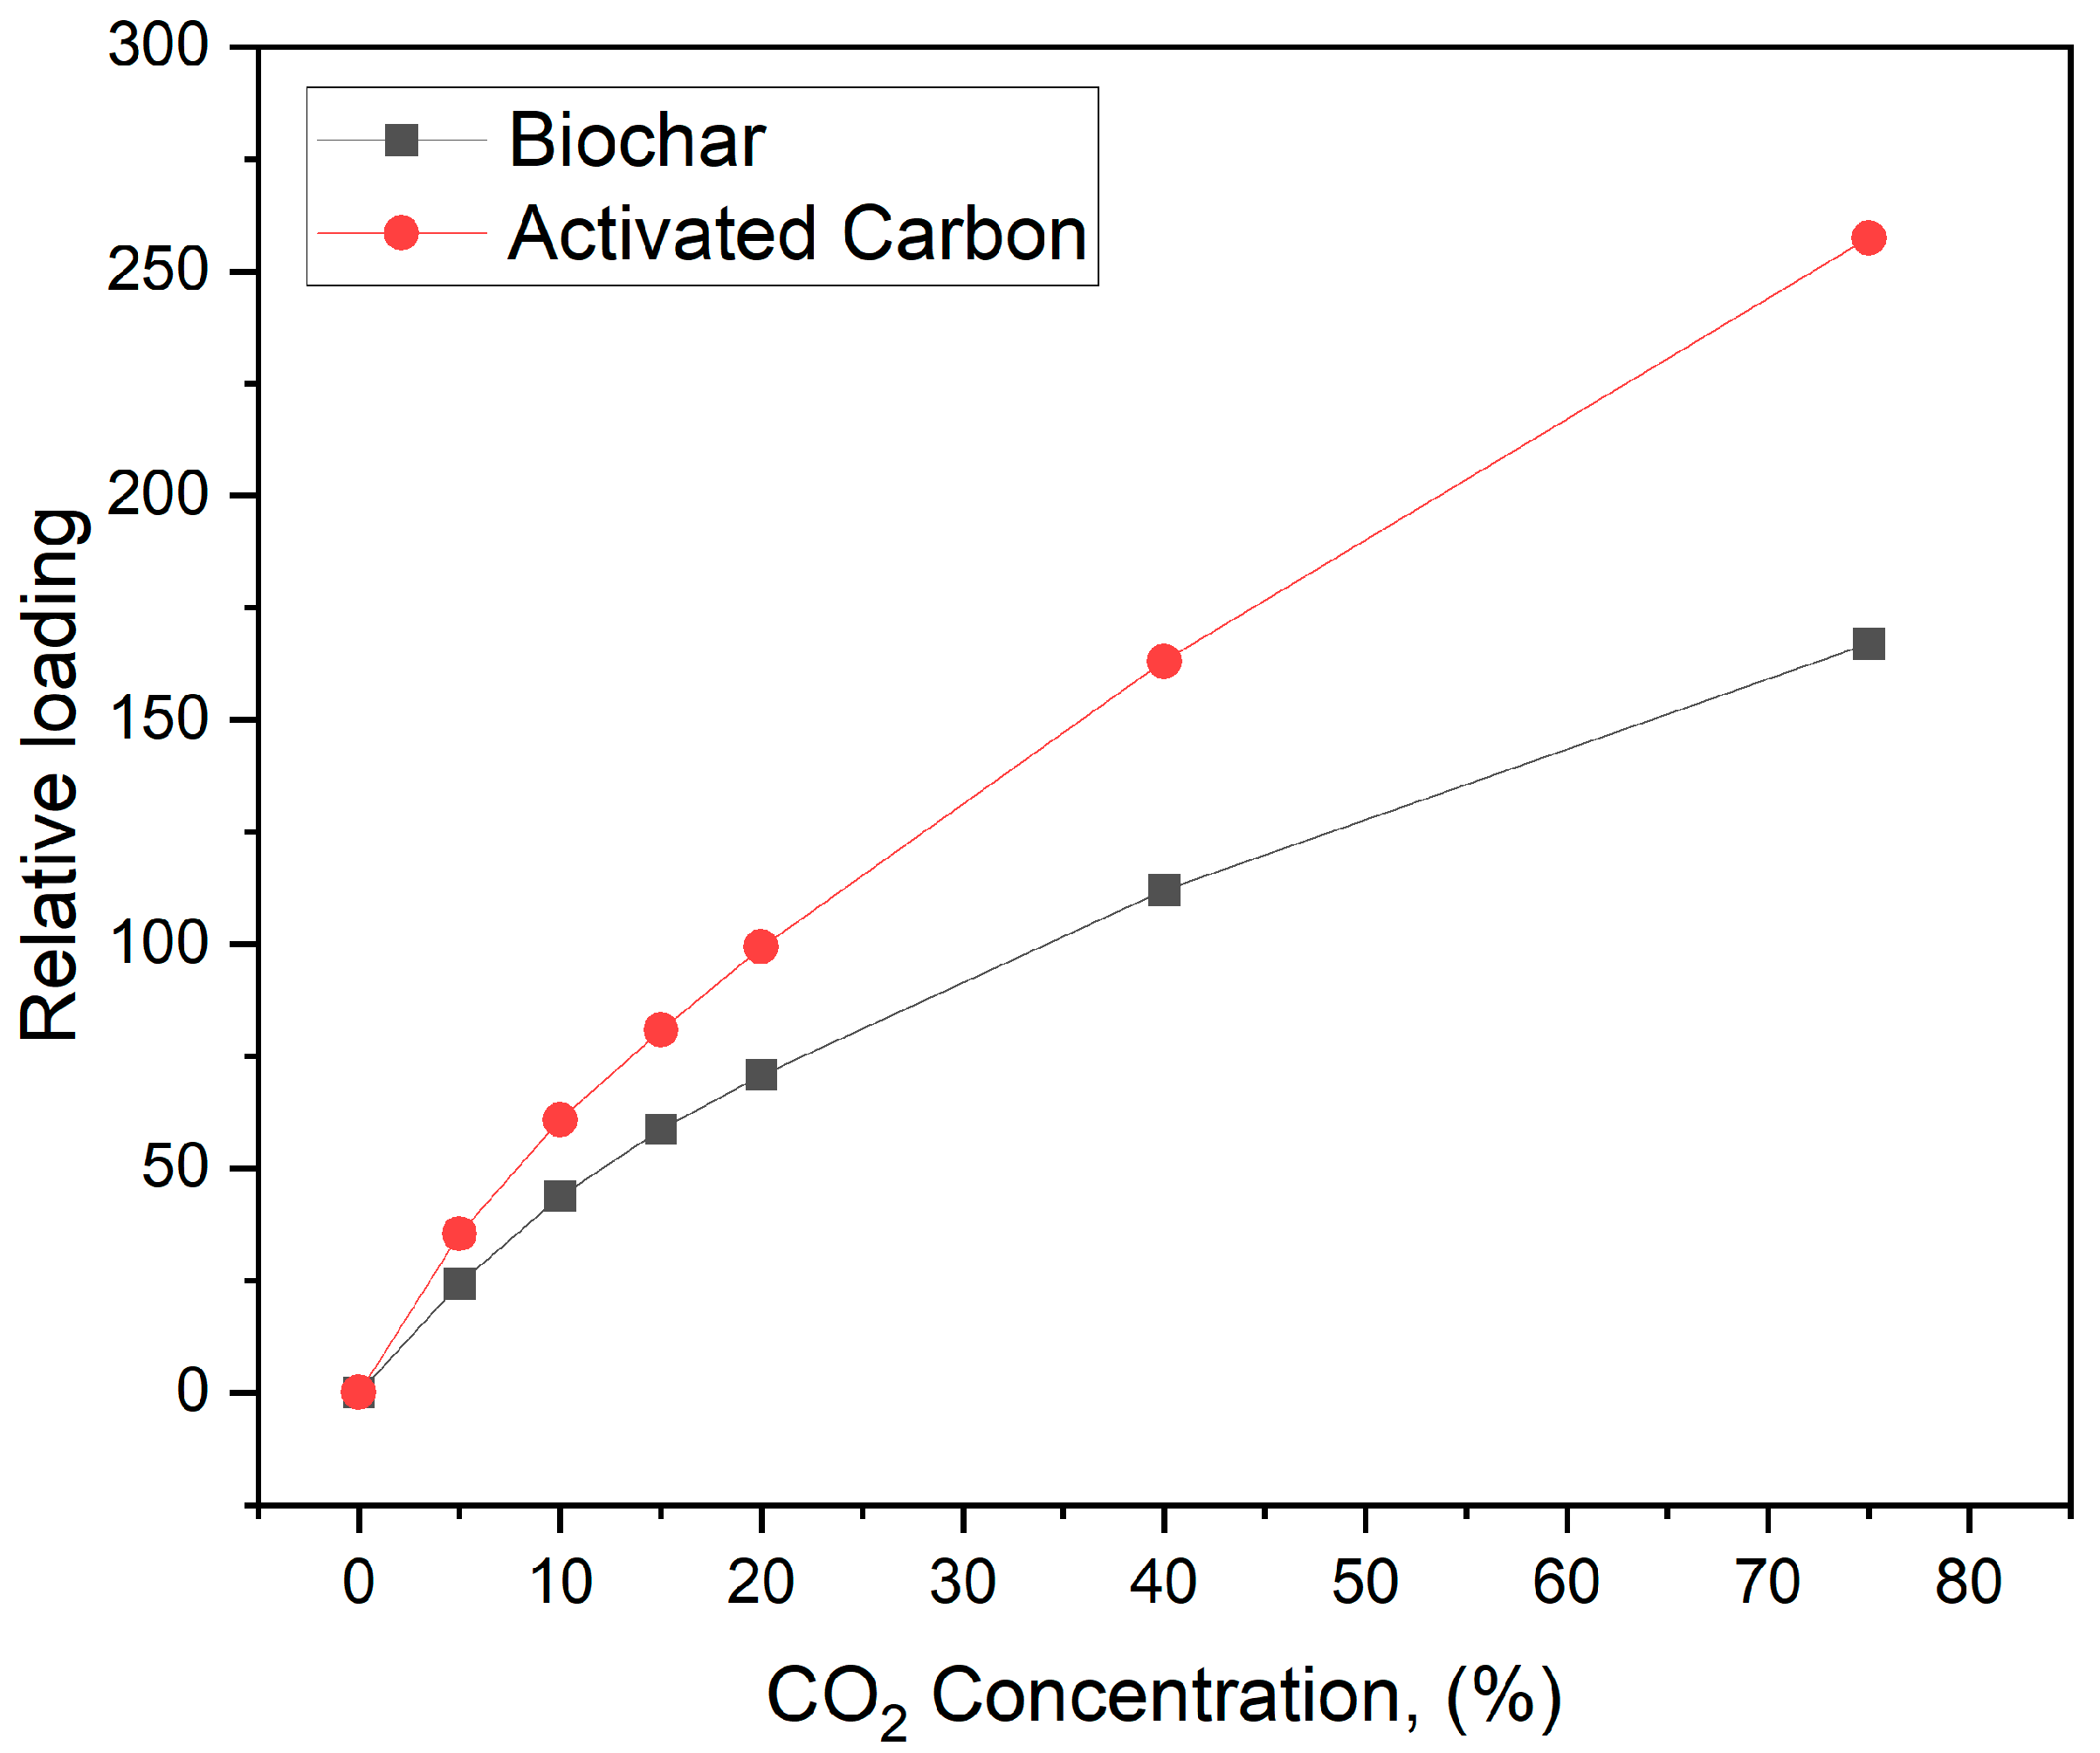
Figure 9. Notably, the area of the adsorption peak for CO
2 at 30 °C increased by approximately 34% post-activation, as detailed in
Table 2 and
Figure 10.
Compared to raw biochar, the enhanced CO2 adsorption performance by activated biochar can be primarily attributed to the activation process. Activated biochar features a significantly larger surface area (709 m2/g versus 200.3 m2/g), providing more gas adsorption sites. Also, the activation process produced a more intricate pore structure, including mesopores and micropores, thereby improving the ability of the material to trap gases. Moreover, activated biochar mainly has a lower ash content, which helps maximize the effective surface area available for adsorption. These factors collectively improve the physicochemical properties of activated biochar, making it a more effective material for CO2 gas adsorption, as evidenced by the increased adsorption peak areas observed in DSC analysis.
4. Discussion
This study highlights the potential of sunflower seed shell biochar as a sustainable raw material for producing activated carbon. The results demonstrate that KOH activation effectively enhances the porosity and adsorption properties of the material. The impacts of activation temperature, KOH-to-biochar ratio, and activation time were analyzed to determine the best conditions for optimizing both carbon yield and surface area.
Activation temperature played a key role in balancing carbon retention and pore formation. As expected, increasing the temperature led to a reduction in yield due to the release of volatile compounds and enhanced carbon gasification. The highest yield, 66.3%, was observed at 750 °C, indicating that this temperature provided an optimal balance between minimizing carbon loss and maximizing pore formation. The highest yield, 66.3%, was observed at 750 °C, indicating that this temperature provided an optimal balance between minimizing carbon loss and maximizing pore formation, but this finding needs to be proven by conducting more investigation in the future.
The KOH-to-biochar ratio also had a significant effect on porosity and yield. Increasing the ratio promoted greater pore development, as more KOH was available to react with the carbon structure. The 3:1 ratio resulted in the highest porosity while still maintaining a competitive yield. This can be attributed to the catalytic effect of potassium, which enhances the activation process. However, higher KOH ratios also led to more residual ash content, which may influence the purity of the final material.
The activation time was another critical factor influencing pore development. The highest surface area, 708 m2/g, was achieved at 800 °C with a 3:1 KOH ratio and a 24-h activation period. Longer activation times provided more contact between KOH and carbon, allowing for deeper etching of the structure and the formation of additional micropores. As new pores formed, the surface area further increased, accelerating the activation process. This explains why extended activation times resulted in more extensive pore development. The predominance of micropores, with an average pore size of 1.16 nm, suggests that this material is well suited for applications such as CO2 adsorption.
The findings suggest that sunflower seed shell biochar can serve as a cost-effective and environmentally friendly precursor for activated carbon production. The balance achieved between yield, porosity, and residual potassium content indicates that process optimization can lead to a high-performance adsorbent suitable for various applications. Further research could focus on refining post-activation washing techniques to enhance material purity while preserving its structural advantages. Additionally, future studies should evaluate the adsorption performance of this material under real-world conditions to assess its industrial potential.
This study explores the importance of utilizing renewable biomass sources, not only as an efficient and economical alternative for the production of activated carbon but also as a way to contribute to environmental sustainability. This research emphasizes the promising potential of biochar produced from sunflower seed shells as a sustainable precursor for activated carbon production through KOH activation.
In particular, the research was conducted to optimize biochar conversion to activated carbon via KOH. Various activation parameters were examined, including KOH/biochar impregnation ratios (1:1, 2:1, 3:1) and activation temperatures (600 °C, 700 °C, 750 °C, 800 °C) over different durations (5 h, 12 h, and 24 h). A high yield of approximately 66.3% of activated carbon was achieved at 750 °C with an impregnation ratio of 3:1.
The optimal impregnation ratio for activated biochar was found to be 3:1, processed at 800 °C for 24 h. BET analysis under these conditions revealed a specific surface area of 708 m2/g, a total pore volume of 0.41 cm3/g, and an average pore size of 1.16 nm, indicating significant potential for high adsorption capacity. This substantial surface area enhances its efficiency in adsorbing various pollutants like CO2, making it a valuable source for multiple applications. Considering all of this, we were able to demonstrate a feasible process using biochar as a sustainable resource to obtain high-quality activated carbon.

 ,
, 

