Abstract
Amid the increasing demands for ecological civilization and food security, addressing conflicts between agricultural and ecological functions has become a critical priority in spatial governance. Focusing on the Chang-Zhu-Tan Urban Cluster, this study establishes a multi-indicator evaluation framework and employs a weighted model to measure agricultural and ecological functions. The ESDA model characterizes the spatial distribution and clustering patterns of conflicts, while the RF model identifies the key drivers and underlying mechanisms. The results indicate the following: (1) Agricultural functions exhibit a “center-weak, periphery-strong” spatial pattern, with high-function zones covering over 60% of the area, whereas ecological functions are primarily concentrated in low-function zones, with high-function areas localized in the northeast. Overall, agro-ecological functionality declined from 2000 to 2020, accompanied by increased gradient differentiation. (2) High-conflict zones decreased by 7.73% during the study period, while medium-conflict and conflict-free zones expanded. Spatially, a trend of “peripheral mitigation of high conflicts and central expansion of low conflicts” emerged. (3) Natural environmental factors were the primary drivers of conflict dynamics, while land use factors gained significance over time. Elevation and slope dominated in 2000 and 2020, whereas land use economic density and crop planting area were more influential in 2010. Synergistic effects were observed, with slope–precipitation interactions providing the strongest explanatory power. This study offers empirical insights into managing agricultural–ecological conflicts, thereby contributing to enhanced spatial governance and sustainable development practices.
1. Introduction
Land use functions (LUF) encompass three primary domains: agriculture, ecology, and urbanization. These functions link natural and social systems, forming the foundation for coordinated regional development [1]. As urbanization and industrialization progress, land use patterns have shifted, increasing demand and complicating coordination. This has placed substantial pressure on territorial development. In the context of ecological civilization and food security, agricultural expansion is essential for food production but often leads to ecological degradation. Simultaneously, ecological protection measures limit the expansion of agricultural land. The resulting competition for resources and the imbalance between agriculture and ecology are significant challenges for sustainable development [2]. Over time, the relationship among these domains has evolved from simple spatial allocation to complex competition and trade-offs [3,4]. The overlap between ecological protection areas and high-yield farmland intensifies this conflict, heightening both resource competition and environmental pressures [5]. The “National Territorial Spatial Planning Outline (2021–2035)” highlights the need to optimize the spatial arrangement of agricultural, ecological, and urban functions. Identifying the characteristics of agricultural–ecological function conflicts, understanding their drivers, and proposing control strategies are vital for optimizing land use and promoting regional coordination. However, existing research often focuses on broad spatial layouts of functional zones or individual functional spaces [6,7]. A more detailed study of ecologically sensitive yet agriculturally significant urban agglomerations will provide valuable theoretical support for regional coordination and sustainable territorial development.
The Chang-Zhu-Tan Urban Agglomeration is rich in ecological resources, particularly the unique large-scale urban green heart area in China. This region provides vital ecological services such as water conservation and air purification. As an ecological barrier, it plays a key role in ensuring ecological security and supporting sustainable development. However, rapid urbanization, population growth, and the increasing demand for agricultural land due to food security concerns are putting significant pressure on these ecological areas. This is especially evident in the green heart area, where the expansion of agriculture conflicts with ecological protection efforts. Urban expansion has intensified the competition for land between agriculture and ecology, threatening ecological stability and deepening the conflict. Therefore, the Chang-Zhu-Tan Urban Agglomeration is an ideal region to study the “agriculture–ecology” function conflict.
Land use conflict (LUC) arises from resource scarcity and functional spillover, leading to disputes over resource allocation due to competition in human–environment interactions [8,9]. Specifically, the conflict between agricultural and ecological functions stems from competition for space and resources, as agriculture and ecological protection vie for limited land. Recent advancements in ArcGIS 10.8 have significantly enhanced the ability to analyze and address land use conflicts, particularly those between agricultural and ecological functions. ArcGIS-based methods have evolved from basic spatial analysis tools to more sophisticated platforms capable of integrating multiple data sources, such as remote sensing imagery, socio-economic data, and environmental variables. One of the most notable advancements is the integration of machine learning algorithms, including Random Forest (RF) and Support Vector Machine (SVM), into ArcGIS platforms for more accurate conflict detection and driver identification. These techniques allow for the analysis of large, complex datasets and the identification of spatial patterns that were previously difficult to detect [10,11]. Conflict research has evolved from qualitative methods to quantitative approaches, and from static analysis to dynamic simulation [12]. Early studies primarily used qualitative descriptions, such as conflict summaries based on surveys, which lacked quantitative backing [13]. As remote sensing and spatial analysis tools have advanced, quantitative research has become dominant. For instance, landscape ecology methods use pattern metrics to analyze the impact of agricultural expansion on ecological space [14], while land use conflict indices precisely identify areas of conflict between agriculture and ecology [15]. However, these methods, mainly based on static perspectives, cannot capture dynamic changes. Recently, the integration of dynamic ArcGIS and remote sensing data has enabled real-time monitoring and evaluation of land use changes and their effects on ecological quality. The introduction of dynamic simulation models, such as CLUE-S and PLUS, allows for simulating land use dynamics and predicting functional conflicts under different policy scenarios [16,17]. Additionally, multi-criteria analysis (MCA) has led to the development of integrated evaluation systems using multi-source data to assess both the spatial distribution and intensity of agricultural and ecological conflicts, offering deeper insights into their causes [18,19]. This approach has proven flexible and adaptable in assessing conflicts in complex functional regions, particularly in the context of rapid urbanization.
Existing research highlights various drivers of conflict, including natural conditions, economic growth, resource use, institutional factors, and social inequalities [20]. Among these, natural conditions and economic development are considered the primary drivers. Variations in terrain, climate, and ecological sensitivity lead to uneven resource distribution [21]. Additionally, disparities in economic development, urbanization, and population distribution intensify conflicts between resource demand and allocation [22]. Researchers commonly use methods like geographic probing, MGWR, and Random Forest (RF) to analyze these factors [23,24,25]. The RF algorithm is particularly useful for ranking variable importance and resolving nonlinear relationships, especially in addressing multicollinearity. This has significantly aided the quantitative assessment and optimization of functional conflicts [26]. Governance strategies for conflict management typically focus on regional planning and spatial governance, aiming to mitigate conflicts through institutional frameworks and benefit-balancing mechanisms [27]. At the provincial level, functional zoning research mainly addresses resource allocation and spatial organization in urban planning, with particular emphasis on urban and metropolitan agglomeration contexts [28].
Building on this foundation, this study focused on the Chang-Zhu-Tan Metropolitan Area, and employed a multi-criteria evaluation system and GIS dynamic analysis to examine agricultural and ecological function conflicts, uncover their underlying mechanisms, and propose control strategies. These efforts aim to provide a scientific basis for optimizing territorial space. The main research questions are: (1) How can an evaluation system for agricultural and ecological functions be developed for precise quantification? (2) How can the characteristics and spatial distribution of agricultural and ecological function conflicts be identified? (3) What are the key drivers of these conflicts, and how can they be addressed? The research objectives are: (1) to develop a multi-criteria evaluation system to analyze the temporal and spatial distribution of agricultural and ecological functions between 2000 and 2020; (2) to identify the types and spatial characteristics of these conflicts; and (3) to use the Random Forest (RF) model to assess key influencing factors and propose a control strategy based on “precise regulation—regional guidance—functional synergy”, offering theoretical and practical insights for regional coordination and territorial governance.
2. Materials and Methods
2.1. Overview of the Study Area and Basic Data
2.1.1. Overview of the Study Area
Located in central-eastern Hunan Province [29], the Chang-Zhu-Tan Urban Agglomeration includes Changsha, Zhuzhou, Liling, the urban core of Xiangtan, Shaoshan, and Xiangtan County (Figure 1). The region’s terrain consists mainly of hills, mountains, and plains, with higher elevations to the east and west and a lower central area. In 2020, arable land made up 26.75%, while forest land accounted for 62.56%, together comprising 89.31% of the total land area. The green heart area, covering approximately 528 km2, is the largest urban green space in China and offers significant ecological value. However, rapid urbanization and industrialization have led to a gradual reduction in arable land, forest land, grasslands, and water bodies. Between 2000 and 2020, built-up land increased by 987.83 km2, with notable shifts in arable and forest land, intensifying the conflict between agricultural and ecological functions. This is especially evident in the green heart area, where population growth and rising food demand have led to more frequent agricultural activities. Land reclamation and rural settlement development have steadily encroached on ecological land, further heightening the conflict between agricultural expansion and ecological preservation. As a key zone of land use transformation, the Chang-Zhu-Tan Urban Agglomeration faces significant challenges in managing agricultural–ecological space conflicts [30]. These conflicts not only threaten the region’s sustainable development and territorial security but also underscore the urgent need for the coordinated management of agricultural and ecological functions.
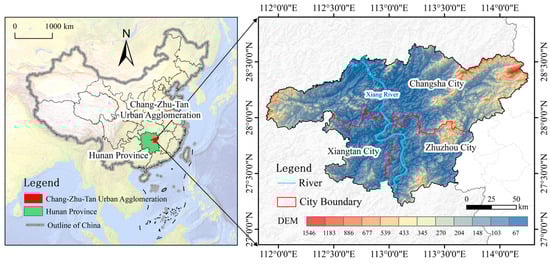
Figure 1.
Overview of the Study Area.
2.1.2. Data Sources and Preprocessing
The study integrates multi-source data for comprehensive calculations of agricultural and ecological functions (Table 1). Satellite imagery from 2000 to 2020, with most datasets at a 30 m resolution, was processed using ArcGIS 10.8 for tasks like grid clipping and spatial intersections. Land use data were preprocessed in ENVI 5.3, employing radiometric calibration, atmospheric correction, and clipping, followed by maximum likelihood classification into six types: arable land, forest, grassland, urban built-up land, water bodies, and unused land. Classification accuracy was validated with Kappa coefficients above 0.8, meeting the precision standards for this study. To align spatial data, all datasets were resampled to a 250 m resolution. Non-spatialized data, including textual and statistical datasets, were spatialized through geocoding and kriging interpolation. The study area was divided into 2 km × 2 km grid cells to standardize data formats, generating 4629 grid samples and ensuring consistency and methodological rigor.

Table 1.
Sources of research data.
2.2. Research Framework
The study follows four main steps (Figure 2). (1) Data Collection and Processing: This step focuses on the Chang-Zhu-Tan Urban Agglomeration. It integrates land use, climate, and socio-economic data, followed by processing to establish relevant indicators. (2) Agricultural and Ecological Function Evaluation: A multi-criteria system is used to assess agricultural and ecological functions. Using a weighted addition model, the functions from 2000 to 2020 are quantified, revealing their dynamic evolution and spatial distribution patterns. This step highlights gradient differentiation and temporal and spatial variability. Functions are classified into five categories—strong, medium-strong, medium, weak, and very weak—using natural breakpoint methods. (3) Identification of Function Conflicts and Pattern Analysis: A conflict identification matrix is constructed based on the evaluations, distinguishing five conflict types: strong, medium-strong, medium, weak, and no-conflict areas. The spatial evolution of these conflicts is analyzed, and the ESDA model quantifies spatial clustering of conflict zones. (4) Analysis of Conflict Drivers and Control Pathways: To explore the drivers of agricultural and ecological conflicts, an indicator system is developed that incorporates natural, socio-economic, and land use factors. The RF model assesses the importance of nine key features and their interactions. Based on these findings, the study identifies the main drivers and proposes a three-dimensional control strategy: “precise regulation—regional guidance—functional synergy”.

Figure 2.
Research Framework.
2.3. Construction of the Functional System
2.3.1. Construction of the Multi-Indicator Evaluation System
When a land parcel serves multiple functions simultaneously, differing demands from various stakeholders, such as those related to agricultural production, ecological conservation, and economic development, are likely to cause conflicts in land use functions [1]. This study employs a hierarchical evaluation system based on a “goal–criterion–indicator” framework. Indicator selection combines commonly used, high-frequency metrics with region-specific characteristics, while also considering policy documents such as the “Land Use Current Classification [31]” and the “Special Plan for Farmland Protection and Territorial Spatial Planning of Hunan Province (2021–2035)”. This ensures that the methodology aligns with the region’s actual needs.
In selecting agricultural function evaluation indicators (Table 2), key metrics reflecting agricultural regulation, supply capacity, and production efficiency were prioritized. Agricultural baseline indicators, such as land use types, soil moisture, and cultivated land patch size, quantify the regional agricultural resource base. These indicators, particularly in areas with intense resource competition, help reveal land use carrying capacity and provide context for potential conflicts. Agricultural regulation is assessed using indicators like irrigation area, NPP, and NDVI, which reflect agricultural productivity, vegetation cover, and water resource regulation, highlighting conflicts between agricultural expansion and ecosystem health. Agricultural production is evaluated based on total agricultural machinery power, the proportion of agricultural output from farming, forestry, animal husbandry, and fisheries, and crop yield per unit area. These indicators reflect agricultural inputs and outputs, revealing expansion efficiency and economic returns, while providing data for conflict assessment. In evaluating ecological functions (Table 3), negative indicators such as CO2 emissions highlight the adverse effects of agricultural activities on the environment, offering quantitative evidence of ecological degradation and carbon emissions. Positive indicators, including the size of forest and grassland patches, wetland areas, and current land use types, provide data on ecological resource distribution, supporting conflict evaluation. FVC and AGPP assess ecosystem purification and carbon sequestration, revealing the impact of agricultural expansion on ecological function. Biodiversity, hydrological regulation, and soil conservation capacity assess ecosystem stability, offering quantitative support for evaluating ecological function stability in conflict assessments.
Table 2.
Multi-index evaluation system for agricultural functions.
Table 3.
Multi-index evaluation system for ecologiacl functions.
2.3.2. Standardization, Classification, and Weight Calculation of Indicators
Different types of indicators require distinct standardization methods. To address the effects of polarity, dimensionality, and magnitude, this study applies range normalization, scaling numerical variables between 0 and 1 for comparability. Qualitative indicators, such as land use types, are classified based on the Chinese Land Use Classification system, while quantitative indicators, including NPP, NDVI, and CO2 emissions, are categorized using the natural breakpoint method [34]. The study uses the entropy weight method to assign weights to indicators. This method evaluates the information each value conveys, based on the data’s statistical properties, reducing subjectivity in expert judgment. While other methods, such as principal component analysis and cluster analysis, were considered, the entropy weight method was chosen for its ability to eliminate dimensionality effects and accurately reflect each indicator’s impact, ensuring high precision. This method guarantees the objectivity and scientific rigor of the indicators, making it well-suited for comprehensive evaluations involving multiple dimensions and categories. The formulas for standardizing the data and calculating weights are as follows:
In these equations, xij represents the value of the j indicator for the i sample, wj denotes the weight of the j indicatot, n is the total number of indicators, and rj refers to the entropy redundancy of the j indicator.
2.3.3. Calculation of Functional Evaluation Values and Intensity Classification
By applying the multi-criteria evaluation indicator system and weight calculations [35], a weighted index model was employed to evaluate agricultural and ecological functions within individual geographic grid units. This model enables a comprehensive analysis of how changes in single or multiple indicators affect agricultural and ecological functions, offering an integrated and holistic assessment of functional performance. The formula used for this evaluation is as follows:
In the formula, Fij represents the comprehensive evaluation value of the land space function for grid cell i, ωi,criteria is the weight of the criteria for grid cell i, ωi,indicator is the weight of the indicator for grid cell i, and fi,j is the indicator score for the agricultural or ecological function of land space in grid cell i, j.
Currently, no universally accepted standard exists for evaluating the comprehensive value of agricultural–ecological functions. Based on classification methods from the relevant literature [36,37] and an analysis of the strengths and weaknesses of agricultural and ecological functions in the Chang-Zhu-Tan Urban Agglomeration, alongside the need for consistent conflict classification, this study developed a grading standard. Comprehensive evaluation values, ranging from 0 to 100, reflect functionality, with higher scores denoting greater strength. Agricultural–ecological functions were categorized into five levels using the natural break method. However, variations in natural breakpoints across 2000, 2010, and 2020 rendered classification results for different periods non-comparable. To address this limitation and ensure consistency in a time series analysis, the natural breakpoints were adjusted across the three periods. Integer values close to the natural breakpoints were selected as unified thresholds (Table 4). This adjustment preserved the sensitivity of the natural break method while ensuring consistency in functional grading across temporal dimensions.
Table 4.
Natural Break Values and Adjusted Break Values for Functional Classification.
2.4. Construction of the Functional Conflict Identification Model
2.4.1. Types of Functional Conflicts
Building on research findings from related fields [38,39], a functional conflict identification model was developed based on functional evaluation results. Using ArcGIS, comprehensive functional values were arranged and combined to create a conflict comparison matrix capable of generating 25 functional combinations. To enhance the scientific validity and practical applicability of the classification, the relationships between value levels and functional forms in different combinations were analyzed. Similar combinations with comparable agricultural–ecological conflict evolution trends were merged into five distinct types of conflicts. These were categorized by conflict intensity into five levels: strong conflict, moderately strong conflict, moderate conflict, weak conflict, and no conflict (Table 5).
Table 5.
Classification of Function Conflict Types.
2.4.2. Exploratory Spatial Data Analysis (ESDA)
This study applies the ESDA model to examine the spatial autocorrelation of conflicts between agricultural and ecological functions [40]. By visualizing distribution patterns, ESDA identifies spatial distributions, clustering, and outliers, revealing the interactions within the study area. Additionally, the Local Moran’s I index detects spatial clustering in specific regions. The model uses global spatial autocorrelation analysis to assess the overall autocorrelation of conflicts across the entire study area. The global spatial autocorrelation is measured using Moran’s I index, as shown in the following formulas:
In the formulas, xi and xj represent the sample values for spatial units i and j, represents the mean value of the variable data, s2 is the variance, and Wij represents the spatial weight matrix. The value of Moran’s I typically ranges from −1 to 1. If I > 0, it signifies positive spatial autocorrelation, where high values cluster near other high values, and low values are adjacent to other low values. If I < 0, it indicates negative spatial autocorrelation, meaning high values are adjacent to low values. Generally, positive spatial autocorrelation is more common than negative spatial autocorrelation. If Moran’s I is close to 0, it indicates that the spatial distribution is random, and no significant spatial autocorrelation exists.
2.5. Identification of Key Influencing Factors
The RF algorithm is used to quantify the significance of factors influencing agricultural–ecological function conflicts [41]. The importance value reflects the contribution of each feature, with higher values indicating a greater impact on functional conflicts. The RF algorithm, commonly applied in classification and regression tasks, constructs multiple decision trees during training and assesses each factor’s contribution through its role in node splits. The Gini index is utilized to calculate feature importance. In this study, the RF model was implemented using the Random Forest and RF Permute packages in R 4.0, integrated within the Python 3.8 environment, with a fixed random seed of 123. Initial parameters were optimized by allocating 70% of the data for training and 30% for validation. This approach was employed to explore the relationships between agricultural–ecological function conflicts and their influencing factors.
3. Results
3.1. Spatiotemporal Variation Characteristics of Functions
From 2000 to 2020, agricultural and ecological functions underwent significant changes (Figure 3). The areas of weak, moderate, and moderately strong agricultural function zones increased notably, with growth rates of 37.1%, 12.7%, and 260.7%, respectively. In contrast, the areas of very weak and strong agricultural function zones decreased substantially, by 39.7% and 62.6%, respectively, highlighting evident changes across all functional levels. For ecological functions, weak and very weak zones expanded by 4.53% and 47.05%, respectively, while moderate, moderately strong, and strong zones declined by 16.12%, 24.61%, and 5.86%, respectively, indicating relatively stable overall changes in ecological functionality.
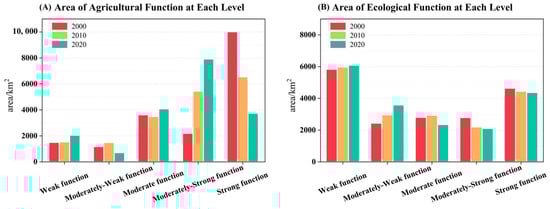
Figure 3.
Area of Agricultural and Ecological Function Levels.
In terms of spatial distribution, agricultural functions exhibited a “weak center, strong periphery” gradient pattern (Figure 4A–C). From 2000 to 2020, strong function zones experienced gradual degradation and shifted westward, with a continuous reduction in area. Moderately strong function zones, benefiting from contiguous cropland in the southwest and east and favorable natural conditions, expanded significantly, ultimately replacing strong zones as the core of agricultural functionality by 2020. Moderate function zones grew steadily, serving as transitional belts with increasingly concentrated distributions toward the core, reflecting clear gradient transitions. Weak and very weak zones were concentrated in urban cores, with their extent continuously shrinking due to urban expansion. Ecological functions demonstrated a “strong northeast, decreasing outward” distribution pattern (Figure 4D–F). Weak zones were predominant, followed by strong zones, while the proportions of very weak, moderate, and moderately strong zones were relatively balanced. Strong and moderately strong zones were predominantly located in the northern and western periphery, especially within the green heart region and surrounding forest and wetland areas. These zones play vital roles in carbon sequestration and hydrological regulation, with their overall area remaining relatively stable. Moderate zones, scattered in patches, also exhibited relative stability. Weak and very weak zones were concentrated in the central and western regions, expanding significantly due to urban expansion and land hardening, leading to further degradation of ecological functionality.

Figure 4.
Spatial pattern and functional level proportions of agricultural and ecological functions.
3.2. Functional Conflict Analysis
3.2.1. Spatiotemporal Variation in Function Conflicts
From 2000 to 2020, agricultural and ecological function conflicts underwent significant changes (Table 6). The area of strong conflict zones declined notably by 7.73%, while medium conflict and no-conflict zones expanded by 3.11% and 2.68%, respectively. In contrast, moderately strong and weak conflict zones exhibited relatively minor changes. These findings indicate a progressive reduction in the intensity of agricultural–ecological function conflicts over the study period.
Table 6.
Percentage Changes in Agricultural–Ecological Functional Conflict Types.
Agricultural and ecological function conflicts exhibited a spatial pattern characterized by the “peripheral mitigation of high conflicts and central expansion of low conflicts”, accompanied by a gradual flattening of the overall gradient and reduced spatial heterogeneity (Figure 5). Strong conflict zones were primarily concentrated in the peripheral areas of Liuyang City, Ningxiang City, and Lukou District, where in 2000, the overlap between agricultural activities and ecological function zones reached 53.27%. By 2020, as agricultural intensity decreased and forest functions recovered, this proportion declined to 52.06%, with a scattered distribution predominantly in the southern region. Conversely, no-conflict zones, centered around Changsha’s urban area, continued to expand, increasing by 2.68 percentage points, reflecting the low-conflict characteristics associated with urbanization. Weak conflict zones expanded marginally by 0.59 percentage points, primarily distributed in transitional areas between urban centers and ecological function zones. Moderately strong conflict zones increased by 1.36 percentage points, reflecting slight alleviation in areas previously under ecological pressure. Overall, functional conflict relationships showed notable improvement, with the spatial pattern shifting toward greater balance and coordination.
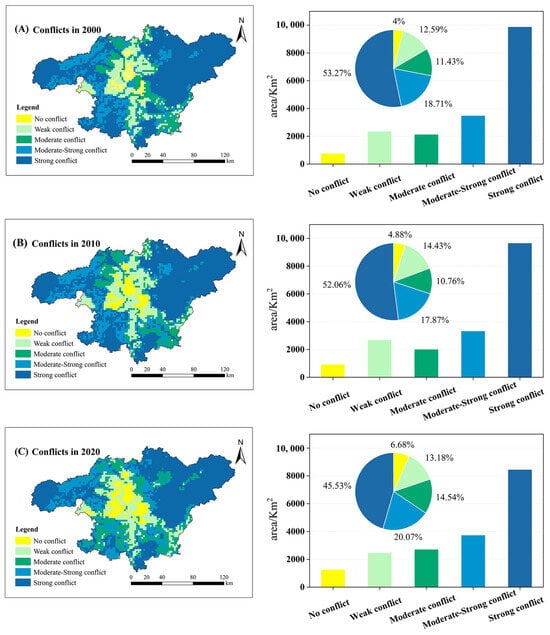
Figure 5.
Spatial patterns of agricultural–ecological functional conflicts and the area proportion of conflict types.
In terms of spatial dynamics (Figure 6), agricultural–ecological conflicts were predominantly characterized by unchanged areas, with sporadic distributions of weak and strong conflict zones. Between 2000 and 2010, conflict mitigation was concentrated in peripheral regions, such as the Yuhua District, Lusong District, and Wangcheng District, while unchanged areas occupied the majority of the spatial extent, forming a stable pattern. From 2010 to 2020, conflict intensification occurred primarily in central urban areas and northern regions, marked by a continued rise in moderate conflict levels. Certain areas remained at risk of escalating conflicts due to the resurgence of agricultural intensity.

Figure 6.
Changes in agricultural-ecological functional conflicts and chord diagram of conflict type transitions.
3.2.2. Spatial Autocorrelation of Functional Conflicts
From 2000 to 2020, the global Moran’s I for agricultural–ecological function conflicts in the Chang-Zhu-Tan Urban Agglomeration were 0.7722, 0.7721, and 0.7683, with corresponding Z-scores of 52.784, 52.772, and 52.515, and p-values of 0.0. These results indicate a statistically significant spatial positive correlation at the 99% confidence level, suggesting the clustering of high-conflict and low-conflict zones.
Local spatial autocorrelation analysis (Figure 7) revealed that “high–high” and “low–low” clusters accounted for substantial proportions of the total area, with “high–high” clusters being particularly prominent. From 2000 to 2020, these clusters covered 35.2%, 36.2%, and 34.2% of the total area, respectively. “High–high” clusters, strongly associated with strong conflict zones, were concentrated in the eastern, western, and southern peripheral areas. In 2000, they accounted for 53.27% of the total area, driven by significant overlap between agricultural activities and ecological function zones. However, as agricultural intensity declined and forest restoration efforts progressed, the extent and intensity of strong conflicts diminished. Conversely, “low–low” clusters, corresponding to no-conflict zones, were primarily located in central urban districts such as Yuhua, Yuelu, and Furong. Over time, their spatial extent decreased as urbanization and increased land use intensity encroached upon these areas. The reduction in “high–high” clusters highlights the effectiveness of ecological protection policies, while the contraction of “low–low” zones underscores the pressures of urban expansion on maintaining agricultural–ecological functional balance. Notably, conflict intensity has increased in the central urban regions, signaling emerging challenges for spatial governance.

Figure 7.
Local Spatial Auto correlation of “Agriculture–Ecology” Function Conflicts.
3.3. Key Influencing Factors of Functional Conflicts
3.3.1. Selection of Influencing Factors
The Chang-Zhu-Tan Urban Agglomeration, marked by substantial human–environment interaction, demonstrates a complex spatial overlap of agricultural, ecological, and urban construction lands, which complicates land use patterns. This study builds upon previous research by selecting independent variables closely linked to functional conflicts [23,24], while avoiding redundancy in functional value definitions. Key measurement factors were chosen from both “natural” and “human” dimensions (Table 7).
Table 7.
Indicator System for Factors Influencing Agricultural–Ecological Function Conflicts.
Natural environmental factors, such as elevation, slope, average annual temperature, and annual precipitation, directly influence the region’s agricultural and ecological functions. For example, elevation and slope affect agricultural suitability, while temperature and precipitation impact both agricultural productivity and ecological stability. Socioeconomic factors, including population density, public budget expenditure, and total retail sales of consumer goods, reflect the pressures of human activities on land use. Population density is directly related to land demand, public budget expenditure indicates government investment in land development, and total retail sales reveal the influence of regional economic development on land expansion. Land use factors, such as land economic density and crop planting area, reflect the intensity of land development and agricultural expansion, both of which play a critical role in the spatial competition between agricultural and ecological functions.
3.3.2. Identification and Analysis of Key Influencing Factors
To ensure accurate data processing and improve model performance, the data were standardized and outliers addressed. A Random Forest model was developed and evaluated using the test set. The model’s goodness of fit (R2) for 2000, 2010, and 2020 were 0.75, 0.74, and 0.81, respectively, all exceeding 0.5, indicating a good fit. The prediction error (RMSE) values were 0.18, 0.17, and 0.16, respectively, indicating minimal error. Therefore, the Random Forest model effectively captures the factors influencing agricultural–ecological function conflicts in the urban agglomeration.
The importance of influencing factors was ranked using the Incremental Mean Square Error (IncMSE) method, where higher IncMSE values indicate greater importance to the dependent variable. The model results (Figure 8) showed that X1, X2, X8, and X9 were the primary factors influencing function conflicts. Among these, X1 and X2 were the most influential, with IncMSE values of 26.91% and 25.49% in 2000, and 27.55% and 26.88% in 2020, respectively. These results highlight the key role of natural geographical conditions in land use transformation, with variations directly affecting ecosystem stability and agricultural productivity. X8 and X9 were also significant, with IncMSE values of 29.14% and 20.55% in 2010, reflecting the impact of land use intensity and agricultural activities on function conflicts. The remaining factors had weaker effects, with IncMSE values below 15%.

Figure 8.
Ranking of Feature and Feature Interaction Importance.
Correlation analysis revealed significant interactions between the factors. Natural factors showed particularly strong interactions. For example, the interactions between X2 and X1, and X3 and X4, were significant across all periods, jointly influencing the spatial distribution of agriculture and ecology, and intensifying the spatial clustering of conflicts. Additionally, the interaction between natural environmental and land use factors became more pronounced. In 2020, the interaction between X3 and X9 significantly increased, indicating that land development in complex terrain areas exacerbates conflicts. Moreover, the correlation between X9 and X4 suggests that agriculture’s increasing dependence on water resources may amplify localized conflicts. Overall, natural factors are the primary drivers of agricultural–ecological function conflicts, while human factors, such as land use intensity and economic activity, indirectly influence the spatial distribution of these conflicts.
3.3.3. Spatial Conflict Mechanism
Spatial conflicts arise from the interaction between “natural” and “human” factors, influenced by the limited availability, competition, and functional spillover of spatial resources. This creates a logical chain of “causes—manifestations—effects” (Figure 9). The spatial heterogeneity of natural conditions, combined with increasing demands for land due to socioeconomic development, intensifies the imbalance between agricultural and ecological functions in the context of rapid urbanization, further driving conflict formation and evolution. These conflicts take various forms: the unchecked expansion of urban construction land, which encroaches on high-quality farmland and reduces agricultural space; high-intensity agricultural development, which causes soil degradation, erosion, and pollution, weakening ecosystem stability; and the expansion of ecological protection zones, which, while enhancing ecological services, worsens land use efficiency losses and functional competition by occupying agricultural land. The effects of these conflicts are reflected in imbalanced spatial patterns and growing pressures on sustainable development. The uneven distribution of agricultural and ecological land leads to a decline in overall ecological service capacity, while the imbalance in urban–rural resource allocation and disorderly land use further threatens food security and ecological stability, posing a significant challenge to green and coordinated development. Ultimately, spatial conflicts result from the intersection between natural conditions and human activities, highlighting the lack of effective coordination in spatial resource allocation and functional integration amid rapid urbanization.
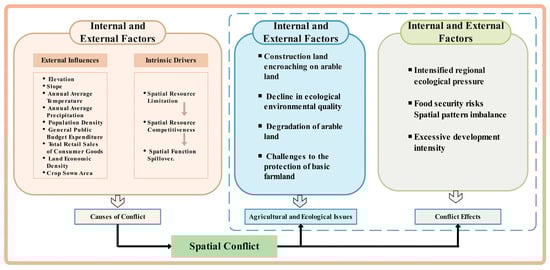
Figure 9.
Mechanism of Spatial Conflict Formation.
3.4. Spatial Conflict Control Pathway
Based on the agricultural–ecological function conflict mechanism and regional differences, the conflict areas are classified into five types: suitable remediation areas, key remediation areas, priority potential zones, moderate optimization zones, and stability preservation zones. For different regional characteristics, a “precise regulation—zoning guidance—functional synergy” three-dimensional management path is proposed (Figure 10), specifying differentiated control strategies to alleviate spatial conflicts and achieve sustainable development.

Figure 10.
Spatial Conflict Regulation Pathways.
3.4.1. Precise Regulation: Purpose-Driven Control Based on Functional Zoning
In regions with severe conflicts, such as Liuyang City, Ningxiang City, and Lukou District, areas marked by intensive agriculture and high ecological sensitivity, basic farmland protection red lines, alongside strict land use controls. Integrating land suitability and ecological service assessments will allow for the scientific delineation of boundaries between ecological protection zones and agricultural functional zones, preventing overlap between high-intensity agriculture and vulnerable ecosystems. This will help mitigate ecological conflicts. For example, in high-conflict areas, policies like converting farmland to forests or grasslands could be implemented as ecological compensation measures, along with the establishment of ecological corridors to improve connectivity and system stability. In key remediation areas, the “three zones and three lines” planning framework should be applied to manage ecological and agricultural functional areas differently, ensuring the principle of “ecology first, orderly land use”.
3.4.2. Zoning Guidance: Promoting the Tiered Optimization of Agricultural and Ecological Functions
In priority development areas and moderately optimized regions, such as Changsha County, Wangcheng District, and parts of Zhuzhou City, where agricultural and ecological conflicts are moderate, yet significant optimization potential exists—green infrastructure such as soil conservation forests and wetland corridors should be developed to enhance ecological services, reduce soil erosion, and address water scarcity, thus minimizing the ecological impact of agriculture. Precision agriculture and high-efficiency agricultural techniques should be promoted in priority areas to improve land use efficiency. In moderately optimized areas, low-carbon agriculture and ecological planting techniques can be adopted to foster the synergistic development of agriculture and ecology. The government can support sustainable agricultural technologies through financial aid, technical training, and incentives for green infrastructure, while promoting low-carbon land use transformation via tax incentives and other policies to reduce ecological pressure.
3.4.3. Functional Synergy: Establishing Dynamic Monitoring and Long-Term Governance Mechanisms
In moderately optimized and stability-oriented regions, such as Yuhua District in Changsha, Wangcheng District, and suburban areas of Xiangtan City, where agriculture and ecology are well-balanced—these areas can serve as models for collaborative development. Remote sensing and GIS technologies should be used to monitor agricultural and ecological functions regularly, particularly along the Xiang River, with land policies adjusted as necessary to prevent conflicts from spreading. In cross-administrative boundary regions, such as the border between Changsha County and Zhuzhou City, collaborative governance mechanisms should be established to enable resource sharing and policy alignment. Additionally, local specialties, such as tea cultivation in Xiangtan and flower production in Ningxiang, should be leveraged to promote rural eco-tourism and specialty agriculture, guiding land development and creating multifunctional spaces that complement both agriculture and ecology.
4. Discussion
4.1. Identification of Agricultural and Ecological Functions
This study established a multi-indicator evaluation framework [3] to quantitatively assess the spatiotemporal distribution patterns of agricultural and ecological functions in the Chang-Zhu-Tan Urban Agglomeration from 2000 to 2020. The findings demonstrate a clear “weak center, strong periphery” gradient in agricultural functions, with high-function zones primarily concentrated in the western region. These areas are characterized by contiguous croplands, abundant agricultural resource endowments, and robust policy support. In contrast, urban core areas have experienced significant agricultural land loss due to rapid urbanization, resulting in the pronounced degradation of agricultural functions. Ecological functions exhibit a contrasting “strong northeast, decreasing outward” spatial pattern, with core functional zones concentrated in regions rich in forests and wetlands. These areas provide critical ecosystem services, including carbon sequestration, hydrological regulation, and biodiversity conservation, highlighting their vital role in maintaining regional ecological stability.
Compared to previous studies, this research provides a more comprehensive and nuanced identification of agricultural and ecological functions [42,43]. Existing research on land use change in the Chang-Zhu-Tan Urban Agglomeration primarily emphasizes the dynamics of carbon emissions and ecosystem services, yet often neglects the multidimensional integration and comprehensive evaluation of agricultural functions. This study refines agricultural functions into three dimensions: agricultural background, agricultural regulation, and agricultural production [1], thereby revealing the complexity of regional agricultural systems [4]. The findings underscore the critical role of agricultural regulation capacity, reflected by indicators such as NPP and NDVI, in enhancing the overall functionality of strong agricultural zones. This aligns with Chen [6], who emphasized vegetation cover’s importance in agricultural production potential. However, this study further highlights the crucial role of cropland patch size in maintaining agricultural resource stability, offering new insights into the resilience and sustainability of agricultural systems.
Moreover, the ecological function evaluation system combines positive indicators (such as biodiversity and water conservation) with negative indicators (like CO2 emissions), providing a more thorough depiction of the diversity and environmental sensitivity of ecological functions [30]. This method addresses the gap in Shao’s [26] ecosystem service evaluation by considering negative impacts. In particular, the green heart region demonstrates high and stable ecological functions, reflecting the remarkable effectiveness of ecological protection policies as proposed by Wu [29]. Overall, this study establishes a robust foundation for subsequent conflict analysis by comprehensively identifying agricultural and ecological functions.
4.2. Changes in Agricultural and Ecological Function Conflicts and Their Influencing Factors
By constructing agricultural and ecological function conflict identification and random forest models, this study offers an in-depth analysis of spatiotemporal changes in conflicts and their key driving factors over the period from 2000 to 2020. The results indicate a significant reduction in strong conflict areas, with a total area decrease of 7.73%, primarily concentrated in peripheral regions such as Liuyang City and Ningxiang City. Meanwhile, no-conflict areas have expanded, with the central urban areas of Changsha displaying low or no conflicts. Spatial change analysis shows that agricultural and ecological function conflicts follow a pattern of “high conflict mitigation in the periphery and low conflict expansion in the center”, with the trend of uncontrolled spatial heterogeneity gradually diminishing.
Factor analysis reveals that natural conditions and land use factors are the core drivers of changes in conflict. Natural conditions such as elevation and slope govern the basic distribution of agricultural and ecological functions. Intensive agricultural development has caused functional degradation in ecologically sensitive areas, while urban expansion has diminished agricultural functionality. However, its effects on ecological functions are more complex [22]. The random forest model results further confirm the significance of natural factors [25], with elevation and slope serving as the dominant drivers of conflict formation, showing a relative importance of over 50% in all three study periods. This finding is in line with Wang’s [32] study, which suggested that terrain conditions play a constraining role in land use function conflicts. However, this research further reveals significant interaction effects between natural factors and agricultural intensity [5], such as the significant contribution of crop planting area in high-slope regions to the intensification of conflicts.
Additionally, this study finds that policies have a significant effect on mitigating conflicts. In the green heart region, the protection of ecological functions not only reduced the conflict level but also promoted the transition of agriculture towards eco-friendly practices [44]. This is consistent with McMahon’s [45] viewpoint on the effectiveness of ecological compensation mechanisms but also highlights the lack of coordination in existing policies across regions [10]. For instance, the ecological restoration in peripheral areas is slow, and the degradation of agricultural functions has not yet been fully reversed, indicating that policy implementation needs to further strengthen region-specific management.
4.3. Changes in Agricultural and Ecological Function Conflicts and Their Driving Mechanisms
By developing an agricultural–ecological function conflict identification model and employing Random Forest analysis [10], this study comprehensively examines the spatiotemporal dynamics of conflicts and their primary driving mechanisms from 2000 to 2020. Results show a significant 7.73% reduction in strong conflict areas over two decades, primarily in the peripheral regions of Liuyang and Ningxiang. In contrast, no-conflict zones expanded steadily, especially in Changsha’s core urban areas, where low or no conflicts dominate. Spatial transitions reveal a pattern of “peripheral mitigation of high conflicts and central expansion of low conflicts”, accompanied by a gradual reduction in uncontrolled spatial heterogeneity over time.
The driving mechanisms highlight natural conditions and socio-economic factors as key contributors to conflict dynamics. Elevation and slope significantly influence the baseline distribution of agricultural and ecological functions, with high-intensity agricultural development exacerbating ecological degradation in sensitive areas. Urban expansion weakens agricultural functions, though its impact on ecological functions remains complex [11]. The Random Forest model underscores the dominance of natural factors [12], identifying elevation and slope as the most critical drivers, collectively contributing over 50% of relative importance across all study periods. These findings align with prior research [13], which highlights the restrictive role of topography in land use conflicts, while this study further uncovers significant interactions between natural factors and agricultural intensity [14]. For example, crop planting areas intensify conflicts in high-slope regions.
Additionally, the study underscores the critical role of ecological protection policies in mitigating conflicts. In the “green heart” region, ecological protection measures not only reduced conflict levels but also facilitated the transition of agricultural practices towards eco-friendly approaches [15]. This finding aligns with the perspective on the effectiveness of ecological compensation mechanisms proposed by previous research [16]. However, the study also reveals a lack of policy coordination across regions [17]. For example, the pace of ecological restoration in peripheral regions remains slower, and the trend of agricultural function degradation has not been fully reversed. These findings highlight the need for enhanced differentiated regional management to improve the effectiveness of policy implementation.
4.4. Policy Implications for Sustainable Territorial Space Regulation
Based on the dynamics of agricultural and ecological function conflicts and their driving mechanisms, this study introduces a three-dimensional spatial regulation framework: “precise regulation—zoning guidance—functional synergy”. This framework offers scientific guidance and practical pathways for conflict mitigation. In highly and moderately conflicted areas, priority should be given to defining ecological protection redlines and permanent farmland protection zones [46], enforcing stringent controls to curb disorderly competition for spatial resources. In regions of high agricultural intensity, ecological compensation policies, such as converting farmland to forests or grasslands, should be adopted to facilitate a transition toward eco-friendly agricultural practices. For example, the construction of ecological corridors in the “green heart” region has markedly enhanced ecosystem connectivity and stability, aligning with Tang’s [47] proposed strategies for ecological corridor optimization. Medium and weak conflict zones represent key areas for fostering functional synergy. In these regions, the promotion of green infrastructure—such as ecological preservation forests and wetland corridors—can significantly enhance ecosystem service capacity [48]. Additionally, adopting advanced functional models, including precision agriculture and vertical farming, can optimize land resource utilization efficiency. This aligns with Wang’s [49] strategy for agricultural spatial optimization, but this study further highlights the role of low-carbon agriculture and biological pest control technologies in achieving a balance between agricultural productivity and ecological sustainability. No-conflict zones can serve as demonstration areas for harmonized agricultural and ecological development, facilitating resource sharing and policy alignment across regions. Dynamic monitoring of agricultural and ecological functions through remote sensing and GIS technologies is recommended to track spatiotemporal variations and guide land use planning effectively. This approach complements Liu’s [11] proposed collaborative governance mechanisms, while integrating cross-regional agricultural–ecological industry chain optimization to promote a coordinated framework that aligns agricultural, ecological, and societal demands.
4.5. Limitations and Future Research Directions
Although this study provides a comprehensive exploration of “agriculture–ecology” function conflicts and regulatory pathways in the Chang-Zhu-Tan Urban Agglomeration, several limitations exist. The analysis is limited by the data span of 2000–2020, which restricts the ability to predict conflict dynamics under evolving policy or climate change scenarios. In contrast, previous studies have used scenario simulations to forecast future trends. Incorporating dynamic scenario analysis could address this gap in future research [19]. While the random forest model effectively identified key drivers, it lacks the ability to explain spatial heterogeneity and variable interactions. Geographically weighted regression could enhance the spatial analysis of conflict drivers in future studies. Furthermore, this study primarily focuses on natural and economic factors, without adequately considering the roles of social, cultural, and policy contexts in conflict formation. Previous research underscores the importance of social dynamics and regulatory interventions in mitigating conflicts [50]. Additionally, the use of lower-resolution datasets in this study may limit the granularity of conflict feature identification. Future research should leverage high-resolution remote sensing data and advanced monitoring technologies to improve analytical precision. To address these limitations, future studies should integrate dynamic scenario simulations with multi-scale spatial analyses, explore the roles of social, cultural, and policy factors, and promote cross-regional governance. These efforts would provide stronger scientific support for regional land use optimization and sustainable development.
5. Conclusions
This study investigates agricultural–ecological function conflicts in the Chang-Zhu-Tan Urban Agglomeration, providing a systematic analysis of the spatial-temporal distribution, driving mechanisms, and regulatory pathways from 2000 to 2020. By developing an innovative theoretical framework and employing multi-dimensional analysis methods, the study offers new perspectives and research directions in spatial conflict analysis. It identifies key drivers of agricultural–ecological conflicts and explores the interactions between natural and social factors, thereby enhancing the theoretical foundation of conflict analysis. Specifically, in the context of land use regulation and sustainable development, the study proposes region-specific policy pathways, providing practical guidance for conflict mitigation and resource optimization.
The results show that agricultural functions follow a spatial pattern of “weaker in the center, stronger at the periphery”, with high-function areas concentrated in the western, northeastern, and southwestern regions of the urban agglomeration. Ecological functions are generally weak, with high-function areas mainly in the northeastern region. From 2000 to 2020, the overall conflict between agricultural and ecological functions weakened, with a sharper gradient and a shift in the distribution of conflict areas. The area of strong conflict decreased by 7.73%, while areas with moderate or no conflict increased. The spatial pattern of conflict reflects a trend of “high conflict reduction in peripheral areas, low conflict expansion in central areas”, indicating a gradual alleviation of regional conflicts. Analysis using the Random Forest model shows that natural factors, particularly elevation and slope, have the greatest influence on conflict changes. Land use factors, such as land economic density and crop area, are also becoming more significant. These findings highlight the role of the “natural–human” interaction in spatial conflicts and emphasize the importance of effective land use planning in mitigating agricultural–ecological conflicts.
This study focuses on the Chang-Zhu-Tan Urban Agglomeration and does not consider other types of urban agglomerations or urban–rural fringe areas. Future research could validate and extend the findings through cross-regional comparisons. While the Random Forest model used in this study accurately identifies conflict factors, its reliance on data completeness and quality limits its robustness. To enhance predictive accuracy, future studies should incorporate high-resolution remote sensing data and dynamic monitoring technologies. As regional economic and social dynamics evolve, future research should assess the socioeconomic and environmental impacts of various land use patterns and explore more targeted policy instruments to promote the balanced development of agricultural and ecological functions. Additionally, further research should refine the analysis of conflict mechanisms and improve conflict regulation strategies, offering more precise and evidence-based decision-making support for regional sustainable development.
Author Contributions
M.W.: writing—original draft preparation, conceptualization, methodology, software, validation, formal analysis, data curation, visualization. F.L.: software, validation, formal analysis, data curation, visualization. X.Z.: review and editing, resources, funding acquisition. All authors have read and agreed to the published version of the manuscript.
Funding
This research was funded by the Natural Resources Science and Technology Program of Hunan Province [Grant Number: (20230108GH)] and the Scientific research and innovation Foundation of Hunan University of Technology [Grant Number: (LXBZZ2408)] and the Hunan Province Water Resources Science and Technology Project [Grant Number: (XSKJ2022068-36)].
Institutional Review Board Statement
Not applicable.
Informed Consent Statement
Not applicable.
Data Availability Statement
The data supporting the findings of this study are available within the article.
Acknowledgments
We sincerely thank the anonymous reviewers and editors for their valuable suggestions.
Conflicts of Interest
The authors declare no conflicts of interest.
References
- Zou, Y.; Meng, J.; Zhu, L.; Han, Z.; Ma, Y. Characterizing land use transition in China by accounting for the conflicts underlying land use structure and function. J. Environ. Manag. 2024, 349, 119311. [Google Scholar] [CrossRef]
- Zhang, Y.; Yu, P.; Tian, Y.; Chen, H.; Chen, Y. Exploring the impact of integrated spatial function zones on land use dynamics and ecosystem services tradeoffs based on a future land use simulation (FLUS) model. Ecol. Indic. 2023, 150, 110246. [Google Scholar] [CrossRef]
- Li, S.; Zhu, C.; Lin, Y.; Dong, B.; Chen, B.; Si, B.; Li, Y.; Deng, X.; Gan, M.; Zhang, J.; et al. Conflicts between agricultural and ecological functions and their driving mechanisms in agroforestry ecotone areas from the perspective of land use functions. J. Clean. Prod. 2021, 317, 128453. [Google Scholar] [CrossRef]
- Delgado, L.E.; Marín, V.H. Ecosystem services and ecosystem degradation: Environmentalist’s expectation? Ecosyst. Serv. 2020, 45, 101177. [Google Scholar] [CrossRef]
- Zong, S.; Hu, Y.; Bai, Y.; Guo, Z.; Wang, J. Analysis of the distribution characteristics and driving factors of land use conflict potentials in the Bohai Rim coastal zone. Ocean Coast. Manag. 2022, 226, 106260. [Google Scholar] [CrossRef]
- Chen, L.; Cai, H. Study on land use conflict identification and territorial spatial zoning control in Rao River Basin, Jiangxi Province, China. Ecol. Indic. 2022, 145, 109594. [Google Scholar] [CrossRef]
- Jing, W.; Yu, K.; Wu, L.; Luo, P. Potential Land Use Conflict Identification Based on Improved Multi-Objective Suitability Evaluation. Remote Sens. 2021, 13, 2416. [Google Scholar] [CrossRef]
- Valtiala, J.; Niskanen, O.; Torvinen, M.; Riekkinen, K.; Suokannas, A. The relationship between agricultural land parcel size and cultivation costs. Land Use Policy 2023, 131, 106728. [Google Scholar] [CrossRef]
- Tran, D.X.; Pla, F.; Latorre-Carmona, P.; Myint, S.W.; Caetano, M.; Kieu, H.V. Characterizing the relationship between land use land cover change and land surface temperature. ISPRS J. Photogramm. Remote Sens. 2017, 124, 119–132. [Google Scholar] [CrossRef]
- Xue, M.; Wang, H.; Wei, Y.; Ma, C.; Yin, Y. Spatial Characteristics of Land Use Multifunctionality and Their Trade-Off/Synergy in Urumqi, China: Implication for Land Space Zoning Management. Sustainability 2022, 14, 9285. [Google Scholar] [CrossRef]
- Liu, J.; Jin, X.; Xu, W.; Fan, Y.; Ren, J.; Zhang, X.; Zhou, Y. Spatial coupling differentiation and development zoning trade-off of land space utilization efficiency in eastern China. Land Use Policy 2019, 85, 310–327. [Google Scholar] [CrossRef]
- Schneibel, A.; Stellmes, M.; Röder, A.; Finckh, M.; Revermann, R.; Frantz, D.; Hill, J. Evaluating the trade-off between food and timber resulting from the conversion of Miombo forests to agricultural land in Angola using multi-temporal Landsat data. Sci. Total Environ. 2016, 548–549, 390–401. [Google Scholar] [CrossRef]
- Zhao, J.; Zhao, Y. Synergy/trade-offs and differential optimization of production, living, and ecological functions in the Yangtze River Economic Belt, China. Ecol. Indic. 2023, 147, 109925. [Google Scholar] [CrossRef]
- Zhang, Y.; Zhang, J.; Wang, F.; Yang, W. Spatiotemporal Landscape Pattern Analyses Enhanced by an Integrated Index: A Study of the Changbai Mountain National Nature Reserve. Remote Sens. 2023, 15, 1760. [Google Scholar] [CrossRef]
- Wang, X.; Zhang, Y.; Li, X.; Cao, S. An Analysis of Land Use Conflicts and Strategies in the Harbin–Changchun Urban Agglomeration Based on the Production–Ecological–Living Space Theory and Patch-Generating Land Use Simulation. Land 2025, 14, 111. [Google Scholar] [CrossRef]
- Mamanis, G.; Vrahnakis, M.; Chouvardas, D.; Nasiakou, S.; Kleftoyanni, V. Land Use Demands for the CLUE-S Spatiotemporal Model in an Agroforestry Perspective. Land 2021, 10, 1097. [Google Scholar] [CrossRef]
- Wei, Z.; Bin, G.; Hao, S.; Zijun, L. Study on multi-scenarios regulating strategy of land use conflict in urban agglomerations under the perspective of “three-zone space”: A case study of Harbin-Changchun urban agglomerations, China. Front. Environ. Sci. 2024, 11, 1288933. [Google Scholar] [CrossRef]
- Li, Y.; Zhang, F.; Li, R.; Yu, H.; Chen, Y.; Yu, H. Comprehensive Ecological Functional Zoning: A Data-Driven Approach for Sustainable Land Use and Environmental Management—A Case Study in Shenzhen, China. Land 2024, 13, 1413. [Google Scholar] [CrossRef]
- Zhang, Z.; Hu, B.; Jiang, W.; Qiu, H. Spatial and temporal variation and prediction of ecological carrying capacity based on machine learning and PLUS model. Ecol. Indic. 2023, 154, 110611. [Google Scholar] [CrossRef]
- Gossner, M.M.; Lewinsohn, T.M.; Kahl, T.; Grassein, F.; Boch, S.; Prati, D.; Birkhofer, K.; Renner, S.; Sikorski, J.; Wubet, T.; et al. Land-use intensification causes multitrophic homogenization of grassland communities. Nature 2016, 540, 266–269. [Google Scholar] [CrossRef]
- Bekele, A.E.; Drabik, D.; Dries, L.; Heijman, W. Large-scale land investments and land-use conflicts in the agro-pastoral areas of Ethiopia. Land Use Policy 2022, 119, 106166. [Google Scholar] [CrossRef]
- Izakovičová, Z.; Miklós, L.; Miklósová, V. Integrative Assessment of Land Use Conflicts. Sustainability 2018, 10, 3270. [Google Scholar] [CrossRef]
- Wang, H.; Qin, F.; Xu, C.; Li, B.; Guo, L.; Wang, Z. Evaluating the suitability of urban development land with a Geodetector. Ecol. Indic. 2021, 123, 107339. [Google Scholar] [CrossRef]
- Cao, X.; Liu, Y.; Li, T.; Liao, W. Analysis of Spatial Pattern Evolution and Influencing Factors of Regional Land Use Efficiency in China Based on ESDA-GWR. Sci. Rep. 2019, 9, 520. [Google Scholar] [CrossRef]
- Sales, M.H.R.; de Bruin, S.; Souza, C.; Herold, M. Land Use and Land Cover Area Estimates from Class Membership Probability of a Random Forest Classification. IEEE Trans. Geosci. Remote Sens. 2022, 60, 4402711. [Google Scholar] [CrossRef]
- Shao, Y.; Xiao, Y.; Kou, X.; Sang, W. Sustainable land use scenarios generated by optimizing ecosystem distribution based on temporal and spatial patterns of ecosystem services in the southern China hilly region. Ecol. Inform. 2023, 78, 102275. [Google Scholar] [CrossRef]
- Rigo, R.; Houet, T. Do Land Use and Land Cover Scenarios Support More Integrated Land Use Management? Land 2023, 12, 1414. [Google Scholar] [CrossRef]
- Zhang, L.; Kuang, B.; Yang, B. Sustainable Land Use and Management. Sustainability 2023, 15, 16259. [Google Scholar] [CrossRef]
- Wu, F.; Wang, Z. Assessing the impact of urban land expansion on ecosystem carbon storage: A case study of the Changzhutan metropolitan area, China. Ecol. Indic. 2023, 154, 110688. [Google Scholar] [CrossRef]
- Ouyang, X.; Xu, J.; Li, J.; Wei, X.; Li, Y. Land space optimization of urban-agriculture-ecological functions in the Changsha-Zhuzhou-Xiangtan Urban Agglomeration, China. Land Use Policy 2022, 117, 106112. [Google Scholar] [CrossRef]
- GB/T 21010-2017; National Standardization Technical Committee for Land and Resources (SAC/TC 93). Classification of Land Use Current Status. China Standards Press: Beijing, China, 2017.
- Wang, L.; Xiong, C.; Tian, Y.; Zhou, B. Evaluation of the heterogeneity, spatiotemporal evolution, and zoning control of production-living-ecological space functions in China. Trans. Chin. Soc. Agric. Eng. 2024, 40, 265–275. [Google Scholar]
- Dong, G.; Zhou, Q.; Sun, C.; Wang, Y.; Ke, Q. Identification of land use conflicts in the Guangdong-Hong Kong-Macao Greater Bay Area based on “multi-suitability-scarcity-diversity”. Trans. Chin. Soc. Agric. Eng. 2023, 39, 245–255. [Google Scholar]
- Valle, D.; Izbicki, R.; Leite, R.V. Quantifying uncertainty in land-use land-cover classification using conformal statistics. Remote Sens. Environ. 2023, 295, 113682. [Google Scholar] [CrossRef]
- Jia, Y.; Liu, Y.; Zhang, S. Evaluation of agricultural ecosystem service value in arid and semiarid regions of Northwest China based on the equivalent factor method. Environ. Process. 2021, 8, 713–727. [Google Scholar] [CrossRef]
- Levers, C.; Romero-Muñoz, A.; Baumann, M.; De Marzo, T.; Fernández, P.D.; Gasparri, N.I.; Gavier-Pizarro, G.I.; le Polain de Waroux, Y.; Piquer-Rodríguez, M.; Semper-Pascual, A.; et al. Agricultural expansion and the ecological marginalization of forest-dependent people. Proc. Natl. Acad. Sci. USA 2021, 118, e2100436118. [Google Scholar] [CrossRef]
- Wu, G.; Riaz, N.; Dong, R. China’s agricultural ecological efficiency and spatial spillover effect. Environ. Dev. Sustain. 2023, 25, 3073–3098. [Google Scholar] [CrossRef]
- Wang, D.; Fu, J.; Xie, X.; Ding, F.; Jiang, D. Spatiotemporal evolution of urban-agricultural-ecological space in China and its driving mechanism. J. Clean. Prod. 2022, 371, 133684. [Google Scholar] [CrossRef]
- Li, W.; Chen, Z.; Li, M.; Qiu, X.; Zhao, Q.; Chen, Y. Spatial conflict identification and scenario coordination for construction-agricultural-ecological land use. Environ. Dev. Sustain. 2023, 27, 1933–1961. [Google Scholar] [CrossRef]
- Gupta, U.; Sharma, R. Analysis of criminal spatial events in India using exploratory data analysis and regression. Comput. Electr. Eng. 2023, 109, 108761. [Google Scholar] [CrossRef]
- Ren, Y.; Zhu, X.; Bai, K.; Zhang, R. A New Random Forest Ensemble of Intuitionistic Fuzzy Decision Trees. IEEE Trans. Fuzzy Syst. 2023, 31, 1729–1741. [Google Scholar] [CrossRef]
- Wang, W.; Li, B.; Su, F.; Jiang, Z.; Chen, S. Identifying Ecological Security Patterns Meeting Future Urban Expansion in Changsha–Zhuzhou–Xiangtan Urban Agglomeration, China. Remote Sens. 2023, 15, 3141. [Google Scholar] [CrossRef]
- Chen, W.; Zeng, C.; Ding, C.; Zhu, Y.; Sun, Y. Study on Spatio-Temporal Evolution Law and Driving Mechanism of PM2.5 Concentration in Changsha–Zhuzhou–Xiangtan Urban Agglomeration. Sustainability 2022, 14, 14967. [Google Scholar] [CrossRef]
- Hong, Y.; Yu, H.; Lu, Y.; Peng, L. Balancing low-carbon and eco-friendly development: Coordinated development strategy for land use carbon emission efficiency and land ecological security. Environ. Sci. Pollut. Res. 2024, 31, 9495–9511. [Google Scholar] [CrossRef]
- McMahon, J.; Turner, R.; Smart, J.; Shortle, J.; Ramsay, I.; Correa, D.; Chamberlain, D.; Mao, Y.; Warne, M. Offset integrity reduces environmental risk: Using lessons from biodiversity and carbon offsetting to inform water quality offsetting in the catchments of the Great Barrier Reef. Sci. Total Environ. 2024, 951, 175786. [Google Scholar] [CrossRef] [PubMed]
- Zhang, K.; Huang, C.; Wang, Z.; Wu, J.; Zeng, Z.; Mu, J.; Yang, W. Optimization of production-living-ecological space pattern based on the DTTD-MCR-PLUS model: A case study of Changsha, China. Acta Ecol. Sin. 2022, 42, 9957–9970. (In Chinese) [Google Scholar]
- Tang, Y.; Gao, C.; Wu, X. Urban Ecological Corridor Network Construction: An Integration of the Least Cost Path Model and the InVEST Model. ISPRS Int. J. Geo-Inf. 2020, 9, 33. [Google Scholar] [CrossRef]
- Heckert, M.; Rosan, C.D. Developing a green infrastructure equity index to promote equity planning. Urban For. Urban Green. 2016, 19, 263–270. [Google Scholar] [CrossRef]
- Wang, X.; Cui, B.; Chen, Y.; Feng, T.; Li, Z.; Fang, G. Dynamic changes in water resources and comprehensive assessment of water resource utilization efficiency in the Aral Sea basin, Central Asia. J. Environ. Manag. 2024, 353, 120198. [Google Scholar] [CrossRef]
- Duan, W.; Li, C.; Zhang, P.; Chang, Q. Game modeling and policy research on the system dynamics-based tripartite evolution for government environmental regulation. Clust. Comput. 2016, 19, 2061–2074. [Google Scholar] [CrossRef]
Disclaimer/Publisher’s Note: The statements, opinions and data contained in all publications are solely those of the individual author(s) and contributor(s) and not of MDPI and/or the editor(s). MDPI and/or the editor(s) disclaim responsibility for any injury to people or property resulting from any ideas, methods, instructions or products referred to in the content. |
© 2025 by the authors. Licensee MDPI, Basel, Switzerland. This article is an open access article distributed under the terms and conditions of the Creative Commons Attribution (CC BY) license (https://creativecommons.org/licenses/by/4.0/).