Article

A Comprehensive Multicriteria Analysis of Italian Regional Parks: Advancing Environmental Management and Benchmarking

1
DIIn, Department of Industrial Engineering, University of Salerno, Via Giovanni Paolo II 132, 84084 Fisciano, Italy
2
Parco Regionale del Partenio, Technical-Scientific Committee, Via Borgonuovo, 25/27, 83010 Summonte, Italy
*
Author to whom correspondence should be addressed.
Sustainability 2025, 17(6), 2560; https://doi.org/10.3390/su17062560
Submission received: 13 February 2025 / Revised: 12 March 2025 / Accepted: 13 March 2025 / Published: 14 March 2025
(This article belongs to the Section Resources and Sustainable Utilization)

Abstract

:
This study presents a comprehensive multicriteria analysis of Italian regional parks, focusing on advancing environmental management and benchmarking. It integrates multiple indicators with a simplified yet effective multicriteria decision analysis (MCDA) to evaluate the performance of 150 regional parks across Northern, Central, and Southern Italy. The analysis highlights significant regional disparities in park distribution, management tools, and resource allocation. Northern Italy leads in the number of parks, land area, and the availability of management tools such as Master Plans and Park Apps, while Southern Italy shows higher activity levels per employee, indicating a different management approach. Central Italy, though with fewer parks, exhibits a relatively high presence of management tools and a higher number of employees per municipality. The MCDA identifies top-performing parks, such as Beigua Regional Park, Adamello Brenta Natural Park, and Dolomiti Friulane Natural Park, all located in Northern Italy, which excel in digital engagement, infrastructure development, and visitor activities. These parks serve as exemplary models for effective park management. This study underscores the importance of adopting tailored strategies that consider regional characteristics and resource availability. Addressing regional disparities and sharing best practices can improve environmental management and ensure the long-term sustainability of Italian regional parks. This research provides a valuable benchmark for evaluating and improving the performance of regional parks, offering actionable insights for policymakers and stakeholders involved in the governance of protected areas.

Graphical Abstract

1. Introduction

Regional parks are essential for biodiversity conservation and natural resource protection, as widely recognized in the literature [1,2]. These areas are essential not only for maintaining ecological balance but also for providing crucial ecosystem services and promoting sustainable development. In Italy, regional parks are a cornerstone of the national conservation strategy, aimed at protecting diverse landscapes and habitats. Managing these complex systems requires a comprehensive approach integrating multiple factors, which necessitates sophisticated tools like multicriteria analysis.
The complexity of managing regional parks arises from the wide array of values and functions these areas hold, including biological diversity, cultural heritage, and socio-economic activities [3,4]. Balancing conservation objectives with the needs of local communities and ensuring the sustainable use of resources presents a considerable challenge [5,6]. These areas face environmental pressures including habitat fragmentation, pollution, and urbanization, requiring continuous monitoring and adaptive management [7,8].
Several studies have underscored the importance of using indicators to evaluate the effectiveness of environmental policies and management practices in protected areas [9,10]. Indicators offer insights into ecosystem health, human impact, and socio-economic conditions [11]. Furthermore, spatial analysis, supported by Geographic Information Systems (GISs), significantly enhances the assessment process by allowing for the visualization and analysis of complex spatial data [12,13]. This combination of GISs and multicriteria decision analysis (MCDA) provides a powerful tool for identifying key areas for conservation, evaluating environmental risks, and guiding resource allocation, all of which are fundamental for effective planning [5,14]. The application of spatial SWOT analysis, as proposed by Comino and Ferretti (2016) [3], further allows the identification of strengths, weaknesses, opportunities, and threats for specific protected areas.
The application of MCDA techniques is crucial for handling the inherent multi-dimensionality of park management. These methods enable the integration of diverse criteria, such as ecological value, human impact, and socio-economic benefits, into a single, evaluation framework. Various MCDA models, including TOPSIS, VIKOR, WASPAS, and COPRAS, as highlighted by Zavadskas et al. (2019) [15], offer different approaches to ranking and prioritizing alternatives, thus facilitating informed decision-making. Additionally, the Analytic Hierarchy Process (AHP) and Analytic Network Process (ANP), as used by Palmisano et al. (2016) [6], are valuable for structuring decision problems and incorporating stakeholder preferences. The use of methods like TOPSIS for evaluating Natura 2000 sites, as performed by Rocchi et al. (2020) [16], underscores the need for appropriate aggregation methods. Moreover, comparing different weighting methods, such as rank sum and equal weights as seen in the work of Poli et al. (2024) [17], demonstrates how the choice of method can affect the final results.
Many studies have focused on developing methods for assessing specific aspects of protected areas. For example, Castanedo et al. (2009) [18] employ mathematical models to evaluate the impact of oil spills on economic activities, highlighting the importance of factors like seasonality and recovery time. Riccioli et al. (2016) [9], on the other hand, applied the Weighted Linear Combination (WLC) method to integrate various biodiversity indicators into a single index. Furthermore, Tenerelli et al. (2016) [11] demonstrate the importance of proximity to visual interest points and accessibility in environmental evaluation, also considering protection status as a relevant factor. In their work, Scorza et al. (2020) [19] illustrate how an ecosystem service approach can be integrated with multicriteria analysis for more effective land management and to assess the impact of different environmental threats. Additionally, Courtois et al. (2023) [20] evaluate the costs of controlling invasive species and willingness to pay for environmental improvement, underlining the importance of considering economic factors in park management. De Montis (2014) [21] provides a framework for evaluating the impact of the European Landscape Convention on national planning systems.
In light of the performed literature review, this paper presents a comprehensive multicriteria analysis of Italian regional parks. By using a wide array of sources and a methodological framework that uses a multicriteria decision-making approach, we evaluate the performance of Italian regional parks by considering a wide range of indicators. This study focuses on developing a robust methodology that can serve as a benchmark for the environmental management of protected areas and facilitate the sharing of best practices among diverse stakeholders. This research explores the use of the integration of Key Performance Indicators with a multicriteria decision-making approach, with the goal of providing a more complete picture of the performance of Italian regional parks, emphasizing similarities and differences among North, Central, and Southern Italy, and creating a useful tool for environmental management.

Research Objectives and Questions

This study aims to advance environmental management and benchmarking for Italian regional parks by employing a multicriteria decision analysis (MCDA) framework. The specific research objectives are as follows:
  • To evaluate the performance of 150 regional parks across Northern, Central, and Southern Italy using a comprehensive set of indicators.
  • To identify and analyze regional disparities in park distribution, management tools, and resource allocation.
  • To provide actionable insights for policymakers and stakeholders to enhance the sustainability and effectiveness of park management.
The research seeks to answer the following key questions:
  • What are the primary factors influencing the performance of Italian regional parks, and how can they be measured using MCDA?
  • How do regional differences in park management and resource allocation impact overall performance?
  • Which parks serve as best-practice models, and what strategies can be adopted to improve underperforming parks?

2. Methods

2.1. Data Sources and Collection

Between 2023 and 2024, data collection was extensive, involving both quantitative and qualitative sources:
  • Official park websites: Information about park size, visitor statistics, conservation activities, and organizational structure was collected. Official park websites are primary sources of information directly managed by the park authorities, ensuring that the data are up-to-date and accurate. These websites typically provide details about the parks, including their size, visitor statistics, conservation activities, and organizational structure.
  • Government reports: Legal frameworks such as the 1991 Protected Areas Law (L.394/1991) were consulted as the foundational legislation governing protected areas in Italy. This law establishes the general principles for the conservation and management of protected areas at the national level. However, in Italy, the management of regional parks is delegated to individual regions, which enact specific regulations for the establishment and protection of these areas. Regional laws vary from one region to another and are periodically updated to address local environmental and territorial needs. Government reports provide authoritative and standardized information on the regulatory environment governing regional parks, including both national and regional legislation. These reports are essential for understanding the legal and policy context in which the parks operate. While the 1991 law remains the cornerstone of protected area governance, it is complemented by more recent regional regulations that reflect evolving environmental priorities and local conditions.
  • Direct communication: Direct telephone calls with park staff provided data on the number of personnel employed in the parks. In general, direct communication through emails and telephone interviews allows for the collection of specific, detailed, and sometimes unpublished data that may not be available on official websites or in government reports. This method is particularly useful for obtaining information on staffing levels, specific activities, and operational challenges.
  • Literature review: A systematic literature review was conducted to supplement the collected data with historical and comparative information on park management. The review focused on academic papers and government documents published between 2000 and 2024, using keywords such as “regional parks”, “protected areas”, “environmental management”, “multicriteria analysis”, and “sustainability”. The primary purpose of the literature review was to provide a theoretical and historical foundation for this study, contextualizing the findings within the broader body of knowledge on park management and environmental conservation. Specifically, the literature review helped identify key indicators, methodologies, and best practices used in previous studies, which informed the selection of criteria and the development of the dataset and KPIs. The reviewed documents were also used to validate and cross-reference the data collected from official park websites, government reports, and phone calls with park staff.

2.2. Italian Regional Parks’ Dataset and KPIs

The dataset included 150 regional parks categorized by geographic region: North, Central, and South Italy. To facilitate a clearer understanding of the dataset and its relevance to the research question, the information provided for each park is organized into thematic clusters. These clusters group related aspects of the parks, such as legal frameworks, planning documents, and visitor resources, to highlight their interconnectedness and importance in the context of regional park management and conservation. For each regional park, the following information is provided:
General Information:
  • Name of the Regional Park—the official name of the park as recognized by the regional or national authorities.
  • Progressive Number—a numerical identifier assigned to each regional park in the dataset.
  • Presence in the Official List of Protected Natural Areas (“Elenco Ufficiale delle Aree Naturali Protette”—EUAP)—indicates whether the park is officially recognized and included in Italy’s national registry of protected natural areas.
  • Provinces—the administrative provinces in which the park is located. Some parks span multiple provinces.
  • Land Area (hectares)—the total surface area of the park, measured in hectares (ha), which helps determine the size and scope of the protected area.
  • Number of Inhabitants—the population residing within the park’s boundaries, including those living in towns and villages inside or bordering the park.
Legal and Regulatory Framework:
7.
Park Establishment Year—the year when the park was officially created, often through regional legislation.
8.
Type of Park Regulation—the specific legal framework governing the park, which may include conservation restrictions, permitted activities, and management rules.
9.
Regional Law Establishing the Park—the specific regional law or legislative act that led to the creation of the park, defining its boundaries, purpose, and governance.
Planning and Documentation:
10.
Presence of Cartography—indicates whether the park has official maps available, either in print or digital format, showing trails, protected zones, and key locations.
11.
Presence of a Master Plan—indicates whether the park has an official planning document that outlines conservation strategies, land use policies, and development guidelines.
12.
Type of Master Plan—describes the nature of the master plan, such as whether it is primarily focused on conservation, tourism development, or sustainable land use.
Administrative and Operational Details:
13.
Number of Municipalities—the total number of municipalities that are included, partially or fully, within the park’s boundaries.
14.
Number of Employees—the number of people employed by the park authority, including administrative staff, rangers, and environmental experts.
Activities and Visitor Information:
15.
Types of Activities Carried Out in the Park—the different activities permitted or promoted within the park, such as hiking, wildlife conservation, environmental education, scientific research, and tourism.
16.
Number of Activities—the total count of officially recognized or managed activities available within the park.
17.
Presence of Italian Alpine Club (CAI) Routes—specifies whether the park contains official hiking or trekking routes maintained by the Italian Alpine Club (Club Alpino Italiano—CAI), which are often well marked and used for mountain excursions.
Digital and Online Resources:
18.
Website—the official website of the park, where visitors and researchers can find information about regulations, attractions, and conservation efforts.
19.
Presence of a Park App—specifies whether the park has a dedicated mobile application for visitors, which may provide maps, guides, event information, and regulations.
Where possible, for each variable, the minimum, maximum, mean, standard deviation, and coefficient of variation (standard deviation as a percentage of the mean, indicating relative variability) have been calculated for the national dataset, as well as for the sub-datasets related to Northern, Central, and Southern Italy.
In order to obtain useful Key Performance Indicators (KPIs), data were normalized to account for differences in park size, population served, number of municipalities served, and number of employees allowing for a fair comparison of park performance. In particular, the following KPIs have been considered:
  • Employees/Land Area (number/hectares)—measures the number of park employees per hectare of land. A lower value may indicate a vast park with relatively few staff, while a higher value suggests more intensive management and oversight per unit of land.
  • Employees/Inhabitants (number/inhabitants)—represents the number of employees relative to the population living within the park. This helps assess whether staffing levels are adequate to serve local communities and manage conservation efforts in inhabited areas.
  • Employees/Municipalities (number/municipality)—indicates the average number of employees per municipality within the park. A higher value may suggest better administrative and operational capacity at the local level.
  • Activities/Employees—reflects the number of park activities managed per employee. A higher value may indicate high efficiency or workload, while a lower value could suggest either more specialized roles or fewer organized activities.
These KPIs were selected because they directly address critical aspects of park management, including resource allocation, operational efficiency, and visitor engagement. By focusing on staffing levels relative to park size, population, and administrative complexity, the KPIs provide a balanced and practical framework for evaluating park performance. They were chosen over other potential indicators (e.g., visitor numbers or biodiversity metrics) due to their ability to be consistently normalized across parks of varying sizes and populations, ensuring a fair and equitable comparison. This approach allows for a robust assessment of regional disparities in resource allocation and management practices, offering actionable insights for improving park performance.
The KPIs have been calculated for the entire dataset as well as for the sub-datasets for Northern, Central, and Southern Italy to enable comparisons.

2.3. Multicriteria Decision Analysis (MCDA) Procedure

Multicriteria decision analysis (MCDA) is a valuable decision-making tool used to determine optimal alternatives by comprehensively evaluating multiple criteria and their relative importance (i.e., weight) in the decision-making process. MCDA is particularly suitable for contexts with multiple objectives, incommensurable criteria, mixed data, and multiple participants, offering ease of use and facilitating analysis [22,23]. As highlighted in the introduction, MCDA has been widely applied in environmental management, including the evaluation of protected areas, landscape quality, and resource allocation [3,15,16]. The selected MCDA approach in this study aligns with these applications but distinguishes itself by focusing on the integration of digital engagement, infrastructure, and visitor activities as key criteria for evaluating regional parks.
In an MCDA procedure, each alternative is assessed against each criterion. The fundamental structure consists of an evaluation matrix (the alternatives matrix), where evaluation criteria form the columns, alternatives form the rows, and a weight vector represents the relative importance assigned to the criteria by decision-makers, summing to one. In this case, all criteria were assigned equal importance, eliminating the need for a weighting phase. The choice of equal weighting in this study is justified by its simplicity, transparency, and neutrality, making it suitable for an exploratory analysis aimed at providing a holistic view of park performance. This approach also ensures that the analysis is objective and reproducible, which is essential for benchmarking and policy recommendations.
Unlike other studies that employ more complex weighting methods such as AHP or ANP [6,15], this study adopts an equal weighting scheme to maintain simplicity and focus on the exploratory nature of the analysis. This approach is particularly useful for identifying broad trends and regional disparities in park management, as it avoids the potential bias introduced by subjective weighting. Furthermore, the selected criteria—ranging from digital engagement (e.g., presence of a park app, Facebook visitors) to infrastructure (e.g., master plan, cartography) and visitor activities—reflect a modern approach to park management, emphasizing the importance of digital tools and visitor experience, which are increasingly relevant in the context of sustainable tourism and environmental education.
After identifying the alternatives for comparison (i.e., 150 Italian regional parks), the MCDA procedure follows ten steps, as outlined in Figure 1.
Step 1: Defining Comparison Criteria.
Nine criteria were selected for evaluation. In an MCDA procedure, it is mandatory to provide a detailed description of each criterion to facilitate the compilation of the alternatives matrix, where for each alternative—in this case, a regional park—a value is assigned based on its performance for each criterion. Below is a detailed description of each criterion:
  • C1: Number of Activities—a numeric value representing the number of activities offered by the park, to be maximized. The number of activities offered by a park (e.g., hiking, wildlife conservation, environmental education) is a direct indicator of its ability to engage visitors and promote sustainable tourism. Parks with a wide range of activities are likely to attract more visitors and contribute to local economies. This criterion reflects the park’s role in providing recreational and educational opportunities, which are key components of effective park management.
  • C2: Presence of an App—a binary (No/Yes) criterion indicating the availability of a mobile application, transformed into a numeric value (Yes > No) to be maximized. The availability of a mobile application indicates the park’s commitment to leveraging digital tools for visitor engagement, information dissemination, and management efficiency. Apps can enhance the visitor experience by providing maps, event information, and real-time updates. In the digital age, the presence of an app is a marker of modern park management and reflects the park’s ability to adapt to technological advancements.
  • C3: Number of Facebook Page Visitors—a numeric value reflecting the park’s online engagement, to be maximized. The number of Facebook page visitors serves as a proxy for the park’s online engagement and outreach efforts. A high number of visitors suggests effective use of social media to promote the park and interact with the public. Social media engagement is increasingly important for raising awareness, attracting visitors, and fostering community involvement in park activities.
  • C4: Presence of a Master Plan—a binary (No/Yes) criterion indicating whether a long-term development plan exists, transformed into a numeric value (Yes > No) to be maximized. A master plan is a strategic document that outlines long-term goals, conservation strategies, and development guidelines for the park. Parks with a master plan are likely to have a clear vision and structured approach to management. The presence of a master plan indicates a park’s commitment to sustainable development and effective resource management, which are essential for long-term success.
  • C5: Presence in the Official List of Protected Natural Areas—a binary (No/Yes) criterion, transformed into a numeric value (Yes > No) to be maximized. Inclusion in the official list of protected natural areas (Elenco Ufficiale delle Aree Naturali Protette, EUAP) signifies that the park is recognized and regulated by national authorities, ensuring compliance with conservation standards. This criterion reflects the park’s formal recognition and legal status, which are important for securing funding, enforcing regulations, and ensuring conservation efforts are aligned with national policies.
  • C6: Presence of a Visitor Center—a binary (No/Yes) criterion, transformed into a numeric value (Yes > No) to be maximized. A visitor center serves as a hub for information, education, and visitor services. It enhances the visitor experience by providing resources such as maps, guided tours, and educational exhibits. The presence of a visitor center indicates a park’s investment in visitor services and its commitment to promoting environmental education and awareness.
  • C7: Quality of Telephone Contact—a qualitative criterion with three possible values: “They do not answer” (poor service), “They answer but have no information” (limited service), and “They answer and have information” (good service), transformed into numeric values to be maximized. The quality of telephone contact reflects the park’s responsiveness and ability to provide information to visitors. High-quality communication indicates efficient management and good customer service. Effective communication is essential for visitor satisfaction and operational efficiency, making this criterion a key indicator of park management quality.
  • C8: Presence of Cartography—a binary (No/Yes) criterion, transformed into a numeric value (Yes > No) to be maximized. Accurate and accessible maps are crucial for visitor navigation, safety, and enjoyment. Parks with high-quality cartography are better equipped to manage visitor flow and protect sensitive areas. Cartography is a fundamental tool for park management, ensuring that visitors can safely and effectively explore the park while minimizing environmental impact.
  • C9: Presence of Italian Alpine Club Routes—a binary (No/Yes) criterion, transformed into a numeric value (Yes > No) to be maximized. The presence of routes maintained by the Italian Alpine Club (CAI) indicates the park’s suitability for hiking and outdoor activities. These routes are well marked and maintained, attracting outdoor enthusiasts. CAI routes enhance the park’s appeal to hikers and outdoor adventurers, contributing to its recreational value and visitor numbers.
The selected criteria cover a broad range of aspects, including visitor engagement (e.g., number of activities, Facebook visitors), management tools (e.g., master plan, cartography), and infrastructure (e.g., visitor center, CAI routes). This ensures a balanced evaluation of park performance. The criteria selected for evaluation (C1 to C9) are derived from the Italian regional parks’ dataset built in Section 2.2, with the addition of three new variables: C3: Number of Facebook Page Visitors, C6: Presence of a Visitor Center, and C7: Quality of Telephone Contact. These additions were introduced to address specific challenges and gaps in the available data, ensuring a more comprehensive assessment of park performance.
In particular, C1, C2, C4, C5, C8, and C9 are directly derived from the 19 information categories in the dataset:
  • C1: Number of Activities (Category 16).
  • C2: Presence of an App (Category 19).
  • C4: Presence of a Master Plan (Category 11).
  • C5: Presence in the Official List of Protected Natural Areas (Category 3).
  • C8: Presence of Cartography (Category 10).
  • C9: Presence of Italian Alpine Club Routes (Category 17).
C3, Number of Facebook Page Visitors, was introduced to indirectly account for visitor engagement, as measuring the exact number of visitors across large park areas is challenging. Facebook page visitors serve as a proxy for online engagement and public interaction, which are critical for raising awareness and attracting visitors.
C6, Presence of a Visitor Center, was added to address the difficulty of measuring visitor numbers directly. Visitor centers, where present, often serve as hubs for visitor activity, and their presence can be used as an indicator of the park’s ability to manage and engage visitors effectively.
C7, Quality of Telephone Contact, was developed based on interactions with the phone number indicated on the park website. During data collection, the responsiveness and quality of communication during these interactions were transformed into a criterion to evaluate the park’s operational efficiency and visitor service quality.
These additional criteria were carefully chosen to complement the existing dataset and address specific challenges in measuring park performance. By incorporating these variables, this study ensures a more comprehensive and scientifically grounded evaluation, while maintaining a rigorous and reproducible framework.
Overall, two criteria (C1 and C3) are numeric, while the remaining seven are qualitative. Among them, C2, C4, C5, C6, C8, and C9 are binary (No/Yes), and C7 has three qualitative levels. All criteria are structured to be maximized for optimal park management.
Step 2: Constructing the Alternatives Matrix.
The alternatives matrix D is constructed with Italian regional parks as rows and the nine criteria as columns:
D = v 1,1 v 1,9 v 150,1 v 150,9
where vi,j represents the value of park i for criterion j.
Step 3: Assigning Initial Values.
Each park is assigned a value for each criterion based on the predefined descriptions.
Step 4: Transforming Qualitative Values into Numeric Values.
A numerical value is assigned to each qualitative value using the ‘average value of the intervals’ method [24]. This method follows the following equation:
Vi = (i − 1)/n + (1/n) (1/2), 1 ≤ i ≤ n, 0 < Vi < 1
where ‘Vi’ is the numeric value that corresponds to the qualitative value of the considered criterion that occupies position ‘i’ in the increasing ranking of qualitative values for that criterion and ‘n’ is the total number of qualitative values of the considered criteria.
For the qualitative criteria C2, C4, C5, C6, C8, and C9, n = 2, and therefore, the following calculations are employed:
  • V1 = (1 − 1)/2 + (1/2) (1/2) = 0 + 0.5 0.5 = 0.25 is the numeric value corresponding to the qualitative value “No”;
  • V2 = (2 − 1)/2 + (1/2) (1/2) = 0.5 + 0.5 0.5 = 0.75 is the numeric value corresponding to the qualitative value “Yes”.
For the qualitative criterion C7, n = 3, and therefore, the following calculations are employed:
  • V1 = (1 − 1)/3 + (1/3) (1/2) = 0 + 1/6 = 0.1667 is the numeric value corresponding to the qualitative value “They do not answer”;
  • V2 = (2 − 1)/3 + (1/3) (1/2) = 1/3 + 1/6 = 3/6 = 1/2 = 0.5 is the numeric value corresponding to the qualitative value “They answer but have no information”;
  • V3 = (3 − 1)/3 + (1/3) (1/2) = 2/3 + 1/6 = 5/6 = 0.8333 is the numeric value corresponding to the qualitative value “They answer and have information”.
Step 5: Calculating Maximum Values
The maximum value for each column is determined:
max(vj) = max(v1,j, v2,j, …, v150,j)
Step 6: Normalizing Values.
Each value is normalized by dividing it by the maximum value in the respective column:
xi,j = vi,j/max(vj)
Step 7: Computing the Priority Index (PI).
The Priority Index PIi for each park i is calculated as the average of its nine normalized criterion values:
P I i = 1 9 j = 1 9 x i , j
Step 8: Calculating the Normalized PI (NPI).
The Normalized Priority Index NPIi is derived by dividing each PIi by the highest PI value:
NPIi = PIi/(max(PI)
Step 9: Ranking the Parks.
Parks are ranked in decreasing order based on their NPI values (or PI).
Step 10: Calculating the Percentage Distance from the Top.
The park with the highest NPI is assigned 0%, while the park at the bottom has the maximum percentage distance:
Distancei = 100 × (1 − NPIi)
This structured MCDA approach enables an objective comparison of regional parks, identifying those with superior management performance and guiding future improvements.

3. Results

3.1. Italian Regional Parks’ Dataset and KPIs

Figure 2 presents the cumulative growth of Italian regional parks from 1935 to 2024. The dataset highlights establishment phases shaped by evolving environmental policies, legislative frameworks, and socio-economic conditions.
The first park was established in 1935, marking the beginning of regional park conservation in Italy. From 1936 to 1966, no new parks were created, keeping the total at just one park for over three decades. This stagnation suggests a lack of formal conservation policies or institutional frameworks during this period. The second and third parks were established in 1967, breaking the long period of inactivity. Park creation remained sporadic but steady, with notable increases in 1974 (three parks), 1975 (two parks), 1976 (three parks), and 1978 (four parks). By 1979, the number of regional parks reached 20, indicating a rising awareness of regional conservation efforts. The 1980s and 1990s saw a major boom in park creation, driven by national and regional legislative advancements. The acceleration in park creation during this period aligns with the development of European environmental policies and increased funding for conservation initiatives. After 1997, growth slowed significantly, with only occasional park establishments. The final additions occurred in 2014, when the total reached 150 parks. From 2015 onward, no new parks have been established, marking a plateau phase.
Following the methodology outlined in the methodological section, the dataset for Italian regional parks was compiled and is presented in Table S1 of the Supplementary Materials. This dataset includes key statistical measures such as minimum, maximum, mean, standard deviation, and coefficient of variation (calculated as the ratio of the standard deviation to the mean). From Table S1, the data were further segmented into three geographical regions (Northern, Central, and Southern Italy) resulting in the creation of Tables S2, S3, and S4, respectively, which are also included in the Supplementary Materials. To facilitate a comparative analysis of the key statistics across these geographical subdivisions, Table 1 and Table 2 were constructed.
Table 1 and Table 2 present a comparison of key statistics for Italian regional parks across different geographical subdivisions: North, Center, and South Italy. The tables provide an overview of various indicators, including the number of parks, land area, population, presence of management tools (such as Master Plans and Park Apps), and other relevant metrics.
This analysis is crucial for understanding the current state of environmental management in Italian regional parks and identifying areas for improvement. The data reveal regional disparities in the distribution and management of regional parks. Northern Italy has the most parks (mean = 11.25), followed by Central (mean = 7.25) and Southern Italy (mean = 3.88). This disparity is also reflected in the land area covered by parks, with Northern Italy having the largest mean land area (12,320.01 hectares), followed by Southern Italy (19,441.07 hectares) and Central Italy (8127.57 hectares). The higher number of parks and larger land area in the North may be attributed to greater economic resources and a longer history of environmental conservation efforts in this region.
The presence of management tools such as Master Plans and Park Apps varies across regions. Northern Italy shows a higher percentage of parks with Master Plans (52.7%) and Park Apps (51.6%) compared to Central and Southern Italy. Central Italy, despite having fewer parks, has a relatively high percentage of parks with Master Plans (46.4%) and Park Apps (67.9%). Southern Italy, while having the lowest number of parks, also shows a significant presence of Master Plans (61.3%) and Park Apps (51.6%). This suggests that while the number of parks may be lower in the South, the existing parks are relatively well equipped with management tools.
The population within park areas also varies significantly, with Northern Italy having the highest mean population (114,185.45) and Southern Italy having the lowest (144,449.03). The number of employees working in the parks is highest in Central Italy (mean = 25.40), followed by Northern Italy (mean = 17.73) and Southern Italy (mean = 13.79). This could indicate a higher level of investment in human resources in Central Italy, which may contribute to more effective park management.
The number of activities offered within the parks is relatively consistent across regions, with Northern Italy having the highest mean (2.92) and Southern Italy the lowest (1.90). The presence of cartography is universal across all regions, with 100% of parks in each region reporting its availability. This is a positive indicator, as accurate cartography is essential for effective park management and visitor navigation.
The presence of Italian Alpine Club routes is highest in Northern Italy (mean = 81.3%), followed by Central Italy (mean = 89.3%) and Southern Italy (mean = 63.3%). This reflects the geographical distribution of the Alps, which are predominantly located in Northern Italy. The lower presence of these routes in Southern Italy may be due to the different topography and lower elevation of the region.
The coefficient of variation provides insights into the variability of the data within each region. Northern Italy shows the lowest variability in the number of parks (0.80), indicating a more uniform distribution of parks across the region. Central Italy has the highest variability in land area (0.99), suggesting differences in the size of parks within this region. Southern Italy shows the highest variability in the number of employees (1.86), indicating a wide range in the number of staff working in parks across the region.
The findings from Table 1 and Table 2 highlight the need for a more balanced distribution of parks and resources across Italy. While Northern Italy has a well-established network of parks with robust management tools, Central and Southern Italy lag behind in terms of the number of parks and the availability of management resources. This disparity could be addressed through targeted investments and the sharing of best practices between regions.
The high variability in certain indicators, such as land area and the number of employees, suggests that there is no one-size-fits-all approach to park management. Instead, a tailored approach that takes into account the specific needs and characteristics of each region is necessary. The universal presence of cartography is a positive sign, but more efforts are needed to ensure that all parks have access to essential management tools such as Master Plans and Park Apps.
Table 1 and Table 2 provide valuable insights into the current state of Italian regional parks and highlight regional disparities in park distribution, management, and resources. The findings underscore the importance of a multicriteria decision-making approach in evaluating and improving the performance of regional parks. By addressing these disparities and sharing best practices, Italy can enhance the environmental management of its regional parks and ensure their long-term sustainability. This study serves as a benchmark for future research and provides a useful tool for policymakers and stakeholders involved in the management of protected areas.
Table S5 of the Supplementary Materials presents the dataset of Key Performance Indicators (KPIs) for Italian regional parks, including metrics such as Employees/Land Area (number/hectares), Employees/Inhabitants (number/inhabitants), Employees/Municipalities (number/municipality), and Activities/Employees. Similar to the dataset for Italian regional parks (Table S1), Table S5 is supplemented with key statistical measures, including minimum, maximum, mean, standard deviation, and coefficient of variation. To enable comparisons across geographical subdivisions, the dataset was divided into three subsets corresponding to Northern, Central, and Southern Italy. These subsets are provided in Tables S6, S7, and S8, respectively, in the Supplementary Materials. By consolidating the key statistics from these subsets, a comparison table was constructed.
Table 3 presents a comparison of Key Performance Indicators (KPIs) for Italian regional parks across different geographical subdivisions: North, Center, and South. The KPIs include Employees/Land Area, Employees/Inhabitants, Employees/Municipalities, and Activities/Employees. These indicators provide a comprehensive view of the operational and managerial efficiency of regional parks in Italy, highlighting regional disparities and similarities.
The Employees/Land Area ratio indicates the density of park employees relative to the land area they manage. The data reveal that the North has the highest mean ratio (0.017), followed by the Center (0.025) and the South (0.001). This suggests that parks in the North and Center are more densely staffed compared to those in the South. The high coefficient of variation in the North (4.908) indicates substantial variability in staffing levels across parks in this region. In contrast, the South shows a much lower mean and less variability, reflecting a more consistent but sparse staffing pattern.
The Employees/Inhabitants ratio measures the number of park employees relative to the local population. The North again leads with the highest mean ratio (0.013), indicating a higher level of park staffing per inhabitant. The Center and South have lower means (0.004 and 0.000, respectively), suggesting fewer employees relative to the population. The high coefficient of variation in the North (6.677) underscores the uneven distribution of park employees relative to the population, while the South’s low mean and variation suggest a more uniform but minimal presence of park staff.
The Employees/Municipalities ratio reflects the number of park employees per municipality. The Center has the highest mean (7.630), indicating a greater concentration of park employees per municipality compared to the North (4.307) and the South (2.807). The high standard deviation in the Center (10.292) suggests significant variability, possibly due to the presence of larger parks or more municipalities with dedicated park staff. The South has the lowest mean, indicating fewer employees per municipality, which could reflect a more decentralized or less intensive management approach.
The Activities/Employees ratio measures the number of activities conducted per employee, serving as a proxy for employee productivity. The South has the highest mean (0.892), suggesting that employees in this region are involved in more activities compared to their counterparts in the North (0.352) and Center (0.284). However, the high standard deviation (1.146) in the South indicates considerable variability in activity levels, possibly due to differences in park size, resources, or management practices. The lower means in the North and Center suggest a more balanced or less intensive activity load per employee.

3.2. Multicriteria Decision Analysis (MCDA)

The first step of the MCDA procedure involved defining the 10 comparison criteria, as outlined in the methodological section. In the second step, an alternatives matrix was constructed, with Italian regional parks represented as rows and the nine criteria as columns. During the third step, each park was assigned a value for each criterion based on predefined descriptions. The results of this step are presented in Table S9 of the Supplementary Materials, which contains the alternatives matrix with both qualitative and quantitative values.
The fourth step of the MCDA procedure involved converting qualitative values into numerical values using the ‘average value of the intervals’ technique, as described in the methodological section. The results of this conversion are provided in Table S10 of the Supplementary Materials, which contains the alternatives matrix with numeric values.
In the fifth step, the maximum value for each column was calculated. The sixth step involved normalizing the values in the alternatives matrix by dividing each value by the maximum value in its respective column. The seventh step focused on calculating the Priority Index (PI) for each park, which was derived as the average of its nine normalized criterion values. In the eighth step, the Normalized Priority Index (NPI) was calculated by dividing each PI by the highest PI value. The results of these calculations are reported in Table S11 of the Supplementary Materials, which contains the normalized alternatives matrix along with the PI and NPI values.
The ninth step of the MCDA procedure involved ranking the parks in decreasing order based on their PI (or NPI) values.
The tenth and final step consisted of calculating the percentage distance from the top-performing park. The results of these final steps are presented in Table S12 of the Supplementary Materials, which contains the ranked alternatives matrix along with the percentage distances from the top. The calculation of the percentage distance from the top-performing park serves as a critical benchmarking tool, allowing for a structured comparison of park performance. This step quantifies the gap between each park and the highest-ranking park, providing a clear metric to identify areas requiring improvement. Parks with a smaller percentage distance are performing relatively well, while those with a larger percentage distance may need targeted interventions.
This information can be directly linked to action plans and recommendations by categorizing parks based on their performance gaps:
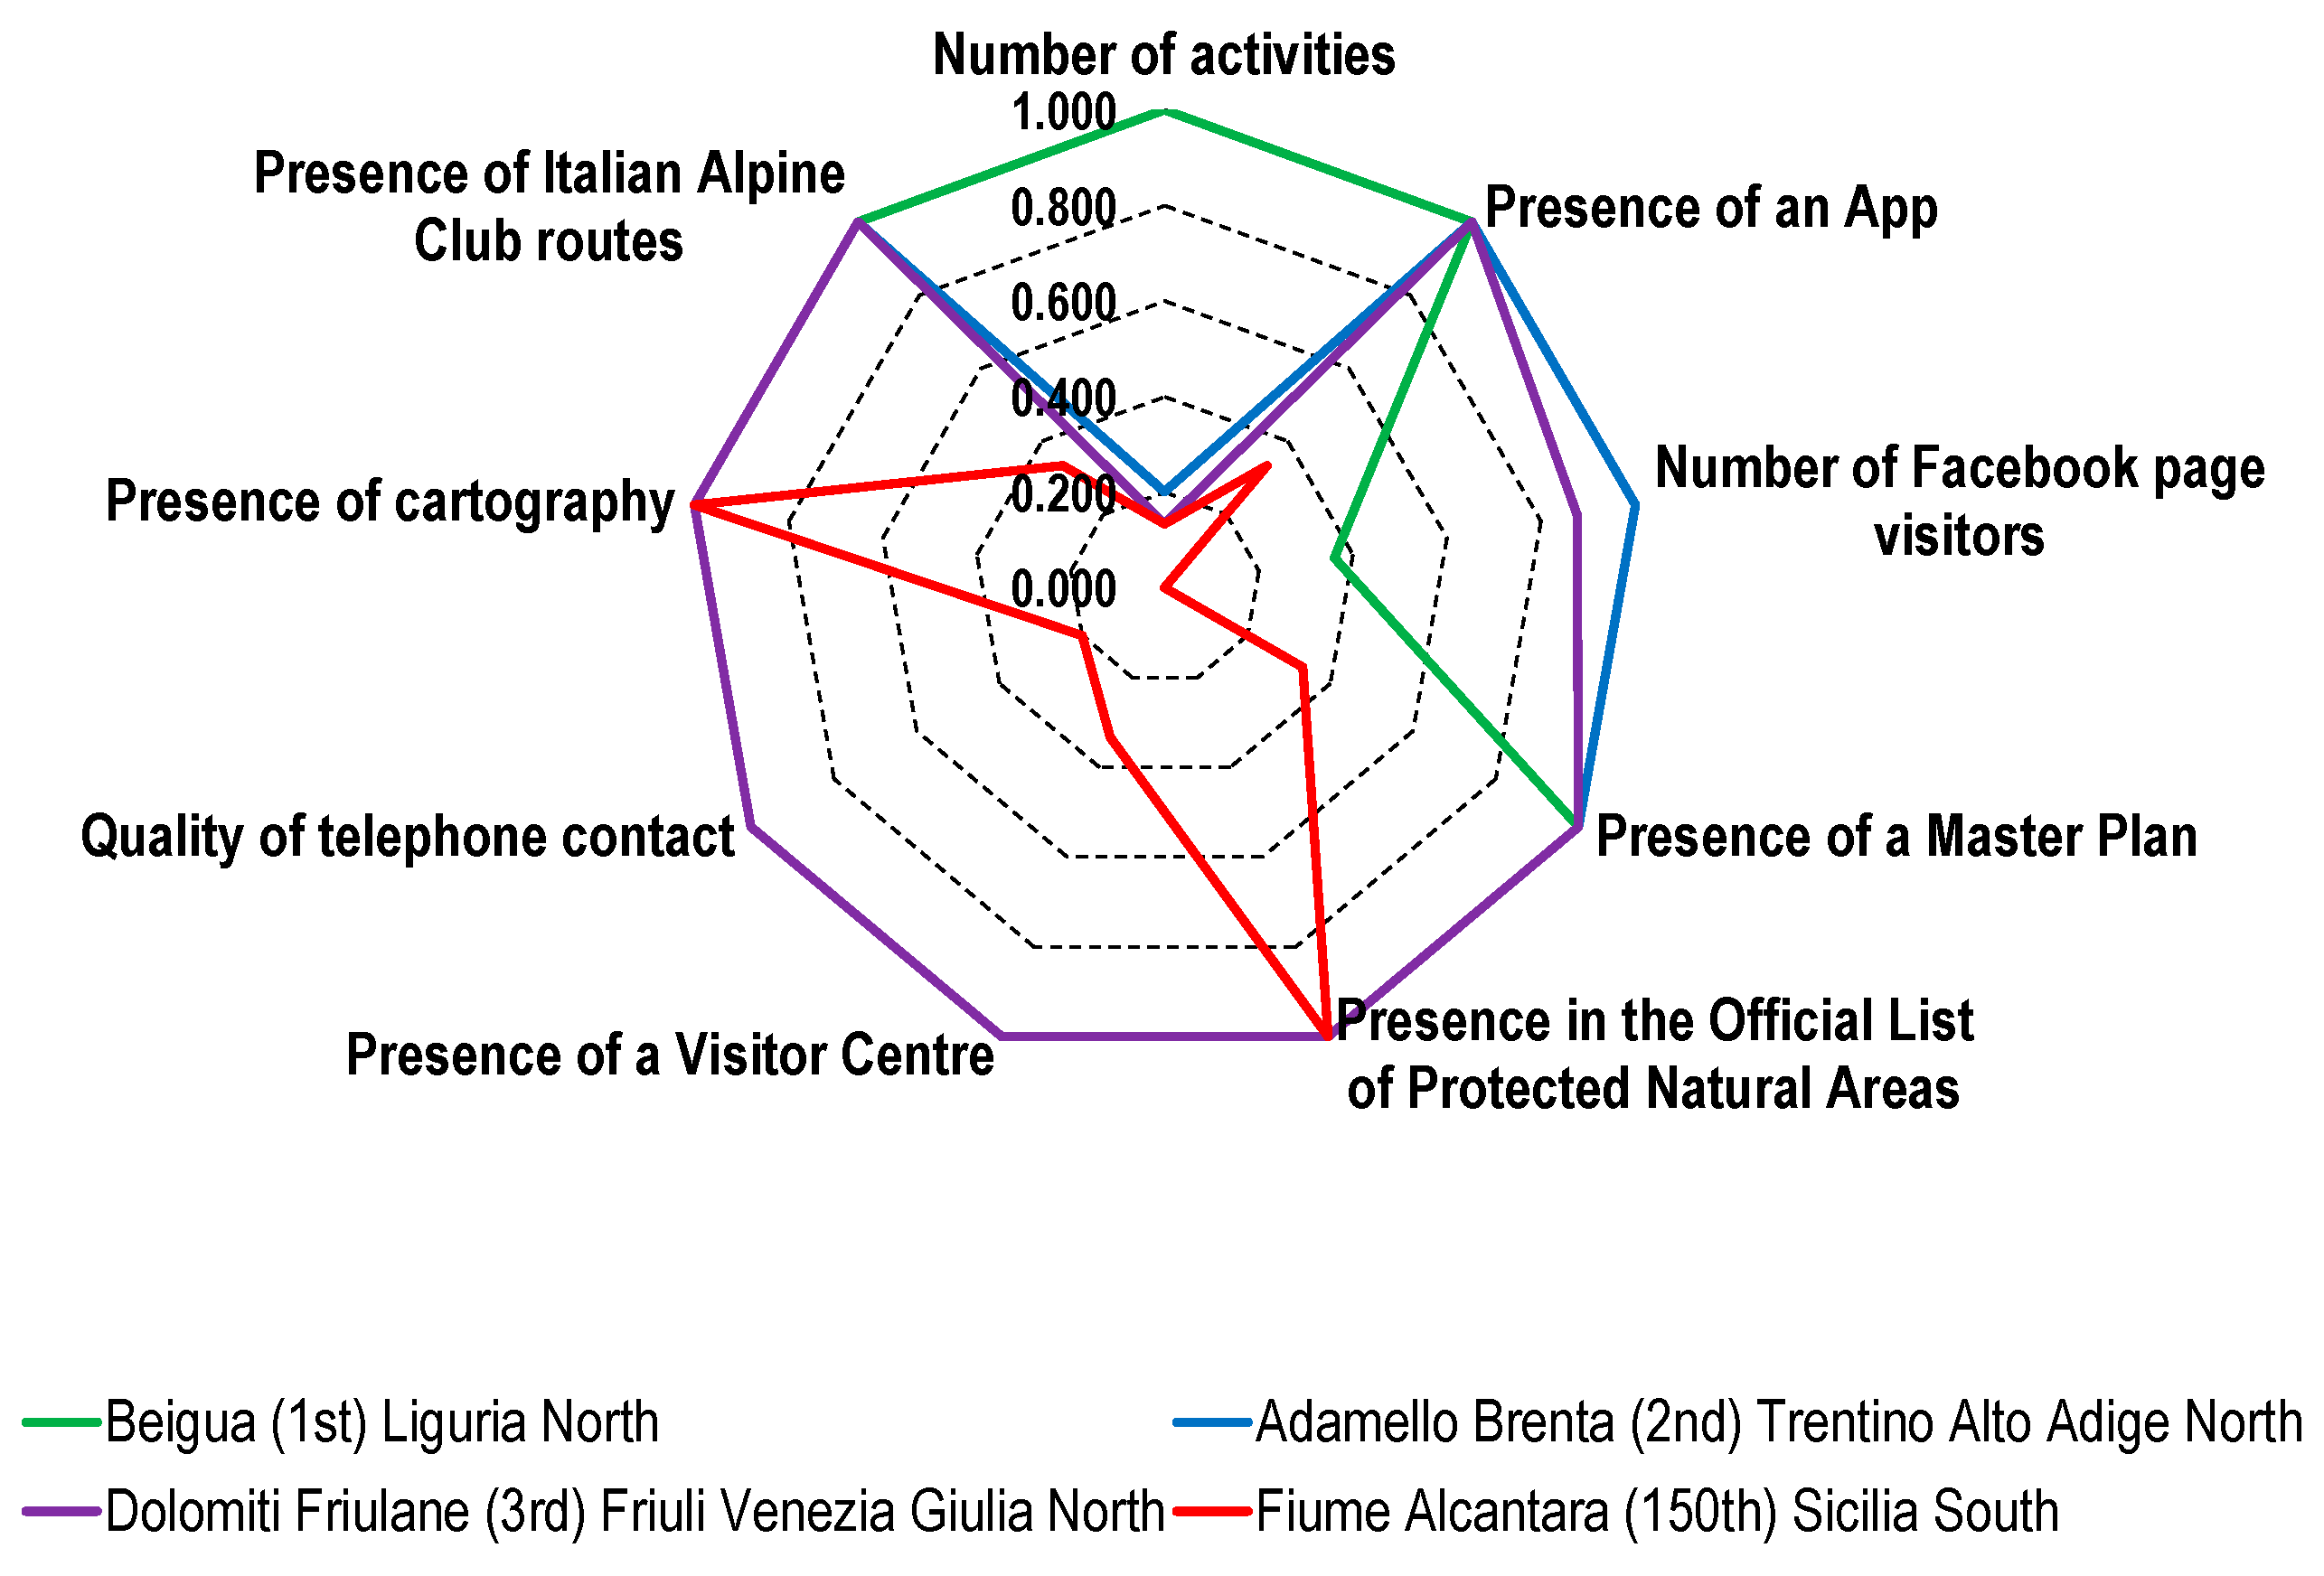
  • High-Performing Parks (Top 25%): These parks, such as Beigua Regional Park and Adamello Brenta Natural Park, serve as best-practice models. Their success can be attributed to a combination of strong management tools, digital engagement, visitor facilities, and staff efficiency. These parks should focus on maintaining and refining their existing strategies while sharing best practices with other parks.
  • Moderate-Performing Parks (Middle 50%): Parks in this range exhibit mixed strengths and weaknesses. Some may excel in digital engagement but lack structured conservation plans, while others may have strong staffing levels but low visitor engagement. For these parks, targeted action plans can be designed to address specific gaps, such as improving administrative capacity, increasing conservation activities, or enhancing visitor facilities.
  • Low-Performing Parks (Bottom 25%): These parks show the largest percentage distance from the top and require strategic interventions. Their challenges could stem from insufficient staffing, lack of digital engagement, inadequate infrastructure, or minimal visitor activities. Recommendations for these parks should focus on capacity-building, securing additional funding, and adopting best practices from top-ranked parks.
By using the percentage distance from the top as a reference, policymakers and park managers can develop customized strategies to enhance park sustainability and management efficiency. The step serves as a practical guide for decision-making, ensuring that underperforming parks receive targeted support while top-performing parks continue to lead in innovation and conservation efforts.
As shown in Figure 3, the top three parks in the ranking, i.e., Beigua Regional Park, Adamello Brenta Natural Park, and Dolomiti Friulane Natural Park, stand out as exemplary models of effective park management and visitor engagement.
Beigua Regional Park leads in infrastructure, featuring a comprehensive master plan, visitor center, and high-quality cartography. These elements ensure efficient park management and enhance the visitor experience. The park has a strong digital presence, with an active app and a significant number of Facebook page visitors (0.361 relative score). This reflects effective use of digital tools to engage with visitors and promote the park’s activities. The park offers a wide range of activities (score of 1 for number of activities), which likely contributes to its popularity and high visitor satisfaction. Additionally, the presence of Italian Alpine Club routes adds to its appeal for outdoor enthusiasts. The quality of telephone contact is rated highly, indicating effective communication channels between the park administration and visitors. Beigua’s success can be attributed to its holistic approach to park management, combining robust infrastructure, digital innovation, and diverse visitor activities. Other parks can learn from Beigua’s model by investing in similar infrastructure and digital engagement strategies.
Adamello Brenta Natural Park ranks highest in Facebook engagement (1.000), demonstrating effective digital outreach. This suggests that the park has successfully leveraged social media to attract and interact with visitors. Like Beigua, this park has a well-developed master plan, a visitor center, and high-quality cartography. These elements contribute to its efficient management and visitor satisfaction. Although the park has a lower score for the number of activities (0.2) compared to Beigua, it compensates with its strong digital presence and infrastructure. The presence of Italian Alpine Club routes further enhances its appeal. Adamello Brenta’s success highlights the importance of digital engagement in modern park management. Parks with limited resources for physical infrastructure can still achieve high performance by focusing on digital outreach and visitor interaction.
Dolomiti Friulane Natural Park has a strong digital presence, with a high relative score for Facebook page visitors (0.876). This indicates effective use of social media to engage with visitors and promote the park. The park benefits from a well-developed master plan, a visitor center, and high-quality cartography, similar to the top two parks. These elements ensure efficient management and a positive visitor experience. The park offers a moderate number of activities (score of 0.133), which, while lower than Beigua, is complemented by its strong digital engagement and infrastructure. Dolomiti Friulane’s performance demonstrates that a combination of digital engagement and solid infrastructure can lead to high rankings, even with fewer activities. Parks in regions with limited resources can adopt similar strategies to improve their performance.
All three parks excel in digital engagement (Facebook visitors and app presence) and infrastructure (master plan, visitor center, and cartography). These factors are critical for modern park management and visitor satisfaction. They all have Italian Alpine Club routes, which enhance their appeal to outdoor enthusiasts and contribute to their high rankings. Beigua stands out for its diverse range of activities (score of 1), which likely contributes to its top ranking. Adamello Brenta has the highest digital engagement (Facebook visitors score of 1.000), making it a model for parks looking to improve their online presence. Dolomiti Friulane demonstrates that moderate activity offerings can still result in high performance when combined with strong infrastructure and digital engagement. All three parks are located in Northern Italy, reinforcing the regional disparity observed in the overall analysis. Their success can be attributed to better funding, management practices, and infrastructure compared to parks in Central and Southern Italy.

4. Discussion

4.1. Italian Regional Parks’ Dataset and KPIs

The data about the Italian regional parks’ dataset and specifically KPIs highlight regional disparities in the management and operational efficiency of Italian regional parks. The North and Center generally exhibit higher staffing levels and more concentrated management efforts, as evidenced by higher mean ratios for Employees/Land Area and Employees/Municipalities. In contrast, the South shows lower staffing levels but higher activity levels per employee, indicating a different management approach that may rely on fewer staff to conduct a broader range of activities.
Southern Italian regions (Campania, Molise, and Basilicata) exhibit diverse environmental and socio-economic conditions compared to other areas of the country, with marginal areas requiring appropriate socio-economic development policies [2]. This suggests that park management strategies need to adapt to the specific needs and resources of each region. The management approach in the South, therefore, might be characterized by a greater need to optimize available resources, with fewer personnel performing a wider range of activities.
The Apennine areas (which extend through the Center and North) show high ecological values, while lowland areas (where some southern regions are located) have lower values [10]. This territorial difference could explain how diverse environmental characteristics influence park management strategies, requiring tailored approaches based on the specific context.
The “diffused naturalness” of the North and Central areas, characterized by the interpenetration of natural and anthropogenic elements, could require greater effort in coordination and management, justifying the presence of higher staffing levels and more concentrated efforts in these regions [10].
Furthermore, urban green areas, more widespread in the Northern and Central Italy, if well managed, can become an important element of territorial management, underlining the need for an integrated approach that involves various skills and resources [25].
In Umbria (Central Italy), some Natura 2000 sites have received more funding for recreational infrastructure than other sites, highlighting how there can be differences in activity levels and resources allocated to management even within a single region [16], supporting the idea of broader regional differences in efficiency and staff allocation.
The requalification of traditional farmhouses in Apulia (southern Italy) can support rural tourism, suggesting that in the South, resources might also be allocated to enhancing local traditions, an activity that is less of a priority in other areas of the country [6].
The analysis of biodiversity in protected areas of Tuscany provides a concrete example of how environmental policies can be evaluated in regions with a high concentration of parks [9]. This type of study is useful for comparing the effectiveness of conservation strategies in different regions of Italy.
These findings have important implications for environmental management and benchmarking. The variability in KPIs across regions suggests that there is no one-size-fits-all approach to managing regional parks. Instead, tailored strategies that consider regional characteristics and resource availability are needed.

4.2. Multicriteria Decision Analysis (MCDA)

Parks should prioritize the development of apps and active social media presence to engage with visitors and promote their activities. Developing a master plan, visitor center, and high-quality cartography should be a priority for parks aiming to improve their performance. Offering a wide range of activities, as seen in Beigua, can enhance visitor satisfaction and park performance. Parks in Central and Southern Italy can learn from the top-performing Northern parks by adopting best practices in digital engagement, infrastructure, and activity diversification.
The top three parks serve as benchmarks for effective park management. Their success is driven by a combination of strong infrastructure, digital engagement, and diverse activities. By adopting similar strategies, other parks, particularly those in Central and Southern Italy, can improve their performance and contribute to the sustainable management of Italy’s regional parks. This analysis underscores the importance of integrating digital tools, infrastructure development, and visitor engagement in park management, providing a roadmap for future improvements across the country.
The MCDA methodology, as demonstrated in comparisons with other studies, is a versatile and widely applicable tool for addressing various environmental challenges. For instance, Vizzari (2011) [26] illustrates how multicriteria techniques, particularly AHP, can be used to analyse and assess landscape quality through spatial indicators. The MCDA approach proves valuable not only for environmental assessments but also for territorial planning and resource management. Other studies have applied this method to wildfire risk assessment, site selection for new parks, management of Natura 2000 areas, and sustainable mobility planning. Notably, Zucca et al. (2008) [12] highlighted how spatial multicriteria analysis can enhance transparency and streamline the decision-making process in selecting sites for local parks.
Integrating performance indicators with the MCDA methodology provides a more comprehensive and detailed view of park performance, revealing regional differences across Italy. This approach is supported by studies emphasizing the importance of indicators in assessing sustainability and guiding decisions in complex territorial management. For example, Comino and Ferretti (2016) [3] employed a spatial SWOT analysis based on indicators for strategic park planning, while Delmotte et al. (2013) [27] stressed the need for an integrated assessment of agricultural systems that considers multiple functions through an indicator-based multicriteria analysis.
A key consideration is the need to account for regional specificities and adopt tailored management strategies accordingly. De Montis (2014) [21] supported this perspective, highlighting how the implementation of the European Landscape Convention varies across national institutional contexts and emphasizing the effectiveness of qualitative indicators in analyzing such complexities. Furthermore, economic factors play a critical role in park management, as evidenced by Zucca et al. (2008) [12], who examined the economic impacts of establishing local parks, and Scorza et al. (2020) [19], who integrated ecosystem services with multicriteria analysis to assess the effects of territorial changes.

5. Conclusions

This study provides a multicriteria analysis of Italian regional parks, offering key insights into their environmental management and operational efficiency. By integrating a wide array of indicators and employing a robust multicriteria decision-making framework, this research highlights significant regional disparities in the distribution, management, and resource allocation of regional parks across Italy. The findings underscore the importance of adopting a tailored approach to park management, considering the unique characteristics and needs of each region.
The analysis reveals that Northern Italy leads in terms of the number of parks, land area, and the availability of management tools such as Master Plans and Park Apps. This region also demonstrates higher staffing levels and more concentrated management efforts, as evidenced by the higher ratios of Employees/Land Area and Employees/Municipalities. In contrast, Southern Italy, while having fewer parks, shows a higher level of activity per employee, suggesting a different management approach that may rely on fewer staff to conduct a broader range of activities. Central Italy, though with fewer parks, exhibits a relatively high presence of management tools and a higher number of employees per municipality, indicating a more intensive management approach.
The multicriteria decision analysis (MCDA) further identifies the top-performing parks, such as Beigua Regional Park, Adamello Brenta Natural Park, and Dolomiti Friulane Natural Park, all located in Northern Italy. These parks excel in digital engagement, infrastructure development, and visitor activities, serving as exemplary models for effective park management. Their success highlights the importance of integrating digital tools, robust infrastructure, and diverse visitor activities to enhance park performance and visitor satisfaction.
This study also emphasizes the need for a more balanced distribution of resources and best practices across Italy’s regional parks. While Northern Italy benefits from better funding and established management practices, Central and Southern Italy lag behind in terms of park numbers and resource availability. Addressing these disparities through targeted investments and the sharing of best practices can enhance the overall effectiveness of regional park management in Italy.
This research provides a valuable benchmark for evaluating and improving the performance of Italian regional parks. The multicriteria approach offers a comprehensive framework for identifying best practices and areas for improvement, facilitating knowledge sharing among diverse stakeholders. Implementing the successful strategies of top-performing parks—digital engagement, infrastructure development, and activity diversification—can enhance management and support Italy’s conservation efforts. This study not only advances the field of environmental management but also provides actionable insights for policymakers and stakeholders involved in the governance of protected areas.
While this study focused on evaluating Italian regional parks using Key Performance Indicators related to management efficiency, future research could explore emerging technologies to advance environmental management and sustainability. Artificial Intelligence (AI) could enhance smart waste management and water conservation monitoring, providing real-time data for better resource allocation. Internet of Things (IoT) solutions, such as smart lighting systems powered by renewable energy, could improve energy efficiency in park operations.
Additionally, Geographic Information Systems (GISs) could be further integrated for land-use optimization, conservation planning, and biodiversity protection. The use of Radio-Frequency Identification (RFID) and sensor-based technologies could assist in tracking visitor flows, ensuring safety, and optimizing asset management within parks. Future studies should consider these innovative approaches to enhance sustainability while improving visitor experience and operational efficiency.

Supplementary Materials

The following supporting information can be downloaded at https://www.mdpi.com/article/10.3390/su17062560/s1: Table S1: Dataset of the Italian regional parks; Table S2: Dataset of the Northern Italy regional parks; Table S3: Dataset of the Central Italy regional parks; Table S4: Dataset of the Southern Italy regional parks; Table S5: Dataset of the Key Performance Indicators (KPIs) for the Italian regional parks; Table S6: Dataset of the Key Performance Indicators (KPIs) for the Northern Italy regional parks; Table S7: Dataset of the Key Performance Indicators (KPIs) for the Central Italy regional parks; Table S8: Dataset of the Key Performance Indicators (KPIs) for the Southern Italy regional parks; Table S9: The alternatives matrix with qualitative and quantitative values; Table S10: The alternatives matrix with numeric values; Table S11: The normalized alternatives matrix with the calculation of PI and NPI; Table S12: The ranked alternatives matrix with the calculation of percentage distances from the top.

Author Contributions

Conceptualization, G.D.F.; methodology, G.D.F.; software, G.D.F. and E.D.C.; validation, G.D.F. and L.B.; formal analysis, G.D.F. and E.D.C.; investigation, G.D.F. and E.D.C.; data curation, G.D.F. and E.D.C.; writing—original draft preparation, G.D.F.; writing—review and editing, G.D.F.; visualization, G.D.F. and L.B.; supervision, G.D.F. and L.B. All authors have read and agreed to the published version of the manuscript.

Funding

This research received no external funding.

Institutional Review Board Statement

Not applicable.

Informed Consent Statement

Not applicable.

Data Availability Statement

Data supporting the reported results can be found in the Supplementary Materials.

Conflicts of Interest

The authors declare no conflicts of interest.

Abbreviations

The following abbreviations are used in this manuscript:
AHPAnalytic Hierarchy Process
AIArtificial Intelligence
ANPAnalytic Network Process
CAIClub Alpino Italiano (i.e., Italian Alpine Club)
COPRASComplex Proportional Assessment
EUAPElenco Ufficiale delle Aree Naturali Protette (i.e., Official List of Protected Natural Areas)
GISGeographic Information System
IoTInternet of Things
KPIsKey Performance Indicators
MCDAMulticriteria Decision Analysis
NPINormalized Priority Index
PIRFIDPriority IndexRadio-Frequency Identification
SWOTStrengths, Weaknesses, Opportunities, Threats
TOPSISTechnique for Order Preference by Similarity to Ideal Solution
VIKORVlseKriterijumska Optimizacija I Kompromisno Resenje (i.e., multicriteria optimization and compromise solution)
WASPASWeighted Aggregated Sum Product Assessment
WLCWeighted Linear Combination

References

  1. Bassi, I.; Gori, E.; Iseppi, L. Assessing environmental awareness towards protection of the Alps: A case study. Land Use Policy 2019, 87, 104028. [Google Scholar] [CrossRef]
  2. Cervelli, E.; Pindozzi, S.; Sacchi, M.; Capolupo, A.; Cialdea, D.; Rigillo, M.; Boccia, L. Supporting land use change assessment through Ecosystem Services and Wildlife Indexes. Land Use Policy 2017, 65, 249–265. [Google Scholar] [CrossRef]
  3. Comino, E.; Ferretti, V. Indicators-based spatial SWOT analysis: Supporting the strategic planning and management of complex territorial systems. Ecol. Indic. 2016, 60, 1104–1117. [Google Scholar] [CrossRef]
  4. Kalinauskas, M.; Bogdzevič, K.; Gomes, E.; Inácio, M.; Barcelo, D.; Zhao, W.; Pereira, P. Mapping and assessment of recreational cultural ecosystem services supply and demand in Vilnius (Lithuania). Sci. Total Environ. 2023, 855, 158590. [Google Scholar] [CrossRef]
  5. Palmisano, G.O.; Govindan, K.; Loisi, R.V.; Dal Sasso, P.; Roma, R. Greenways for rural sustainable development: An integration between geographic information systems and group analytic hierarchy process. Land Use Policy 2016, 50, 429–440. [Google Scholar] [CrossRef]
  6. Palmisano, G.O.; Loisi, R.V.; Ruggiero, G.; Rocchi, L.; Boggia, A.; Roma, R.; Dal Sasso, P. Using Analytic Network Process and Dominance-based Rough Set Approach for sustainable requalification of traditional farm buildings in Southern Italy. Land Use Policy 2016, 59, 95–110. [Google Scholar] [CrossRef]
  7. North, L.A.; van Beynen, P.E.; Parise, M. Interregional comparison of karst disturbance: West-central Florida and southeast Italy. J. Environ. Manag. 2009, 90, 1770–1781. [Google Scholar] [CrossRef]
  8. Marignani, M.; Bruschi, D.; Garcia, D.A.; Frondoni, R.; Carli, E.; Pinna, M.S.; Cumo, F.; Gugliermetti, F.; Saatkamp, A.; Doxa, A.; et al. Identification and prioritization of areas with high environmental risk in Mediterranean coastal areas: A flexible approach. Sci. Total Environ. 2017, 590–591, 566–578. [Google Scholar] [CrossRef]
  9. Riccioli, F.; Fratini, R.; Boncinelli, F.; El Asmar, T.; El Asmar, J.P.; Casini, L. Spatial analysis of selected biodiversity features in protected areas: A case study in Tuscany region. Land Use Policy 2016, 57, 540–554. [Google Scholar] [CrossRef]
  10. Rossi, P.; Pecci, A.; Amadio, V.; Rossi, O.; Soliani, L. Coupling indicators of ecological value and ecological sensitivity with indicators of demographic pressure in the demarcation of new areas to be protected: The case of the Oltrepò Pavese and the Ligurian-Emilian Apennine area (Italy). Landsc. Urban Plan. 2008, 85, 12–26. [Google Scholar] [CrossRef]
  11. Tenerelli, P.; Demšar, U.; Luque, S. Crowdsourcing indicators for cultural ecosystem services: A geographically weighted approach for mountain landscapes. Ecol. Indic. 2016, 64, 237–248. [Google Scholar] [CrossRef]
  12. Zucca, A.; Sharifi, A.M.; Fabbri, A.G. Application of spatial multi-criteria analysis to site selection for a local park: A case study in the Bergamo Province, Italy. J. Environ. Manag. 2008, 88, 752–769. [Google Scholar] [CrossRef] [PubMed]
  13. Goncalves, G.; Masson, E.; Wei, X. Sustainable Management of Energy Wood Chips Sector: Case Study of the Regional Park “Caps et Marais d’Opale”. Procedia Soc. Behav. Sci. 2016, 221, 352–361. [Google Scholar] [CrossRef]
  14. Nin, M.; Soutullo, A.; Rodríguez-Gallego, L.; Di Minin, E. Ecosystem services-based land planning for environmental impact avoidance. Ecosyst. Serv. 2016, 17, 172–184. [Google Scholar] [CrossRef]
  15. Zavadskas, E.K.; Bausys, R.; Mazonaviciute, I. Safety evaluation methodology of urban public parks by multi-criteria decision making. Landsc. Urban Plan. 2019, 189, 372–381. [Google Scholar] [CrossRef]
  16. Rocchi, L.; Cortina, C.; Paolotti, L.; Boggia, A. Recreation vs conservation in Natura 2000 sites: A spatial multicriteria approach analysis. Land Use Policy 2020, 99, 105094. [Google Scholar] [CrossRef]
  17. Poli, G.; Cuntò, S.; Muccio, E.; Cerreta, M. A spatial decision support system for multi-dimensional sustainability assessment of river basin districts: The case study of Sarno river, Italy. Land Use Policy 2024, 141, 107123. [Google Scholar] [CrossRef]
  18. Castanedo, S.; Juanes, J.A.; Medina, R.; Puente, A.; Fernandez, F.; Olabarrieta, M.; Pombo, C. Oil spill vulnerability assessment integrating physical, biological and socio-economical aspects: Application to the Cantabrian coast (Bay of Biscay, Spain). J. Environ. Manag. 2009, 91, 149–159. [Google Scholar] [CrossRef]
  19. Scorza, F.; Pilogallo, A.; Saganeiti, L.; Murgante, B.; Pontrandolfi, P. Comparing the territorial performances of renewable energy sources’ plants with an integrated ecosystem services loss assessment: A case study from the Basilicata region (Italy). Sustain. Cities Soc. 2020, 56, 102082. [Google Scholar] [CrossRef]
  20. Courtois, P.; Martinez, C.; Thomas, A. Spatial priorities for invasive alien species control in protected areas. Sci. Total Environ. 2023, 878, 162675. [Google Scholar] [CrossRef]
  21. De Montis, A. Impacts of the European Landscape Convention on national planning systems: A comparative investigation of six case studies. Landsc. Urban Plan. 2014, 124, 53–65. [Google Scholar] [CrossRef]
  22. Balasubramaniam, A.; Voulvoulis, N. The Appropriateness of Multicriteria Analysis in Environmental Decision-Making Problems. Environ. Technol. 2005, 26, 951–962. [Google Scholar] [CrossRef] [PubMed]
  23. De Feo, G.; Galasso, M.; Landi, R.; Donnarumma, A.; De Gisi, S. A comparison of the efficacy of organic and mixed-organic polymers with polyaluminium chloride in chemically assisted primary sedimentation (CAPS). Environ. Technol. 2013, 34, 1297–1305. [Google Scholar] [CrossRef] [PubMed]
  24. De Feo, G.; Cerrato, F.; Siano, P.; Torretta, V. Definition of a multi-criteria, web-based approach to managing the illegal dumping of solid waste in Italian villages. Environ. Technol. 2014, 35, 104–114. [Google Scholar] [CrossRef]
  25. La Rosa, D.; Takatori, C.; Shimizu, H.; Privitera, R. A planning framework to evaluate demands and preferences by different social groups for accessibility to urban greenspaces. Sustain. Cities Soc. 2018, 36, 346–362. [Google Scholar] [CrossRef]
  26. Vizzari, M. Spatial modelling of potential landscape quality. Appl. Geogr. 2011, 31, 108–118. [Google Scholar] [CrossRef]
  27. Delmotte, S.; Lopez-Ridaura, S.; Barbier, J.M.; Wery, J. Prospective and participatory integrated assessment of agricultural systems from farm to regional scales: Comparison of three modeling approaches. J. Environ. Manag. 2013, 129, 493–502. [Google Scholar] [CrossRef]
Figure 1. MCDA procedure framework outlining its 10 steps.
Sustainability 17 02560 g001
Figure 2. Evolution of the cumulative number of Italian regional parks over their years of establishment.
Sustainability 17 02560 g002
Figure 3. Radar graph illustrating the performance metrics of the top three and lowest-ranked Italian regional parks.
Sustainability 17 02560 g003
Table 1. Comparison of key statistics for Italian regional parks across different geographical subdivisions.
RegionKey StatisticsNumber of Parks per RegionLand Area (Hectares)Number of InhabitantsNumber of MunicipalitiesNumber of EmployeesNumber of Activities
ItalyMin170100
Max2591,1402,843,9626010315
Mean7.5013,009.11130,648.469.4918.382.75
Standard deviation7.2017,647.23323,143.1510.1618.171.97
Coefficient of variation0.961.362.471.070.990.72
NorthMin1430101
Max2591,1401,809,555606315
Mean11.2512,320.01114,185.4510.36317.732.92
Standard deviation9.0216,970.67280,446.2311.34914.042.17
Coefficient of variation0.801.382.461.0950.790.74
CenterMin371000131
Max1629,9902,843,96220759
Mean7.258127.57168,874.045.8925.403.14
Standard deviation6.138011.38528,294.565.2723.271.94
Coefficient of variation0.850.993.130.890.920.62
SouthMin15024616100
Max1088,887769,833301034
Mean3.8819,441.07144,449.0310.1913.791.90
Standard deviation3.4823,633.42170,611.129.3025.620.87
Coefficient of variation0.901.221.180.911.860.46
Table 2. Distribution of management tools and infrastructure across Italian regional parks across different geographical subdivisions.
RegionCounting and
Percentages
Presence in the
Official List of
Protected Natural Areas
Presence of a Master PlanPresence of a
Park App
Presence of CartographyPresence of
Italian Alpine Club Routes
ItalyNumber of ‘Yes’1308082150118
Number of ‘No’207068031
Percentage of ‘Yes’86.7%53.3%54.7%100.0%79.2%
Percentage of ‘No’13.3%46.7%45.3%0.0%20.8%
NorthNumber of ‘Yes’7648479174
Number of ‘No’154344017
Percentage of ‘Yes’83.5%52.7%51.6%100.0%81.3%
Percentage of ‘No’16.5%47.3%48.4%0.0%18.7%
CenterNumber of ‘Yes’2613192825
Number of ‘No’215903
Percentage of ‘Yes’92.9%46.4%67.9%100.0%89.3%
Percentage of ‘No’7.1%53.6%32.1%0.0%10.7%
SouthNumber of ‘Yes’2819163119
Number of ‘No’31215011
Percentage of ‘Yes’90.3%61.3%51.6%100.0%63.3%
Percentage of ‘No’9.7%38.7%48.4%0.0%36.7%
Table 3. Comparison of Key Performance Indicators (KPIs) for Italian regional parks across geographical subdivisions.
RegionKey
Statistics
Employees/Land Area (Number/Hectares)Employees/Inhabitants (Number/Inhabitants)Employees/Municipalities (Number/Municipality)Activities/Employees
ItalyMin0.0000.0000.0000.000
Max0.7230.75052.0004.000
Mean0.0160.0094.6230.423
Standard deviation0.0720.0707.7910.633
Coefficient of variation4.5267.5291.6851.495
NorthMin0.0000.0000.0000.019
Max0.7230.75052.0003.000
Mean0.0170.0134.3070.352
Standard deviation0.0840.0857.0230.476
Coefficient of variation4.9086.6771.6301.354
CenterMin0.0000.0000.5330.028
Max0.1920.04546.0001.000
Mean0.0250.0047.6300.284
Standard deviation0.0510.01110.2920.294
Coefficient of variation2.0192.6021.3491.035
SouthMin0.0000.0000.0000.000
Max0.0090.00133.0004.000
Mean0.0010.0002.8070.892
Standard deviation0.0020.0007.5021.146
Coefficient of variation1.9661.3932.6731.285
Disclaimer/Publisher’s Note: The statements, opinions and data contained in all publications are solely those of the individual author(s) and contributor(s) and not of MDPI and/or the editor(s). MDPI and/or the editor(s) disclaim responsibility for any injury to people or property resulting from any ideas, methods, instructions or products referred to in the content.

