
The Baku Paradox: An Analysis of Selected Sustainable Development Goals


Abstract
1. Introduction
2. Methodology
2.1. Data
2.2. Partial Order Methodology
3. Results and Discussion
4. Conclusions and Outlook
Funding
Institutional Review Board Statement
Informed Consent Statement
Data Availability Statement
Conflicts of Interest
Appendix A. Global SDG Index for 2000–2023 [9]
| Year | World | HIC | LAC | LIC | LMIC | MENA | OECD | Oceania | SIDS | UMIC | Africa | BRICS | BRICS Plus | E_S_ Euro | E_S_ Asia |
| 2000 | 57.77 | 72.80 | 63.52 | 43.84 | 53.19 | 59.44 | 71.75 | 51.36 | 58.87 | 60.88 | 45.10 | 56.58 | 56.06 | 64.67 | 55.50 |
| 2001 | 58.04 | 73.10 | 63.75 | 44.08 | 53.45 | 59.60 | 72.10 | 51.19 | 59.25 | 61.22 | 45.36 | 56.84 | 56.30 | 65.18 | 55.71 |
| 2002 | 58.25 | 73.20 | 63.79 | 44.36 | 53.61 | 59.75 | 72.38 | 51.20 | 59.32 | 61.60 | 45.75 | 56.86 | 56.34 | 65.78 | 55.77 |
| 2003 | 58.47 | 73.30 | 64.16 | 44.69 | 53.98 | 60.05 | 72.41 | 51.12 | 58.89 | 61.79 | 46.03 | 57.11 | 56.59 | 65.51 | 56.03 |
| 2004 | 58.75 | 73.60 | 64.68 | 44.92 | 54.15 | 60.33 | 72.73 | 50.90 | 59.31 | 62.27 | 46.33 | 57.41 | 56.88 | 65.66 | 56.25 |
| 2005 | 59.20 | 73.70 | 65.09 | 45.52 | 54.56 | 60.41 | 73.04 | 51.13 | 59.77 | 62.96 | 46.74 | 58.07 | 57.52 | 65.69 | 56.89 |
| 2006 | 59.49 | 73.70 | 65.56 | 46.08 | 54.85 | 60.58 | 73.19 | 51.26 | 59.63 | 63.39 | 47.25 | 58.42 | 57.86 | 65.78 | 57.25 |
| 2007 | 59.95 | 73.80 | 65.92 | 46.46 | 55.28 | 60.76 | 73.38 | 51.26 | 60.43 | 64.06 | 47.64 | 59.14 | 58.55 | 66.08 | 57.90 |
| 2008 | 60.20 | 74.00 | 66.49 | 46.92 | 55.56 | 60.77 | 73.65 | 51.26 | 60.62 | 64.41 | 48.21 | 59.36 | 58.75 | 66.54 | 58.10 |
| 2009 | 60.55 | 74.60 | 66.96 | 47.33 | 55.71 | 61.27 | 74.25 | 51.26 | 60.93 | 64.88 | 48.53 | 59.52 | 58.90 | 66.97 | 58.31 |
| 2010 | 61.12 | 74.70 | 67.27 | 47.60 | 56.55 | 61.77 | 74.52 | 50.95 | 61.04 | 65.40 | 49.10 | 60.29 | 59.64 | 67.13 | 59.11 |
| 2011 | 61.54 | 75.00 | 67.49 | 47.99 | 56.98 | 62.41 | 74.71 | 51.01 | 61.47 | 65.99 | 49.60 | 61.08 | 60.42 | 67.31 | 59.81 |
| 2012 | 61.96 | 75.30 | 67.84 | 48.58 | 57.49 | 62.84 | 75.07 | 51.26 | 61.86 | 66.45 | 49.94 | 61.57 | 60.88 | 67.54 | 60.35 |
| 2013 | 62.35 | 75.30 | 68.23 | 48.74 | 57.86 | 62.93 | 75.14 | 51.66 | 62.01 | 67.06 | 50.23 | 62.15 | 61.43 | 67.86 | 60.92 |
| 2014 | 63.14 | 75.80 | 68.81 | 49.15 | 58.91 | 63.23 | 75.61 | 51.70 | 62.63 | 67.86 | 50.94 | 63.32 | 62.58 | 68.44 | 61.97 |
| 2015 | 63.51 | 76.00 | 69.23 | 49.16 | 59.26 | 63.21 | 75.81 | 51.54 | 62.66 | 68.50 | 51.22 | 63.92 | 63.13 | 68.86 | 62.48 |
| 2016 | 63.82 | 76.20 | 69.09 | 49.64 | 59.64 | 63.31 | 76.09 | 51.48 | 62.73 | 68.88 | 51.62 | 64.30 | 63.52 | 69.59 | 62.91 |
| 2017 | 64.35 | 76.30 | 69.15 | 50.07 | 60.46 | 63.61 | 76.24 | 52.01 | 63.50 | 69.23 | 52.08 | 64.90 | 64.13 | 70.03 | 63.70 |
| 2018 | 64.77 | 76.30 | 69.29 | 50.42 | 61.09 | 63.96 | 76.34 | 52.03 | 63.83 | 69.61 | 52.43 | 65.45 | 64.64 | 70.26 | 64.34 |
| 2019 | 65.30 | 76.70 | 69.55 | 50.79 | 61.81 | 64.48 | 76.58 | 52.52 | 64.14 | 70.05 | 52.74 | 66.15 | 65.36 | 70.59 | 65.08 |
| 2020 | 65.69 | 77.30 | 69.84 | 50.88 | 62.25 | 65.01 | 77.08 | 52.38 | 64.19 | 70.40 | 53.07 | 66.68 | 65.88 | 71.04 | 65.54 |
| 2021 | 65.87 | 77.30 | 69.72 | 51.27 | 62.51 | 65.30 | 76.91 | 52.14 | 64.08 | 70.59 | 53.49 | 67.08 | 66.28 | 70.96 | 65.77 |
| 2022 | 66.15 | 77.40 | 69.95 | 51.38 | 62.98 | 65.52 | 77.13 | 52.28 | 64.54 | 70.84 | 53.68 | 67.62 | 66.76 | 70.82 | 66.29 |
| 2023 | 66.30 | 77.60 | 70.15 | 51.02 | 63.18 | 65.60 | 77.25 | 52.50 | 64.62 | 71.04 | 53.73 | 67.89 | 67.01 | 70.56 | 66.53 |
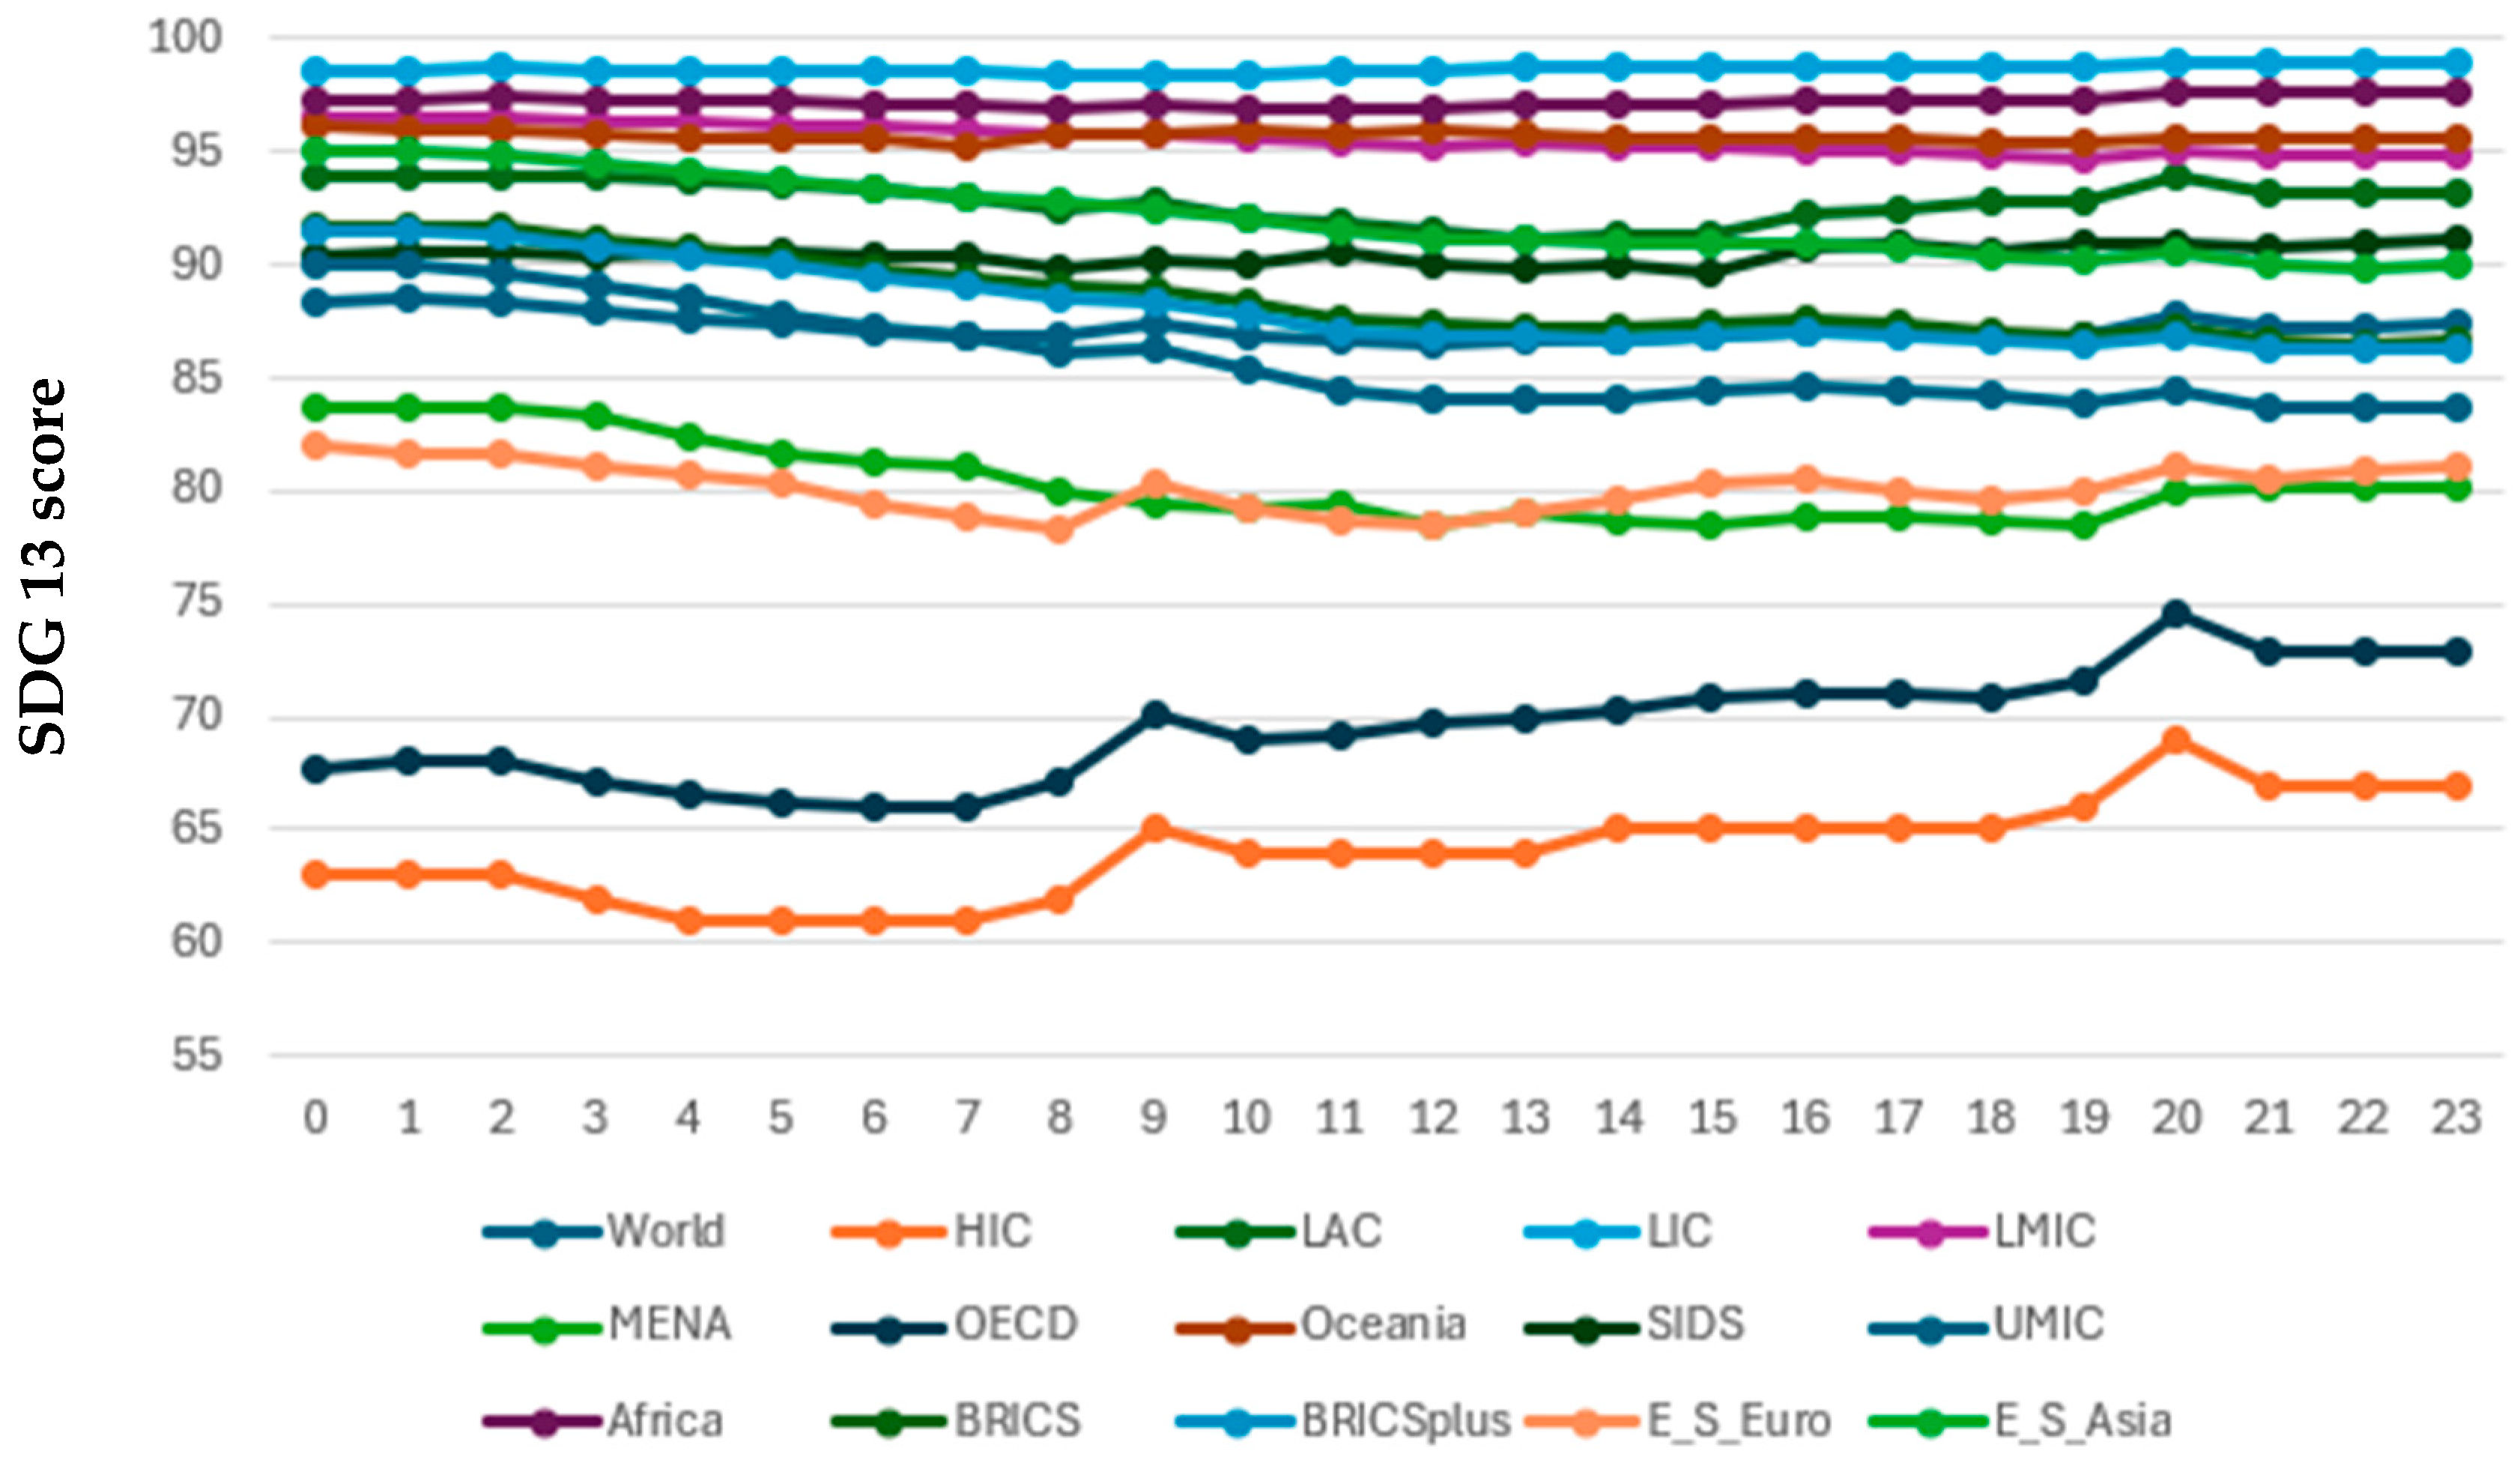
Appendix B. SDG 13 Index for 2000–2023 [9]
| Year | World | HIC | LAC | LIC | LMIC | MENA | OECD | Oceania | SIDS | UMIC | Africa | BRICS | BRICS Plus | E_S_ Euro | E_S_ Asia |
| 2000 | 88.41 | 63.00 | 93.86 | 98.62 | 96.50 | 83.74 | 67.77 | 96.21 | 90.49 | 90.02 | 97.33 | 91.78 | 91.45 | 81.94 | 95.06 |
| 2001 | 88.47 | 63.00 | 93.96 | 98.63 | 96.48 | 83.74 | 67.98 | 96.04 | 90.62 | 90.00 | 97.38 | 91.78 | 91.45 | 81.63 | 95.02 |
| 2002 | 88.43 | 63.00 | 93.87 | 98.70 | 96.49 | 83.74 | 68.00 | 96.02 | 90.63 | 89.74 | 97.48 | 91.62 | 91.29 | 81.59 | 94.84 |
| 2003 | 88.02 | 62.00 | 94.00 | 98.64 | 96.43 | 83.26 | 67.17 | 95.89 | 90.32 | 89.02 | 97.28 | 91.13 | 90.81 | 81.05 | 94.43 |
| 2004 | 87.70 | 61.00 | 93.82 | 98.63 | 96.33 | 82.36 | 66.57 | 95.65 | 90.65 | 88.50 | 97.21 | 90.80 | 90.44 | 80.66 | 94.14 |
| 2005 | 87.43 | 61.00 | 93.63 | 98.56 | 96.22 | 81.69 | 66.29 | 95.69 | 90.61 | 87.88 | 97.23 | 90.40 | 90.03 | 80.29 | 93.76 |
| 2006 | 87.14 | 61.00 | 93.31 | 98.55 | 96.10 | 81.35 | 66.08 | 95.68 | 90.35 | 87.25 | 97.17 | 89.91 | 89.49 | 79.34 | 93.40 |
| 2007 | 86.93 | 61.00 | 92.95 | 98.52 | 95.93 | 81.07 | 66.05 | 95.29 | 90.49 | 86.79 | 97.05 | 89.55 | 89.11 | 78.80 | 93.10 |
| 2008 | 86.86 | 62.00 | 92.46 | 98.44 | 95.82 | 79.93 | 67.16 | 95.73 | 89.80 | 86.18 | 96.98 | 89.09 | 88.58 | 78.21 | 92.75 |
| 2009 | 87.43 | 65.00 | 92.89 | 98.49 | 95.76 | 79.38 | 70.07 | 95.85 | 90.19 | 86.27 | 97.03 | 88.96 | 88.40 | 80.32 | 92.51 |
| 2010 | 86.90 | 64.00 | 92.12 | 98.38 | 95.62 | 79.24 | 69.04 | 95.94 | 89.98 | 85.38 | 97.00 | 88.34 | 87.79 | 79.15 | 92.02 |
| 2011 | 86.61 | 64.00 | 91.94 | 98.62 | 95.45 | 79.38 | 69.09 | 95.84 | 90.58 | 84.48 | 96.95 | 87.63 | 87.15 | 78.71 | 91.43 |
| 2012 | 86.55 | 64.00 | 91.54 | 98.64 | 95.31 | 78.41 | 69.65 | 95.95 | 90.12 | 84.16 | 97.01 | 87.40 | 86.85 | 78.55 | 91.21 |
| 2013 | 86.61 | 64.00 | 91.16 | 98.73 | 95.35 | 78.96 | 69.89 | 95.85 | 89.90 | 83.98 | 97.04 | 87.32 | 86.84 | 78.99 | 91.11 |
| 2014 | 86.69 | 65.00 | 91.29 | 98.70 | 95.29 | 78.59 | 70.30 | 95.56 | 90.05 | 84.03 | 97.05 | 87.28 | 86.76 | 79.61 | 91.02 |
| 2015 | 86.89 | 65.00 | 91.39 | 98.82 | 95.22 | 78.49 | 70.89 | 95.60 | 89.63 | 84.36 | 97.20 | 87.50 | 86.93 | 80.42 | 91.02 |
| 2016 | 87.04 | 65.00 | 92.31 | 98.83 | 95.13 | 78.95 | 71.02 | 95.56 | 90.77 | 84.68 | 97.27 | 87.60 | 87.08 | 80.45 | 91.03 |
| 2017 | 86.96 | 65.00 | 92.37 | 98.78 | 95.01 | 78.86 | 71.07 | 95.65 | 90.97 | 84.43 | 97.34 | 87.38 | 86.88 | 80.05 | 90.81 |
| 2018 | 86.78 | 65.00 | 92.81 | 98.80 | 94.79 | 78.62 | 70.84 | 95.47 | 90.63 | 84.17 | 97.36 | 87.08 | 86.59 | 79.70 | 90.47 |
| 2019 | 86.82 | 66.00 | 92.86 | 98.79 | 94.72 | 78.44 | 71.62 | 95.45 | 90.98 | 83.90 | 97.32 | 86.90 | 86.42 | 80.00 | 90.22 |
| 2020 | 87.79 | 69.00 | 93.90 | 98.97 | 95.10 | 80.05 | 74.53 | 95.58 | 90.88 | 84.47 | 97.62 | 87.27 | 86.85 | 81.17 | 90.55 |
| 2021 | 87.19 | 67.00 | 93.13 | 98.91 | 94.89 | 80.11 | 72.90 | 95.55 | 90.79 | 83.63 | 97.60 | 86.60 | 86.30 | 80.45 | 90.01 |
| 2022 | 87.24 | 67.00 | 93.16 | 98.92 | 94.84 | 80.09 | 72.97 | 95.62 | 91.02 | 83.62 | 97.66 | 86.58 | 86.28 | 80.98 | 89.92 |
| 2023 | 87.35 | 67.00 | 93.16 | 98.92 | 94.87 | 80.17 | 72.96 | 95.62 | 91.06 | 83.65 | 97.69 | 86.65 | 86.36 | 81.04 | 89.97 |
Appendix C. SDG 9 Index for 2000–2023 [9]
| Year | World | HIC | LAC | LIC | LMIC | MENA | OECD | Oceania | SIDS | UMIC | Africa | BRICS | BRICS Plus | E_S_ Euro | E_S_ Asia |
| 2000 | 39.51 | 70.00 | 30.59 | 12.80 | 28.58 | 24.87 | 65.83 | 7.92 | 25.33 | 39.05 | 18.39 | 40.10 | 39.30 | 30.38 | 36.36 |
| 2001 | 39.75 | 71.00 | 30.89 | 12.81 | 28.55 | 24.89 | 66.72 | 7.83 | 25.58 | 39.45 | 18.34 | 40.25 | 39.43 | 30.79 | 36.42 |
| 2002 | 40.24 | 72.00 | 31.28 | 12.81 | 28.56 | 25.14 | 68.35 | 7.68 | 26.08 | 40.12 | 18.31 | 40.70 | 39.85 | 31.03 | 36.75 |
| 2003 | 40.63 | 74.00 | 31.72 | 12.75 | 28.59 | 25.50 | 69.72 | 7.75 | 26.56 | 40.65 | 18.28 | 41.06 | 40.21 | 31.32 | 37.00 |
| 2004 | 41.13 | 76.00 | 32.30 | 12.70 | 28.79 | 26.06 | 71.15 | 7.74 | 27.36 | 41.32 | 18.25 | 41.61 | 40.74 | 31.41 | 37.42 |
| 2005 | 41.76 | 76.00 | 32.78 | 12.58 | 29.11 | 26.37 | 72.91 | 7.76 | 27.76 | 42.10 | 18.15 | 42.27 | 41.36 | 31.63 | 38.01 |
| 2006 | 42.15 | 77.00 | 33.72 | 12.59 | 29.22 | 26.80 | 73.84 | 7.86 | 28.24 | 42.80 | 18.21 | 42.73 | 41.80 | 31.65 | 38.35 |
| 2007 | 42.68 | 78.00 | 34.40 | 12.63 | 29.48 | 27.42 | 74.77 | 7.90 | 28.61 | 43.72 | 18.32 | 43.39 | 42.43 | 32.32 | 38.88 |
| 2008 | 43.32 | 79.00 | 35.16 | 12.64 | 29.78 | 28.30 | 75.46 | 7.69 | 29.28 | 44.92 | 18.33 | 44.33 | 43.34 | 33.07 | 39.62 |
| 2009 | 44.40 | 80.00 | 36.22 | 12.71 | 29.90 | 28.94 | 77.28 | 7.77 | 30.26 | 46.75 | 18.40 | 45.61 | 44.53 | 34.55 | 40.47 |
| 2010 | 46.24 | 82.00 | 38.71 | 13.36 | 30.60 | 31.09 | 79.76 | 7.77 | 31.32 | 49.91 | 19.07 | 47.79 | 46.63 | 36.75 | 42.14 |
| 2011 | 47.54 | 84.00 | 40.43 | 13.48 | 31.15 | 32.61 | 81.74 | 8.06 | 32.49 | 51.98 | 19.51 | 49.29 | 48.13 | 38.74 | 43.22 |
| 2012 | 48.65 | 86.00 | 42.36 | 14.93 | 32.15 | 35.73 | 83.82 | 8.37 | 34.67 | 53.54 | 20.86 | 50.01 | 48.87 | 41.21 | 43.55 |
| 2013 | 50.75 | 88.00 | 45.65 | 15.51 | 32.78 | 37.66 | 85.10 | 10.05 | 37.07 | 56.91 | 22.00 | 52.21 | 51.31 | 42.65 | 46.02 |
| 2014 | 52.41 | 90.00 | 48.52 | 15.74 | 34.22 | 39.68 | 87.00 | 10.67 | 38.14 | 60.27 | 22.83 | 54.57 | 53.57 | 44.10 | 47.90 |
| 2015 | 53.67 | 91.00 | 50.95 | 16.70 | 35.51 | 41.95 | 88.45 | 11.12 | 39.49 | 61.86 | 24.15 | 55.74 | 54.54 | 45.49 | 48.89 |
| 2016 | 55.94 | 92.00 | 50.30 | 17.42 | 37.93 | 41.40 | 90.27 | 12.26 | 41.07 | 64.69 | 25.44 | 59.58 | 57.89 | 47.03 | 52.46 |
| 2017 | 58.40 | 92.00 | 51.05 | 18.05 | 40.70 | 45.66 | 90.99 | 14.56 | 43.13 | 67.05 | 26.00 | 61.64 | 60.58 | 48.43 | 55.86 |
| 2018 | 59.88 | 93.00 | 51.96 | 18.38 | 41.60 | 47.42 | 91.29 | 13.89 | 44.41 | 69.08 | 26.81 | 62.72 | 61.61 | 51.32 | 57.60 |
| 2019 | 62.19 | 93.00 | 52.69 | 18.93 | 44.38 | 50.87 | 91.85 | 16.71 | 46.19 | 71.16 | 28.14 | 65.19 | 64.02 | 54.19 | 60.39 |
| 2020 | 64.62 | 94.00 | 54.02 | 19.74 | 47.61 | 54.15 | 92.76 | 18.62 | 47.43 | 72.80 | 30.19 | 67.35 | 66.18 | 55.92 | 63.12 |
| 2021 | 66.26 | 94.00 | 55.44 | 20.75 | 48.80 | 56.52 | 92.85 | 18.60 | 48.28 | 74.78 | 31.19 | 68.69 | 67.52 | 57.69 | 64.63 |
| 2022 | 67.68 | 95.00 | 55.38 | 21.79 | 50.52 | 58.76 | 93.00 | 19.05 | 49.58 | 76.30 | 32.37 | 70.22 | 69.06 | 58.31 | 66.22 |
| 2023 | 69.15 | 95.00 | 57.34 | 21.32 | 51.88 | 59.29 | 92.98 | 18.96 | 51.10 | 78.24 | 31.77 | 72.24 | 70.87 | 59.01 | 68.00 |
Appendix D. SDG 12 Index for 2000–2023 [9]
| Year | World | HIC | LAC | LIC | LMIC | MENA | OECD | Oceania | SIDS | UMIC | Africa | BRICS | BRICS Plus | E_S_ Euro | E_S_ Asia |
| 2000 | 80.27 | 51.00 | 84.60 | 95.83 | 90.25 | 84.10 | 54.58 | 92.67 | 79.31 | 81.07 | 95.15 | 84.00 | 84.20 | 80.09 | 85.90 |
| 2001 | 80.49 | 52.00 | 84.62 | 95.79 | 90.27 | 83.88 | 55.45 | 92.71 | 79.33 | 81.08 | 95.12 | 84.01 | 84.21 | 79.95 | 85.92 |
| 2002 | 80.55 | 52.00 | 84.73 | 95.78 | 90.36 | 83.67 | 55.75 | 92.75 | 79.37 | 80.81 | 95.16 | 83.87 | 84.08 | 79.94 | 85.83 |
| 2003 | 80.27 | 51.00 | 84.46 | 95.77 | 90.33 | 83.57 | 55.34 | 92.79 | 79.42 | 80.11 | 95.07 | 83.36 | 83.59 | 79.64 | 85.44 |
| 2004 | 79.85 | 51.00 | 84.16 | 95.75 | 90.08 | 83.05 | 55.19 | 92.83 | 79.46 | 79.15 | 95.06 | 82.50 | 82.77 | 79.72 | 84.68 |
| 2005 | 79.71 | 51.00 | 84.10 | 95.64 | 89.92 | 82.81 | 55.33 | 92.86 | 79.50 | 78.73 | 95.03 | 82.09 | 82.39 | 79.80 | 84.31 |
| 2006 | 79.42 | 51.00 | 83.84 | 95.67 | 89.71 | 82.56 | 55.27 | 92.90 | 79.47 | 78.03 | 95.02 | 81.45 | 81.76 | 79.35 | 83.78 |
| 2007 | 79.14 | 51.00 | 83.42 | 95.64 | 89.21 | 82.23 | 55.29 | 92.94 | 79.37 | 77.70 | 94.89 | 80.93 | 81.26 | 78.87 | 83.32 |
| 2008 | 79.12 | 52.00 | 83.13 | 95.58 | 88.97 | 81.86 | 56.16 | 92.97 | 79.28 | 77.39 | 94.84 | 80.52 | 80.86 | 78.15 | 83.02 |
| 2009 | 79.27 | 54.00 | 83.56 | 95.64 | 88.74 | 81.25 | 57.88 | 93.01 | 79.19 | 77.02 | 94.92 | 79.97 | 80.32 | 79.34 | 82.47 |
| 2010 | 79.03 | 53.00 | 83.07 | 95.66 | 88.50 | 81.74 | 57.47 | 93.05 | 79.11 | 76.62 | 94.83 | 79.47 | 79.90 | 79.17 | 82.11 |
| 2011 | 78.74 | 53.00 | 82.70 | 95.67 | 88.13 | 81.58 | 57.48 | 93.09 | 79.10 | 76.08 | 94.80 | 78.83 | 79.30 | 78.08 | 81.63 |
| 2012 | 78.68 | 54.00 | 82.52 | 95.66 | 87.82 | 81.07 | 57.81 | 93.12 | 79.12 | 75.92 | 94.78 | 78.51 | 78.98 | 77.87 | 81.39 |
| 2013 | 78.72 | 54.00 | 82.43 | 95.77 | 87.73 | 81.08 | 57.98 | 93.15 | 79.13 | 75.87 | 94.70 | 78.47 | 78.96 | 78.04 | 81.32 |
| 2014 | 78.86 | 54.00 | 82.44 | 95.75 | 87.40 | 81.19 | 58.29 | 93.18 | 79.14 | 76.42 | 94.65 | 78.57 | 79.07 | 78.71 | 81.32 |
| 2015 | 79.28 | 54.00 | 82.71 | 95.88 | 87.64 | 81.75 | 58.81 | 93.21 | 79.14 | 76.94 | 94.82 | 79.10 | 79.59 | 79.41 | 81.66 |
| 2016 | 79.61 | 55.00 | 82.84 | 95.86 | 87.64 | 82.13 | 58.86 | 93.10 | 78.94 | 77.66 | 94.81 | 79.73 | 80.21 | 79.29 | 82.12 |
| 2017 | 79.57 | 55.00 | 82.66 | 95.88 | 87.40 | 82.47 | 58.72 | 92.98 | 78.70 | 77.72 | 94.81 | 79.60 | 80.12 | 79.23 | 81.98 |
| 2018 | 79.40 | 55.00 | 82.61 | 95.93 | 86.99 | 82.44 | 58.69 | 92.87 | 78.50 | 77.58 | 94.79 | 79.26 | 79.83 | 78.99 | 81.60 |
| 2019 | 79.46 | 55.00 | 82.49 | 95.96 | 87.00 | 82.54 | 58.91 | 92.78 | 78.31 | 77.44 | 94.76 | 79.19 | 79.78 | 79.01 | 81.56 |
| 2020 | 79.74 | 55.00 | 82.70 | 96.07 | 87.22 | 83.04 | 59.38 | 92.80 | 78.37 | 77.53 | 95.03 | 79.23 | 79.86 | 79.30 | 81.66 |
| 2021 | 79.65 | 55.00 | 82.39 | 96.11 | 87.15 | 83.28 | 58.99 | 92.82 | 78.45 | 77.33 | 95.00 | 79.11 | 79.79 | 79.27 | 81.53 |
| 2022 | 80.01 | 56.00 | 82.61 | 96.14 | 87.23 | 83.51 | 60.34 | 92.83 | 79.96 | 77.40 | 95.03 | 79.00 | 79.72 | 79.74 | 81.57 |
| 2023 | 80.30 | 58.00 | 82.56 | 96.20 | 87.09 | 83.53 | 62.21 | 92.86 | 80.09 | 77.21 | 95.08 | 78.62 | 79.40 | 79.94 | 81.31 |
References
- COP 29, Baku. In Solidarity for a Green World. Available online: https://cop29.az/en/home (accessed on 11 March 2025).
- Conference of the Parties (COP). Available online: https://unfccc.int/process/bodies/supreme-bodies/conference-of-the-parties-cop (accessed on 11 March 2025).
- The Paris Agreement. Available online: https://unfccc.int/process-and-meetings/the-paris-agreement (accessed on 11 March 2025).
- 2024 Is on Track to Be the Hottest Year on Record as Warming Temporarily Hits 1.5 °C on 11 November 2024. Available online: https://wmo.int/news/media-centre/2024-track-be-hottest-year-record-warming-temporarily-hits-15degc (accessed on 11 March 2025).
- Sustainability. Available online: https://cop29.az/en/policies/sustainability-policy (accessed on 11 March 2025).
- Azerbaijan Oil. Available online: https://www.worldometers.info/oil/azerbaijan-oil/#oil-production (accessed on 11 March 2025).
- Azerbaijan—Country Commercial Guide, 21 November 2023. Available online: https://www.trade.gov/country-commercial-guides/azerbaijan-market-overview (accessed on 11 March 2025).
- Sachs, J.D.; Lafortune, G.; Fuller, G. The SDGs and the UN Summit of the Future. Sustainable Development Report 2024; SDSN: Paris, France; Dublin University Press: Dublin, Ireland, 2024. [Google Scholar] [CrossRef]
- Sustainable Development Report 2024. Dashboard. Available online: https://dashboards.sdgindex.org/explorer (accessed on 11 March 2025).
- COP29 Ends with a Compromise on Climate Financing (25 November 2024). Available online: https://wmo.int/media/news/cop29-ends-compromise-climate-financing (accessed on 11 March 2025).
- Munda, G. Social Multi-Criteria Evaluation for a Sustainable Economy; Springer: Berlin/Heidelberg, Germany, 2008; Available online: https://link.springer.com/book/10.1007/978-3-540-73703-2 (accessed on 11 March 2025).
- Bruggemann, R.; Patil, G.P. Ranking and Prioritization for Multi-Indicator Systems—Introduction to Partial Order Applications; Springer: New York, NY, USA, 2011; Available online: https://www.springer.com/gp/book/9781441984760 (accessed on 11 March 2025).
- Bruggemann, R.; Carlsen, L. Introduction to partial order theory exemplified by evaluating sampling sites. In Partial Order in Environmental Sciences and Chemistry; Bruggemann, R., Carlsen, L., Eds.; Springer: Berlin/Heidelberg, Germany, 2006; pp. 61–110. Available online: https://www.springer.com/gp/book/9783540339687 (accessed on 11 March 2025).
- Bruggemann, R.; Annoni, P. Average Heights in Partially Ordered Sets. MATCH Commun. Math. Comput. Chem. 2014, 71, 117–142. [Google Scholar]
- De Loof, K.; De Meyer, H.; De Baets, B. Exploiting the lattice of ideals representation of a poset. Fundam. Informaticae 2006, 71, 309–321. [Google Scholar] [CrossRef]
- Carlsen, L. Sustainability: An ethical challenge: The overexploitation of the planet as an exemplary case. Sustainability 2024, 16, 3390. [Google Scholar] [CrossRef]
- Build Resilient Infrastructure, Promote Inclusive and Sustainable Industrialization, and Foster Innovation. Available online: https://sdgs.un.org/goals/goal9 (accessed on 11 March 2025).
- Ensure Sustainable Consumption and Production Patterns. Available online: https://sdgs.un.org/goals/goal12 (accessed on 11 March 2025).
- Average Greenhouse Gas Emissions per Kilogram of Major Food Products Worldwide. Available online: https://www.statista.com/statistics/1201677/greenhouse-gas-emissions-of-major-food-products/ (accessed on 11 March 2025).


Disclaimer/Publisher’s Note: The statements, opinions and data contained in all publications are solely those of the individual author(s) and contributor(s) and not of MDPI and/or the editor(s). MDPI and/or the editor(s) disclaim responsibility for any injury to people or property resulting from any ideas, methods, instructions or products referred to in the content. |
© 2025 by the author. Licensee MDPI, Basel, Switzerland. This article is an open access article distributed under the terms and conditions of the Creative Commons Attribution (CC BY) license (https://creativecommons.org/licenses/by/4.0/).
Share and Cite
Carlsen, L. The Baku Paradox: An Analysis of Selected Sustainable Development Goals. Sustainability 2025, 17, 2547. https://doi.org/10.3390/su17062547
Carlsen L. The Baku Paradox: An Analysis of Selected Sustainable Development Goals. Sustainability. 2025; 17(6):2547. https://doi.org/10.3390/su17062547
Chicago/Turabian StyleCarlsen, Lars. 2025. "The Baku Paradox: An Analysis of Selected Sustainable Development Goals" Sustainability 17, no. 6: 2547. https://doi.org/10.3390/su17062547
APA StyleCarlsen, L. (2025). The Baku Paradox: An Analysis of Selected Sustainable Development Goals. Sustainability, 17(6), 2547. https://doi.org/10.3390/su17062547