Article

Hydrologic Efficiency of Rain Gardens as Countermeasures to Overuse of Concrete in Historical Public Spaces

by
Marcin K. Widomski
and
Anna Musz-Pomorska
*
Faculty of Environmental and Energy Engineering, Lublin University of Technology, Nadbystrzycka St. 40 B, 20-618 Lublin, Poland
*
Author to whom correspondence should be addressed.
Sustainability 2025, 17(6), 2527; https://doi.org/10.3390/su17062527
Submission received: 31 January 2025 / Revised: 28 February 2025 / Accepted: 11 March 2025 / Published: 13 March 2025
(This article belongs to the Special Issue Sustainable Stormwater Management and Green Infrastructure)

Abstract

:
The overuse of concrete in historical areas, currently observed in various urban watersheds in Poland, may pose a significant threat to the water balance of catchments, leading even to pluvial flooding. The distorted water balance may be, to some extent, restored by sustainable green architecture designs. This paper presents an attempt at the numerical assessment of changes in the water balance caused by revitalization in three main historical squares in cities in Lublin Voivodeship, Poland. A proposal for rain garden installation, allowing the partial restoration of the water balance, is also introduced. Numerical calculations of the runoff generation were performed in SWMM 5 software for real weather conditions recorded in Lublin during the period 1 June–31 August 2024. The performed simulations show that an increase in the imperviousness of the studied urban catchments results in a significant increase in runoff characteristics, with a 78.2–90.9% increase in volume and a 108–141.7% increase in peak flows. The introduction of the proposed rain gardens allows the partial reduction in the runoff volume and peak flows, down by 18.1–30.2% and 17.9–32.0%, respectively.

1. Introduction

In 2020, a book by Jan Mencwel considering “betonoza” (there is no direct translation of this Polish word into English), a very disturbing phenomenon related to the overuse of concrete in public spaces in cities in Poland, started a long-lasting public discussion [1]. As a result, a new word was introduced to the Polish language and public awareness of changes in the urban water cycle was increased [2,3,4,5]. During the first two decades of the XXI century, numerous local governments in Poland rearranged, i.e., revitalized, the historical central squares of the cities they governed, which are the former locations of markets, now commonly occupied by town halls and serving as the main locations for state ceremonies, entertainment and other public activities. Commonly, such revitalization projects for town squares in Poland were related to the removal of trees and green areas and their replacement with paved surfaces, usually concrete-based or granite paving. A selected example of the described transformation of the central square in Bartoszyce, Poland, is presented in Figure 1.
In Lublin Voivodeship, Poland, alone, between the years 2000 and 2020, forty town squares were rearranged, with a 20% mean increase in paved areas [8]. According to the above-mentioned study, the mean share of the paved area of these squares before the revitalization was determined as approx. 52%, while after the revitalization, the paved area reached a level of approx. 72%. Additionally, as a result of the revitalization, in 13 cases, the paved area reached a level of over 80% of the total square area. The most extreme examples of revitalization outcomes in the above-mentioned area of Lublin Voivodeship are presented in Figure 2. While the projects received widespread media coverage, few attempts have been made to provide a scientific assessment of the described quantitative effects of the revitalization projects on the urban water balance and rainwater management, not only within Lublin Voivodeship, but also in the whole country of Poland [9,10,11].
Taking into consideration actual climate changes, also observed in Poland, resulting in an increase in the mean temperature, prolonged dry periods and an increased number of torrential rainfall events of extremely high intensity, the revitalization of urban catchments, related to an increase in their surface sealing, may cause several negative and undesired effects [12,13,14]. The most notable are the increased risk of pluvial flooding and heat island effects [14,15,16,17]. Generally, the increased frequency of urban pluvial floods may be caused by a combination of three elements: (i) changes in rainfall patterns related to climate change; (ii) changes in the urban environment caused by growing urbanization; and (iii) characteristics of urban areas suffering flooding; these combined elements affect the natural mechanisms of runoff and drainage [14,18,19,20]. However, growing urbanization and extreme rainfall events are often recognized as the main factors triggering urban floods [18,19,20,21,22]. Thus, in the case of the limited capacity of municipal rainwater mains drainage systems, the inundation of urban areas caused by the increased runoff peak flow resulting from urbanization, surface sealing and top soil hardening is possible [14,23,24].
Pluvial flooding, besides causing severe damage to public, residential and commercial buildings, services and transport in urbanized areas, may result in various negative impacts, causing serious economic losses and threatening the health and life of urban residents [16,25,26]. According to a governmental report [27], during the period 2000–2019, damage to the municipal infrastructure in Poland caused by floods, torrential rainfall events and local flooding reached a level of 16% of the total losses in the country resulting from extreme weather events. An assessment performed by Dawson et al. [24] in the UK showed that the cost of damage in a studied 1.5 km2 urban basin related to pluvial flooding caused by rainfall in different return periods, from 1 year to 50 years, may vary in the range of GBP 680–4780 thousand. A single disastrous rainfall event in Guangzhou, China, on 22 May 2020, according to Li et al. [16], affected more than 200,000 residents, with estimated economic losses of CNY 0.6 billion, while the total reported losses caused by urban flooding in China between 2015 and 2022 reached a level of CNY 1365 billion. Similarly, Pour et al. [22] presented a list of disastrous rainfall-driven flood events from the decade 2009–2019 in various locations (Europe, Asia, South and North America) and their impacts, in which economic losses reached billions of USD and numerous people died.
There were numerous observed attempts to reverse undesirable changes in the urban water cycle among numerous local governments in Poland [28,29,30,31], mainly by reducing the impervious sealing degree and introducing plants to previously sealed basins. The situation is so serious that in 2023, the Ministry of Climate and Environment of Poland introduced projects concerning concrete surface sealing removal and green area restoration in urbanized basins in the program “Protection and restoration of biological and landscape diversity” of the National Fund for Environmental Protection and Water Management [32,33].
An increase in urban flood resilience, understood as the ability of cities to prevent and mitigate the effects of flooding, under the pressure of climate change, requires the identification of several key factors, which include buildings and infrastructure, drainage networks, green coverage, urban road conditions and several economic indicators, such as urban maintenance and the construction budget, economic diversity, etc. [26,34,35]. Sustainable rainwater management based on Low-Impact Development (LID) is widely promoted as a measure to improve the water balance of urban catchments (and, to some extent, to prevent pluvial flooding) due to the reduced runoff volume and the increased infiltration and evapotranspiration of rainwater [16,22,36,37,38,39]. Rain gardens, bioretention infiltration units capable of reducing runoff based on rainfall events and catchment characteristics by as much as 97–98% [40,41,42], may be successfully used in highly sealed urban catchments of the previously described central watersheds of cities [9,17]. The installation of rain gardens requires relatively low investment costs, a limited area and a low level of watershed surface transformation, while the required “know-how” is easily accessible [9,42,43,44,45]. A typical rain garden consists of a permeable infiltration bed, located above the local top soil, and a vegetation layer. The infiltration beds of rain gardens utilize various mixtures of porous and organic materials including gravel, ceramsite, sand, soil, compost and even demolition wastes [17,46]. The rainwater collected by rain gardens is slowly infiltrated into the soil, with simultaneous water uptake by plant roots and evapotranspiration to the atmosphere. Excessive rainwater may be collected by spillways and delivered to the local drainage system. The advised area of rain gardens in a sealed urban catchment should constitute 5–10% of the total basin area [43]. The environmental advantages of rain gardens also include mitigating ground and surface water pollution, reducing the heat island effect [12,17,47] and improving air quality [40,48,49,50]. The recognized social benefits of rain gardens have also been reported, possibly due to their high aesthetic and educational value [51,52]. The above-mentioned aesthetic value is of high importance in the possible application of rain gardens as nature-based solutions to rainwater management in historic buildings and spaces [17], because socio-political barriers have been recognized as the most important factors in limiting LID implementation, not only in developing countries but also in developed ones [22]. Proper investment cost estimation, as well as operation and maintenance cost assumptions related to the ageing and malfunctioning of rain gardens, are required in such cases [53,54,55,56,57]. Despite the above-mentioned advantages and capabilities of rain gardens, and LIDs in general, in improving the urban water cycle, they are rarely found in the public spaces of the Lublin Voivodeship region [58]. For instance, there are currently three operational green roofs on public buildings and six rain gardens located in public spaces in Lublin, the capital city of the voivodeship. One of these rain gardens, covering an area of 37 m2, is located in the historical center of the city, in a highly sealed catchment [59]. Similarly, there are almost no scientific assessments available of rain garden application efficiency in the historical catchments in Lublin Voivodeship [9].
Thus, some gaps in knowledge can be seen regarding the range of changes in the water balance of historical urban watersheds caused by revitalization related to increases in imperviousness and the ability of rain gardens to at least partially restore the distorted water balance. The main aims of this study were as follows: (i) to conduct a numerical assessment of the changes in the urban water cycle caused by the revitalization of central square basins in three selected cities, related to the removal of permeable green areas; and (ii) a determination of rain garden efficiency in restoring the distorted hydrologic cycle of the revitalized catchment.

2. Materials and Methods

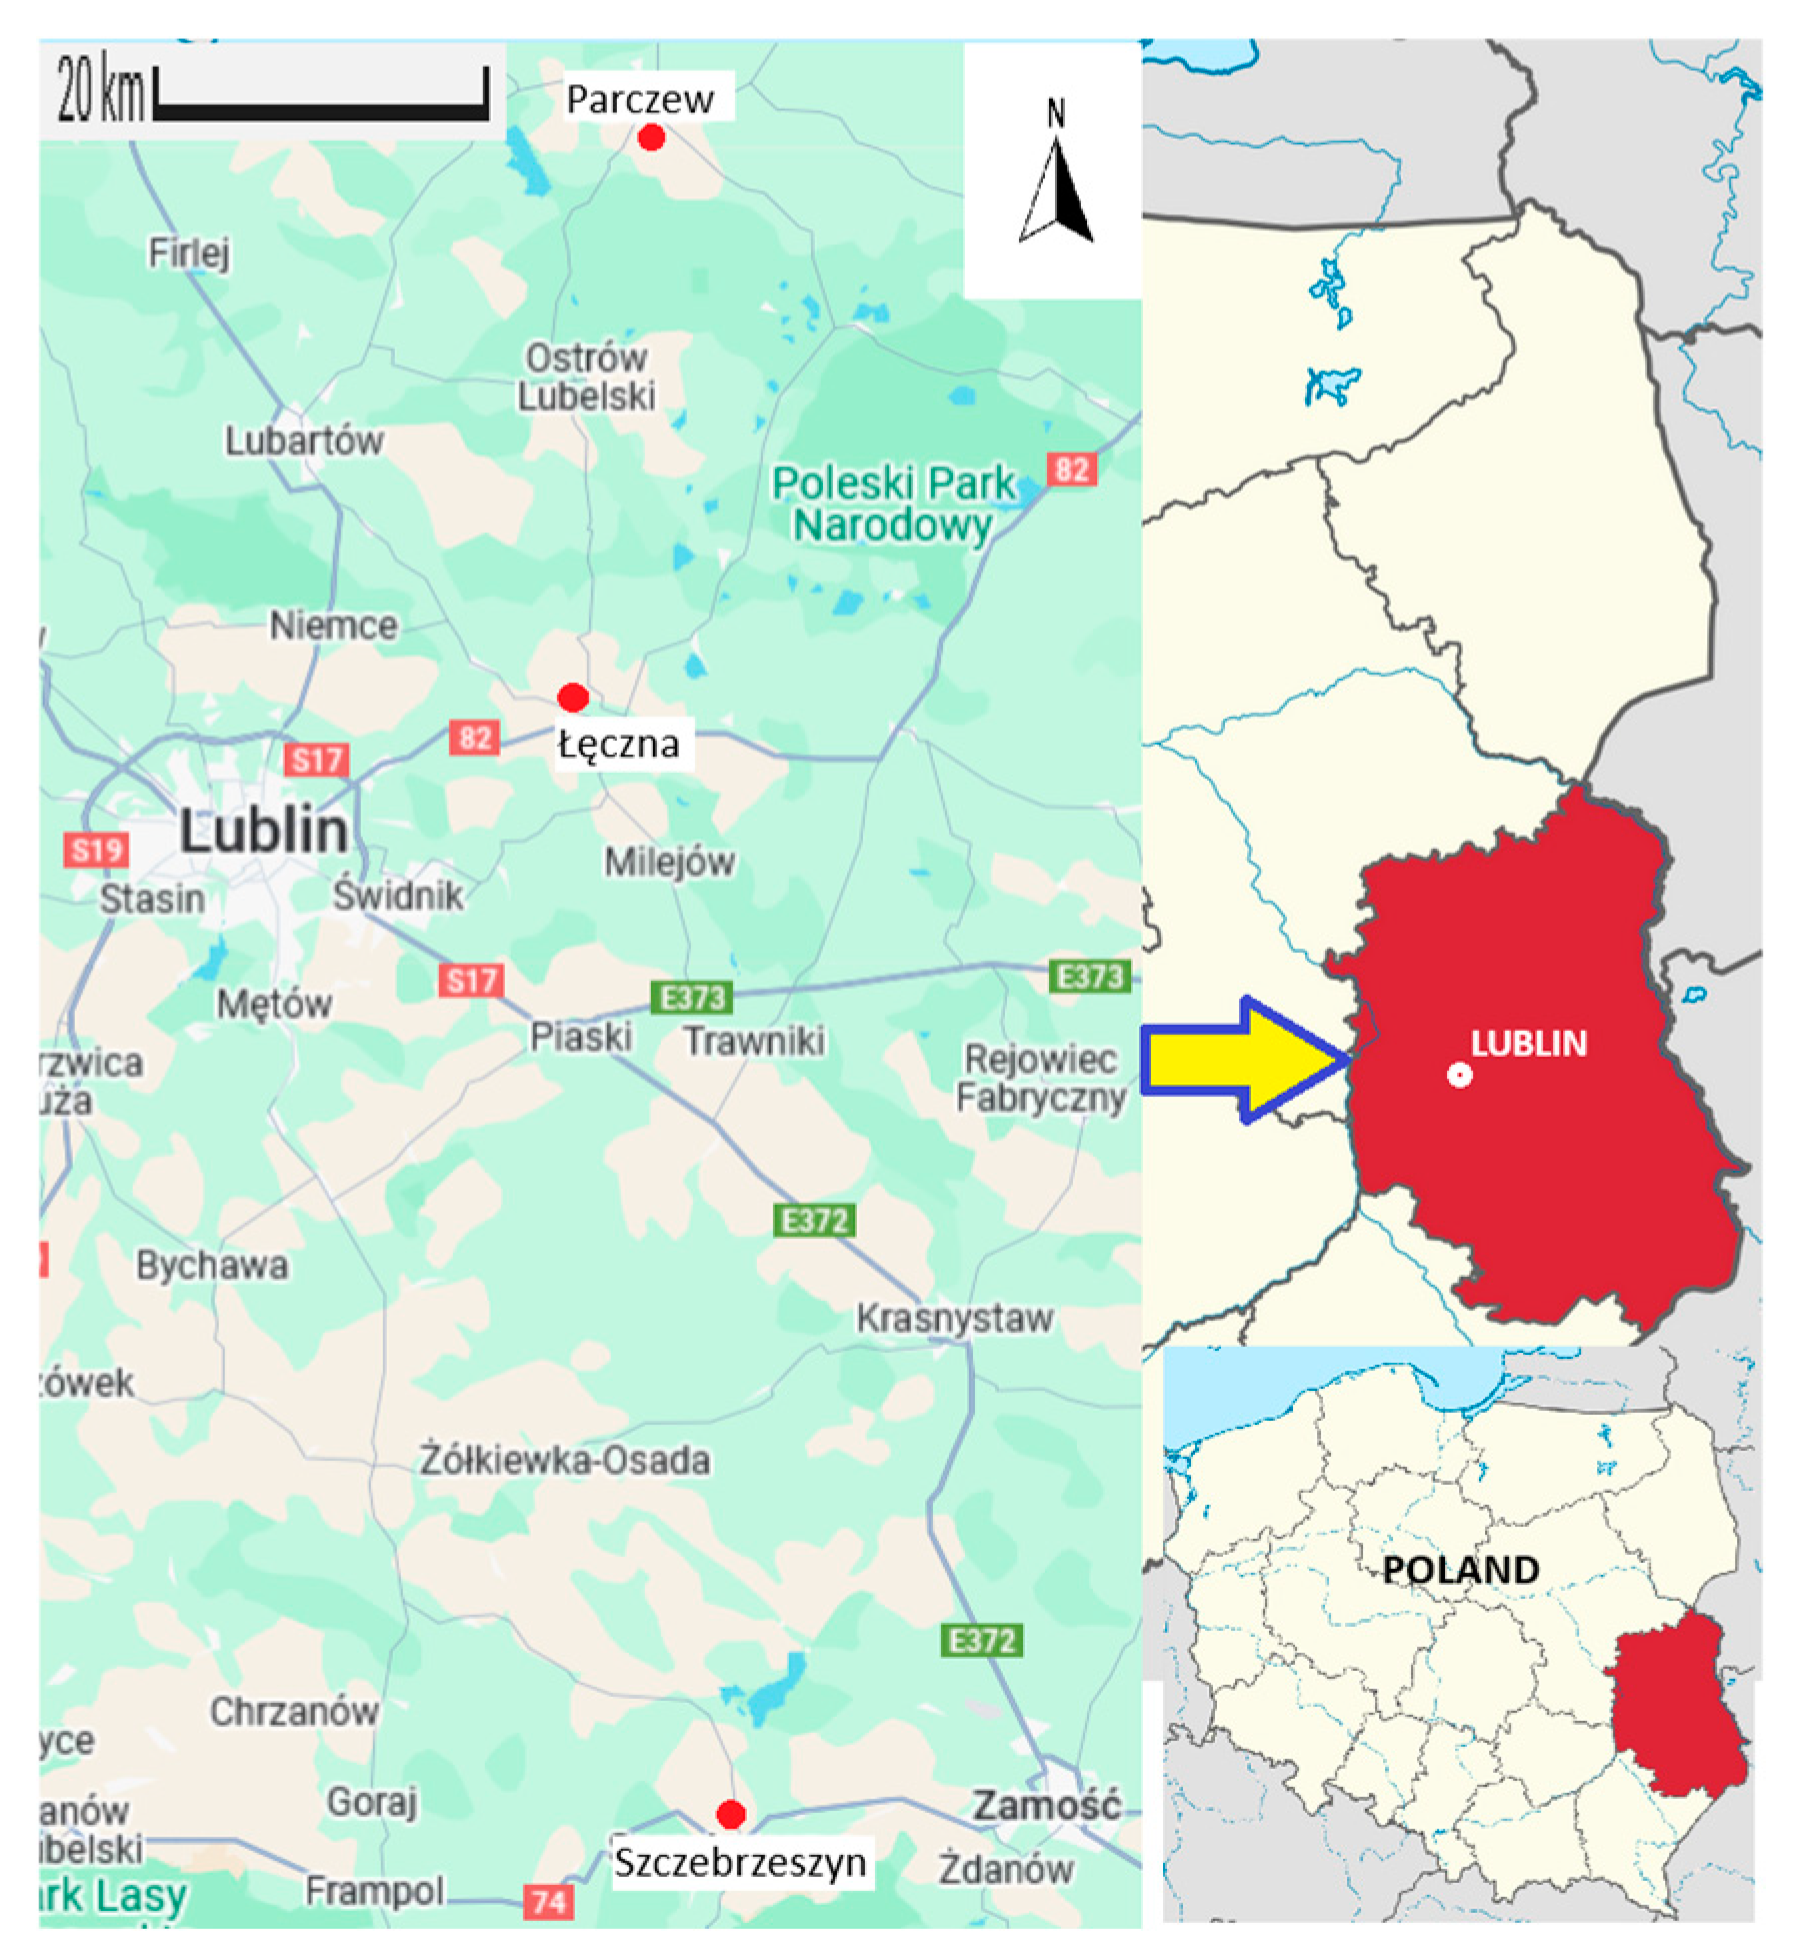
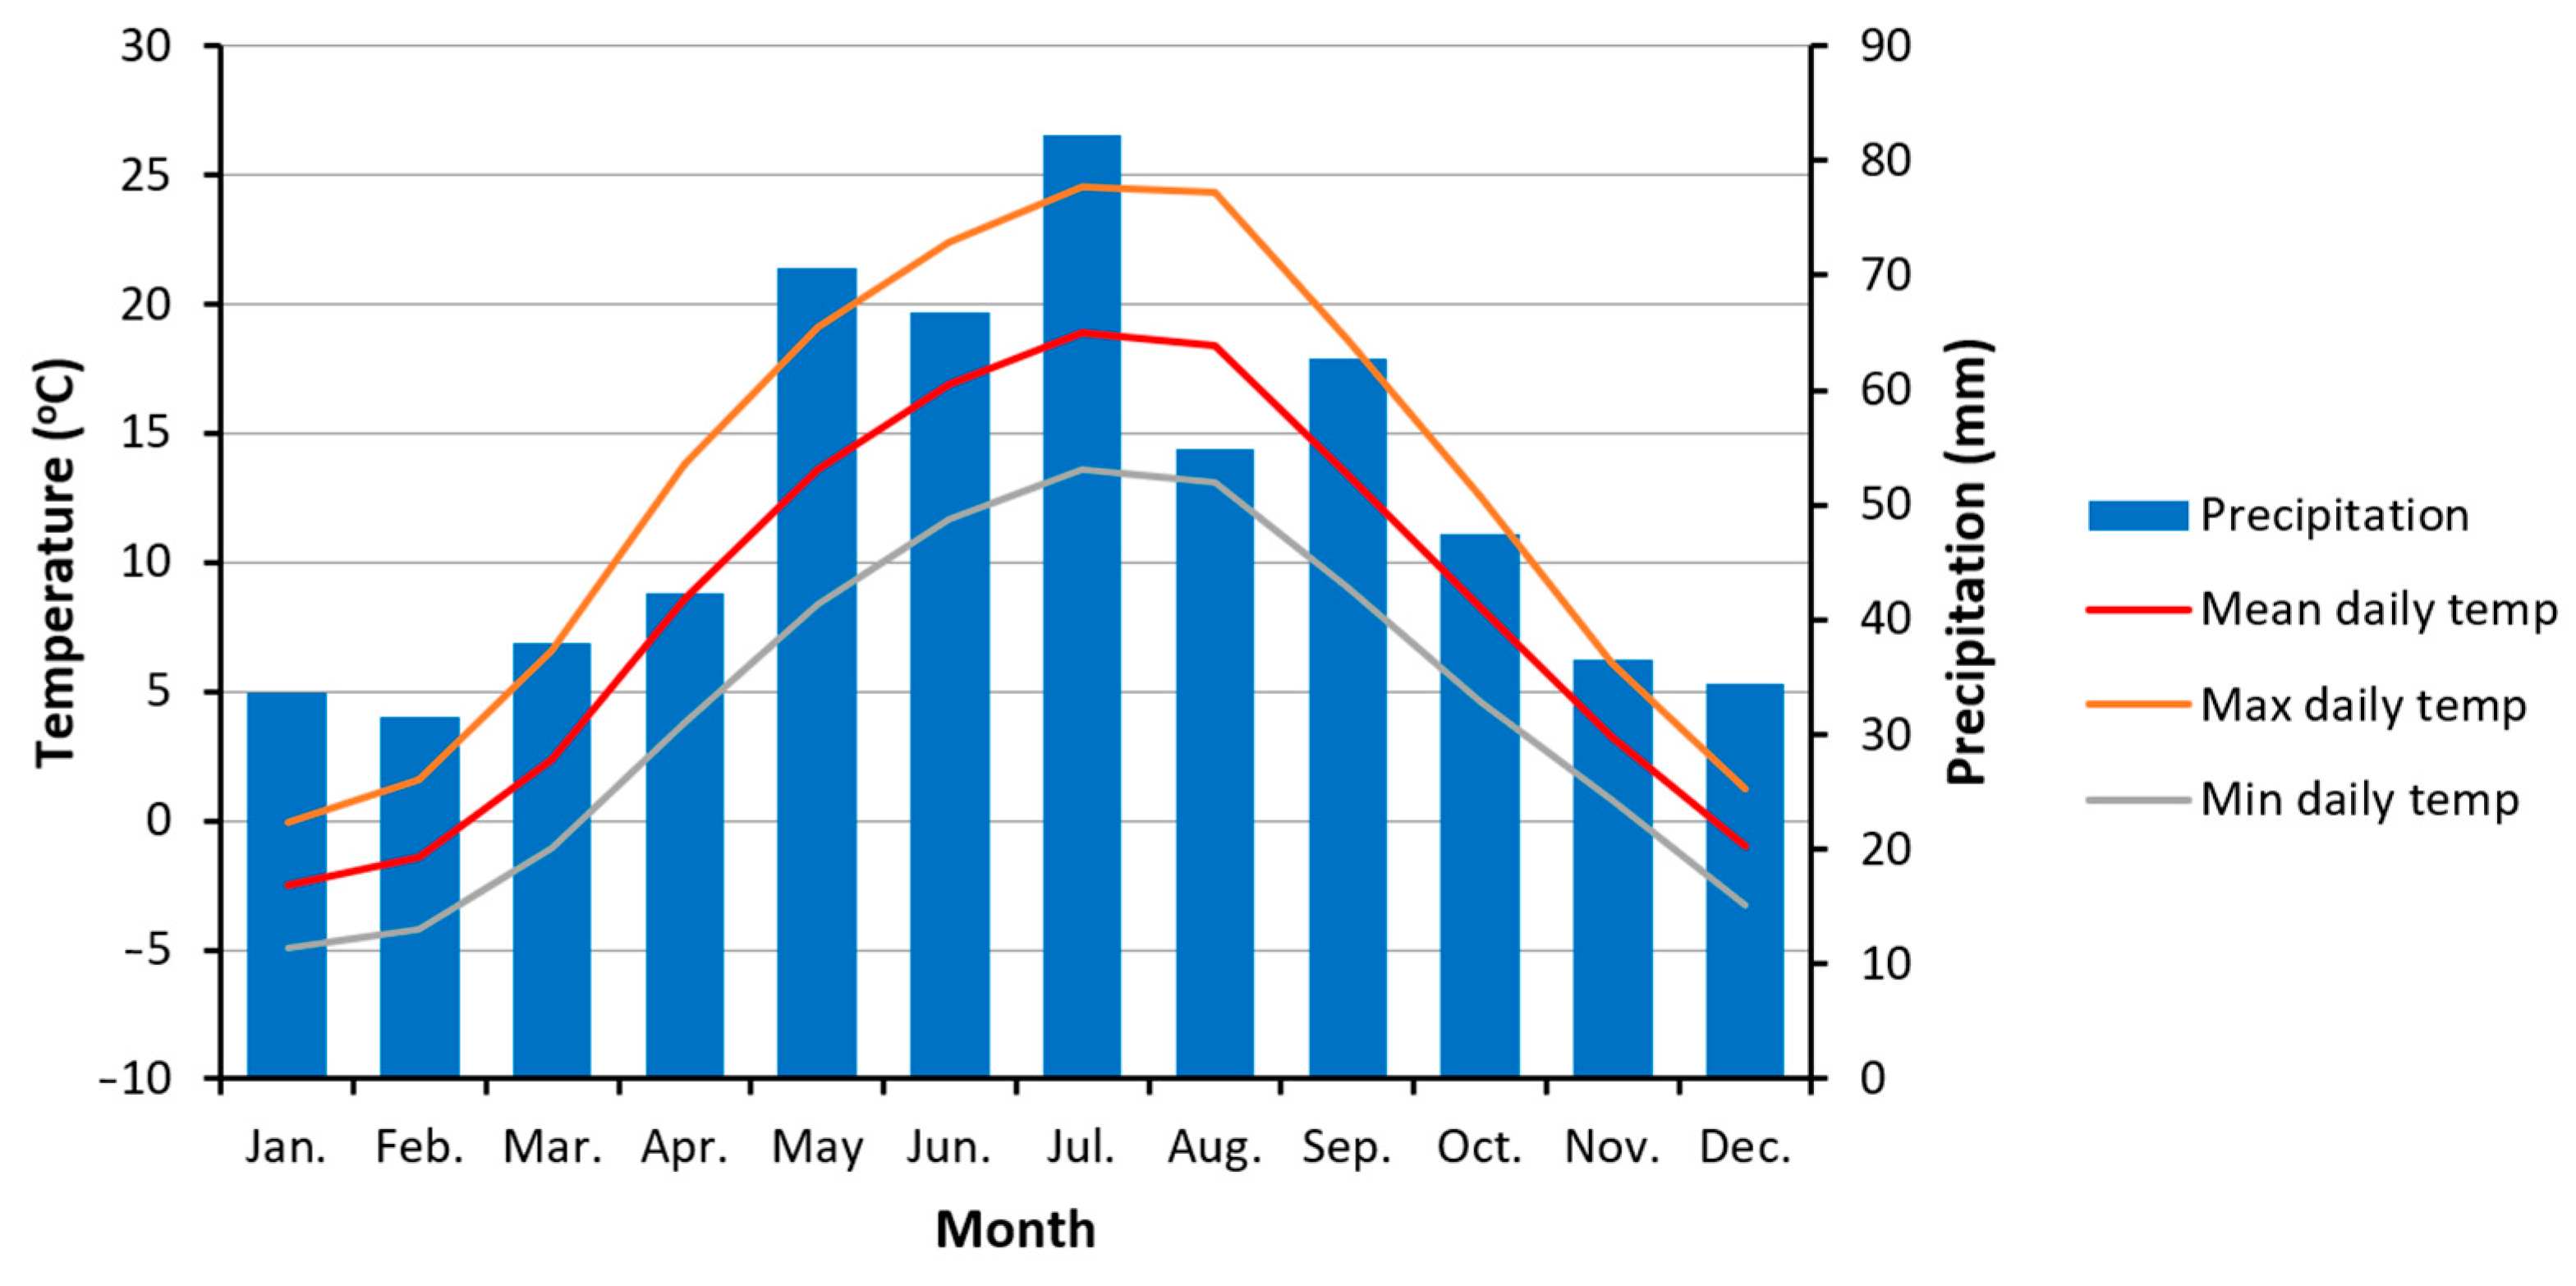
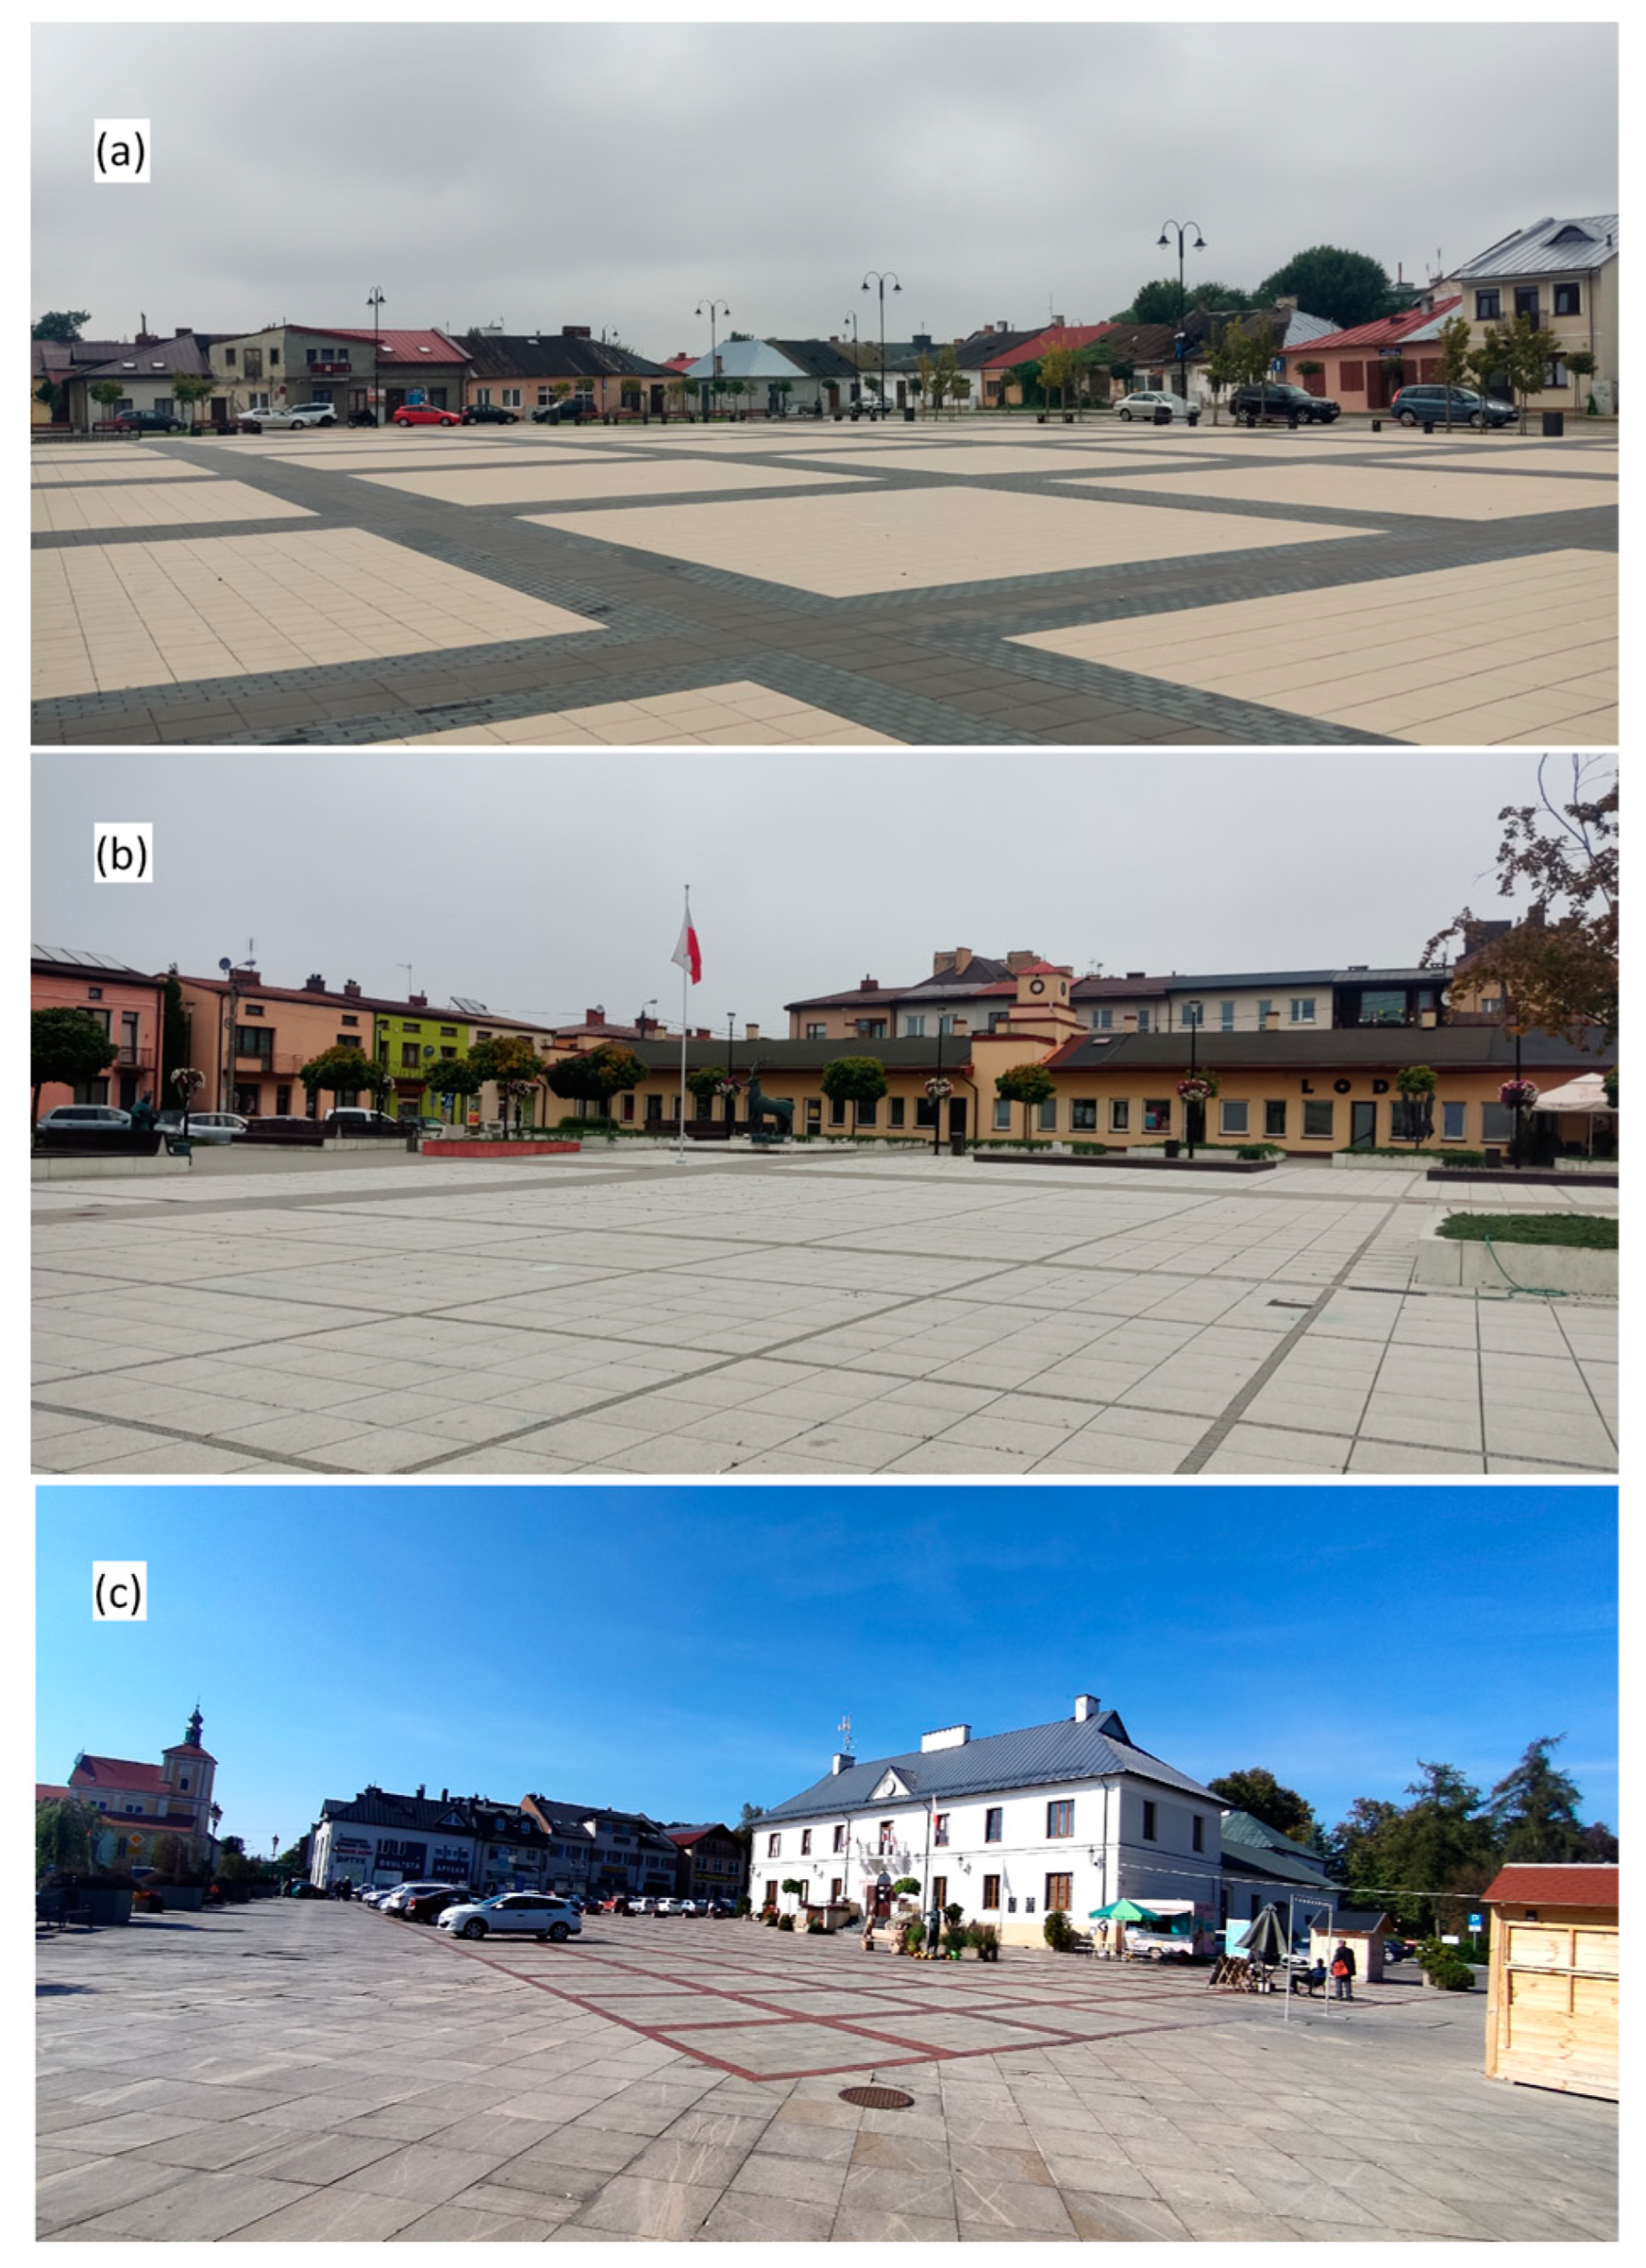
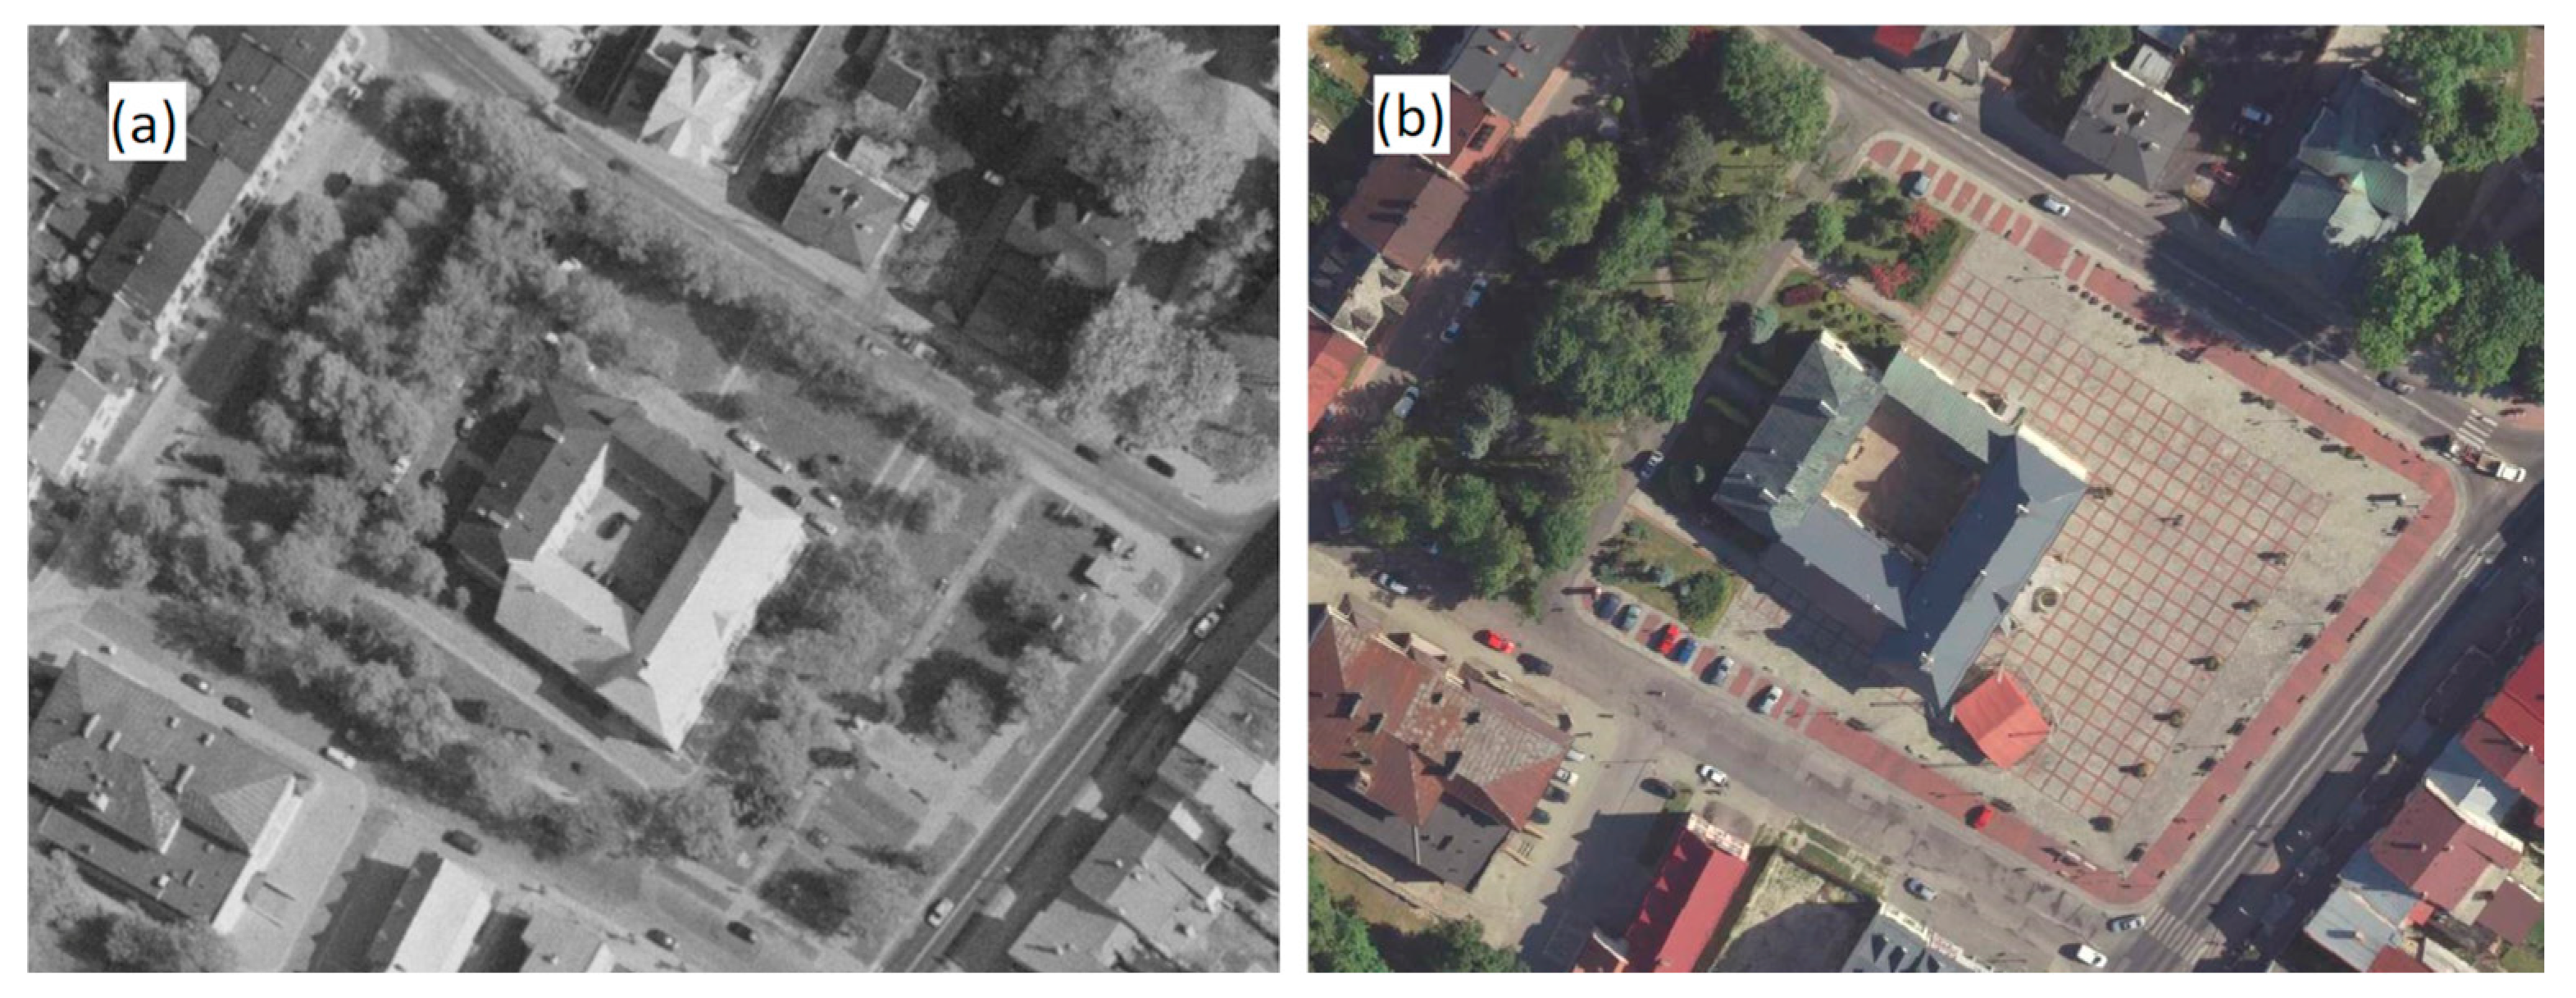
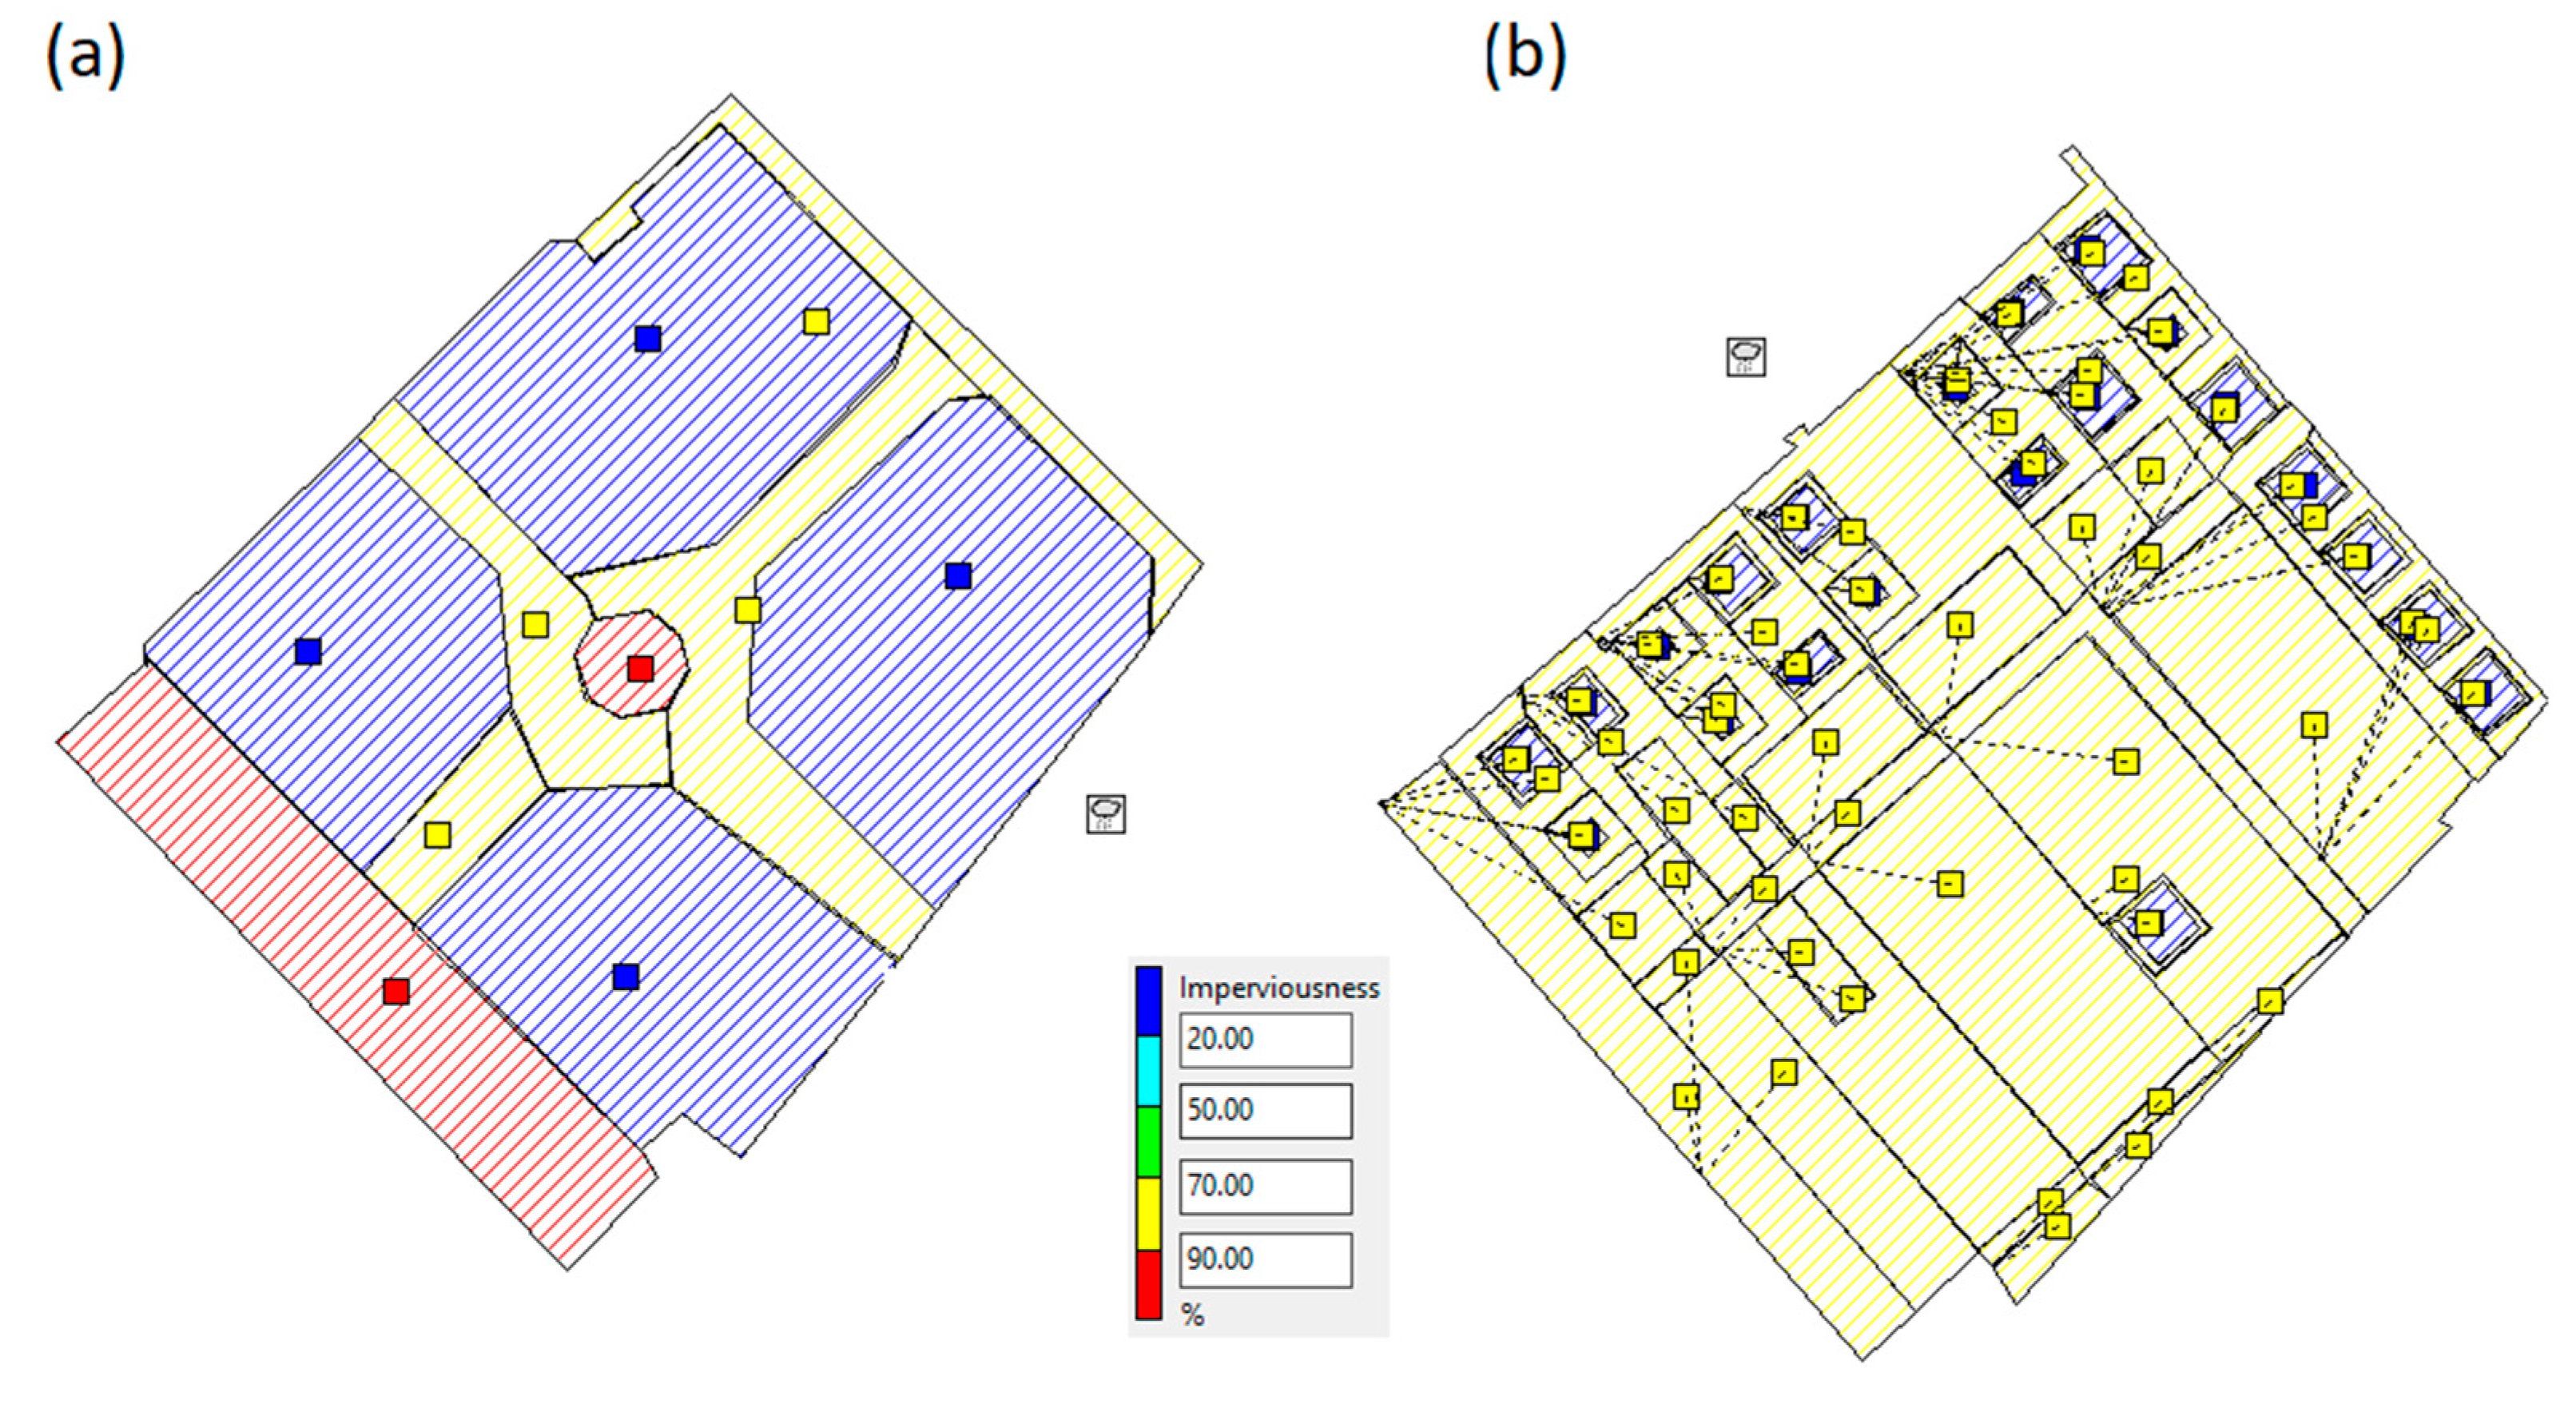
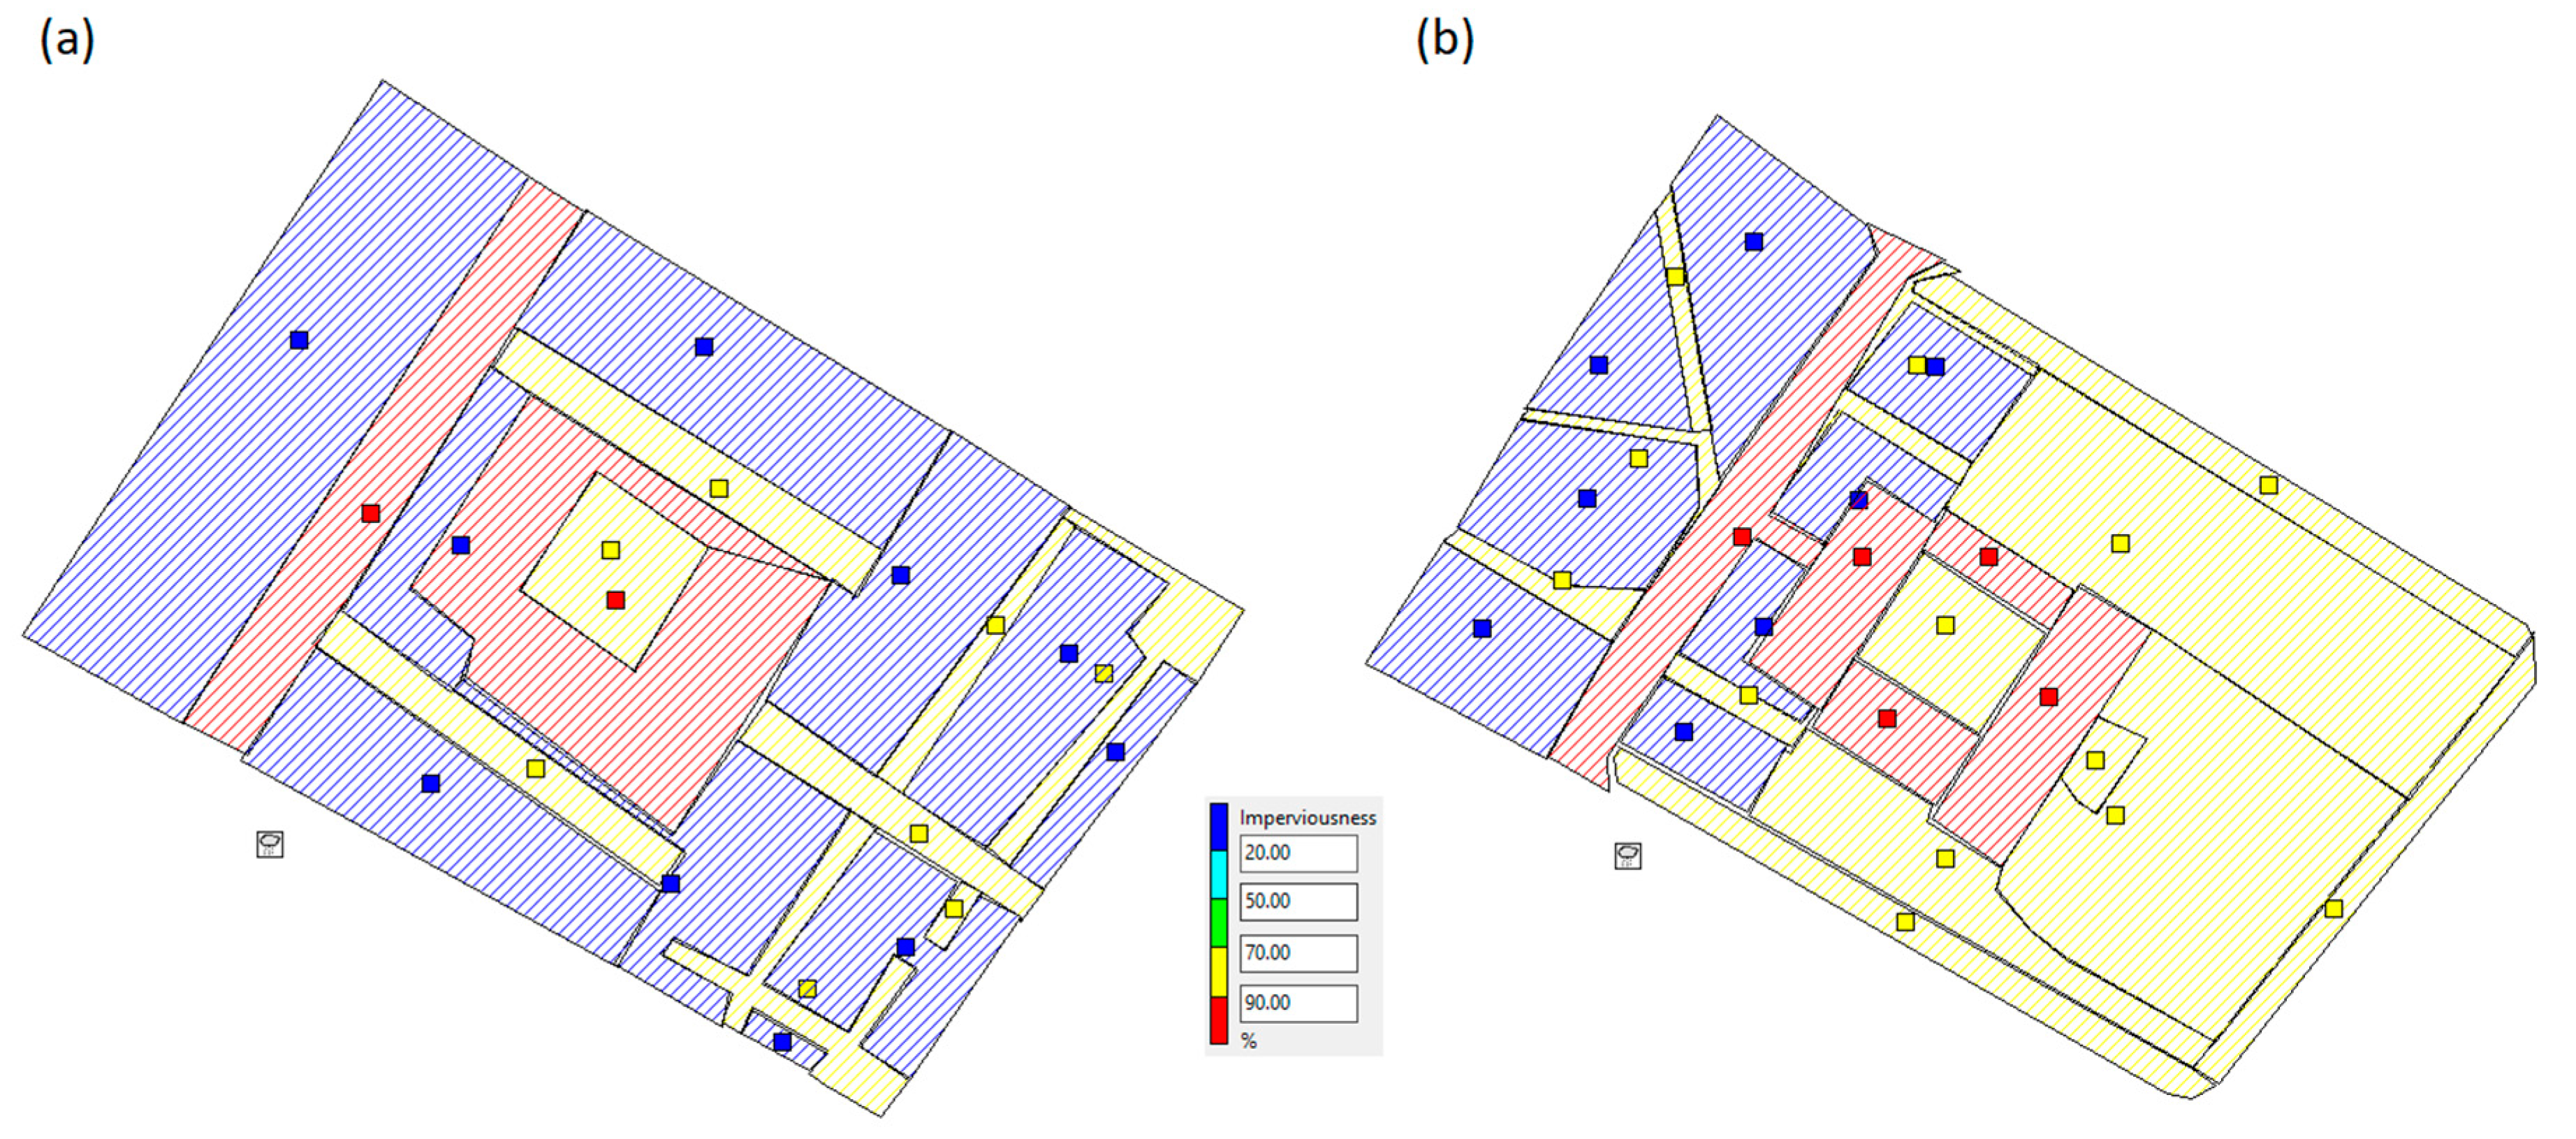
2.1. Object Description

Numerical modeling of rainwater balance changes caused by revitalization of the selected central square basins, as well as the attempted assessment of rain garden hydraulic efficiency, was performed for three selected catchments located in the towns of Leczna (Rynek II Square), Parczew (Rynek Square) and Szczebrzeszyn (Rynek Square) in Lublin Voivodeship, Poland. The locations of these cities in Lublin Voivodeship and in Poland are presented in Figure 3. According to governmental data [60], the populations of these towns are 17,670 in Leczna, 10,190 in Parczew and 4740 in Szczebrzeszyn, with a population density per square km of 929.7, 1265.2 and 162.9, respectively.
The climatic conditions in the area of Lublin Voivodeship are characterized by a mean annual temperature of 7.3 Celsius and annual precipitation of 560 mm, distributed unequally across the year, with the heaviest rainfall events, of up to 77 mm, occurring in July [62]. The set of historical data concerning the climatic conditions in Lublin Voivodeship, containing records for daily temperature, wind speed, insolation, precipitation, snow cover, etc., monitored since the year 2000 in weather stations in Lublin, Zamosc and Wlodawa, is available in Refs. [63,64]. The values of mean, maximum and minimum monthly average daily temperature and monthly precipitation for the period 1991–2020 determined for the city of Lublin, according to World Meteorological Organization standards [64], are presented in Figure 4.
The presented main historical squares in Leczna, Parczew and Szczebrzeszyn, which have a total area of 4489, 3833 and 10,900 m2, respectively, underwent serious revitalization in the period 2004–2020. The actual presence of the main squares in these cities is shown in Figure 5, while the results of the revitalization works are presented in Figure 6 and shown as orthophotos in Figure 7, Figure 8 and Figure 9. Before the revitalization, the dominant surface cover types were pervious green vegetation and bare soil cover. Concrete or asphalt pavements were used only for pedestrian traffic areas. After the revitalization projects, according to the data presented in Figure 6, the share of the green area in the studied basins decreased from 42.8% to 10.5% in Leczna, from 60.4% to 6.3% in Parczew and from 62.8% to 17.4% in Szczebrzeszyn. Thus, the dominant surface cover consists of various types of spaced impervious concrete pavement (see Figure 5 and Figure 6). The range of green vegetation removal was also reflected in local media reports quoting citizens’ complaints, including heatwaves [66,67,68,69], and describing cases of flooding [70,71,72,73,74]. Rainwater in the presented basins is nowadays collected by mains drainage and street gutters and delivered directly to the municipal rainwater system. The stormwater systems in the discussed basins consist of circular pipelines of diameter 100–400 mm [6].

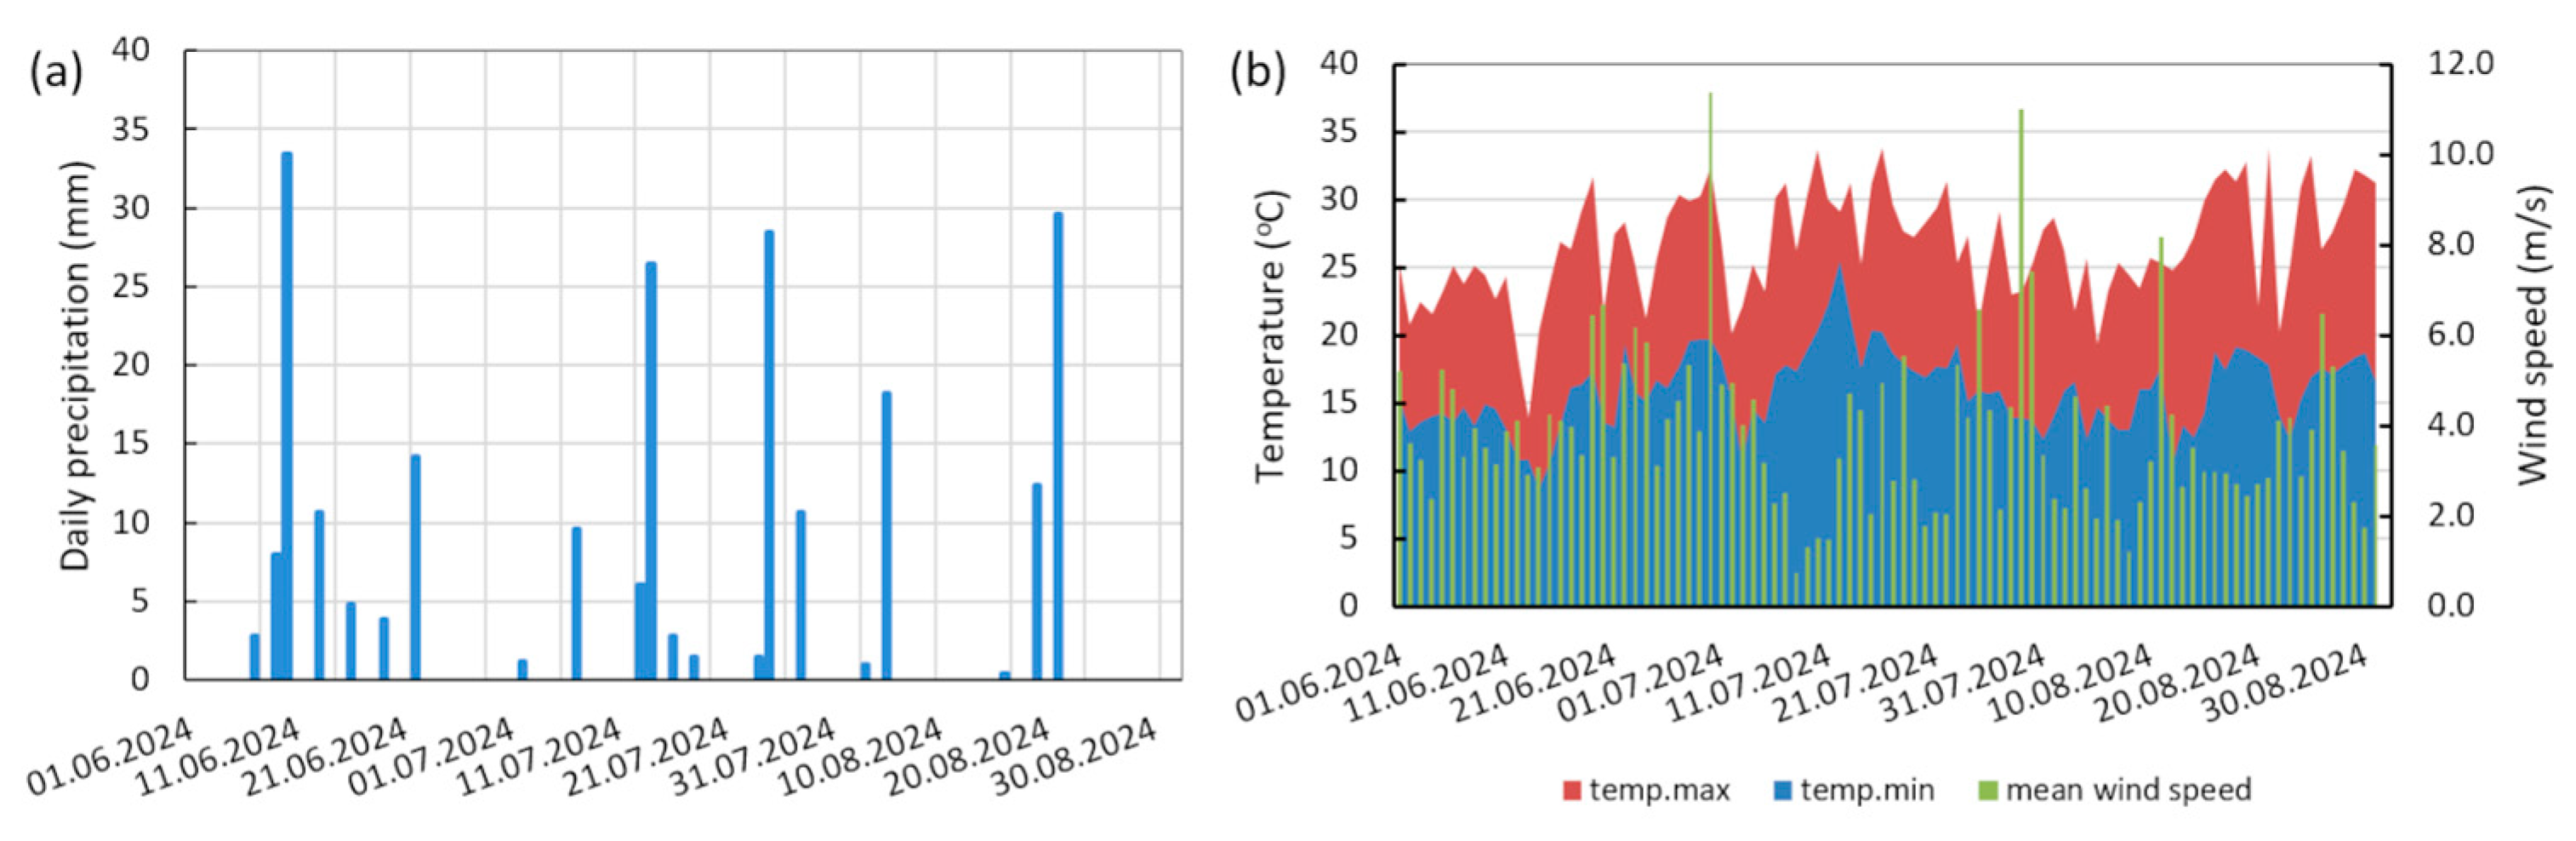
2.2. Numerical Modeling
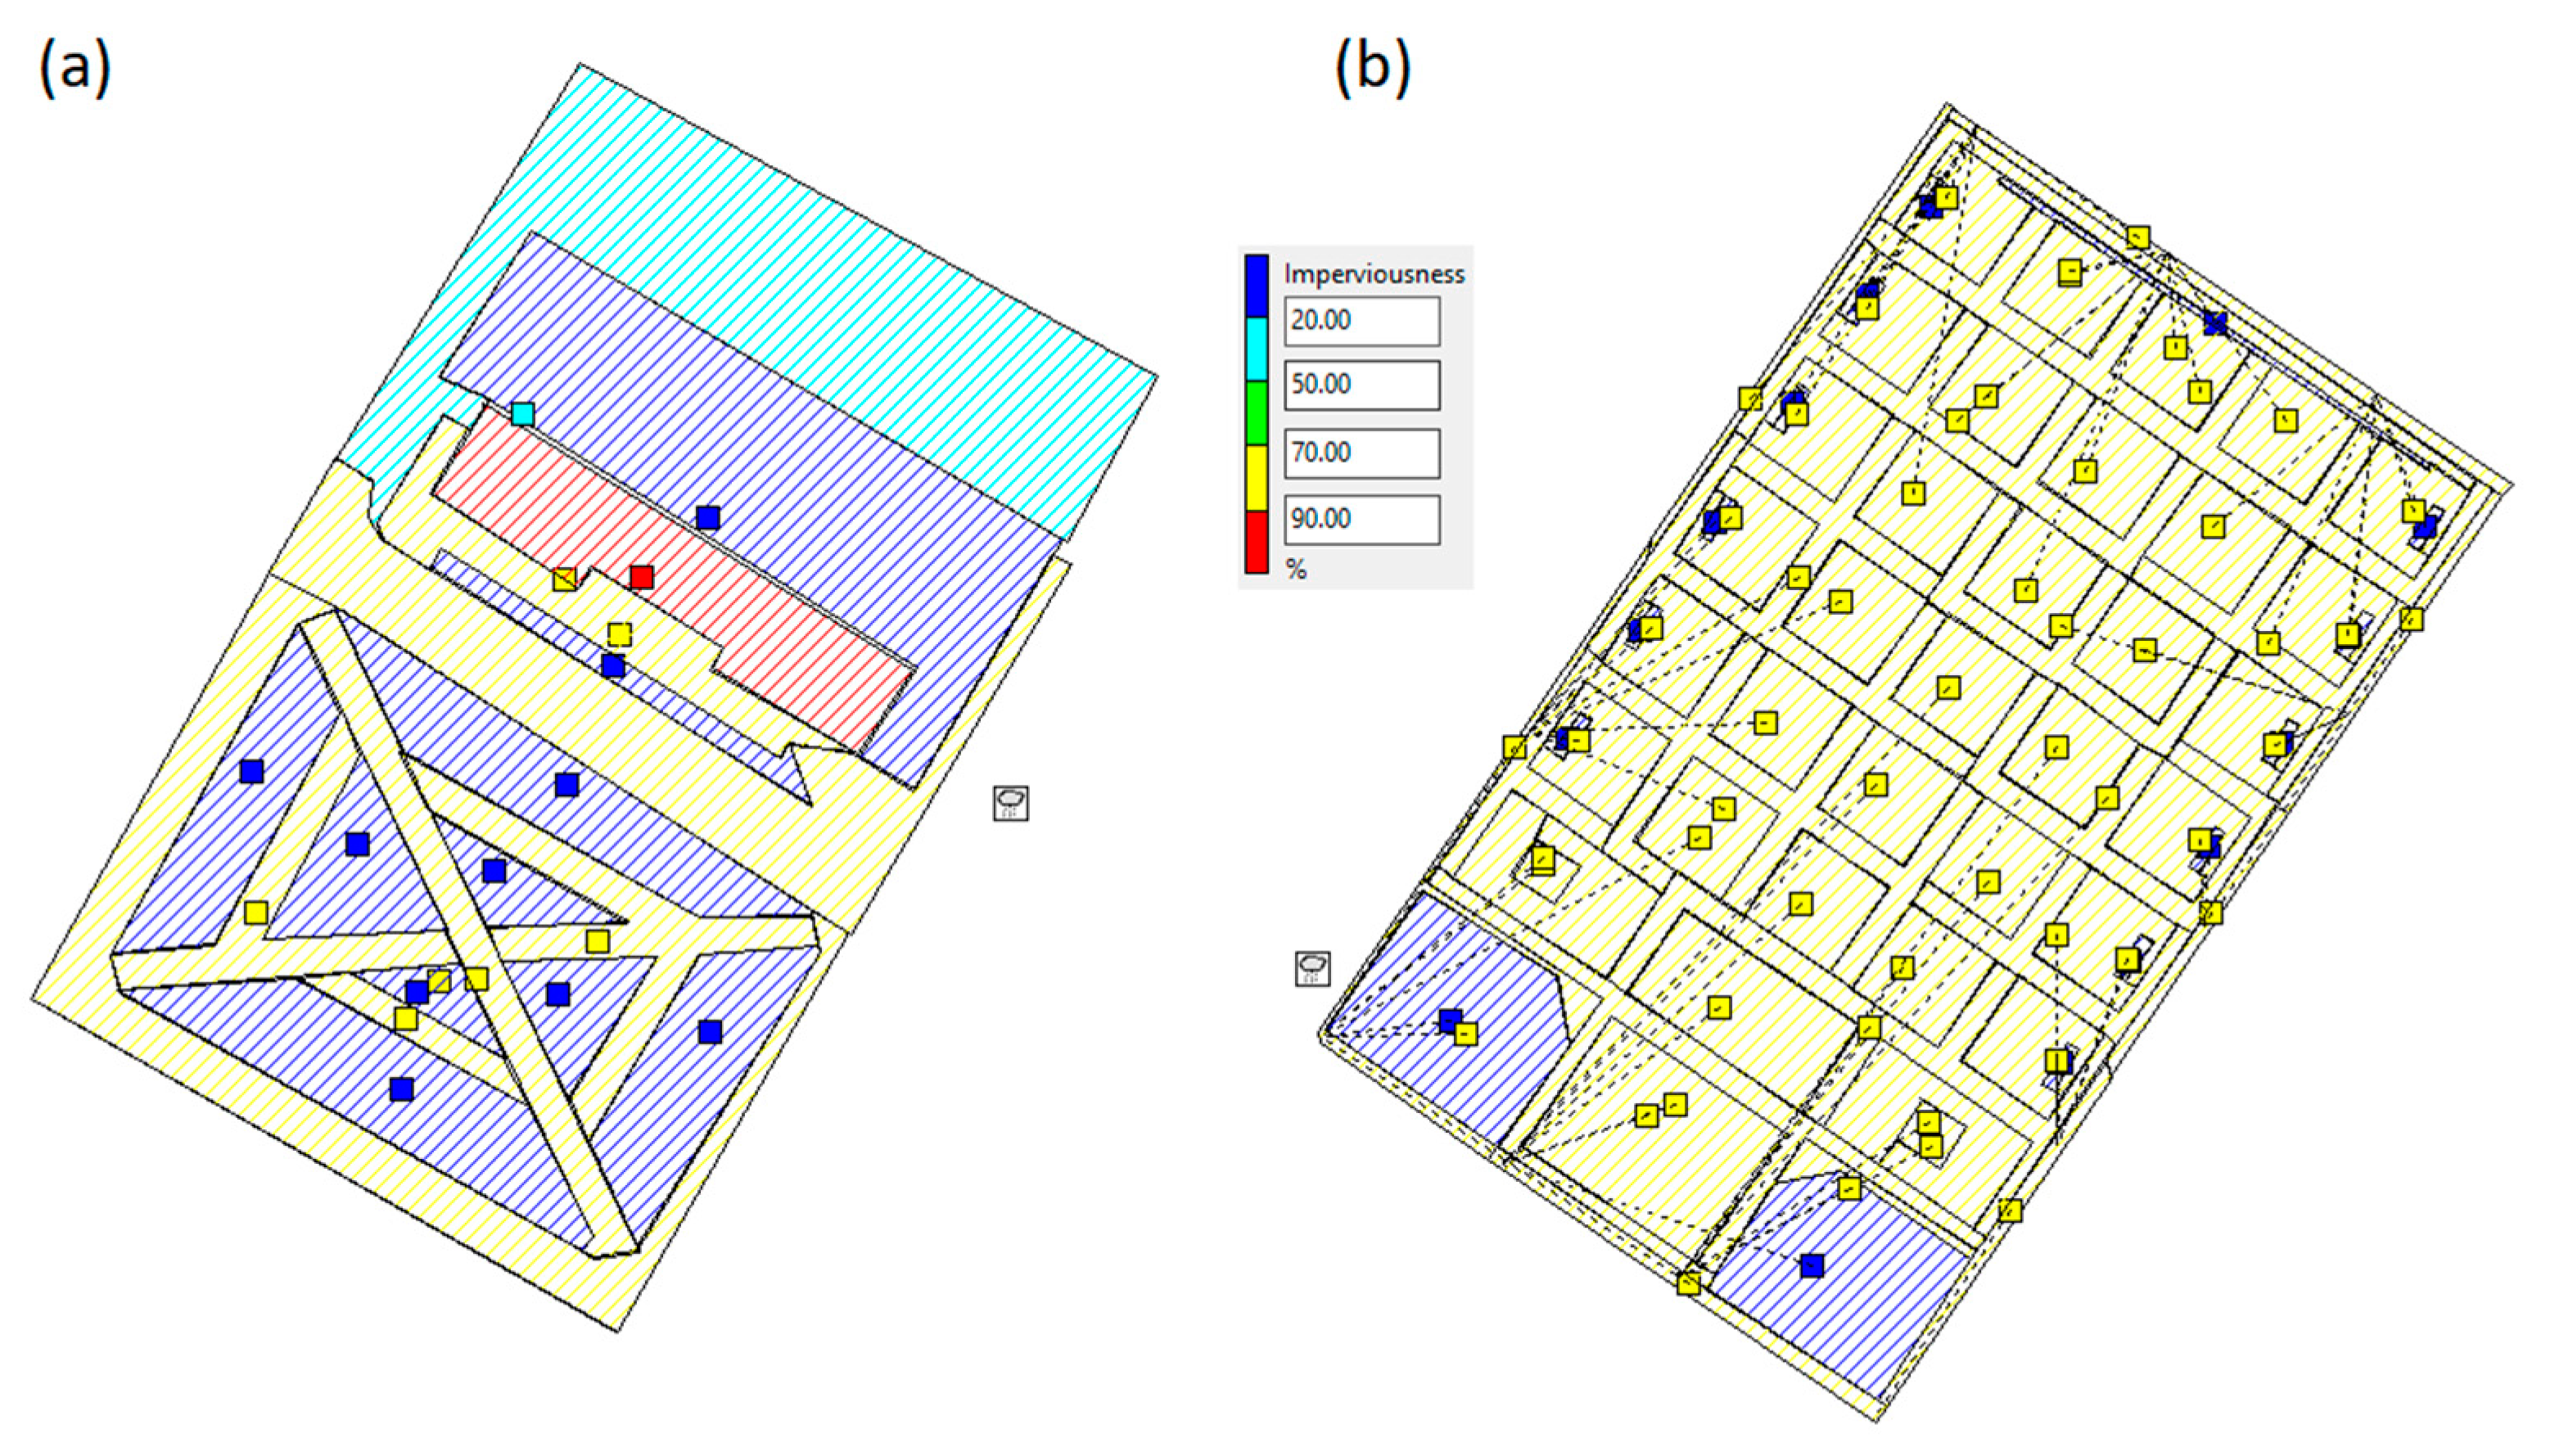
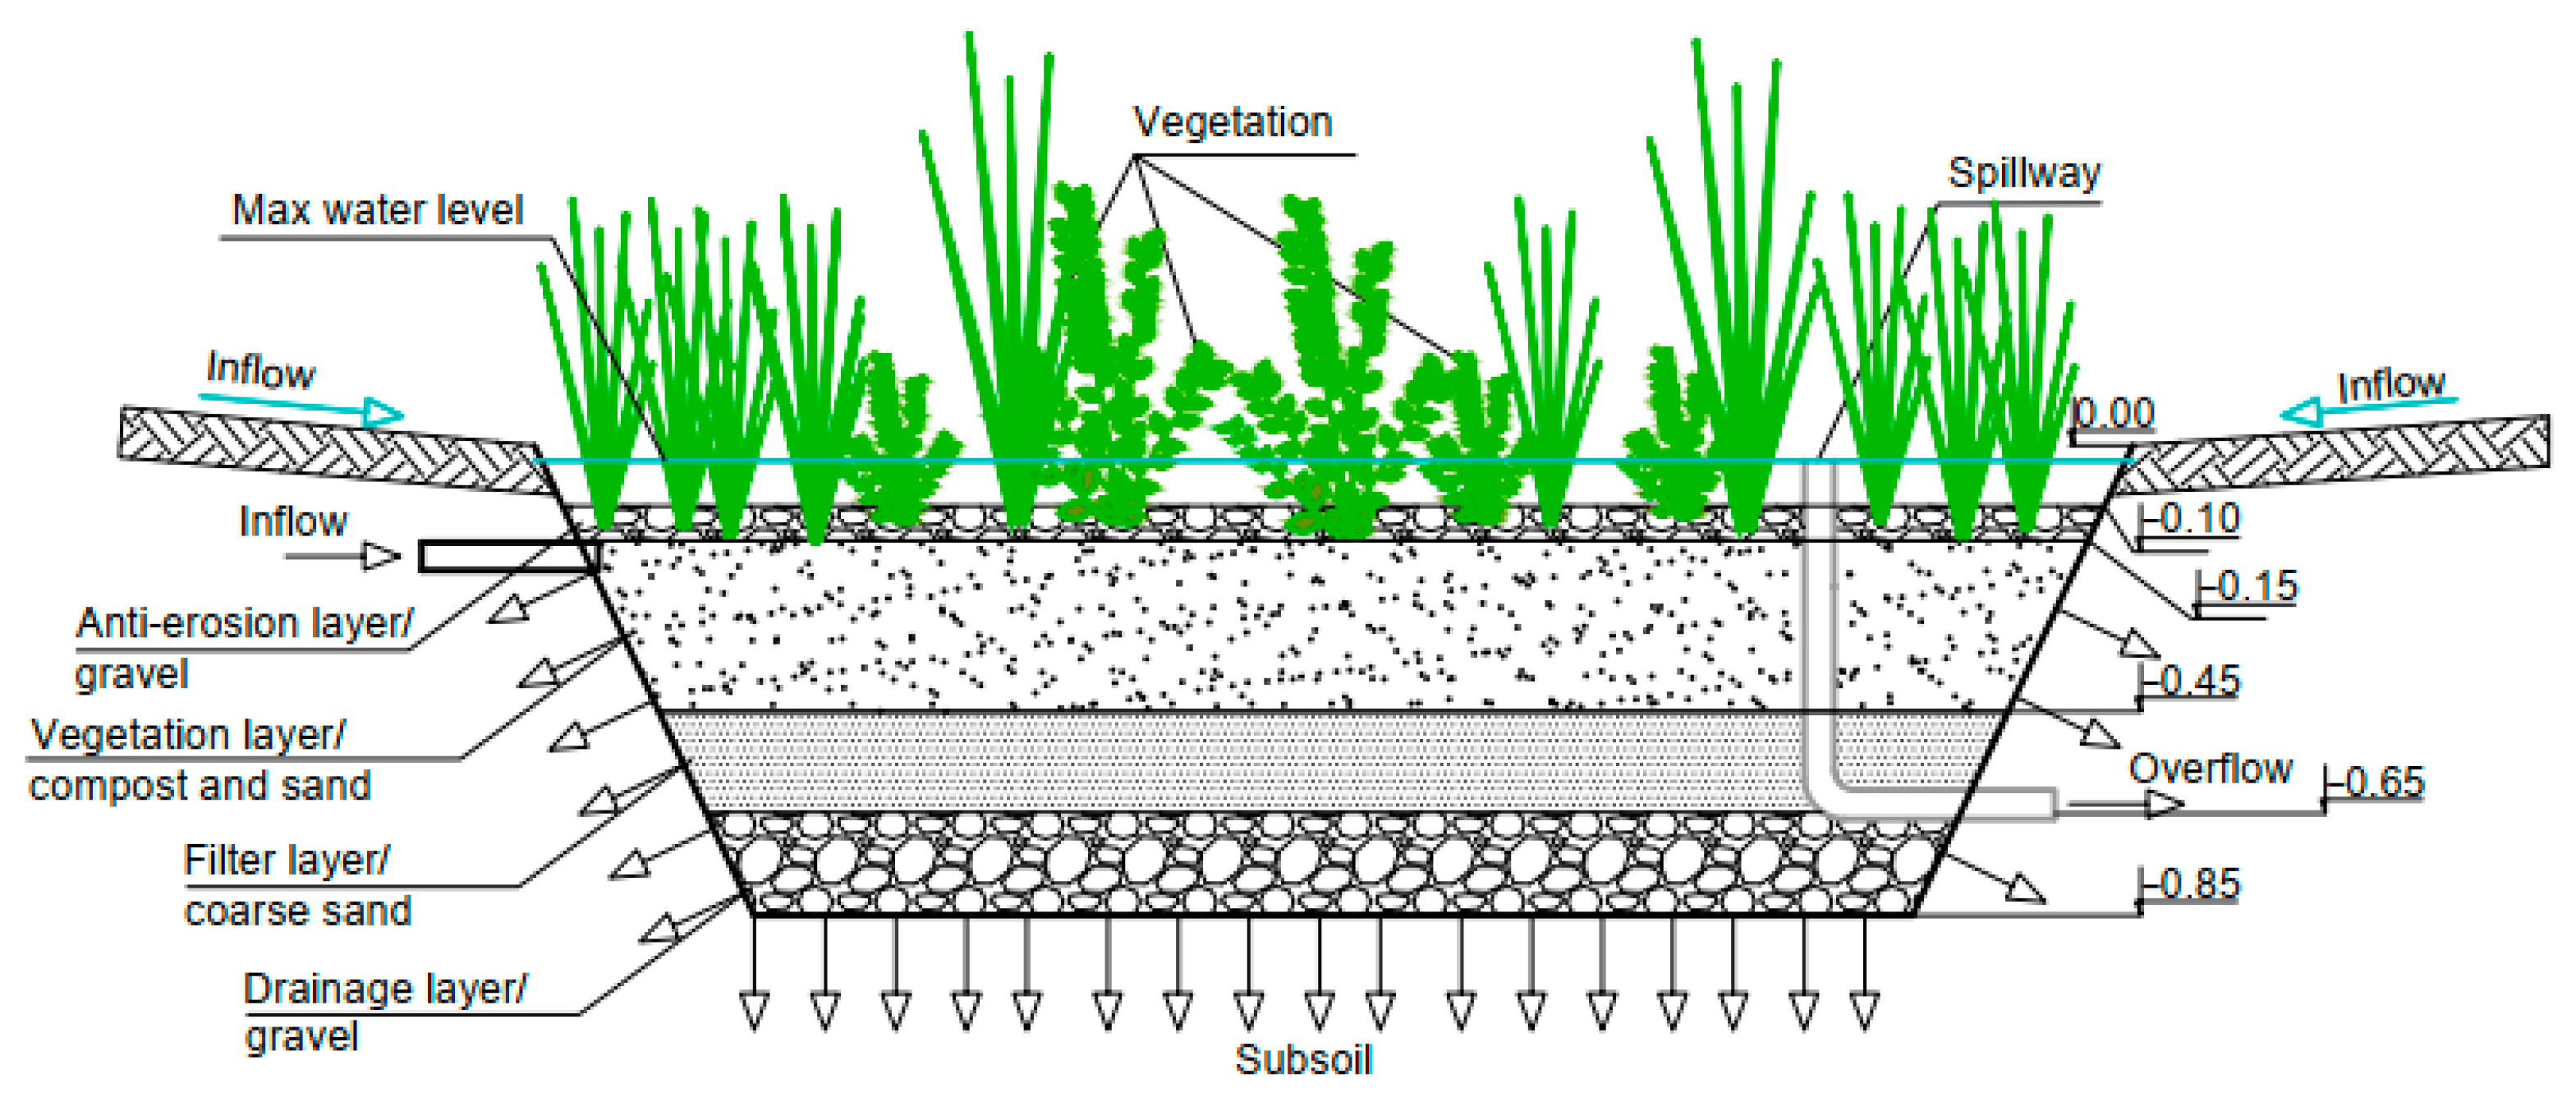
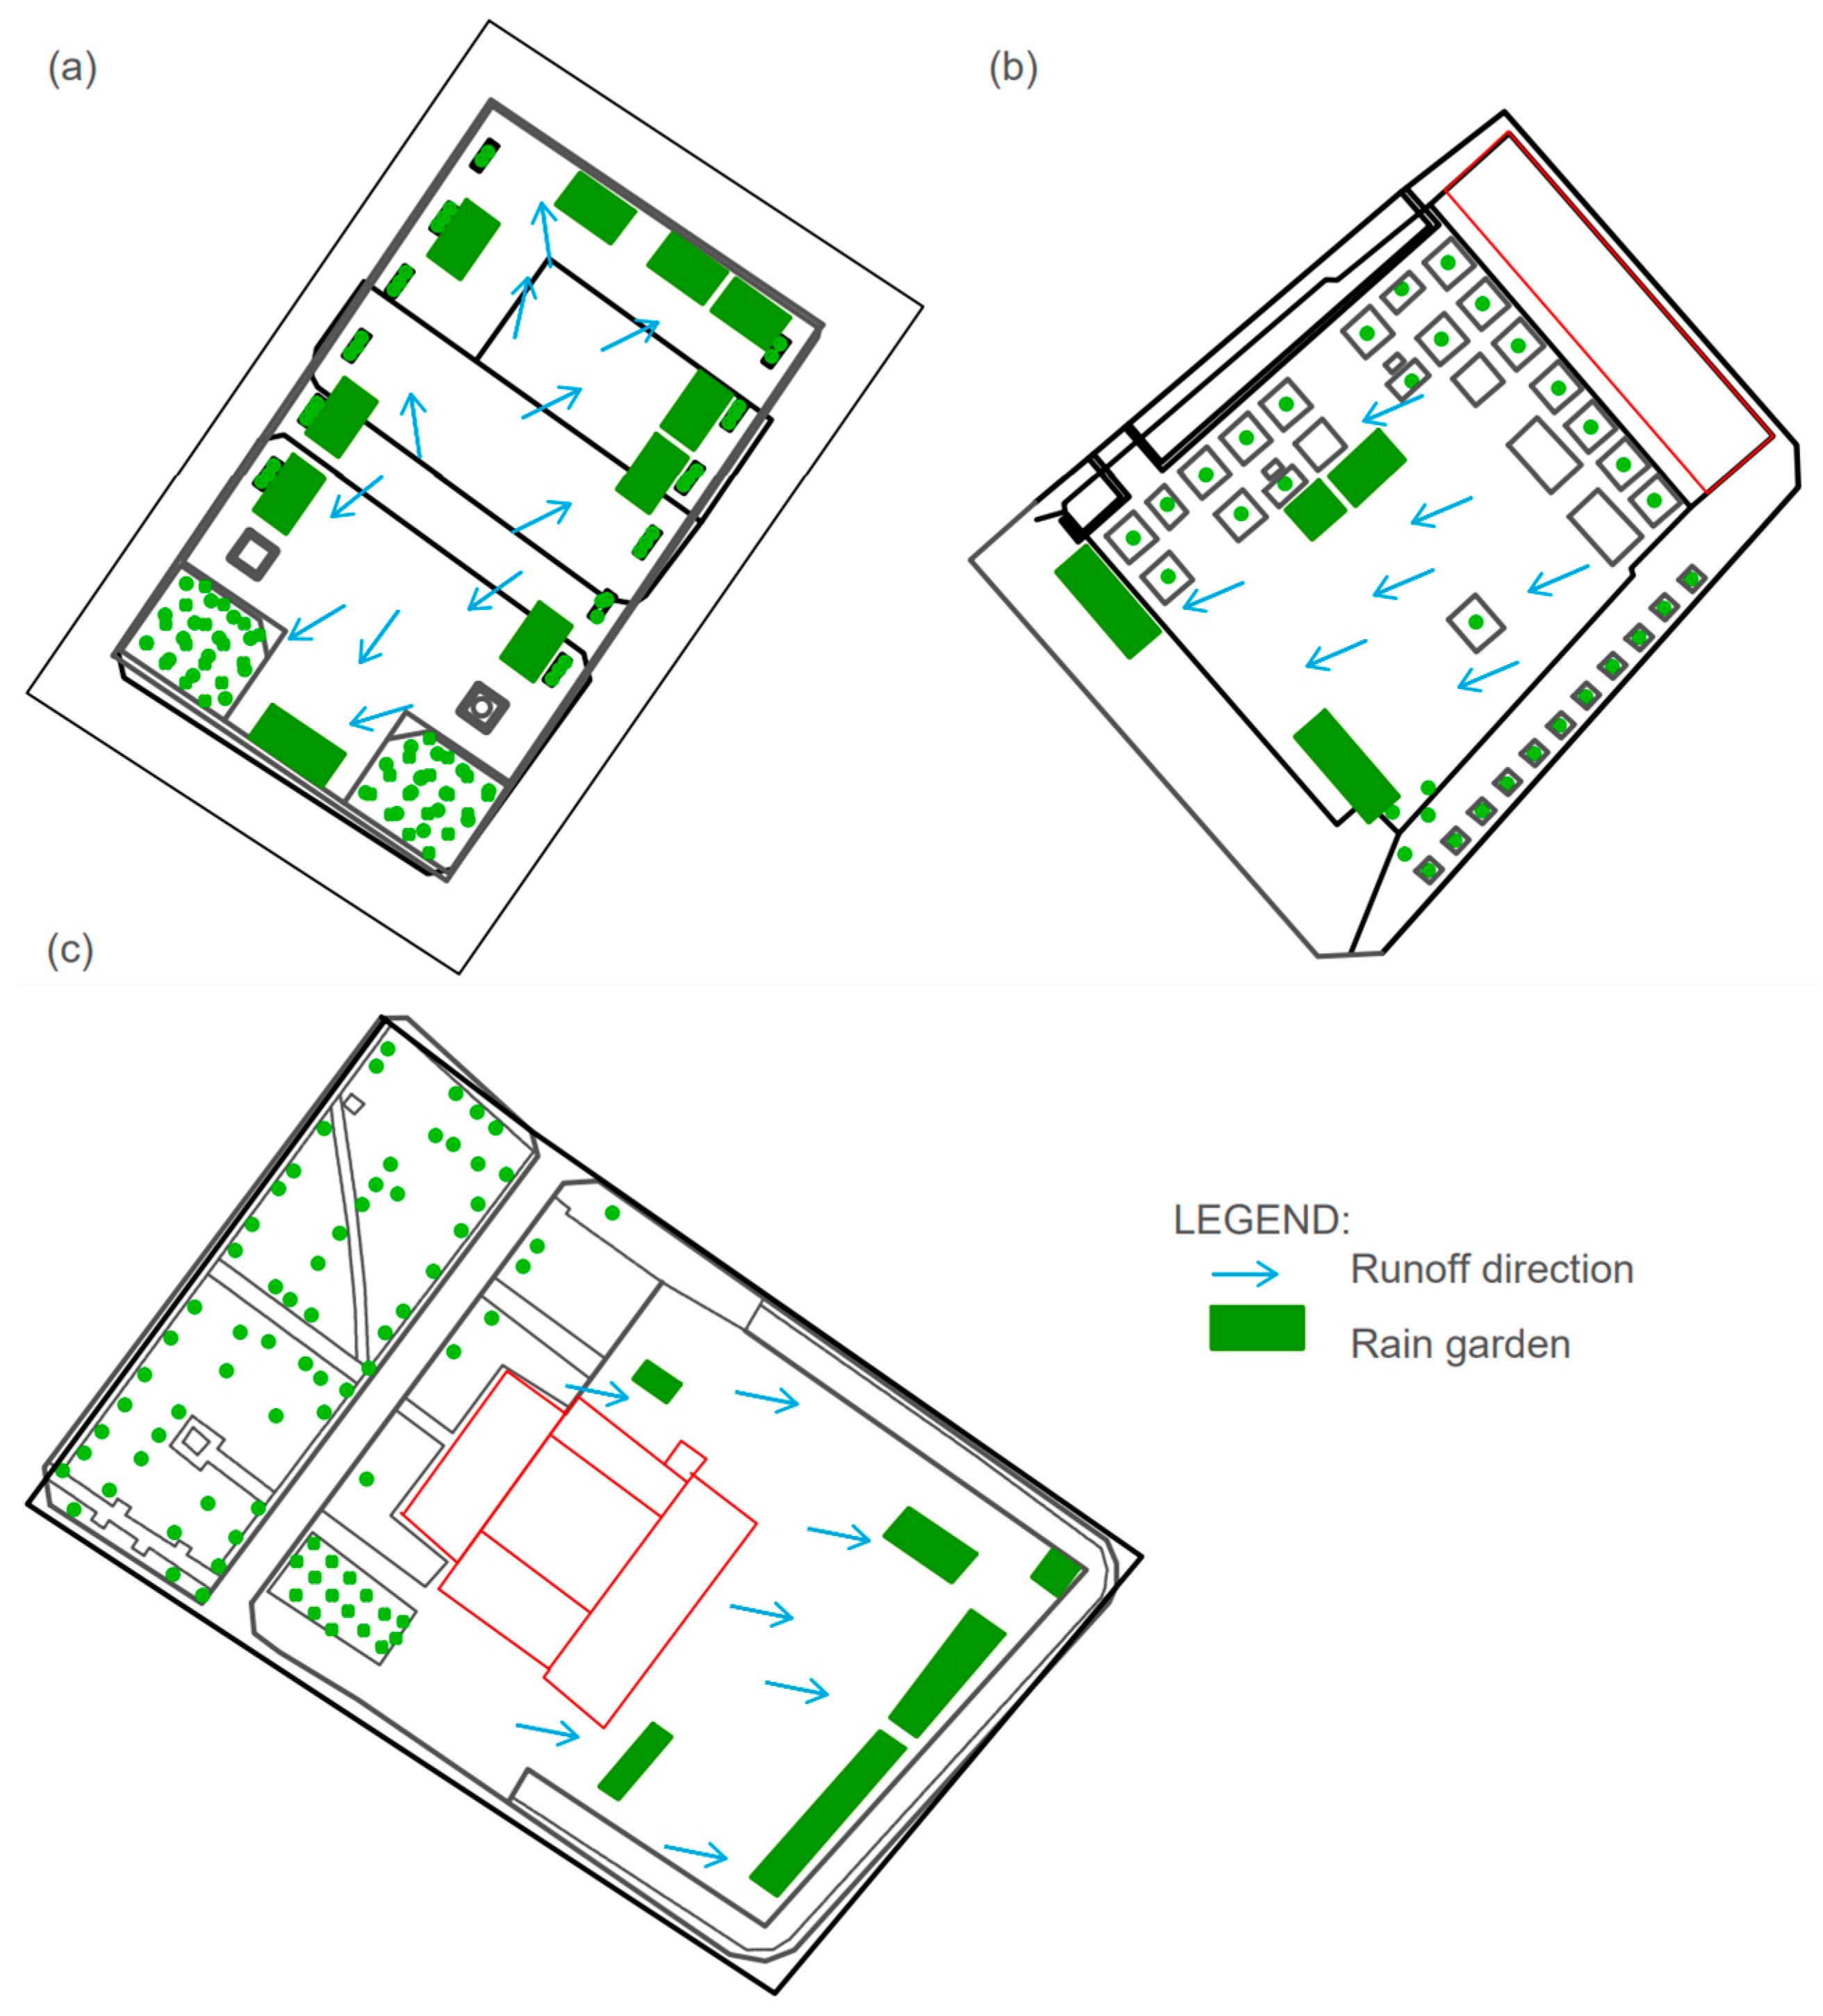
The numerical modeling of the changes in the rainwater balance caused by the presented revitalization projects was performed using the USA EPA (Environmental Protection Agency, Washington, DC, USA) SWMM (Storm Water Management Model) 5.2 computational software. The selected modeling software, equipped with the Low-Impact Development module, is commonly assessed as capable of conducting numerical calculations of rainwater management in urbanized catchments, also with green and blue infrastructure included [41,74,75,76,77,78,79,80,81,82,83,84].
The numerical calculations were performed for three variants: (i) Variant I, assuming the historical arrangement of surface sealing; (ii) Variant II, reflecting the actual sealing after the recent revitalization; and (iii) Variant III, considering the proposal for rainwater balance improvement due to rain garden application. The flow chart of the assumed methodology of the modeling research is presented in the Supplementary Materials as Figure S1. To allow a direct comparison, all the proposed variants of the rainwater management were tested for the same real weather conditions registered in Lublin during a period of 92 days from 1 June–31 August 2024 by the DAV-6152EU Vantage Pro 2 weather station by Davis Instruments, USA. The presented period of June–August was selected for numerical calculations due to the high reported number of days with rainfall greater than 10 mm, according to the climatic WMO (World Meteorological Organization) norms determined for Lublin in the period 1991–2020 [62,64] and numerous media reports considering serious threats posed by torrential rainfall events in the region [70,71,72,73,74]. Basing the numerical calculations on real rainfall data instead of modeled rainfall events was supported by the literature, which suggests using longer periods instead of single events [55,84,85,86]. The weather conditions, covering daily precipitation, minimum and maximum temperature and mean wind speed, determined for the tested period and applied to the numerical modeling, are presented in Figure 10. The numerical calculations were based on real rainfall intensity registered at 5 min intervals. The total sum of precipitation during the tested period was 227.4 mm. Figure 11 presents exemplary hyetographs of selected rainfall events registered on 10 June, 14 July and 19 August 2024, with rain depths of 6.2 mm, 27.2 mm, 12.4 mm and 26.4 mm, respectively.
The developed SWMM models, reflecting all the tested variants of the numerical calculations, are presented in Figure 12, Figure 13 and Figure 14, while the assumed input data, based on Refs. [87,88,89,90,91,92,93,94], concerning the runoff generation and flow as well as the infiltration model, are presented in Supplementary Materials in Tables S1 and S2. The Horton model [87,90,91] of rainwater infiltration was selected for this study, as suggested in the literature for similar cases [95,96]. The Horton infiltration curve shows that infiltration decreases exponentially from an initial maximum rate to a minimum rate over the course of a long rainfall event. The input parameters required by this method include the maximum and minimum infiltration rates, a decay coefficient that describes how fast the rate decreases over time and the time it takes a fully saturated soil to completely dry. The calculations of evapotranspiration were based on the registered maximum and minimum daily air temperatures presented in Figure 10b.

2.3. Rain Gardens

In order to improve the distorted water balance of the studied highly sealed urban catchments, the installation of rain gardens with an area of 6% of the basin, in agreement with Refs. [43,44], was proposed. Thus, the assumed total sizes of the rain gardens for the Leczna, Parczew and Szczebrzeszyn main squares were 240 m2, 216 m2 and 460 m2, respectively. The considered design of the rain gardens is presented in Figure 15 and Figure 16. The main components of the bioretention cell, i.e., the vegetation layer and infiltration bed, were designed as consisting of porous media comprising a mixture of gravel, coarse sand, fine sand and cultivating soil. The excess flow discharge was designed to access the existing municipal rainwater system through a PVC spillway pipe with a diameter of 100–400 mm. The assumed vegetation cover includes a mixture of hydrophilic plants, namely, based on Ref. [97], Iris, Nepeta, Caltha palustris, Lysimachia thyrsiflora, Calla palustris, Houttuynia cordata, Acorus gramineus, Veronica beccabunga, Oenanthe aquatic, Glyceria maxima, Juncus ensifolius, Gratiola officinalis, Equisetum hyemale, Matteuccia struthiopteris and Phragmites karka Variegatus. The installation of the rain gardens in the studied basins would require the partial removal of the actual concrete pavement, earthworks and the connection of spillway pipes to the rainwater system. The local soils were assumed to be clay sand, typical for the region [98]. The input data assumed based on Refs. [87,98,99] for rain garden modeling in SWMM are presented in Supplementary Materials as Table S3.

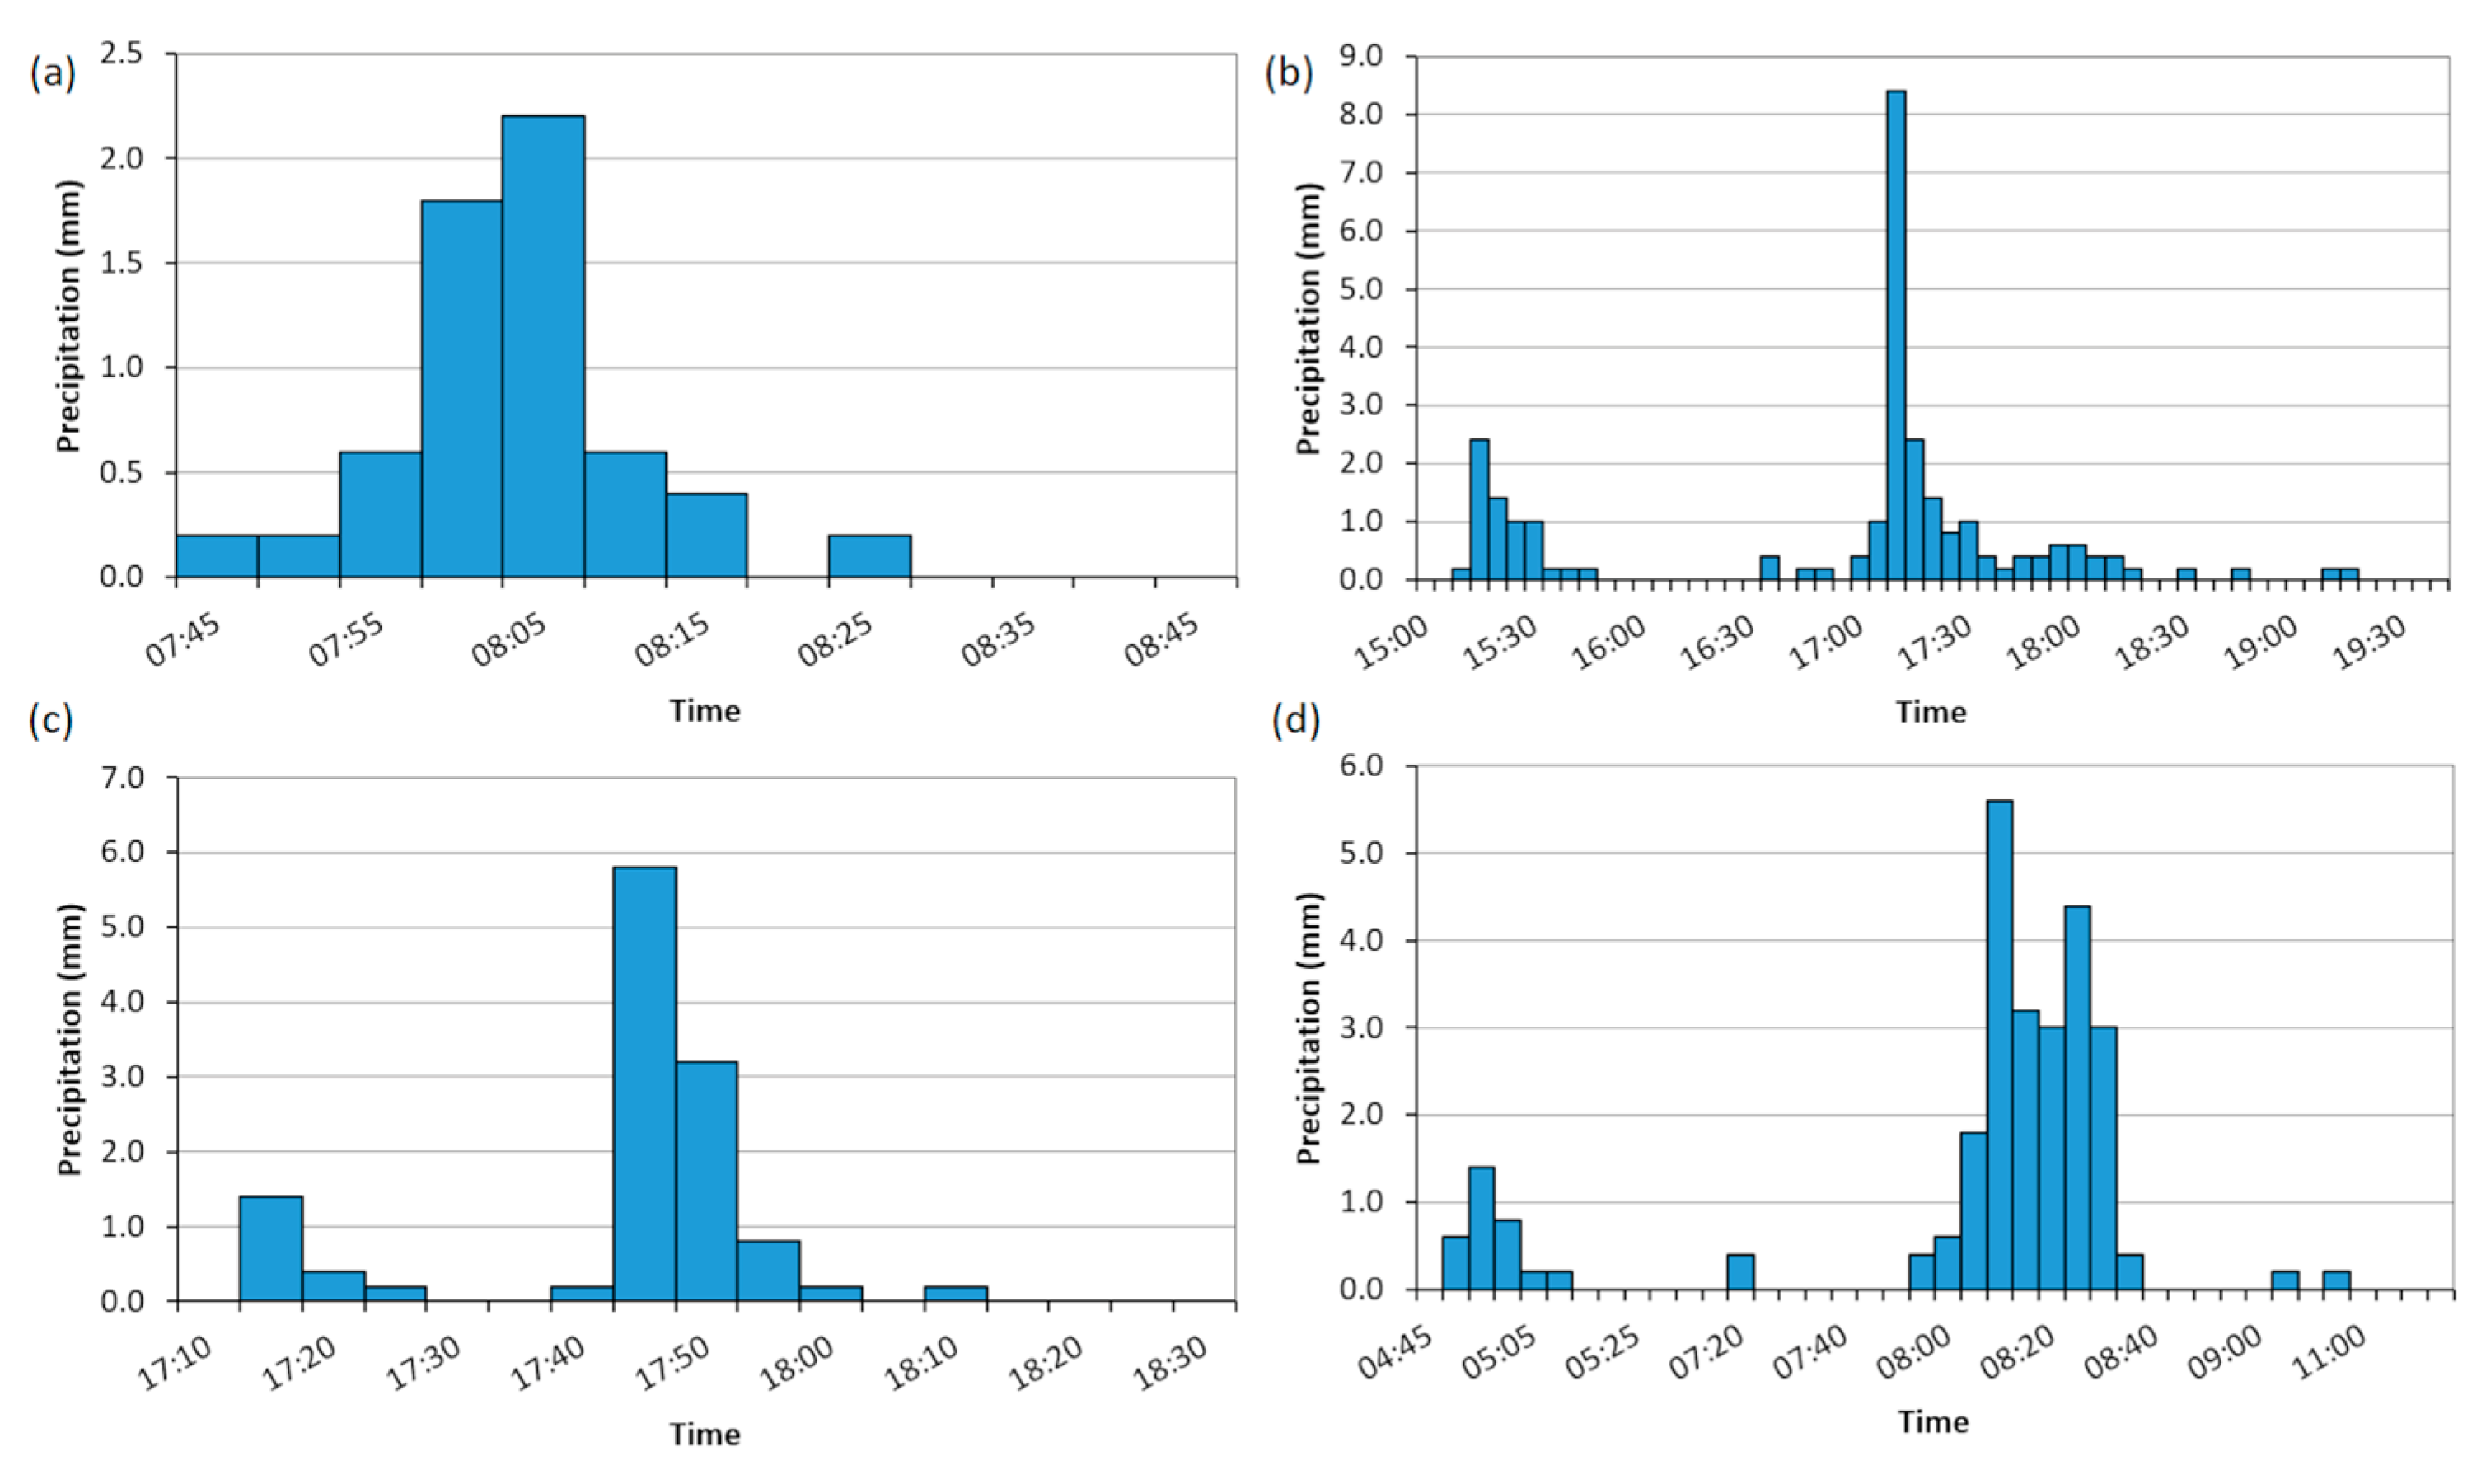
2.4. Simulation Results

The presented analysis of the runoff generation for the past and actual surface sealing and rain garden application efficiency tests were based on the following results obtained from the SWMM simulation: runoff volume and volumetric outflow rate peak flows, water balance components and runoff coefficients.
The resultant final runoff coefficient value for the studied urban basins was determined for the whole catchments based on the weighted average formula [100]:
ψ = ψ i · A i A
where ψ is the runoff coefficient, ψi is the runoff coefficient of i subcatchment, Ai is the subcatchment area and A is the total catchment area.
The obtained results of the numerical modeling covering the reported volumetric runoff flow were statistically analyzed to determine the significance of the observed differences. Standard procedures were followed, including Shapiro–Wilk normality tests and, in relation to their outcome, ANOVA analysis.
Additionally, the local sensitivity analysis of the developed models of the studied catchments, before and after the revitalization, was performed. In such an analysis, the value of one particular input parameter is changed, while the remaining data remain unchanged. Based on the literature [101,102,103], the two most important input parameters affecting the resultant runoff volume and peak flows describing surface roughness were selected for the analysis: Manning’s n roughness for impervious and pervious surfaces, i.e., n imperv and n perv. The following ranges of n impervious and n pervious were applied: 0.005–0.05 and 0.05–0.5, respectively [14].
The performed analysis was based on the sensitivity coefficient, calculated according to Refs. [86,103]:
S C = X Y · Y m a x Y m i n X m a x X m i n
where X is the initial value of the input parameter, Y is the predicted output for the X input parameter, Xmax is the maximum value of the input parameter, Xmin is the minimum value of the input parameter, Ymax is the predicted output for Xmax and Ymin is the predicted output for Xmin.
The numerical modeling presented in this study considered the projection of past, non-existent variants of the surface sealing arrangement and the hypothetical application of rain gardens in the studied watersheds in the three cities in Lublin Voivodeship, Poland, tested for the same weather conditions observed in the voivodeship capital, Lublin. Thus, due to the objective causes, these models were not calibrated. However, according to the literature, in such cases, even uncalibrated SWMM models present useful information [57,75,76,83,95,104,105,106].

3. Results

3.1. Runoff Generation

Figure 17a,b present a comparison of the final runoff coefficients and total accumulated runoff volumes determined during the numerical modeling for the assumed duration of the simulation. It can be seen that in all the cases of the three studied catchments, the lowest values of the runoff coefficients (in the range 0.34–0.39) and the accumulated volumes of the runoff were observed for the historical basin sealing, before the revitalization. Then, the performed revitalization resulted in a significant increase in runoff generation due to the increased share of the sealed area. The resultant calculated runoff coefficient values for the studied catchments in Leczna, Parczew and Szczebrzeszyn reached levels of 0.70, 0.64 and 0.67, respectively. These values, in turn, represent a 78.2%, 89.7% and 90.9% increase in the runoff volume during the 91 tested days of the simulation. The results of the calculation presented in Figure 17a,b also show the capability of LIDs to at least partially reduce runoff generation and outflow. The application of rain gardens of an area equal to 6% of the studied basins allowed a decrease in the runoff coefficient and accumulated runoff volume of 18.1%, 18.9% and 30.2% for the central square catchments in Leczna, Parczew and Szczebrzeszyn, respectively. A similar situation may be observed in Figure 17c, which shows the determined values of the runoff peak flows for all the tested variants of the surface sealing and studied locations. The performed revitalization of the studied square catchments in Leczna, Parczew and Szczebrzeszyn resulted in peak flow increases of 141.7%, 108% and 112.8%, respectively. And similarly, the application of the rain gardens allowed a 17.9%, 18.1% and 32% reduction in the runoff peak flows for the studied catchments. The performed statistical analysis of the obtained results showed that all the distributions of the calculated runoff volumetric flows were different from normal. Thus, a non-parametric one-way Kruskal–Wallis ANOVA supported by multiple comparisons was applied to further analyses, whose results indicated that the studied samples of the surface runoff flow differ statistically significantly for each variant of rainwater management.
To better understand the changes in runoff generation and outflow, simulated hydrographs for all the studied rainwater management variants and catchments for the four selected rainfall events (10 June, 14 July and 19 August 2024, see Figure 11) are presented in Figure 18, Figure 19 and Figure 20. In all the presented cases, the greatest intensity of runoff generation and outflow were observed for Variant II, for the tested basins after revitalization. For the Rynek II catchment in Leczna, the increase in the modeled peak flow after revitalization reached a range of 116.3–174.5%. Similarly, the observed increases in peak flow for Rynek squares in Parczew and in Szczebrzeszyn were in the ranges of 111.2–125.3% and 108.3–118.2%, respectively. The non-uniform increase in peak flows is, in our opinion, related to the different range of revitalization, associated with the various increases in the sealed paved surface. The application of rain gardens in Variant III allowed a decrease in the calculated runoff in the ranges of 21.9–25.2%, 21.1–22.1% and 45.3–55.2%, for Leczna, Parczew and Szczebrzeszyn. There are visible comparable ranges of a peak flow reduction in the Leczna and Parczew studied catchments, resulting from the similar sizes of these basins and applied rain gardens.
Figure 21 presents components of the water balance determined for the selected simulation duration, all of which are tested variants of rainwater management and the three studied catchments. It can be seen that before the revitalization, the past historic spatial arrangement of these catchments, based on 42.8–62.8% of green vegetation areas (mainly grass), allowed a significant share of infiltration and evaporation, which, combined, reached over 60% of the water balance. After revitalization, with the reduced green area, the water balances of all the studied catchments have different compositions. The dominant component is surface runoff, with a share of 69.46%, 63.81% and 67.35% for the squares in Leczna, Parczew and Szczebrzeszyn, respectively. The installation of rain gardens in Variant III allowed an improvement in the water balance and lowering the share of surface runoff to a level of 56.7%, 51.57% and 46.81% for central squares in Leczna, Parczew and Szczebrzeszyn, respectively. The decrease in runoff and increase in combined infiltration and evaporation were possible due to the hydraulic characteristic of the rain gardens’ infiltration bed and the evapotranspiration capabilities of the moist rain garden soil and the introduced hydrophilous plants with a large Leaf Area Index (LAI).

3.2. Model Sensitivity Analysis

The determined values of the sensitivity coefficients for the developed models for each variant of rainwater management and all the studied urban basins, before and after the revitalization, calculated for runoff volume and peak flows, are presented in Table 1.
The presented calculated values of the sensitivity coefficient show a non-uniform sensitivity of the developed models to changes in the input parameters for the two analyzed outputs: runoff volume and peak flows. Generally, the sensitivity coefficients determined for n imperv and n perv were lower for the runoff volume calculations than for the peak flows. The highest sensitivity to changes in Manning’s roughness for impervious surfaces was observed in the Szczebrzeszyn model, reflecting the catchment before the revitalization and the runoff peak flow calculations. It may be also noted that the more uniform surface sealing, the lower the observed sensitivity to changes in the input parameters.

4. Discussion

The performed numerical simulations, allowing the determination of changes in the runoff characteristics related to changes in the imperviousness ratio in the surface sealing in three different catchments of historical central squares in cities located in Poland, showed a clear increase in runoff volume and its peak flows. These observations are in full agreement with reports concerning the problem of the relationship between surface sealing and runoff characteristics and possible inundation flooding, not only in Poland, but generally under different climatic conditions [23,79,107,108]. An increase in the imperviousness of urbanized catchments, combined with a decrease in pervious green areas, results in clear changes in the water balance of urbanized catchments, involving increased runoff generation and decreased infiltration. This, in turn, may pose a significant threat to the limited capacity of the existing drainage and stormwater removal systems.
The presented results also show that the introduction of rain gardens, as an LID technique suitable for installation in various conditions of urban catchments, in combination with existing stormwater systems, may contribute to at least a partial restoration and improvement in the water balance. In the cases of the tested basins, the introduction of rain gardens resulted in a modeled decrease in the total runoff volume in the range of 18.1–30.2% and a reduction in runoff peak flows of 17.9–32.0%. Again, the obtained results can be compared with numerous scientific reports considering influence of rain gardens, or more broadly LIDs, on limiting runoff in highly urbanized catchments, both in Poland and in different regions of the world. The numerical studies presented in Ref. [9] considering the revitalization of the central square, Lithuanian Square, in Lublin, Poland, showed that, after revitalization, despite limiting the green vegetation area, the runoff characteristics for the real weather conditions were comparable. But this was related to replacing the barely permeable asphalt surface cover with spaced granite plates, allowing some infiltration. The introduction proposed in Ref. [9] of rain gardens to highly sealed subcatchments allowed a runoff reduction of 27.7% and a 47.5% runoff peak flow decrease. The six operational rain gardens monitored in Gdansk, Poland, showed an ability to store precipitation of up to 30 mm and allowed 0.42–0.707 mm of daily infiltration [17]. The other observed results of the rain garden introduction in Gdansk covered an increase in biodiversity and minimization of the phenomenon of heat islands by reducing the temperature by up to 7 C. A similarly modeled LID application in the selected urbanized catchment of a shopping mall in Warsaw, Sluzewiecki Stream, showed a possibility of reducing the runoff by 28.0–41.1% due to the usage of devices based on the permeable soil layer [76]. Comparable results for rain garden application were reported for other regions and different climatic conditions. During a pilot modeling study performed for the Güzeltepe catchment in İzmir Province in Turkey, the determined runoff reduction made possible by rain garden application was assessed as being 30% [75], which was greater than the reduction reported for permeable pavements (13%), green roofs (19%) and rain barrels (19%). Du et al. [42], in a study concerning runoff modeling and inundation estimation in a 663 km2 catchment located in central Shanghai, China, showed that rain gardens were capable of reducing the flood volume by 23.6–98.4%, inundation range by 26.1–82.4% and flood depth by 0.1–0.2 m. Another modeling study was performed by Mehri et al. [103] for a 65 ha historical densely populated catchment in Teheran, Iran, for which runoff was generated from 40.9 ha. For the 2.7 ha of the modeled bioretention area applied to the catchment, constituting 6.5% of the area, and the rainfall events of the return period from 2 to 100 years, a significant reduction in runoff volume, in the range of 60.7–75.7%, was observed.
However, it is worth underlining that, despite the positive results achieved by the application of individual LIDs, in this case, rain gardens’ usually better overall performance may be provided by a combination of different LID devices [22]. But the technical possibility of different LID installation in a given catchment may vary, according to the local conditions, available space, pedestrian and vehicle movement zones, etc. For example, the combination of rain gardens, infiltration trenches and detention ponds tested numerically in 365 ha of the Boa Vista neighborhood in a tropical city in Joinville, Brazil, and for five selected design storms allowed a reduction in the total runoff volume of 30–75% [109]. Similarly, SWMM modeling studies assessing potential LIDs’ effects on runoff reduction in the Templeton Gap watershed, Colorado, USA [110], covering permeable pavements, rain gardens and infiltration trenches, showed that the best effect, allowing 32.7% of runoff reduction, was possible using a combination of the above-mentioned LIDs. The simulated application of individual LIDs allowed a clearly lower reduction rate as follows: permeable pavements 18.8%, rain gardens 14.7% and infiltration trenches 12.3%. Next, the modeling research assessing potential LID application in the Normal-Sugar Creek watershed, McLean County, Illinois USA [109], covering a combination of permeable pavements, rain gardens and rain barrels, suggested capabilities of runoff reduction in a range of 3–47% for various rainfall events. The efficiency of an infiltration- and storage-based LID combination in runoff reduction was also tested for the Sucheng District of Suqian City, Jiangsu Province, China [77], where, for the modeled Chicago rainfall, the maximum obtained reduction in the peak flow was 32.5% and the maximum decrease in the runoff volume reached 31.8%.

5. Conclusions

The performed numerical calculations of runoff generation in three historical urban catchments, before and after revitalization, resulting in an imperviousness increase, with additional numerical tests of rain garden application, as well as the performed assessment of the economic feasibility of the designed LIDs, allowed the following conclusions:
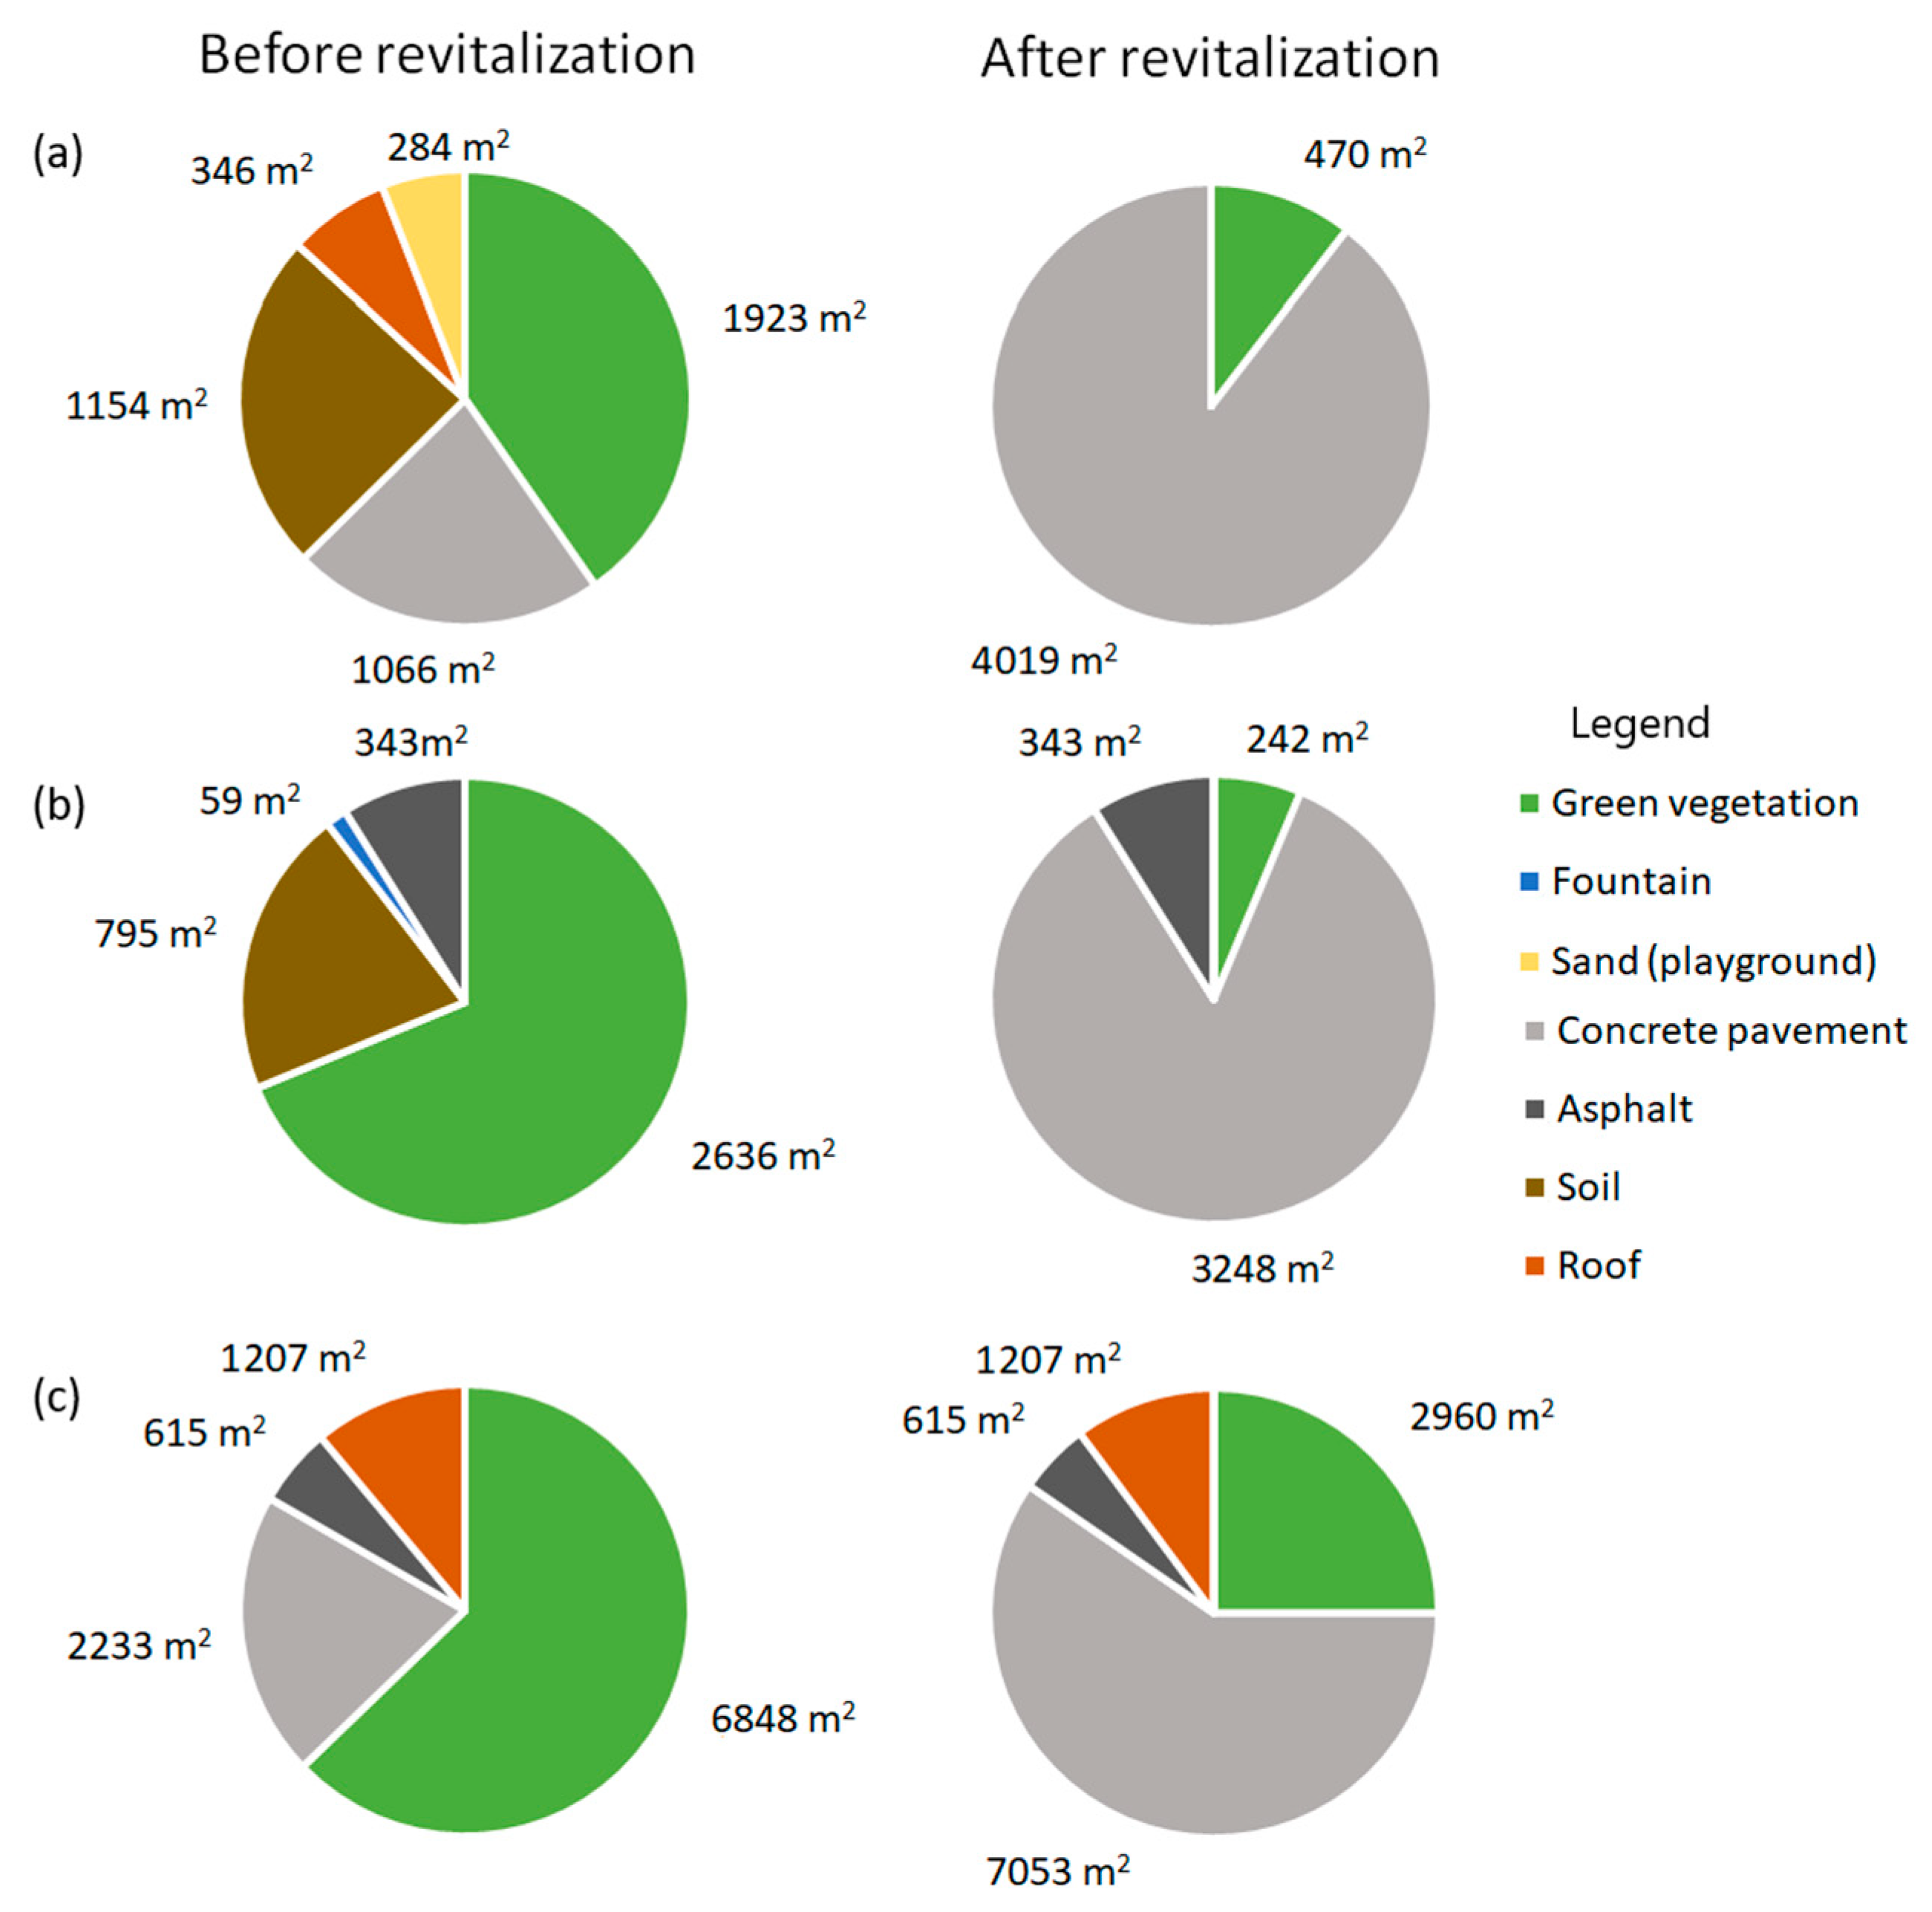
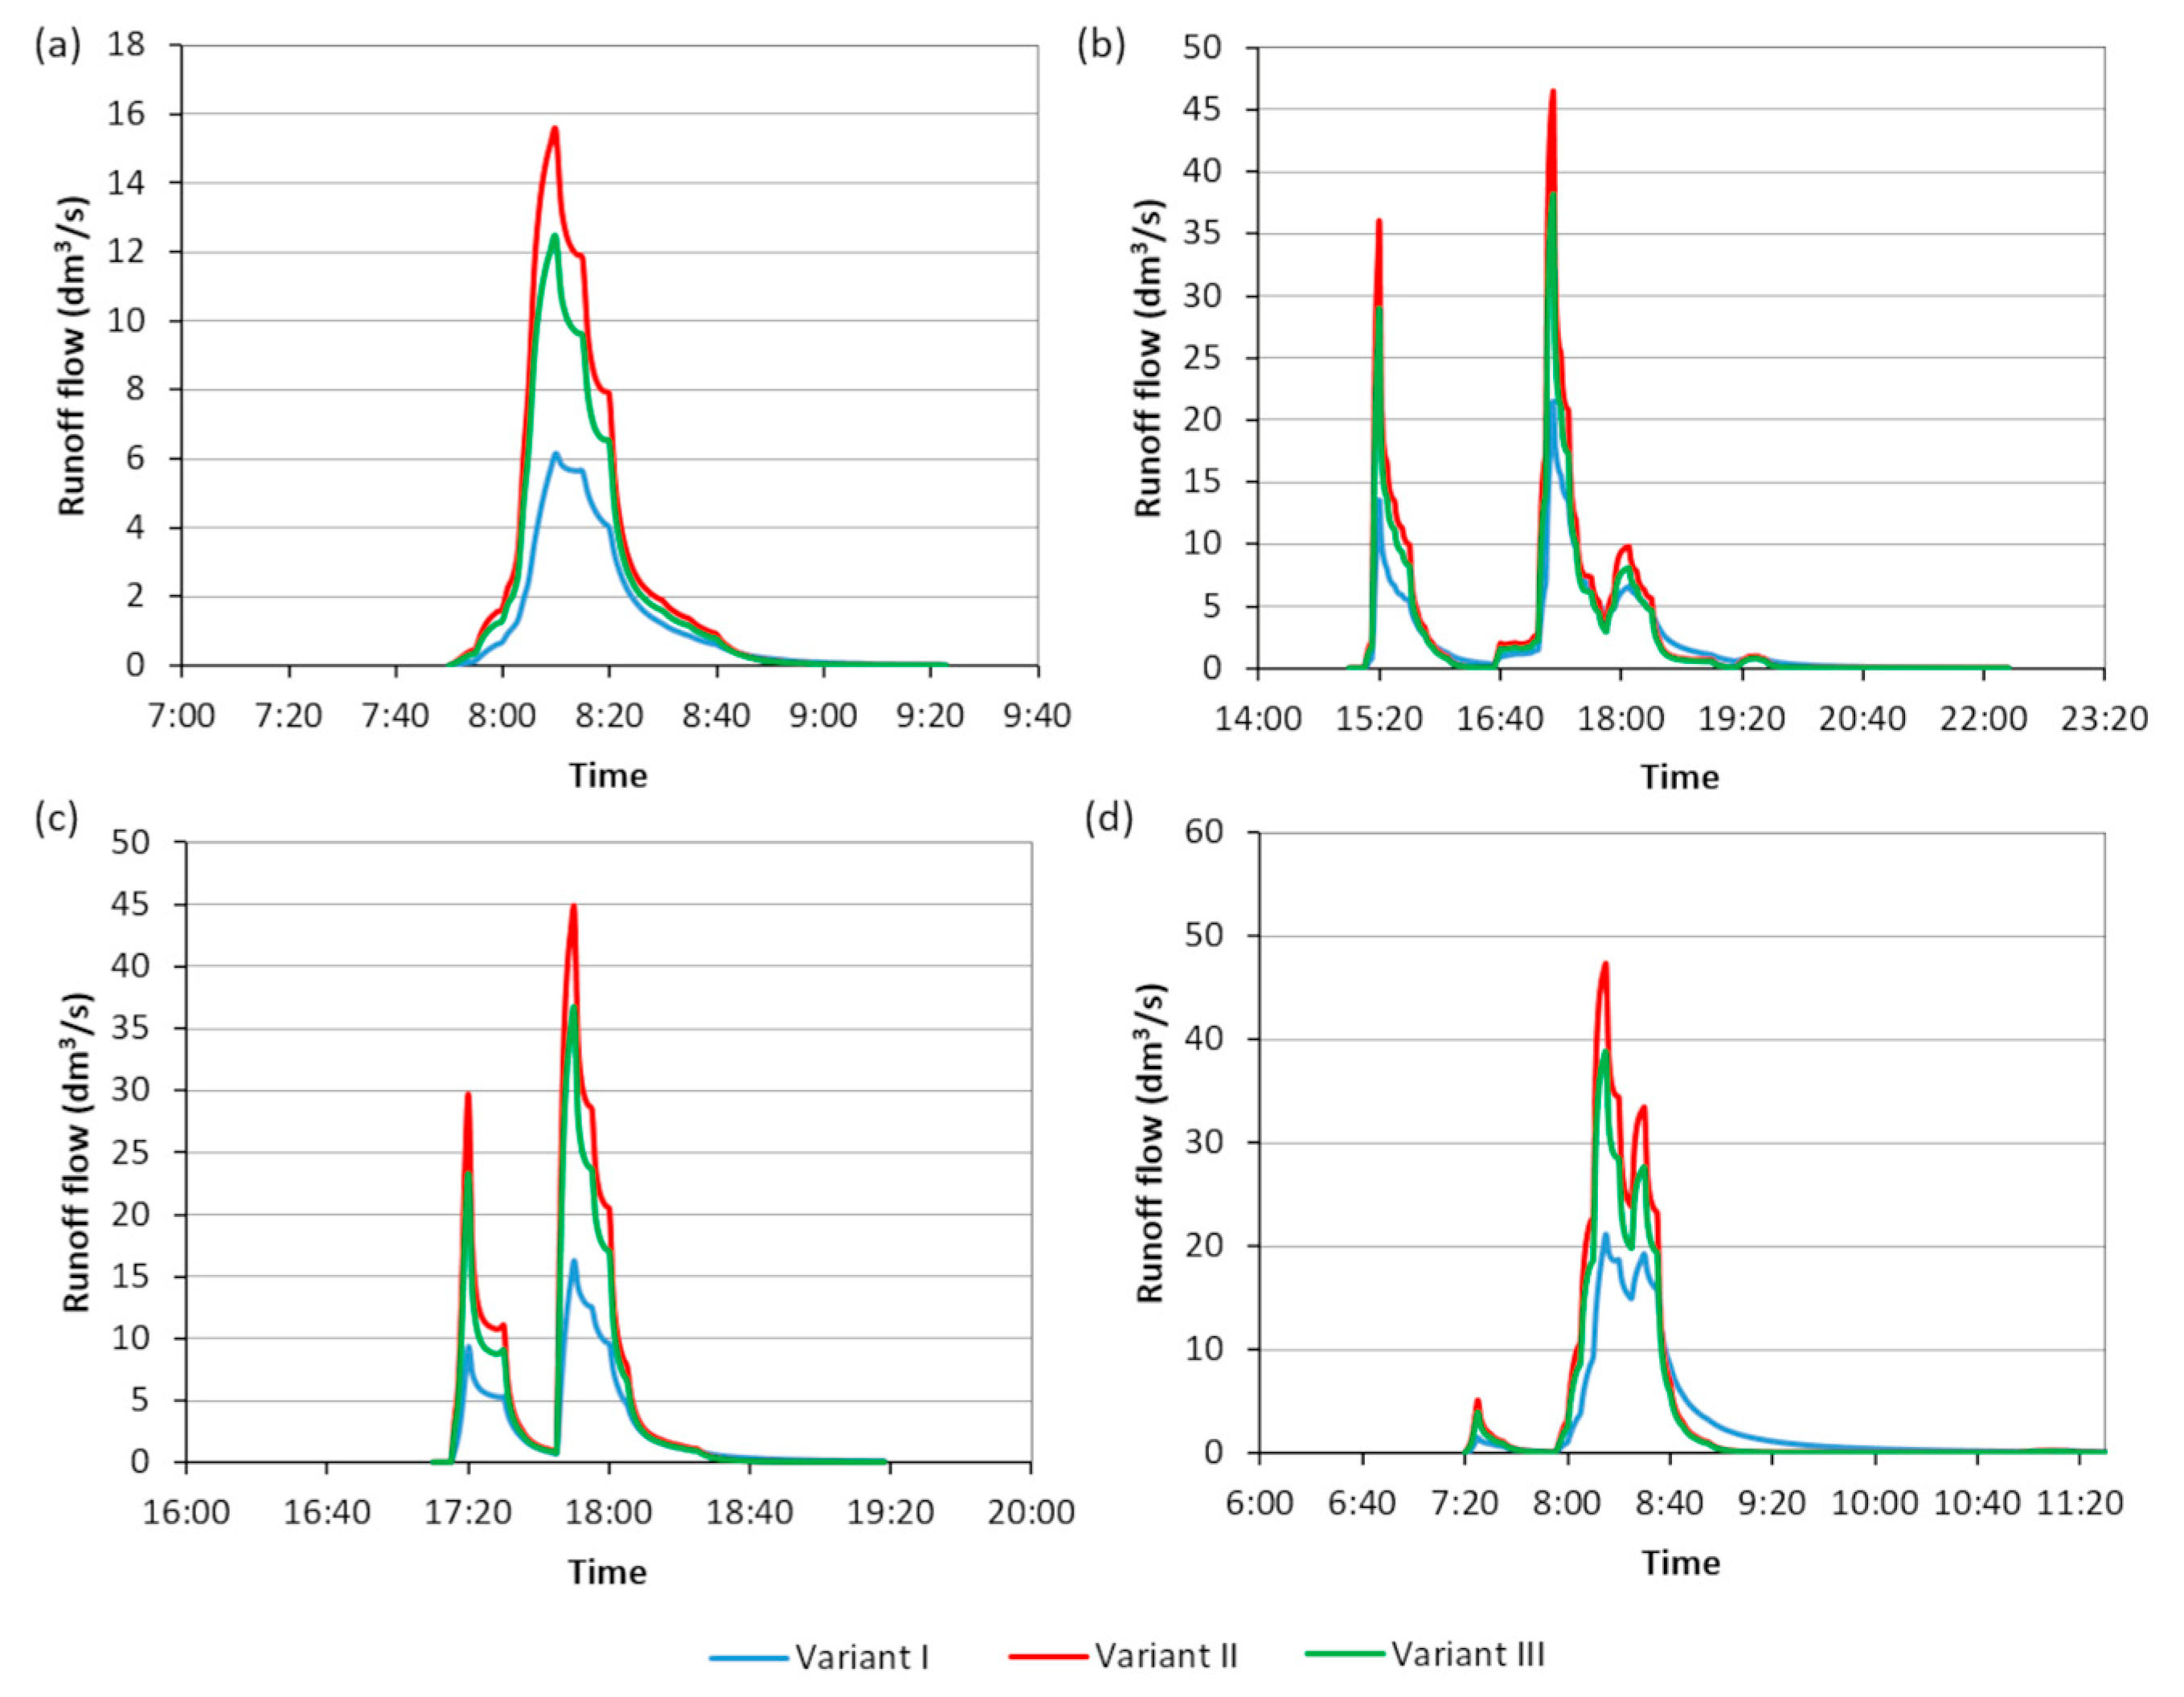
  • Revitalization of the tested historical squares in three cities in Poland, related to the significant increase in the paved area, clearly affected runoff generation for the modeled real weather conditions, resulting in an increase in runoff volume and peak flows;
  • The calculated increase in runoff volume after revitalization was in the range 78.2–90.9%, while the determined increase in runoff peak flows reached a level of 108–141.7%, which in turn may pose a significant threat to the existing rainwater drainage systems;
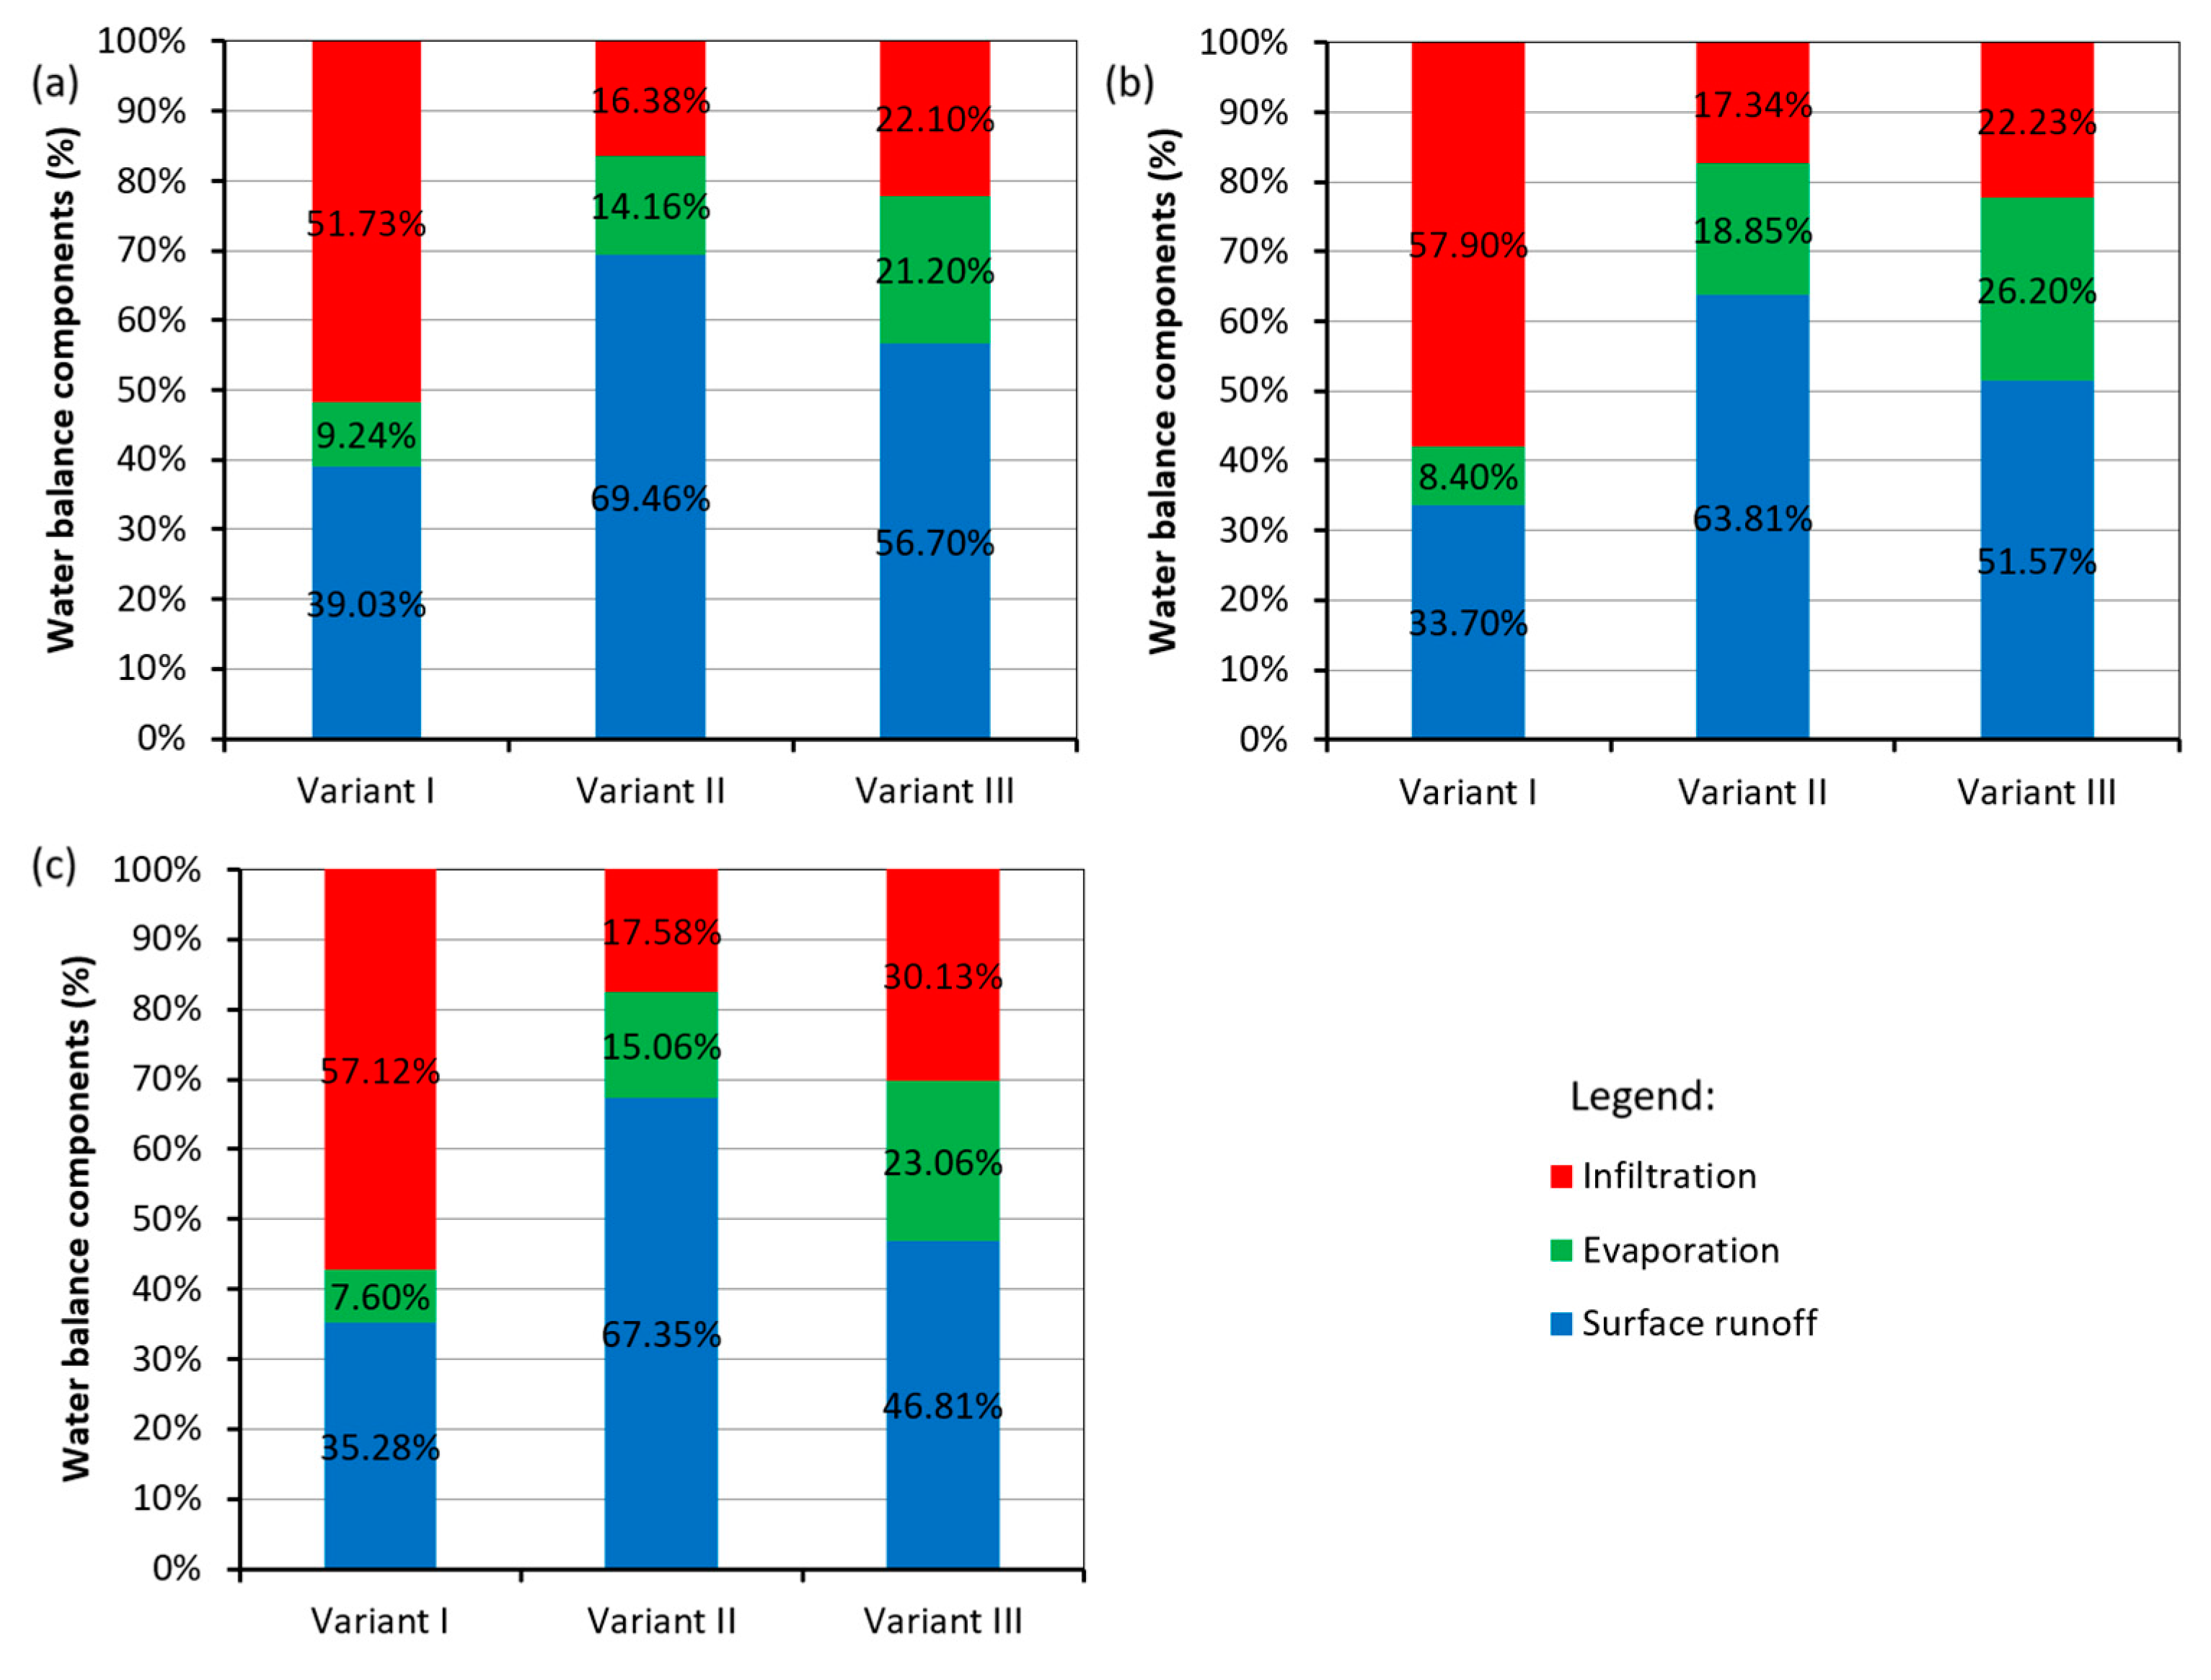
  • The observed increases in the simulated runoff characteristics and general components of the water balance were dependent on the range of revitalization and green area removal;
  • The designed rain gardens, as a green architecture measure, according to the results of the numerical modeling, allowed partial restoration of the disturbed water balance of the studied historical urban watersheds due to the reduction in runoff volume of 18.1–30.2% and the decrease in runoff peak flows of 17.9–32.0%;
  • The calculations of the water balance for the studied catchments after the rain garden installation showed also increases in infiltration and evaporation during the numerical simulation duration;
  • The performed statistical analysis of the obtained results showed that the observed differences in the runoff volumetric flow for all the tested variants of the rainwater management differed significantly;
  • The presented results were based on uncalibrated SWMM models; thus, the results should be treated as preliminary;
  • The presented results should be continued at different locations, for longer real weather periods and with the assumption of the variable application of several LID types.

Supplementary Materials

The following supporting information can be downloaded at: https://www.mdpi.com/article/10.3390/su17062527/s1, Figure S1: Methodology of modeling research; Table S1: Input data for stormwater runoff modeling; Table S2: Input data for infiltration modeling; Table S3: Rain garden modeling input data.

Author Contributions

Conceptualization, M.K.W. and A.M.-P.; methodology, M.K.W. and A.M.-P.; validation, M.K.W. and A.M.-P.; formal analysis, M.K.W. and A.M.-P.; investigation, M.K.W.; resources, A.M.-P. and M.K.W.; writing—original draft preparation, M.K.W. and A.M.-P.; writing—review and editing, M.K.W. and A.M.-P.; visualization, M.K.W. and A.M.-P. All authors have read and agreed to the published version of the manuscript.

Funding

This research was funded by internal projects of Lublin University of Technology, Poland, numbers FD-20/IS-6/024 and FD-20/IS-6/039.

Institutional Review Board Statement

Not applicable.

Informed Consent Statement

Not applicable.

Data Availability Statement

The data are available from the corresponding author upon reasonable request.

Conflicts of Interest

The authors declare no conflicts of interest. The funders had no role in the design of the study; in the collection, analyses or interpretation of data; in the writing of the manuscript, or in the decision to publish the results.

Abbreviations

The following abbreviations are used in this manuscript:
LIDLow-Impact Development
USA EPAEnvironmental Protection Agency
SWMMStorm Water Management Model
WMOWorld Meteorological Organization
LAILeaf Area Index

References

  1. Mencwel, J. Betonoza. Jak Niszczy Się Polskie Miasta; Krytyka Polityczna: Warszawa, Poland, 2020. (In Polish) [Google Scholar]
  2. Concrete in Cities—Why Did We Get Rid of Greenery in Cities? Available online: https://www.money.pl/gospodarka/betonoza-w-miastach-dlaczego-pozbylismy-sie-zieleni-z-miast-6808029991025152a (accessed on 24 January 2025). (In Polish).
  3. Betonoza is Harmful to Health. Available online: https://zdrowie.pap.pl/srodowisko/betonoza-szkodzi-zdrowiu (accessed on 24 January 2025). (In Polish).
  4. Urban Planner: “Concreting” Public Spaces Is a Passing Trend. Available online: https://samorzad.pap.pl/kategoria/aktualnosci/urbanistka-betonoza-przestrzeni-publicznej-mijajacy-trend (accessed on 24 January 2025). (In Polish).
  5. Betonoza—How Does the “Revitalization” of Polish Urban Space Harm Everyone Around? Available online: https://www.gazetakongresy.pl/betonoza-jak-rewitalizacja-polskiej-przestrzeni-miejskiej-szkodzi-wszystkim-wokol/ (accessed on 24 January 2025). (In Polish).
  6. Geoportal. Available online: https://www.geoportal.gov.pl/ (accessed on 24 January 2025). (In Polish)
  7. Geo-System. Available online: https://polska.e-mapa.net/ (accessed on 24 January 2025). (In Polish).
  8. Dymek, D.; Jóźwik, J. Kształtowanie placów miejskich na przykładzie miast województwa lubelskiego. Ann. UMCS Sec. B 2021, 76, 28. [Google Scholar] [CrossRef]
  9. Widomski, M.K.; Musz-Pomorska, A. Numerical assessment of ra-inwater management in historical central town square catchment with different surface sealing. Gaz Woda i Technika Sanitarna 2024, 9, 17–25. [Google Scholar] [CrossRef]
  10. Janucha-Szostak, A. Blue-green infrastructure as a tool for urban adaptation to climate change and rainwater management. Zesz. Nauk. Politech. Poznańskiej. Archit. Urban. Archit. Wnętrz 2020, 3, 37–74. (In Polish) [Google Scholar] [CrossRef]
  11. Janucha-Szostak, A.; Ogorzelska, A.; Peplińska, S. Modernization of the market squares of small and medium-sized towns facing the challenges of adaptation to climate change. Zesz. Nauk. Politech. Poznańskiej. Archit. Urban. Archit. Wnętrz 2023, 15, 243–260. (In Polish) [Google Scholar] [CrossRef]
  12. Bąk, J.; Barjenbruch, M. Benefits, Inconveniences, and Facilities of the Application of Rain Gardens in Urban Spaces from the Perspective of Climate Change—A Review. Water 2022, 14, 1153. [Google Scholar] [CrossRef]
  13. Boguniewicz-Zabłocka, J.; Capodaglio, A.G. Analysis of Alternatives for Sustainable Stormwater Management in Small Developments of Polish Urban Catchments. Sustainability 2020, 12, 10189. [Google Scholar] [CrossRef]
  14. Li, C.; Sun, N.; Lu, Y.; Guo, B.; Wang, Y.; Sun, X.; Yao, Y. Review on Urban Flood Risk Assessment. Sustainability 2023, 15, 765. [Google Scholar] [CrossRef]
  15. Serre, D.; Barroca, B.; Diab, Y. Urban Flood Mitigation: Sustainable Options. WIT Trans. Ecol. Environ. 2010, 129, 299–309. [Google Scholar] [CrossRef]
  16. Li, Z.; Wang, Z.; Wu, L.; Huang, W.; Peng, W. Evaluating the effect of building patterns on urban flooding based on a boosted regression tree: A case study of Beijing, China. Hydrol. Process. 2023, 37, e14932. [Google Scholar] [CrossRef]
  17. Kasprzyk, M.; Szpakowski, W.; Poznańska, E.; Boogaard, F.C.; Bobkowska, K.; Gajewska, M. Technical solutions and benefits of introducing rain gardens—Gdańsk case study. Sci. Total Environ. 2022, 835, 155487. [Google Scholar] [CrossRef]
  18. Toda, K. Urban Flooding and Measures. J. Disaster Res. 2007, 2, 143–152. [Google Scholar] [CrossRef]
  19. Singh, H.; Nielsen, M.; Greatrex, H. Causes, impacts, and mitigation strategies of urban pluvial floods in India: A systematic review. Int. J. Disaster Risk Reduct. 2023, 93, 103751. [Google Scholar] [CrossRef]
  20. Szeląg, B.; Suligowski, R.; De Paola, F.; Siwicki, P.; Majerek, D.; Łagód, G. Influence of urban catchment characteristics and rainfall origins on the phenomenon of stormwater flooding: Case study. Environ. Model. Soft. 2022, 150, 105335. [Google Scholar] [CrossRef]
  21. Fatone, F.; Szeląg, B.; Kiczko, A.; Majerek, D.; Majewska, M.; Drewnowski, J.; Łagód, G. Advanced sensitivity analysis of the impact of the temporal distribution and intensity of rainfall on hydrograph parameters in urban catchments. Hydrol. Earth Syst. Sci. 2021, 25, 5493–5516. [Google Scholar] [CrossRef]
  22. Pour, S.H.; Wahab, A.K.A.; Shahid, S.; Asaduzzaman, M.; Dewan, A. Low impact development techniques to mitigate the impacts of climate-change-induced urban floods: Current trends, issues and challenges. Sustain. Cities Soc. 2020, 62, 102373. [Google Scholar] [CrossRef]
  23. Venegas-Cordero, N.; Mediero, L.; Piniewski, M. Urbanization vs. climate drivers: Investigating changes in fluvial floods in Poland. Stoch. Environ. Res. Risk Assess. 2024, 38, 2841–2857. [Google Scholar] [CrossRef]
  24. Dawson, R.J.; Speight, L.; Hall, J.W.; Djordjevic, S.; Savic, D.; Leandro, J. Attribution of flood risk in urban areas. J. Hydroinform. 2008, 10, 275–288. [Google Scholar] [CrossRef]
  25. Torgersen, G.; Navrud, S. Singing in the rain: Valuing the economic benefits of avoiding insecurity from urban flooding. J. Flood Risk Manag. 2018, 11, e12338. [Google Scholar] [CrossRef]
  26. Prashar, N.; Lakra, H.S.; Rajib Shaw, R.; Kaur, H. Urban Flood Resilience: A comprehensive review of assessment methods, tools, and techniques to manage disaster. Prog. Disaster Sci. 2023, 20, 100299. [Google Scholar] [CrossRef]
  27. Atlas of the Effects of Extreme Phenomena in Poland, IOŚ-PIB. 2022. Available online: https://ios.edu.pl/raporty-i-analizy/zmiany-klimatu/atlas-skutkow-zjawisk-ekstremalnych/ (accessed on 24 January 2025). (In Polish).
  28. Concrete Cost Them Dearly. They Want to Change That, But Planting Trees Alone is Not Enough. Available online: https://spidersweb.pl/2024/08/betonoza-polskie-miasta-zielen.html (accessed on 24 January 2025). (In Polish).
  29. A Year Ago, We Started Our Campaign Odbetonowani. Available online: https://miastojestnasze.org/rok-temu-ruszyla-nasza-akcja-odbetonowani/ (accessed on 24 January 2025). (In Polish).
  30. Concrete is Out of Fashion. It’s Time for a Green Revolution. Available online: https://klimat.rp.pl/walka-o-klimat/art39493931-betonoza-jest-juz-niemodna-czas-na-zielona-rewolucje (accessed on 24 January 2025). (In Polish).
  31. The Fight Against “Betonoza” in Wrocław Continues. Available online: https://gazetawroclawska.pl/walka-z-betonoza-we-wroclawiu-trwa-place-bez-zieleni-zamienia-sie-w-parki-zobacz-ktore/ar/c1-18785221 (accessed on 24 January 2025). (In Polish).
  32. De-Concreting and Greening of Public Spaces in the City. Available online: https://www.gov.pl/web/nfosigw/odbetonowanie-i-zazielenienie-przestrzeni-publicznych-w-miescie (accessed on 24 January 2025). (In Polish)
  33. Protection and Restoration of Biological and Landscape Diversity. Available online: https://www.gov.pl/web/nfosigw/ochrona-i-przywracanie-roznorodnosci-biologicznej-i-krajobrazowej (accessed on 24 January 2025). (In Polish)
  34. Mehryar, S.; Surminski, S. Investigating flood resilience perceptions and supporting collective decision-making through fuzzy cognitive mapping. Sci. Total Environ. 2022, 837, 155854. [Google Scholar] [CrossRef]
  35. Zhu, S.; Li, D.; Feng, H.; Na Zhang, N. The influencing factors and mechanisms for urban flood resilience in China: From the perspective of social-economic-natural complex ecosystem. Ecol. Indic. 2023, 147, 109959. [Google Scholar] [CrossRef]
  36. Davis, A.P. Green engineering principles promote low-impact development. Environ. Sci. Technol. 2005, 39, 338A–344A. [Google Scholar] [CrossRef]
  37. Liu, H.; Wang, Y.; Zhang, C.; Chen, A.S.; Fu, G. Assessing real options in urban surface water flood risk management under climate change. Nat. Hazards 2018, 94, 1–18. [Google Scholar] [CrossRef]
  38. Nguyen, H.Q.; Radhakrishnan, M.; Bui, T.K.N.; Tran, D.D.; Ho, L.P.; Tong, V.T.; Huynh, L.T.; Chau, N.X.; Ngo, T.T.; Pathirana, A.; et al. Evaluation of retrofitting responses to urban flood risk in Ho Chi Minh City using the Motivation and Ability (MOTA) framework. Sustain. Cities Soc. 2019, 47, 101465. [Google Scholar] [CrossRef]
  39. Hettiarachchi, S.; Wasko, C.; Ashish Sharma, A. Rethinking urban storm water management through resilience—The case for using green infrastructure in our warming world. Cities 2022, 128, 103789. [Google Scholar] [CrossRef]
  40. Shafique, M.; Kim, R. Retrofitting the Low Impact Development practices into developed urban areas including barriers and potential solution. Open Geosci. 2017, 9, 240–254. [Google Scholar] [CrossRef]
  41. Zhang, L.; Ye, Z.; Shibata, S. Assessment of Rain Garden Effects for the Management of Urban Storm Runoff in Japan. Sustainability 2020, 12, 9982. [Google Scholar] [CrossRef]
  42. Du, S.; Wang, C.; Shen, J.; Wen, J.; Gao, J.; Wu, J.; Lin, W.; Xu, H. Mapping the capacity of concave green land in mitigating urban pluvial floods and its beneficiaries. Sustain. Cities Soc. 2019, 44, 774–782. [Google Scholar] [CrossRef]
  43. Kukadia, J.; Lundholm, M.; Russell, I. Designing Rain Gardens: A Practical Guide; Urban Design: London, UK, 2018; Available online: https://www.urbandesignlearning.com/resources/publications/details?recordId=recOcYos3UmeZ9PMw (accessed on 24 July 2024).
  44. Design Criteria for Bioretention—Minnesota Stormwater Manual. Available online: https://stormwater.pca.state.mn.us/index.php/Design_criteria_for_bioretention (accessed on 17 February 2025).
  45. Burszta-Adamiak, W.; Biniak-Pieróg, M.; Dąbek, P.B.; Sternik, A. Rain garden hydrological performance—Responses to real rainfall events. Sci. Total Environ. 2023, 887, 164153. [Google Scholar] [CrossRef]
  46. Sagrelius, P.Ö.; Blecken, G.; Hedström, A.; Ashley, R.; Viklander, M. Sustainability performance of bioretention systems with various designs. J. Environ. Manag. 2023, 34, 117949. [Google Scholar] [CrossRef]
  47. Ayutthaya, T.K.N.; Suropan, P.; Sundaranaga, C.; Phichetkunbodee, N.; Anambutr, R.; Suppakittpaisarn, P.; Rinchumphu, D. The influence of bioretention assets on outdoor thermal comfort in the urban area. Energy Rep. 2023, 9, 287–294. [Google Scholar] [CrossRef]
  48. Demuzere, M.; Orru, K.; Heidrich, O.; Olazabal, E.; Geneletti, D.; Orru, H.; Bhave, A.G.; Mittal, N.; Feliú, E.; Faehnle, M. Mitigating and adapting to climate change: Multi-functional and multi-scale assessment of green urban infrastructure. J. Environ. Manag. 2014, 146, 107–115. [Google Scholar] [CrossRef] [PubMed]
  49. Luo, H.; Guan, L.; Jing, Z.; He, B.; Cao, X.; Zhang, Z.; Tao, M. Performance Evaluation of Enhanced Bioretention Systems in Removing Dissolved Nutrients in Stormwater Runoff. Appl. Sci. 2020, 10, 3148. [Google Scholar] [CrossRef]
  50. Zhang, W.; Tao, K.; Sun, H.; Che, W. Influence of urban runoff pollutant first flush strength on bioretention pollutant removal performance. Water Sci. Technol. 2022, 86, 1478–1495. [Google Scholar] [CrossRef] [PubMed]
  51. Dobbie, M.F.; Farrelly, M.A. Using best-worst scaling to reveal preferences for retrofitting raingardens in suburban streets. Urban For. Urban Green. 2022, 74, 127619. [Google Scholar] [CrossRef]
  52. Siwiec, E.; Erlandsen, A.; Vennemo, H. City greening by rain gardens-costs and benefits. Environ. Prot. Nat. Resour. 2018, 29, 1–5. [Google Scholar] [CrossRef]
  53. Aerts, J.C.J.H. A Review of Cost Estimates for Flood Adaptation. Water 2018, 10, 1646. [Google Scholar] [CrossRef]
  54. Li, J.; Tao, T.; Kreidler, M.; Burian, S.; Yan, H. Construction Cost-Based Effectiveness Analysis of Green and Grey Infrastructure in Controlling Flood Inundation: A Case Study. J. Water Manag. Model. 2019, 27, C466. [Google Scholar] [CrossRef]
  55. Ramos, H.M.; Besharat, M. Urban Flood Risk and Economic Viability Analyses of a Smart Sustainable Drainage System. Sustainability 2021, 13, 13889. [Google Scholar] [CrossRef]
  56. Wilbers, G.J.; de Bruin, K.; Seifert-Dähnn, I.; Lekkerkerk, W.; Li, H.; Budding-Polo, B.M. Investing in Urban Blue–Green Infrastructure—Assessing the Costs and Benefits of Stormwater Management in a Peri-Urban Catchment in Oslo, Norway. Sustainability 2022, 14, 1934. [Google Scholar] [CrossRef]
  57. Funke, F.; Kleidorfer, M. Sensitivity of sustainable urban drainage systems to precipitation events and malfunctions. Blue-Green Syst. 2024, 6, 33–52. [Google Scholar] [CrossRef]
  58. Szpak, A.; Modrzyńska, J.; Piechowiak, J. Resilience of Polish cities and their rainwater management policies. Urban Clim. 2022, 44, 101228. [Google Scholar] [CrossRef]
  59. New Rain Gardens in the City. Available online: https://lublin.eu/mieszkancy/srodowisko/aktualnosci/nowe-ogrody-deszczowe-w-miescie,650,1945,1.html (accessed on 24 February 2025). (In Polish).
  60. Statistics Poland. Available online: https://bdl.stat.gov.pl/bdl/dane/podgrup/tablica (accessed on 24 January 2025). (In Polish)
  61. Wikimedia. Available online: https://commons.wikimedia.org/w/index.php?curid=17535419 (accessed on 24 January 2025). (In Polish).
  62. Lublin, City of Inspiration, Climate. Available online: https://lublin.eu/mieszkancy/srodowisko/srodowisko-przyrodnicze-lublina/klimat/ (accessed on 24 January 2025). (In Polish).
  63. Weather and Climate. Available online: https://meteomodel.pl/aktualne-dane-pomiarowe/?data=2023-02-01&rodzaj=da&wmoid=12495&dni=100&ord=desc (accessed on 24 January 2025). (In Polish).
  64. WMO Guidelines on the Calculation of Climate Normals, WMO-1203. Available online: https://community.wmo.int/en/activity-areas/climate-services/climate-products-and-initiatives/wmo-climatological-normals (accessed on 15 February 2025).
  65. Climate IMGW-PIB. Available online: https://klimat.imgw.pl/pl/climate-normals/TSR_AVE (accessed on 15 February 2025). (In Polish).
  66. The Parczew “Frying Pan” is Being Mocked in Poland. Available online: https://parczew.24wspolnota.pl/informacje-parczewskie/z-parczewskiej-patelni-nasmiewaja-sie-w-polsce/l586ar48AeSHyMeblRav (accessed on 24 January 2025). (In Polish).
  67. Parczew: Revitalization, or Total Felling. Available online: https://www.dziennikwschodni.pl/parczew/rewitalizacja-czyli-wycinka-totalna,n,1000243930.html (accessed on 24 January 2025). (In Polish).
  68. He Fried Scrambled Eggs on the Concreted Market Square II in Łęczna. Available online: https://tubalecznej.pl/informacje-leczynskie/usmazyl-jajecznice-na-zabetonowanym-rynku-ii-w-lecznej-pokaze-to-tvn-zdjecia/tELGgkSzRrjTRjz13aMj (accessed on 24 January 2025). (In Polish).
  69. Too Little Greenery on the Łęczna Market. They Appeal for Changes on the “Heat Island”. Available online: https://www.dziennikwschodni.pl/leczna/za-malo-zieleni-na-leczynskim-rynku-jest-petycja,n,1000347408.html (accessed on 24 January 2025). (In Polish).
  70. Flash Flood! Zamość Flooded After Storm. Available online: https://www.supertydzien.pl/galeria/3445,powodz-blyskawiczna-zamosc-zalany-po-burzy-zdjecia (accessed on 15 February 2025). (In Polish).
  71. Lublin After Heavy Rain and Hail. Flooded Streets, Broken Trees. Available online: https://kurierlubelski.pl/lublin-po-ulewie-i-gradobiciu-zalane-ulice-polamane-drzewa-zdjecia-wideo/ar/3532931 (accessed on 15 February 2025). (In Polish).
  72. Lublin Firefighters Summed Up Interventions After the Storm Front Passed. Available online: https://www.lublin112.pl/lubelscy-strazacy-podsumowali-interwencje-po-przejsciu-frontu-burzowego-zdjecia/ (accessed on 15 February 2025). (In Polish).
  73. It Took Only 10 Minutes for Szczebrzeszyn to be Under Water. Available online: https://www.kronikatygodnia.pl/artykul/42589,wystarczylo-10-minut-aby-szczebrzeszyn-znalazl-sie-pod-woda-zdjecia (accessed on 15 February 2025). (In Polish).
  74. Flooded Properties and Buildings, Fallen Trees. Large-Scale Water Pumping is Underway in Lublin and Its Surroundings. Available online: https://www.lublin112.pl/zalane-posesje-i-budynki-powalone-drzewa-w-lublinie-i-okolicach-trwa-wielkie-pompowanie-wody-zdjecia/ (accessed on 15 February 2025). (In Polish).
  75. Gündel, H.; Önaç, A.K. Simulating blue and green infrastructure tools via SWMM in order to prevent flood hazard in an urban area. Nat. Hazards 2025, 121, 1885–1909. [Google Scholar] [CrossRef]
  76. Barszcz, M. Influence of Applying Infiltration and Retention Objects to the Rainwater Runoff on a Plot and Catchment Scale—Case Study of Służewiecki Stream Subcatchment in Warsaw. Pol. J. Environ. Stud. 2015, 24, 57–65. [Google Scholar] [CrossRef] [PubMed]
  77. Bai, Y.; Zhao, N.; Zhang, R.; Zeng, X. Storm Water Management of Low Impact Development in Urban Areas Based on SWMM. Water 2019, 11, 33. [Google Scholar] [CrossRef]
  78. Dai, Y.; Jiang, J.; Gu, X.; Zhao, Y.; Ni, F. Sustainable Urban Street Comprising Permeable Pavement and Bioretention Facilities: A Practice. Sustainability 2020, 12, 8288. [Google Scholar] [CrossRef]
  79. Musz-Pomorska, A.; Widomski, M.K. Analysis of the impact of the degree of catchment sealing on the operation of drainage system. Appl. Water Sci. 2022, 12, 253. [Google Scholar] [CrossRef]
  80. Widomski, M.K.; Musz-Pomorska, A.; Gołębiowska, J. Hydrologic Effectiveness and Economic Efficiency of Green Architecture in Selected Urbanized Catchment. Land 2023, 12, 1312. [Google Scholar] [CrossRef]
  81. Scott, J.; Garner, B.; Hidalgo, D.; Daoularis, D.; Warmerdam, O. Insights into green roof modeling using SWMM LID controls for detention-based designs. J. Water Manag. Model. 2022, 30, C484. [Google Scholar] [CrossRef]
  82. Szeląg, B.; Łagód, G.; Musz-Pomorska, A.; Widomski, M.K.; Stránský, D.; Sokáč, M.; Pokrývková, J.; Babko, R. Development of Rainfall-Runoff Models for Sustainable Stormwater Management in Urbanized Catchments. Water 2022, 14, 1997. [Google Scholar] [CrossRef]
  83. Lisenbee, W.A.; Hathaway, J.M.; Winston, R.J. Modeling bioretention hydrology: Quantifying the performance of DRAINMOD-Urban and the SWMM LID module. J. Hydrol. 2022, 612 Pt B, 128179. [Google Scholar] [CrossRef]
  84. Frias, R.A.; Maniquiz-Redillas, M. Modelling the applicability of Low Impact Development (LID) technologies in a university campus in the Philippines using Storm Water Management Model (SWMM). IOP Conf. Ser. Mater. Sci. Eng. 2021, 1153, 012009. [Google Scholar] [CrossRef]
  85. Yang, W.; Brüggemann, K.; Seguya, K.D.; Ahmed, E.; Thomas Kaeseberg, T.; Dai, H.; Hua, P.; Zhang, J.; Krebs, P. Measuring performance of low impact development practices for the surface runoff management. Environ. Sci. Ecotechnol. 2020, 1, 100010. [Google Scholar] [CrossRef] [PubMed]
  86. Yazdi, M.N.; Ketabchy, M.; Sample, D.J.; Scott, D.; Liao, H. An evaluation of HSPF and SWMM for simulating streamflow regimes in an urban watershed. Environ. Model. Softw. 2019, 118, 211–225. [Google Scholar] [CrossRef]
  87. Rossman, L.A. Storm Water Management Model User’s Manual Version 5.0; National Risk Management Research Laboratory; Office of Research and Development; U.S. Environmental Protection Agency: Washington, DC, USA, 2009.
  88. Schmitt, T.; Thomas, M.; Ettrich, N. Analysis and modeling of flooding in urban drainage systems. J. Hydrol. 2004, 3–4, 300–311. [Google Scholar] [CrossRef]
  89. Villarini, G.; Smith, J.A.; Baeck, M.L.; Sturdevant-Rees, P.; Krajewski, W.F. Radar analyses of extreme rainfall and flooding in urban drainage basins. J. Hydrol. 2010, 3–4, 266–286. [Google Scholar] [CrossRef]
  90. Pit, R. Infiltration Through Disturbed Urban Soils and Compost—Amended Soil Effects on Runoff Quality and Quantity; United States Environmental Protection Agency: Washington, DC, USA, 1999.
  91. Słyś, D.; Stec, A. Hydrodynamic modeling of the combined sewage stystem for the city of Przemyśl. Environ. Prot. Eng. 2012, 4, 99–112. [Google Scholar] [CrossRef]
  92. Hamilton, G.W.; Waddington, D.V. Infiltration rates on residential lawns in central Pennsylvania. J. Soil Water Conserv. 1999, 54, 564–568. [Google Scholar]
  93. Rammal, M.; Berthier, E. Runoff Losses on Urban Surfaces during Frequent Rainfall Events: A Review of Observations and Modeling Attempts. Water 2020, 12, 2777. [Google Scholar] [CrossRef]
  94. Boogaard, F.; Lucke, T. Long-Term Infiltration Performance Evaluation of Dutch Permeable Pavements Using the Full-Scale Infiltration Method. Water 2019, 11, 320. [Google Scholar] [CrossRef]
  95. Parnas, F.E.Å.; Abdalla, E.M.H.; Tone, M. Muthanna; Evaluating three commonly used infiltration methods for permeable surfaces in urban areas using the SWMM and STORM. Hydrol. Res. 2021, 52, 160–175. [Google Scholar] [CrossRef]
  96. Yang, Y.; Shao, Z.; Xu, X.; Liu, D. Impact of Storm Characteristics on Infiltration Dynamics in Sponge Cities Using SWMM. Water 2023, 15, 3367. [Google Scholar] [CrossRef]
  97. Aquatic Plants. Available online: https://wodne-rosliny.pl/zestawy-roslin/rosliny-ogrod-deszczowy-typ-mieszany-mix-roslin- (accessed on 24 January 2025). (In Polish).
  98. Geology-Polish Geological Institute. Available online: https://geologia.pgi.gov.pl/mapy/ (accessed on 24 January 2025). (In Polish)
  99. Boughton. Available online: https://www.boughton.co.uk/products/green-roof-substrates/boughton-ex-1/ (accessed on 24 January 2025).
  100. Królikowska, J.; Królikowski, A. Rainwater. Drainage, Management, Purification and Use; Seidel-Przywecki: Józefosław, Poland, 2012; pp. 146–157. (In Polish) [Google Scholar]
  101. Rezaei, A.R.; Ismail, Z.; Niksokhan, M.H.; Dayarian, M.A.; Ramli, A.H.; Shirazi, S.M. A Quantity–Quality Model to Assess the Effects of Source Control Stormwater Management on Hydrology and Water Quality at the Catchment Scale. Water 2019, 11, 1415. [Google Scholar] [CrossRef]
  102. Peng, J.; Zhao, H.; Luo, Z.; Jie Ouyang, J.; Yu, L. A new approach for sensitivity analysis of the StormWater Management Model applied in an airport. Water Sci. Technol. 2023, 88, 2453–2464. [Google Scholar] [CrossRef] [PubMed]
  103. Mehri, M.; Shahdany, S.M.H.; Javadi, S.; Movahedinia, M.; Berndtsson, R. Block-scale use of bioretention cells to restore the urban water balance: A case study in Tehran metropolis. J. Hydrol. Reg. Stud. 2024, 51, 101621. [Google Scholar] [CrossRef]
  104. Goncalves, M.L.R.; Zischg, J.; Rau, S.; Sitzmann, M.; Rauch, W.; Kleidorfer, M. Modeling the Effects of Introducing Low Impact Development in a Tropical City: A Case Study from Joinville, Brazil. Sustainability 2018, 10, 728. [Google Scholar] [CrossRef]
  105. Fassman-Beck, E.; Saleh, F. Sources and Impacts of Uncertainty in Uncalibrated Bioretention Models Using SWMM 5.1.012. J. Sustain. Water Built. Environ. 2021, 7, 04021006. [Google Scholar] [CrossRef]
  106. Ballinas-González, H.A.; Alcocer-Yamanaka, V.H.; Canto-Rios, J.J.; Simuta-Champo, R. Sensitivity Analysis of the Rainfall–Runoff Modeling Parameters in Data-Scarce Urban Catchment. Hydrology 2020, 7, 73. [Google Scholar] [CrossRef]
  107. Yao, L.; Wei, W.; Chen, L. How does imperviousness impact the urban rainfall-runoff process under various storm cases? Ecol. Indic. 2016, 60, 893–905. [Google Scholar] [CrossRef]
  108. Yao, L.; Chen, L.; Wei, W. Assessing the effectiveness of imperviousness on stormwater runoff in micro urban catchments by model simulation. Hydrol. Process. 2016, 30, 1836–1848. [Google Scholar] [CrossRef]
  109. Ahiablame, L.; Shakya, R. Modeling flood reduction effects of low impact development at a watershed scale. J. Environ. Manag. 2016, 171, 81–91. [Google Scholar] [CrossRef] [PubMed]
  110. Tredway, J.C.; Havlick, D.G. Assessing the Potential of Low-Impact Development Techniques on Runoff and Streamflow in the Templeton Gap Watershed, Colorado. Prof. Geogr. 2016, 69, 372–382. [Google Scholar] [CrossRef]
Figure 1. Example of revitalization related to overuse of concrete; the central square in Bartoszyce: (a) before revitalization; (b) after revitalization [6,7].
Sustainability 17 02527 g001
Figure 2. Range of main square revitalization in selected towns of Lublin Voivodeship, Poland; data from Ref. [8]: (a) before revitalization; (b) after revitalization.
Sustainability 17 02527 g002
Figure 3. Location of Leczna, Parczew and Szczebrzeszyn in Lublin Voivodeship and in Poland, modified from Ref. [61].
Sustainability 17 02527 g003
Figure 4. Monthly average weather data for Lublin for period 1991–2020; data from Ref. [65].
Sustainability 17 02527 g004
Figure 5. Studied central squares of cities in Lublin Voivodeship, Poland: (a) Leczna; (b) Parczew; (c) Szczebrzeszyn.
Sustainability 17 02527 g005
Figure 6. Results of revitalization works in studied basins, surface sealing area in (m2): (a) Leczna; (b) Parczew; (c) Szczebrzeszyn; data from Refs. [6,7].
Sustainability 17 02527 g006
Figure 7. Rynek II Square in Leczna: (a) before revitalization; (b) after revitalization [6,7].
Sustainability 17 02527 g007
Figure 8. Rynek Square in Parczew: (a) before revitalization; (b) after revitalization [6,7].
Sustainability 17 02527 g008
Figure 9. Rynek Square in Szczebrzeszyn: (a) before revitalization; (b) after revitalization [6,7].
Sustainability 17 02527 g009
Figure 10. Weather conditions in the period 1 June–31 August 2024 applied to numerical modeling: (a) daily precipitation; (b) minimum and maximum air temperature, mean wind speed.
Sustainability 17 02527 g010
Figure 11. Hyetographs of selected rainfall events from the modeled period 1 June–31 August 2024: (a) Rainfall 1: 10 June 07:45–08:25; (b) Rainfall 2: 10 June 15:10–19:15; (c) Rainfall 3: 14 July 04:50–10:55; (d) Rainfall 4: 19 August 17:15–18:10.
Sustainability 17 02527 g011
Figure 12. Developed SWMM model for Rynek II Square, Leczna, Poland: (a) before revitalization; (b) after revitalization.
Sustainability 17 02527 g012
Figure 13. Developed SWMM model for Rynek Square, Parczew, Poland: (a) before revitalization; (b) after revitalization.
Sustainability 17 02527 g013
Figure 14. Developed SWMM model for Rynek Square, Szczebrzeszyn, Poland: (a) before revitalization; (b) after revitalization.
Sustainability 17 02527 g014
Figure 15. Construction scheme of the assumed rain gardens [48,49].
Sustainability 17 02527 g015
Figure 16. Scheme of assumed rain garden arrangement (not to scale): (a) Leczna catchment; (b) Parczew catchment; (c) Szczebrzeszyn catchment.
Sustainability 17 02527 g016
Figure 17. Calculated surface runoff characteristics for three tested urban catchments: (a) runoff coefficient (−); (b) runoff volume (m3); (c) runoff peak flows (dm3/s).
Sustainability 17 02527 g017
Figure 18. Runoff hydrographs for Leczna Rynek II catchment calculated for the selected rainfall events from the modeled period 1 June–31 August 2024: (a) Rainfall 1: 10 June 07:45–08:25; (b) Rainfall 2: 10 June 15:10–19:15; (c) Rainfall 3: 14 July 04:50–10:55; (d) Rainfall 4: 19 August 17:15–18:10.
Sustainability 17 02527 g018
Figure 19. Runoff hydrographs for Parczew Rynek I square catchment calculated for the selected rainfall events from the modeled period 1 June–31 August 2024: (a) Rainfall 1: 10 June 07:45–08:25; (b) Rainfall 2: 10 June 15:10–19:15; (c) Rainfall 3: 14 July 04:50–10:55; (d) Rainfall 4: 19 August 17:15–18:10.
Sustainability 17 02527 g019
Figure 20. Runoff hydrographs for Szczebrzeszyn Rynek I square catchment calculated for the selected rainfall events from the modeled period 1 June–31 August 2024: (a) Rainfall 1: 10 June 07:45–08:25; (b) Rainfall 2: 10 June 15:10–19:15; (c) Rainfall 3: 14 July 04:50–10:55; (d) Rainfall 4: 19 August 17:15–18:10.
Sustainability 17 02527 g020
Figure 21. Calculated components of water balance for all studied catchments and tested variants of rainwater management: (a) Leczna catchment; (b) Parczew catchment; (c) Szczebrzeszyn catchment.
Sustainability 17 02527 g021
Table 1. Model sensitivity coefficient values calculated for runoff volume and peak flows in all studied watersheds.
CatchmentOutputBefore RevitalizationAfter Revitalization
N ImpervN PervN ImpervN Perv
LecznaRunoff volume−0.00608−0.01283−0.0043−0.00134
Runoff peak flow−0.08573−0.00993−0.0265−0.01723
ParczewRunoff volume−0.00768−0.00204−0.00491−0.00171
Runoff peak flow−0.0988−0.00694−0.04127−0.02565
SzczebrzeszynRunoff volume−0.01025−0.00221−0.00725−0.00209
Runoff peak flow−0.1408−0.00593−0.09317−0.03152
Disclaimer/Publisher’s Note: The statements, opinions and data contained in all publications are solely those of the individual author(s) and contributor(s) and not of MDPI and/or the editor(s). MDPI and/or the editor(s) disclaim responsibility for any injury to people or property resulting from any ideas, methods, instructions or products referred to in the content.

