1. Introduction
Rice is the most crucial staple food globally, nourishing more people than any other crop, and is cultivated across millions of hectares throughout South and Southeast Asia. Unlike other crops, rice thrives in waterlogged conditions, which makes it unique. However, due to the anaerobic conditions in which it is cultivated, rice contributes to global warming by emitting methane into the atmosphere. It has long been established that methane emissions from paddy fields significantly contribute to greenhouse gas emissions from anthropogenic sources [
1,
2]. Over the past 50 years, there has been an unprecedented 40 percent increase in the global rice cultivation area. Methane (CH
4) is a prominent greenhouse gas (GHG) within the atmosphere. According to the Inter-governmental Panel on Climate Change (IPCC), using 100-year global warming potentials, methane’s warming potential is estimated to be 25 to 30 times greater than that of CO
2 per unit of weight [
3,
4,
5].
Methane emissions from rice fields in South and Southeast Asia are expected to increase, contributing 10–15 percent of global CH
4 emissions, with annual estimates ranging from 50 to 100 Tg of methane [
6,
7]. This could result in a 36 percent rise in methane emissions from rice production. Flooded rice fields are the third largest agricultural source of methane emissions, accounting for 10 to 30 percent globally from anaerobic decomposition [
8,
9,
10]. In contrast, upland paddy fields, which are not flooded, constitute about 15 percent of the total global rice cultivation area of 150 million hectares (Mha) [
11,
12,
13]. The remaining 127 Mha includes other types of rice fields primarily in Asia, with India alone accounting for 42.2 Mha [
14,
15,
16].
Crop residue burning is a significant environmental issue globally, with India facing a more severe problem, particularly in its central and northern regions due to specific weather and topographic conditions [
17,
18,
19,
20,
21]. The drive for agricultural mechanization, aimed at boosting crop productivity and reducing labor costs to meet the food security needs of its rapidly growing population, is a major factor contributing to stubble burning [
22,
23,
24,
25]. India’s projected population growth from 1.3 billion in 2015 to 1.7 billion by 2050 requires sustainable increases in crop productivity, intensity, and yield, driving agricultural mechanization [
26]. This leads to a significant amount of rice residues, which, when burned, have the potential to emit large quantities of pollutants.
Traditionally, farmers manually collected crop residue to feed livestock. However, with the mechanization of Indian agriculture, the use of combine harvesters leaves behind root-bound and scattered crop residues that are labor-intensive and costly to remove, leading to the burning of these residues [
27]. Researchers estimate that in Punjab and Haryana, 90% of rice residues from areas harvested by combine harvesters are burned, leading to the seasonal degradation of regional air quality [
28]. Agricultural crop residue burning contributes to the emission of greenhouse gases (CO
2, N
2O, CH
4), other pollutants (CO, NH
3, NO
x, SO
2, NMHC, VOCs), particulate matter, and smoke, directly impacting global warming and public health [
29,
30,
31,
32]. Mapping the burnt areas involves identifying and outlining fire scars using spectral signatures from sensors on ground, aerial, or satellite platforms. Satellite data are vital for assessing the severity of burns, delivering quick spectral measurements that enable the precise and timely mapping of burn-damaged areas [
33,
34,
35], and numerous studies have assessed and mapped stubble burning using satellite data, highlighting various challenges from around the world [
36,
37,
38].
Therefore, it is imperative to comprehensively study the mechanisms and spatiotemporal patterns of methane emissions from rice fields globally and regionally. Extensive global estimation and monitoring of methane emissions are conducted to grasp their significant contribution to greenhouse gases and to formulate effective management strategies. Based on previous research recommendations, methane emissions from irrigated rice fields in major rice-producing countries such as China, India, Bangladesh, Indonesia, and Thailand were estimated at 7.41, 3.99, 0.47, 1.28, and 0.18 Tg annually, respectively [
39]. Conventional methods for estimating methane emissions for larger areas are tedious, time-consuming, and laborious, and have become impractical [
40,
41,
42,
43]. These constraints warrant the use of more scientific methods through remote sensing. The emissions from the rice fields have been estimated using geospatial technology by integrating it with secondary data. For example, Qian et al. (2023) conducted a comprehensive review of greenhouse gas emissions and mitigation strategies in rice agriculture, emphasizing the need for region-specific interventions to reduce methane emissions [
44]. Additionally, Pazhanivelan et al. (2024) assessed methane emissions from rice fields using satellite-derived land surface temperature data, providing new insights into the spatial patterns of emissions and their drivers [
45]. While the above studies have significantly advanced the mapping of burn areas and the understanding of spatial emission patterns, our study introduces a novel approach by emphasizing the temporal dimension, specifically identifying burn dates and mapping rice residue burn pixels.
This study focuses on mapping rice residue burn areas and their dates while estimating the greenhouse gas (GHG) emissions associated with residue burning and rice cultivation. By using Sentinel-2 satellite imagery, machine learning algorithms, and ground truth data, we analyzed changes in rice cultivation patterns before and after the Kaleshwaram irrigation intervention. The Near-Infrared Region (NIR) band was instrumental in accurately identifying residue burn areas and burn dates, enabling timely alerts for decision-makers to act. Detailed quantifications of CO2, CH4, and N2O emissions from crop residue burning, alongside methane emissions from rice cultivation, highlight the significant contribution of these practices to overall GHG emissions. This research not only reveals the dual challenges of residue burning and methane emissions but also emphasizes the importance of integrating precise burn date monitoring with emission data. The findings provide a strong foundation for implementing sustainable crop residue management strategies and developing informed policies to mitigate the adverse environmental effects of rice farming.
2. Materials and Methods
2.1. Study Area
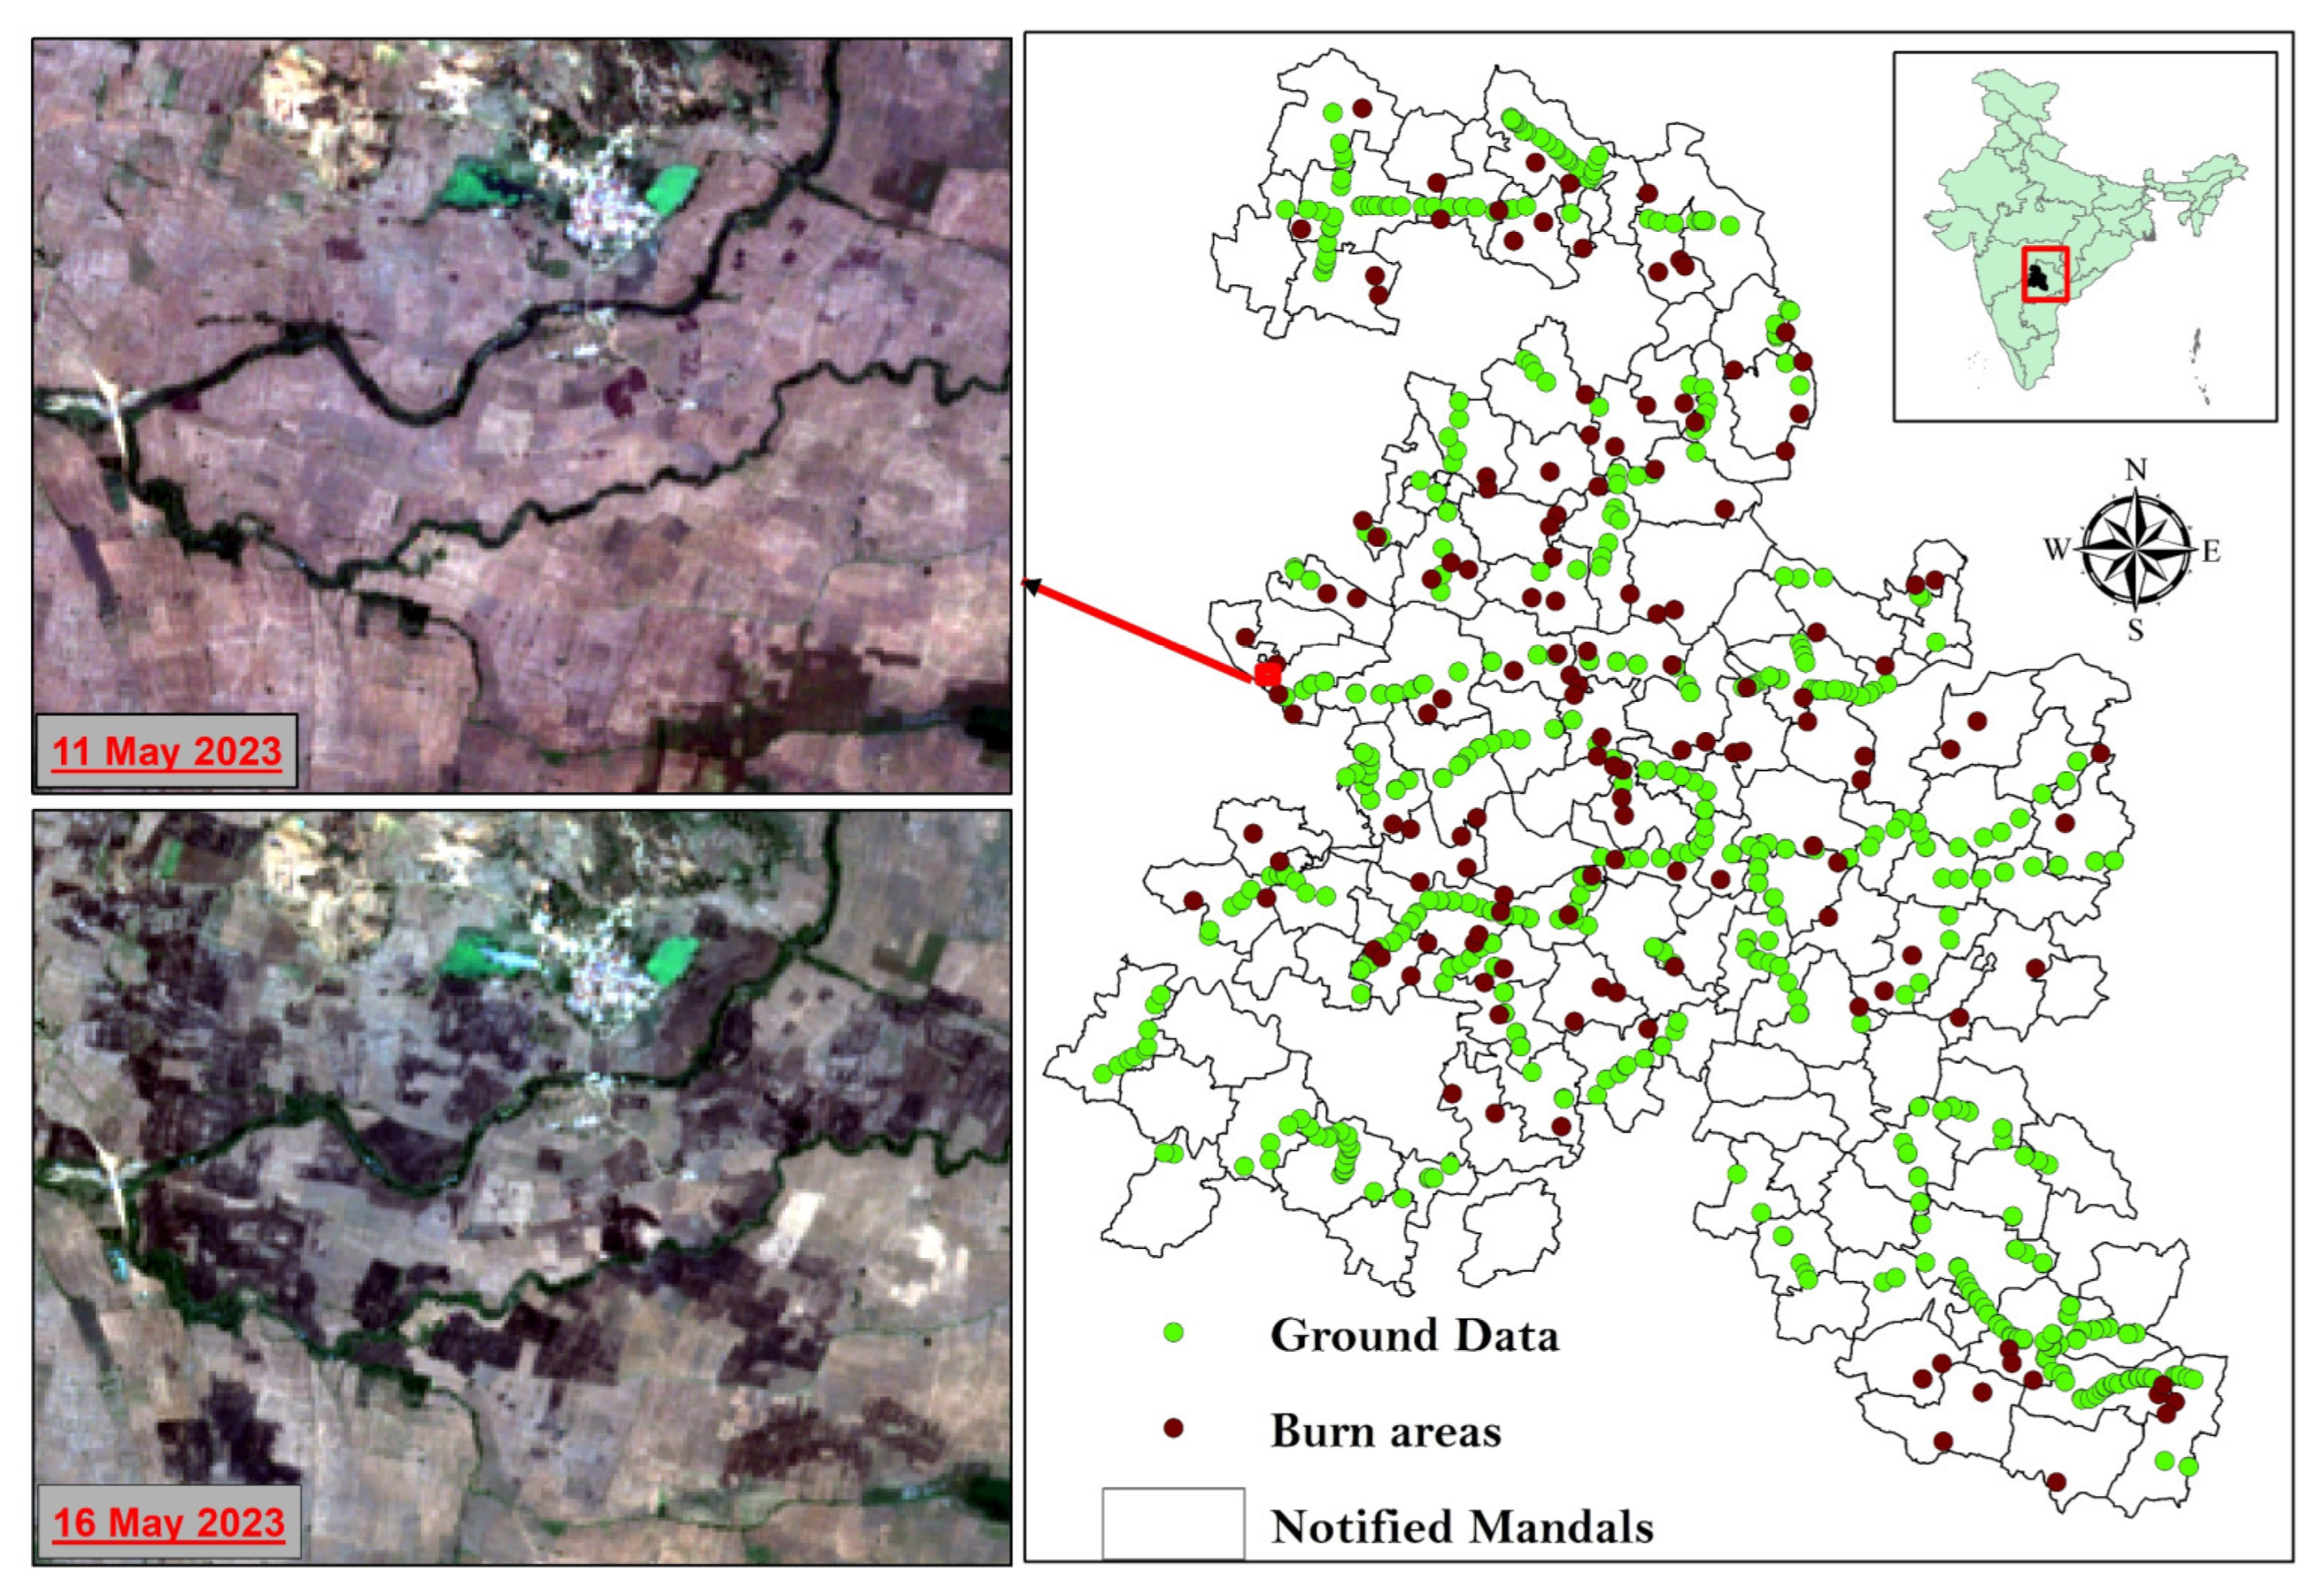
Telangana, located in southern India, ranks as the 12th largest state in terms of both geographical area and population. It is positioned between 15°46′ and 19°47′ N latitude and 77°16′ and 81°43′ E longitude. The state is bordered by Maharashtra to the north and northwest, Karnataka to the west, Chhattisgarh to the northeast, and Andhra Pradesh to the south and east (
Figure 1). Situated on the Deccan Plateau in a semi-arid zone, Telangana receives an average annual rainfall of 713 mm, which can range from 700 mm to 1500 mm. The southwest monsoon accounts for about 80% of this rainfall, with the remaining 20% coming from the northeast monsoon [
46]. Telangana experiences a tropical climate, with slight variations influenced by elevation and maritime factors. Rainfall patterns significantly influence the cropping patterns adopted by farmers in the region.
Telangana boasts a diverse agricultural landscape, with crops cultivated during both the Kharif (monsoon) and Rabi (winter) seasons. In irrigated regions during Kharif, major crops such as paddy (rice), maize, cotton, and soybeans flourish due to irrigation water availability. In contrast, rainfed areas primarily grow millets and pulses, leveraging natural monsoon rainfall. Telangana is traversed by several rivers, including the major interstate river basins of Godavari and Krishna. The Kaleshwaram Lift Irrigation Project (KLIP), the world’s largest multi-stage lift irrigation initiative, aims to irrigate approximately 1.875 million hectares of drought-prone land across 13 districts in Telangana. The KLIP comprises 7 links, 28 segments, and an extensive canal network spanning over 1800 km. This project is designed to boost agricultural potential and water supply in the region, benefiting 118 Mandals/blocks as per the Telangana government’s notification.
2.2. Sentinel-2 Data
Sentinel-2 surface reflectance data, accessed via Google Earth Engine (GEE), is ideal for detailed vegetation monitoring and identifying burn areas. This study used 10 m resolution images, available every 6 days, and cloud cover was filtered using the ’Cloud pixel percentage’ command, taking the maximum NDVI. The NDVI was derived from the Red and NIR bands, and a maximum value composite (MVC) was created for each month. The resulting 12 images were stacked into a data cube from November to May for crop type classification, and further Red, Green, Blue, and NIR bands were used for identifying burn areas.
2.3. Ground Data
In March 2023, ground data for crop identification were gathered from 594 sample points throughout the study area (
Figure 2). This data collection process involved the use of pre-classified outputs and Google Earth imagery accessed via the iCrops mobile application. Specific details from various locations were collected for training, including class identification and labeling. The dataset comprised geographical coordinates, land use categories, land cover percentages, seasonal cropping patterns (derived from farmer interviews), crop types, and irrigation methods (either irrigated or rainfed). Independent data, not utilized for training, were used for accuracy assessments. The ground data covered a range of crop types, including rice, maize, and millet, as well as other land use and land cover categories.
Following the Rabi season, primarily between March and June 2023, areas of crop residue burning were identified using Sentinel-2 RGB imagery, and ground points were collected. These samples were utilized to establish the threshold for identifying crop residue burn areas.
2.4. Class Identification and Length of Growing Periods Using Satellite Imagery and Ground Data
This study utilized a methodology for mapping crop types that integrated remote sensing techniques in Google Earth Engine (GEE) with traditional ground truthing for precise classification and labeling (
Figure 3). Sentinel-2 satellite imagery was employed within GEE. Initially, the Normalized Difference Vegetation Index (NDVI) was computed for images captured during the Rabi season from November to May across the years 2018–2019 and 2022–2023. The maximum NDVI values for each month were stacked to create a composite image with seven bands, each representing the peak NDVI for that month [
47,
48].
This composite image underwent unsupervised classification, adopting a k-means algorithm to segment it into clusters, each characterized by a distinct signature known as a cluster signature. Ground truth data collected in the field provided the reference signatures [
49]. The cluster signatures from the unsupervised classification were compared with ground truth data and high-resolution imagery from Google Earth. The most accurate clusters were labeled with corresponding crop types, and any misclassifications were corrected by reclassifying the relevant clusters. This hybrid approach combines the efficiency and scalability of machine learning in GEE for initial classification with the accuracy of ground truthing to validate and refine results, ensuring the precise mapping of crop types and their growing periods in the study area.
2.5. Mapping of Rice Crop Residue Burning Areas
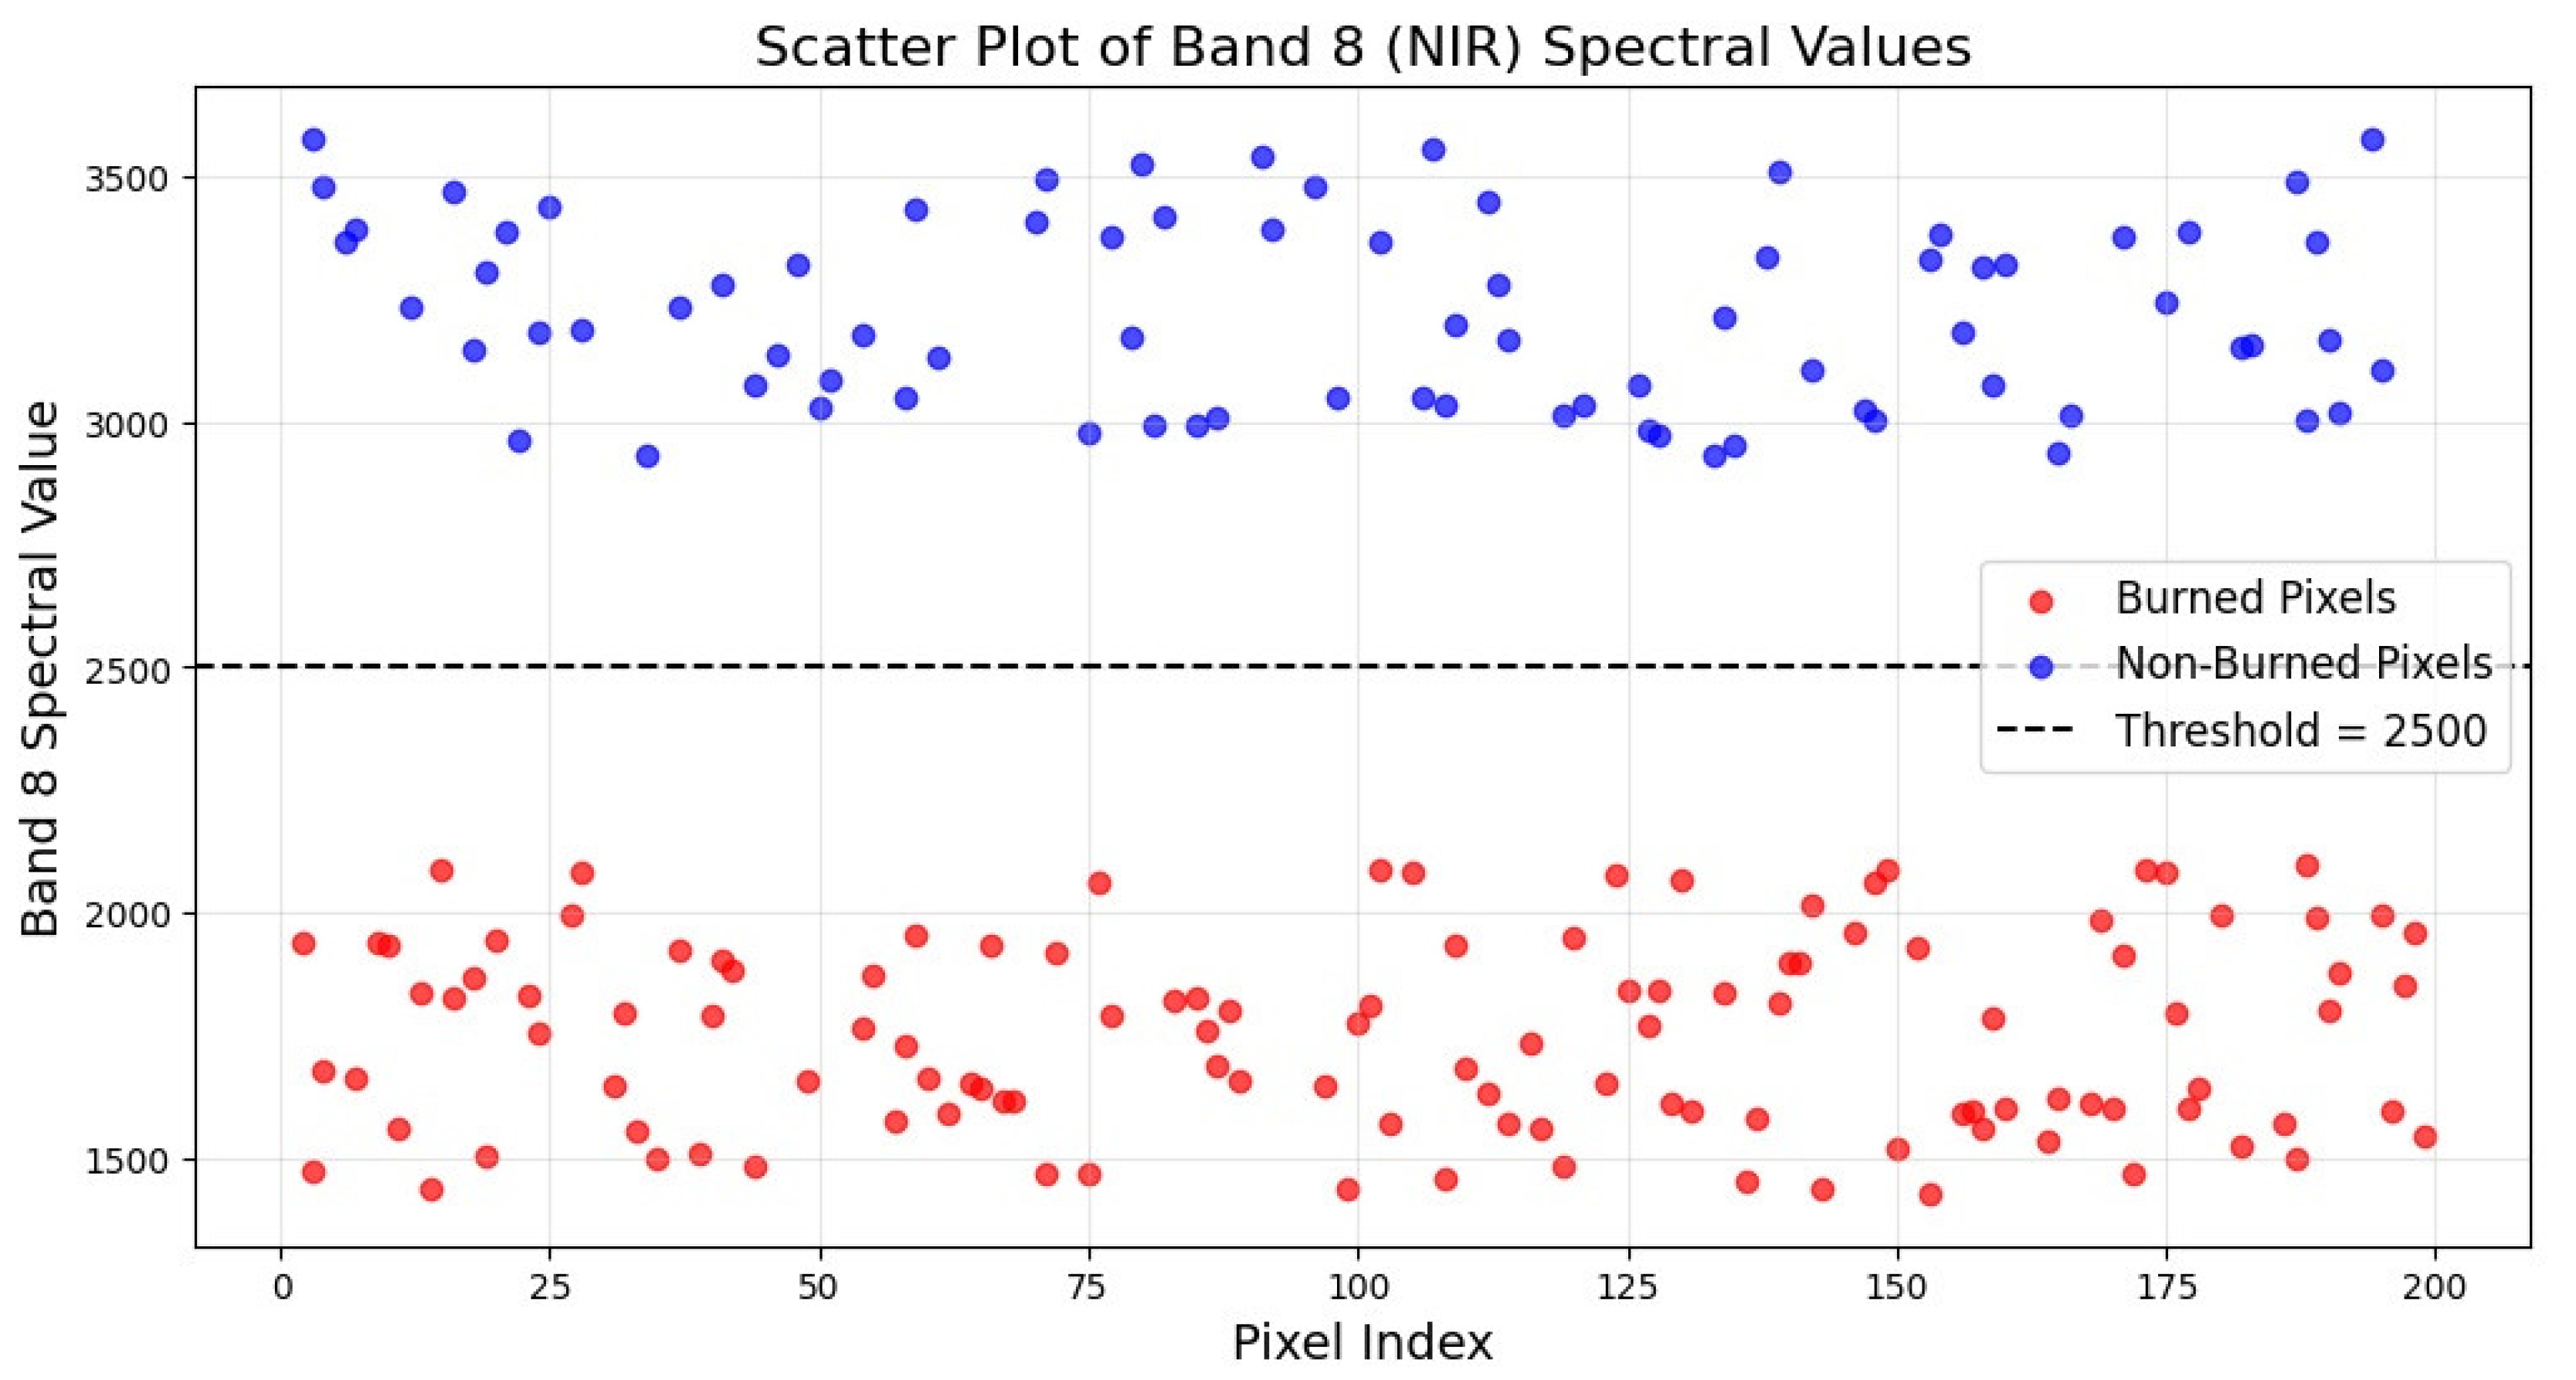
To detect rice residue burning, rice crop pixels derived from the crop type map served as the foundational layer for analysis using Google Earth Engine (GEE). Ground truth data on burned areas was collected via high-resolution RGB satellite imagery from March to June, encompassing the post-harvest phase of Rabi crops (March to May) and the onset of the Kharif season, when residue burning typically occurs. Sentinel-2 satellite imagery was employed to extract spectral values from Bands 1 to 12 (B1 to B12) for both burned and non-burned rice residue pixels. Among these, Band 8, corresponding to the Near-Infrared Region (NIR), exhibited the most significant variations between the two classes.
Burned rice residue pixels were characterized by Band 8 (B8) values predominantly below 2000, whereas non-burned pixels typically exhibited values exceeding 3000. Based on this observation, a threshold of 2500 was established in Band 8 to distinguish burned pixels. Pixels with B8 values less than 2500 were classified as burned, while those above this threshold were classified as non-burned (
Figure 4). This methodology used Sentinel-2’s high-resolution multispectral data to efficiently identify residue burning areas, enhancing the spatial and temporal precision of monitoring activities.
2.6. Estimation of GHG Emissions Due to Rice Crop Residue Burning and Rice Cultivation
The average amount of crop residue from 1 hectare (ha) of rice fields after machine cutting can vary depending on several factors, but the majority of studies show an average of 6 ton/ha, especially in Indian scenarios [
50].
As per IPCC 2006 “Equation 2.27, Volume 4 of the 2006 IPCC Guidelines for National Greenhouse Gas Inventories”, the amount of GHG emissions was estimated (
Table 1).
To estimate methane emissions from rice fields, the IPCC Tier 1 methodology, as outlined in the 2006 IPCC Guidelines for National Greenhouse Gas Inventories, was applied. This method utilizes the length of growing period of rice crops and emission factors to calculate methane emission scaling factors. By multiplying the emission factor by the cultivated area and the duration of the cropping period, the methane emission rate for each type of rice field is determined. In India, the average emission factor for irrigated rice cultivation is 0.24 g CH
4 m
−2/day [
45], and the average cultivation period in Telangana is around 120 days. This emission factor, when multiplied by the length of the growing period and the total rice area, provides an estimate of the total methane emissions in a specific area.
2.7. Accuracy Assessment
Accuracy was assessed using validation data. A total of 402 ground survey samples were utilized to test the accuracy of the classification findings to produce a confusion matrix. The confusion matrix’s columns included field-plot data points, while the rows provided crop map classification results [
51,
52]. Kappa [
53] is a widely used metric that represents the agreement between user and reference ground survey data.
3. Results and Discussion
3.1. Spatial Distribution of Crop Types and Their Changes
This study builds upon our previously published work, “Geospatial assessment of cropping pattern shifts and their impact on water demand in the Kaleshwaram lift irrigation project command area, Telangana” [
54]. While the earlier study provided a broad analysis of cropping pattern shifts and their implications for water demand, the current research focuses on specific spatial and temporal changes in land use and land cover (LULC) between 2018–2019 and 2022–2023, offering a detailed evaluation of the associated impacts.
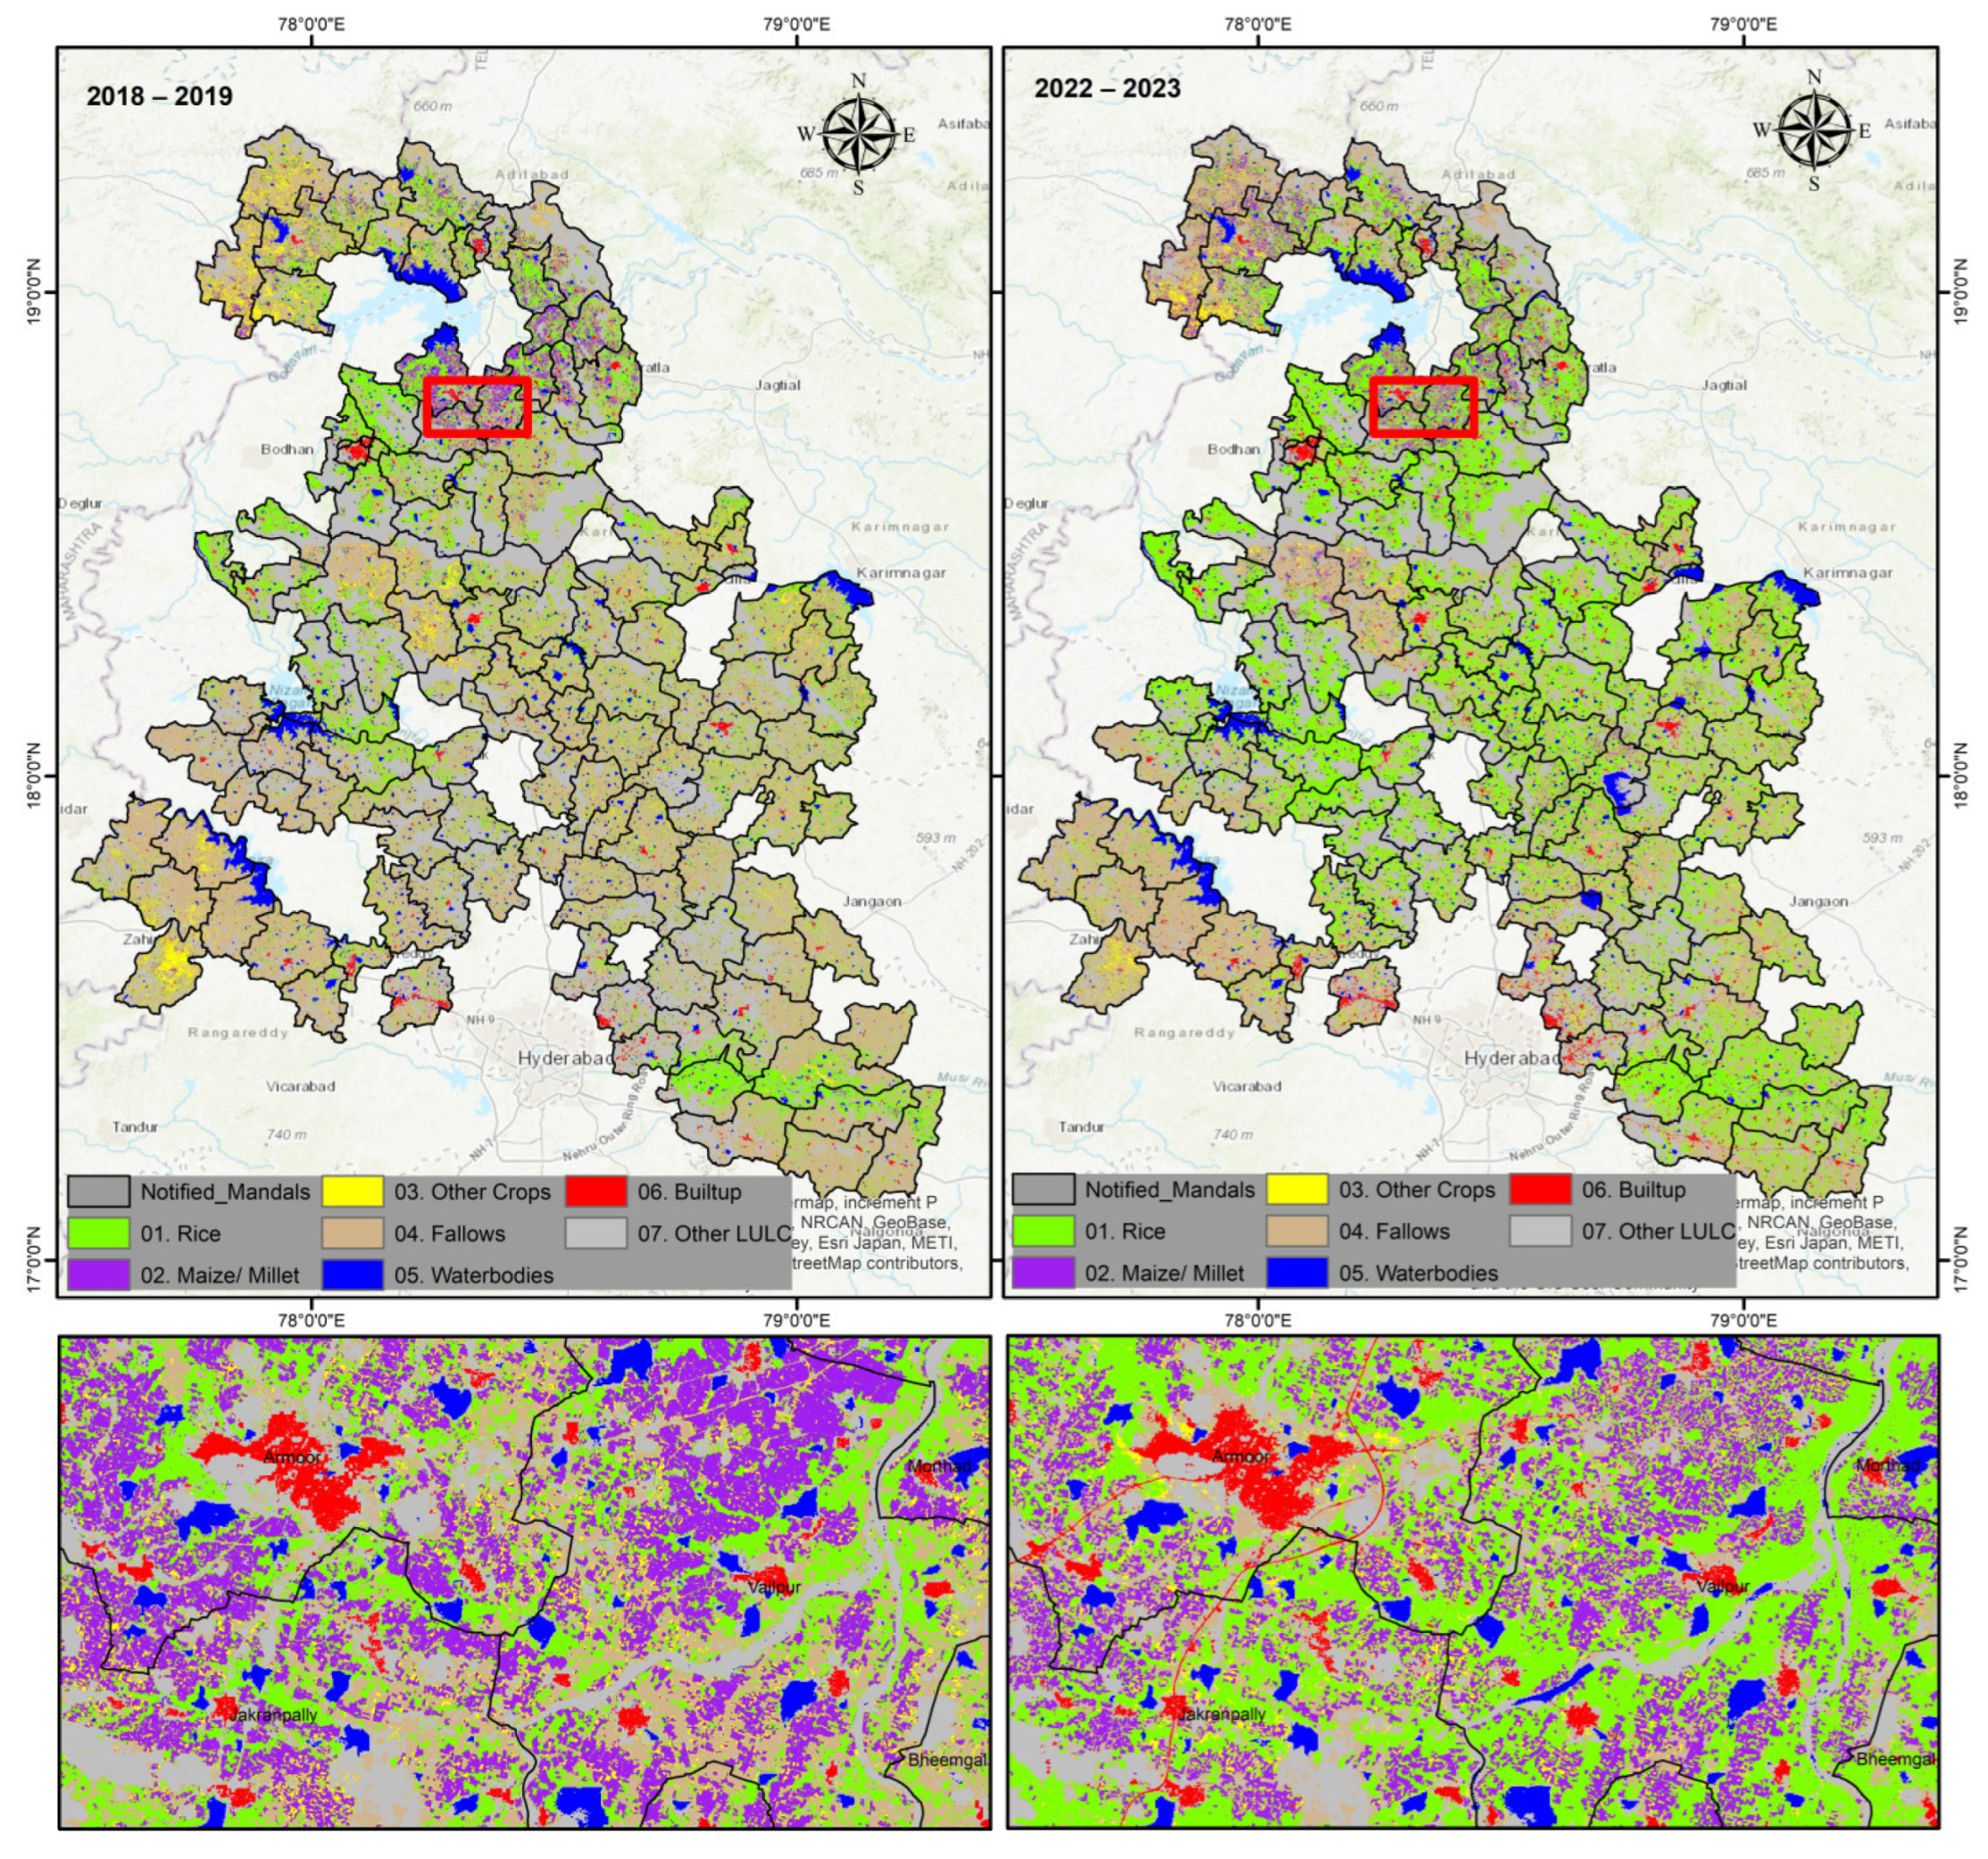
Rice cultivation exhibited a significant expansion, with the cultivated area increasing by 82.1% from 313,929 hectares in 2018–2019 to 571,632 hectares in 2022–2023 (
Table 2). Conversely, millets and maize cultivation experienced a 15.2% decline, decreasing from 73,604 hectares to 62,396 hectares during the same period. The area under other crops showed minimal change, reducing marginally by 0.6%, from 88,961 hectares to 88,385 hectares.
A substantial reduction of 30.3% was observed for fallow lands, with the area decreasing from 754,954 hectares to 526,559 hectares. On the other hand, water bodies expanded by 18.2%, increasing from 81,533 hectares to 96,375 hectares. These results, summarized in
Table 1, highlight the dynamic shifts in agricultural land use, potentially influenced by irrigation interventions and improved water availability under the Kaleshwaram project (
Figure 5).
The classification accuracy achieved in this study further validates the methodologies used in our earlier work. The integration of Sentinel-2 satellite imagery with field-collected ground truth data yielded an overall classification accuracy of 91.6%, with a kappa coefficient of 0.838. These metrics underscore the robustness of the classification approach in capturing the spatial distribution of crop types and other land use categories with high precision.
3.2. Rice Acreage and Crop Residue Burning
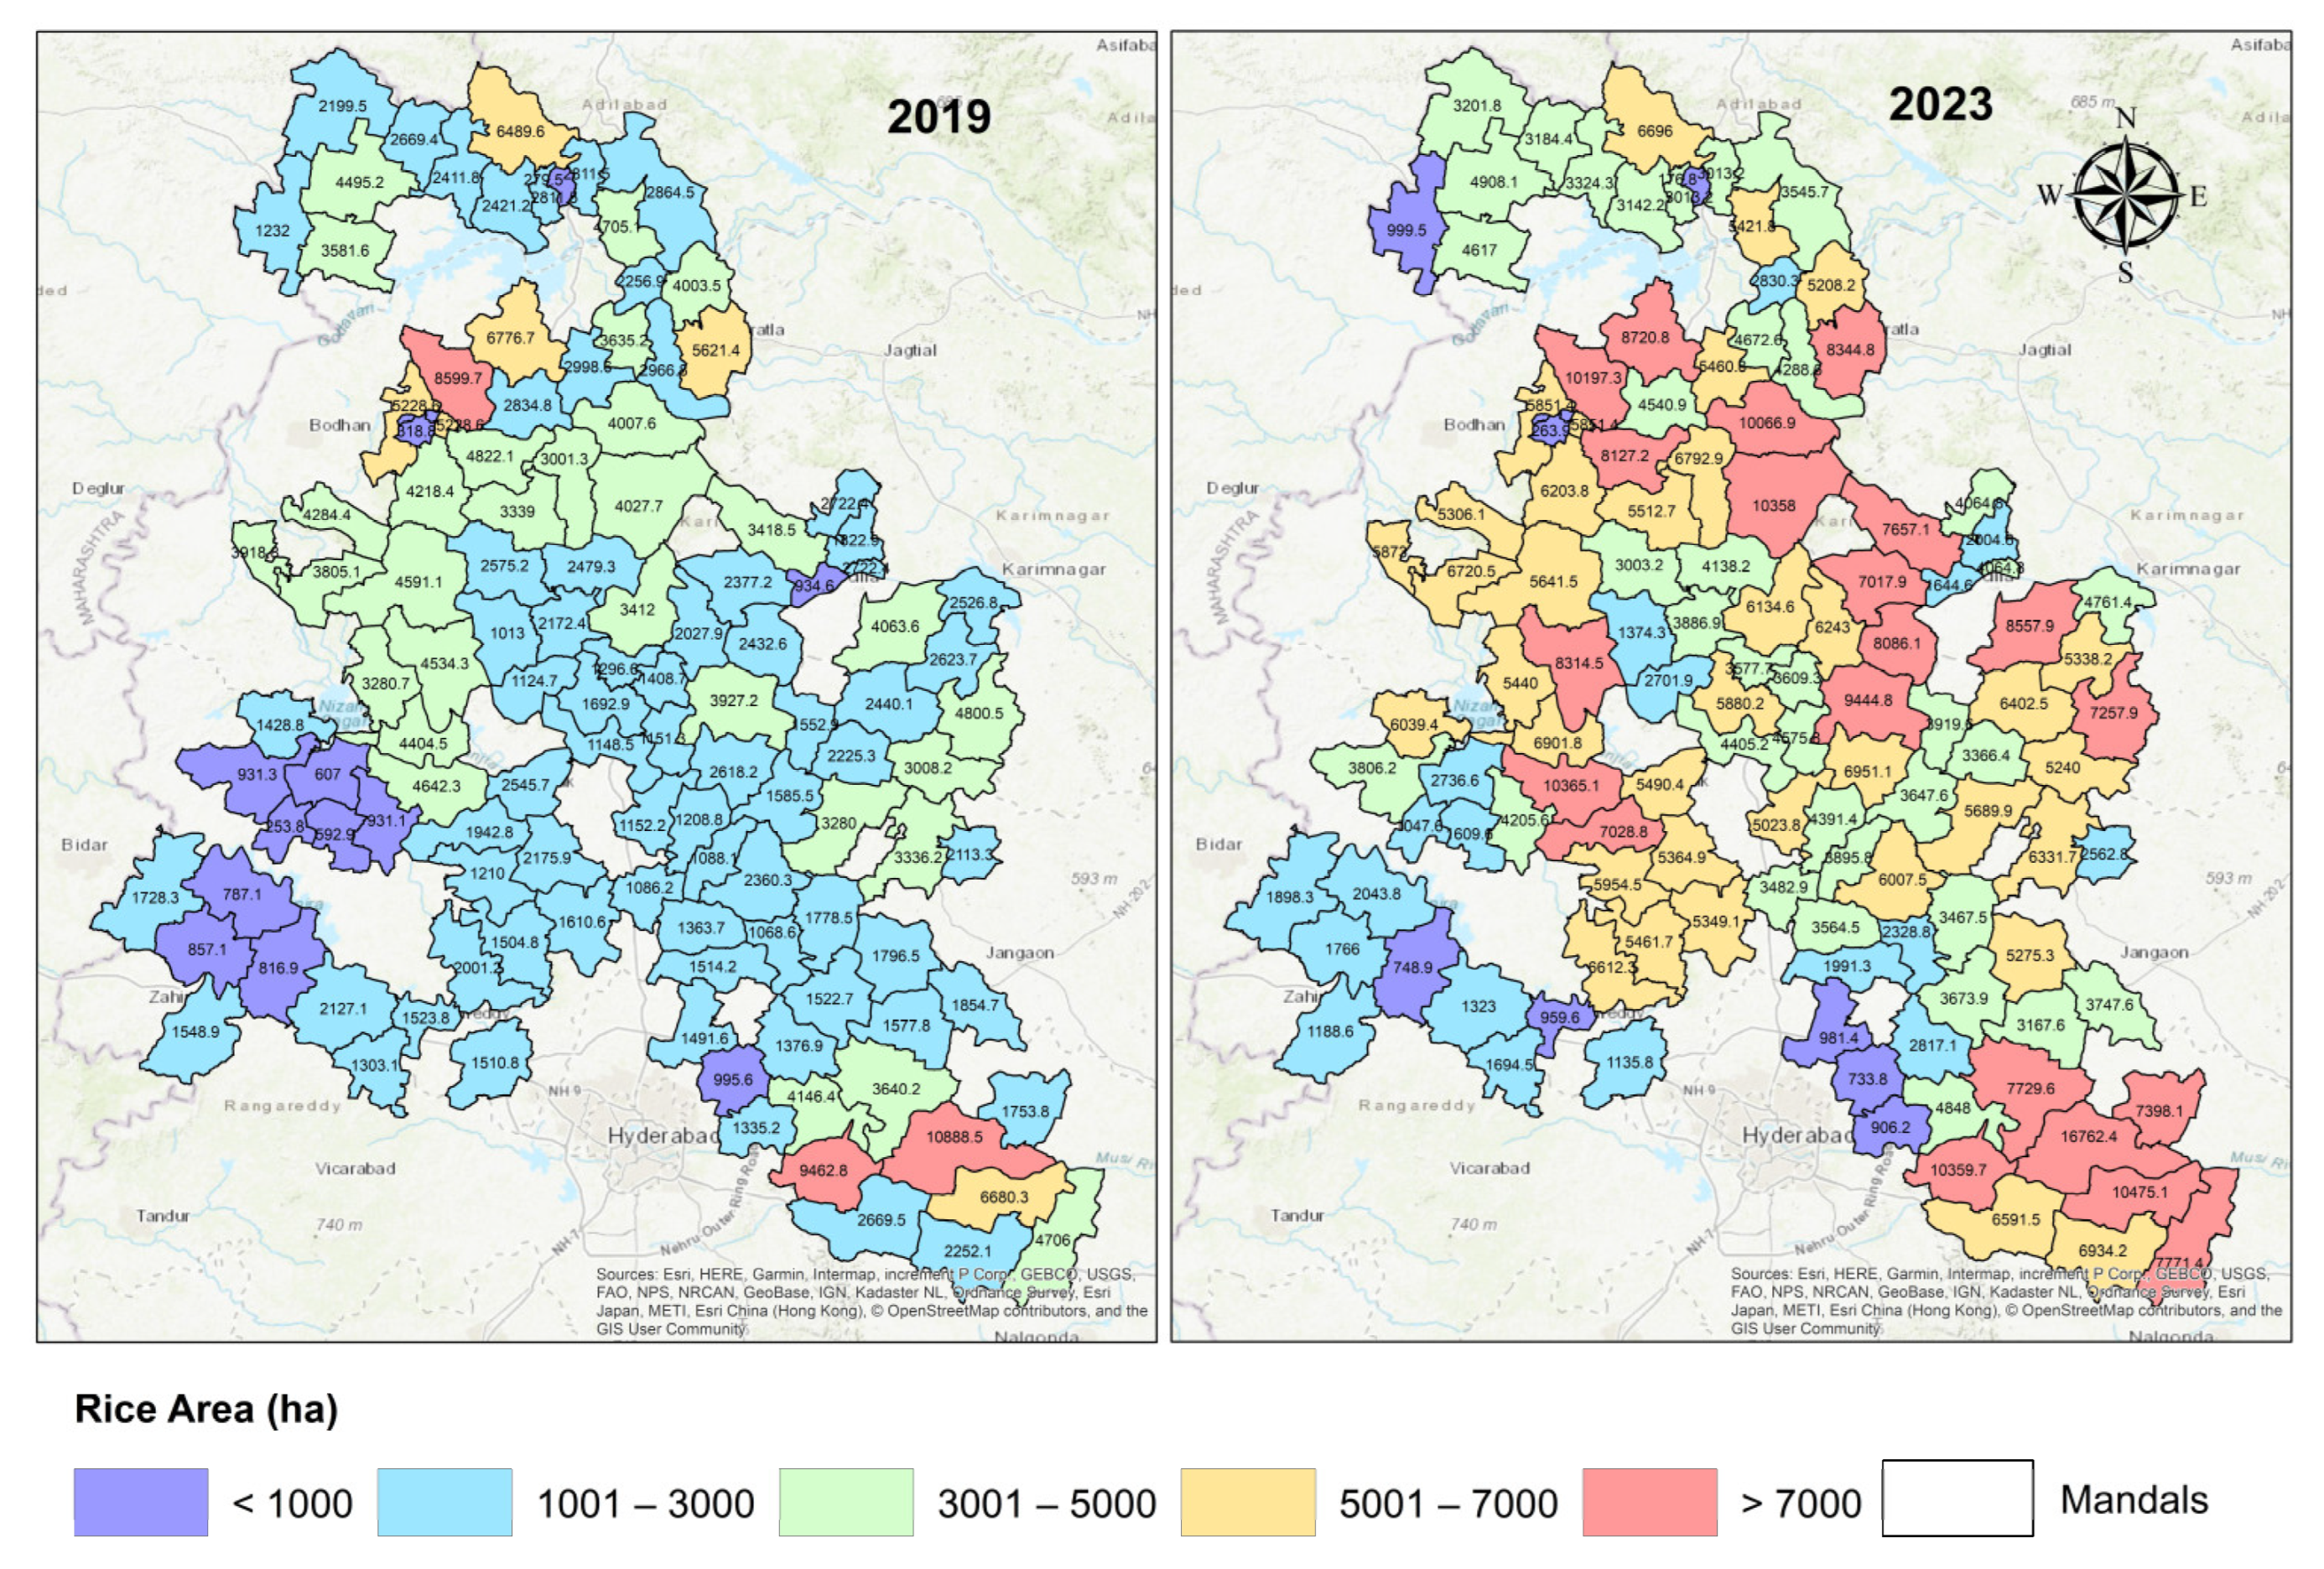
The spatial distribution of rice areas revealed that many Mandals exhibited a significant increase in rice cultivation from 2019 to 2023 (
Figure 6 and
Figure 7). For instance, rice cultivation in Alair rose from 1854.7 hectares in 2019 to 3747.6 hectares in 2023. Similarly, Armoor saw an increase from 6776.7 hectares to 8720.8 hectares over the same period. This trend suggests an overall growth in agricultural output across these regions. The increased production is likely a result of improvements in agricultural practices, better irrigation, and government policies. However, this increase is accompanied by a worrying rise in burn areas, raising concerns about sustainability.
There was a significant rise in the burn area across several Mandals. For example, in Alladurg, the burn area increased from 332.2 hectares in 2019 to 1260.0 hectares in 2023. Likewise, Dharpally saw an increase from 1511.3 hectares to 5095.4 hectares. This trend indicates an escalating issue with field burns, which could be due to the increased use of fire for clearing fields, climate change effects, or agricultural practices. This trend could lead to long-term soil degradation and reduced agricultural productivity.
The percentage of the area affected by burns has risen significantly. In Armoor, the percentage increased from 76.65% in 2019 to 90.16% in 2023 (
Figure 8). Similarly, in Dichpally, the percentage rose from 63.50% to 86.12%. This increase suggests that a larger proportion of agricultural land is being affected by crop residue burns. The substantial rise in the percentage of areas burned is alarming, as it suggests that increased rice production may not be sustainable if fields continue to be susceptible to burning. This trend could lead to long-term soil degradation, nutrient loss, and reduced productivity, impacting the overall agricultural output and farmer livelihoods.
Some Mandals experienced drastic increases in the burn area percentage. For instance, Jharasangam’s burn area percentage surged from 21.86% in 2019 to 97.00% in 2023. Similarly, Nyalkal’s percentage increased from 14.52% to 96.37%. These spikes highlight critical areas that require immediate attention. Understanding these variations is crucial for developing effective, region-specific strategies to manage burn areas. The high percentages in these regions indicate a growing challenge in managing agricultural burns and highlight the need for localized interventions to address the specific issues faced by these areas.
Several Mandals now have a high percentage of their rice-producing area affected by burns. For example, in Kulcharam, 83.42% of the area was burned in 2023, up from 64.22% in 2019. In Indalwai, 84.71% of the area was burned, up from 54.08%. These high percentages indicate a growing challenge in managing agricultural burns. The rise in crop residue burn areas and percentages have severe impacts on the environment.
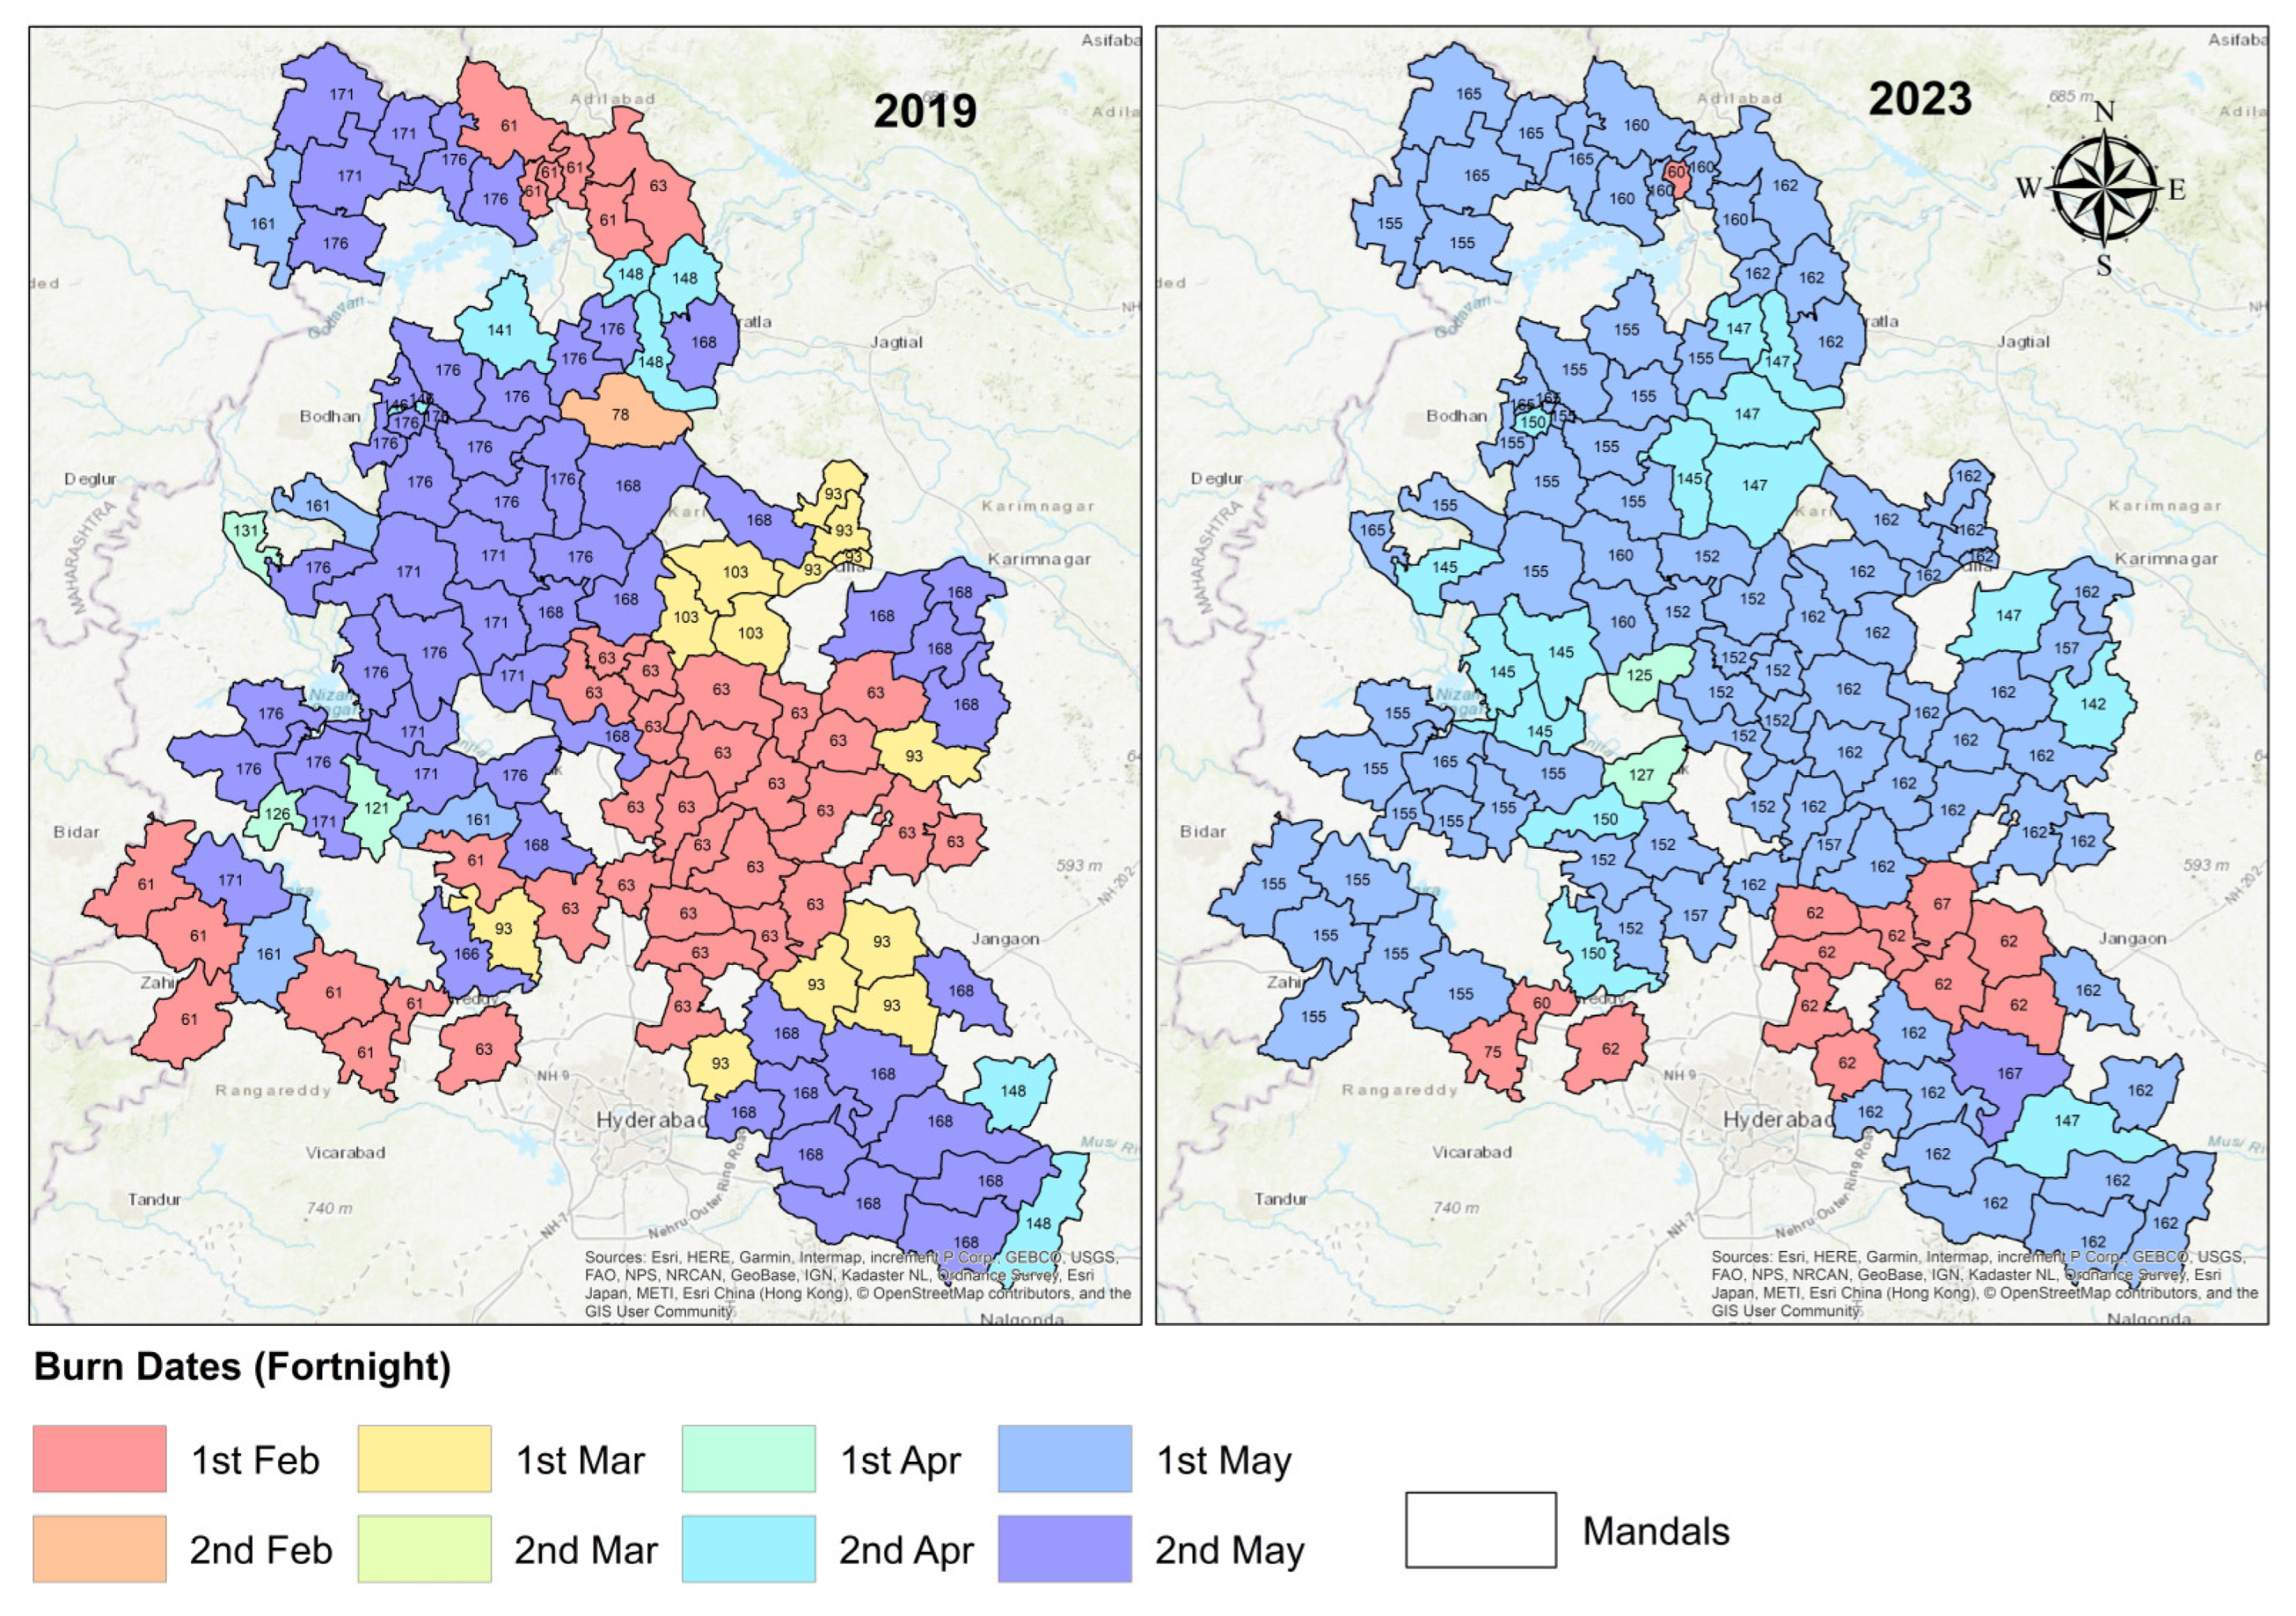
3.3. Shift in Crop Residue Burning Dates
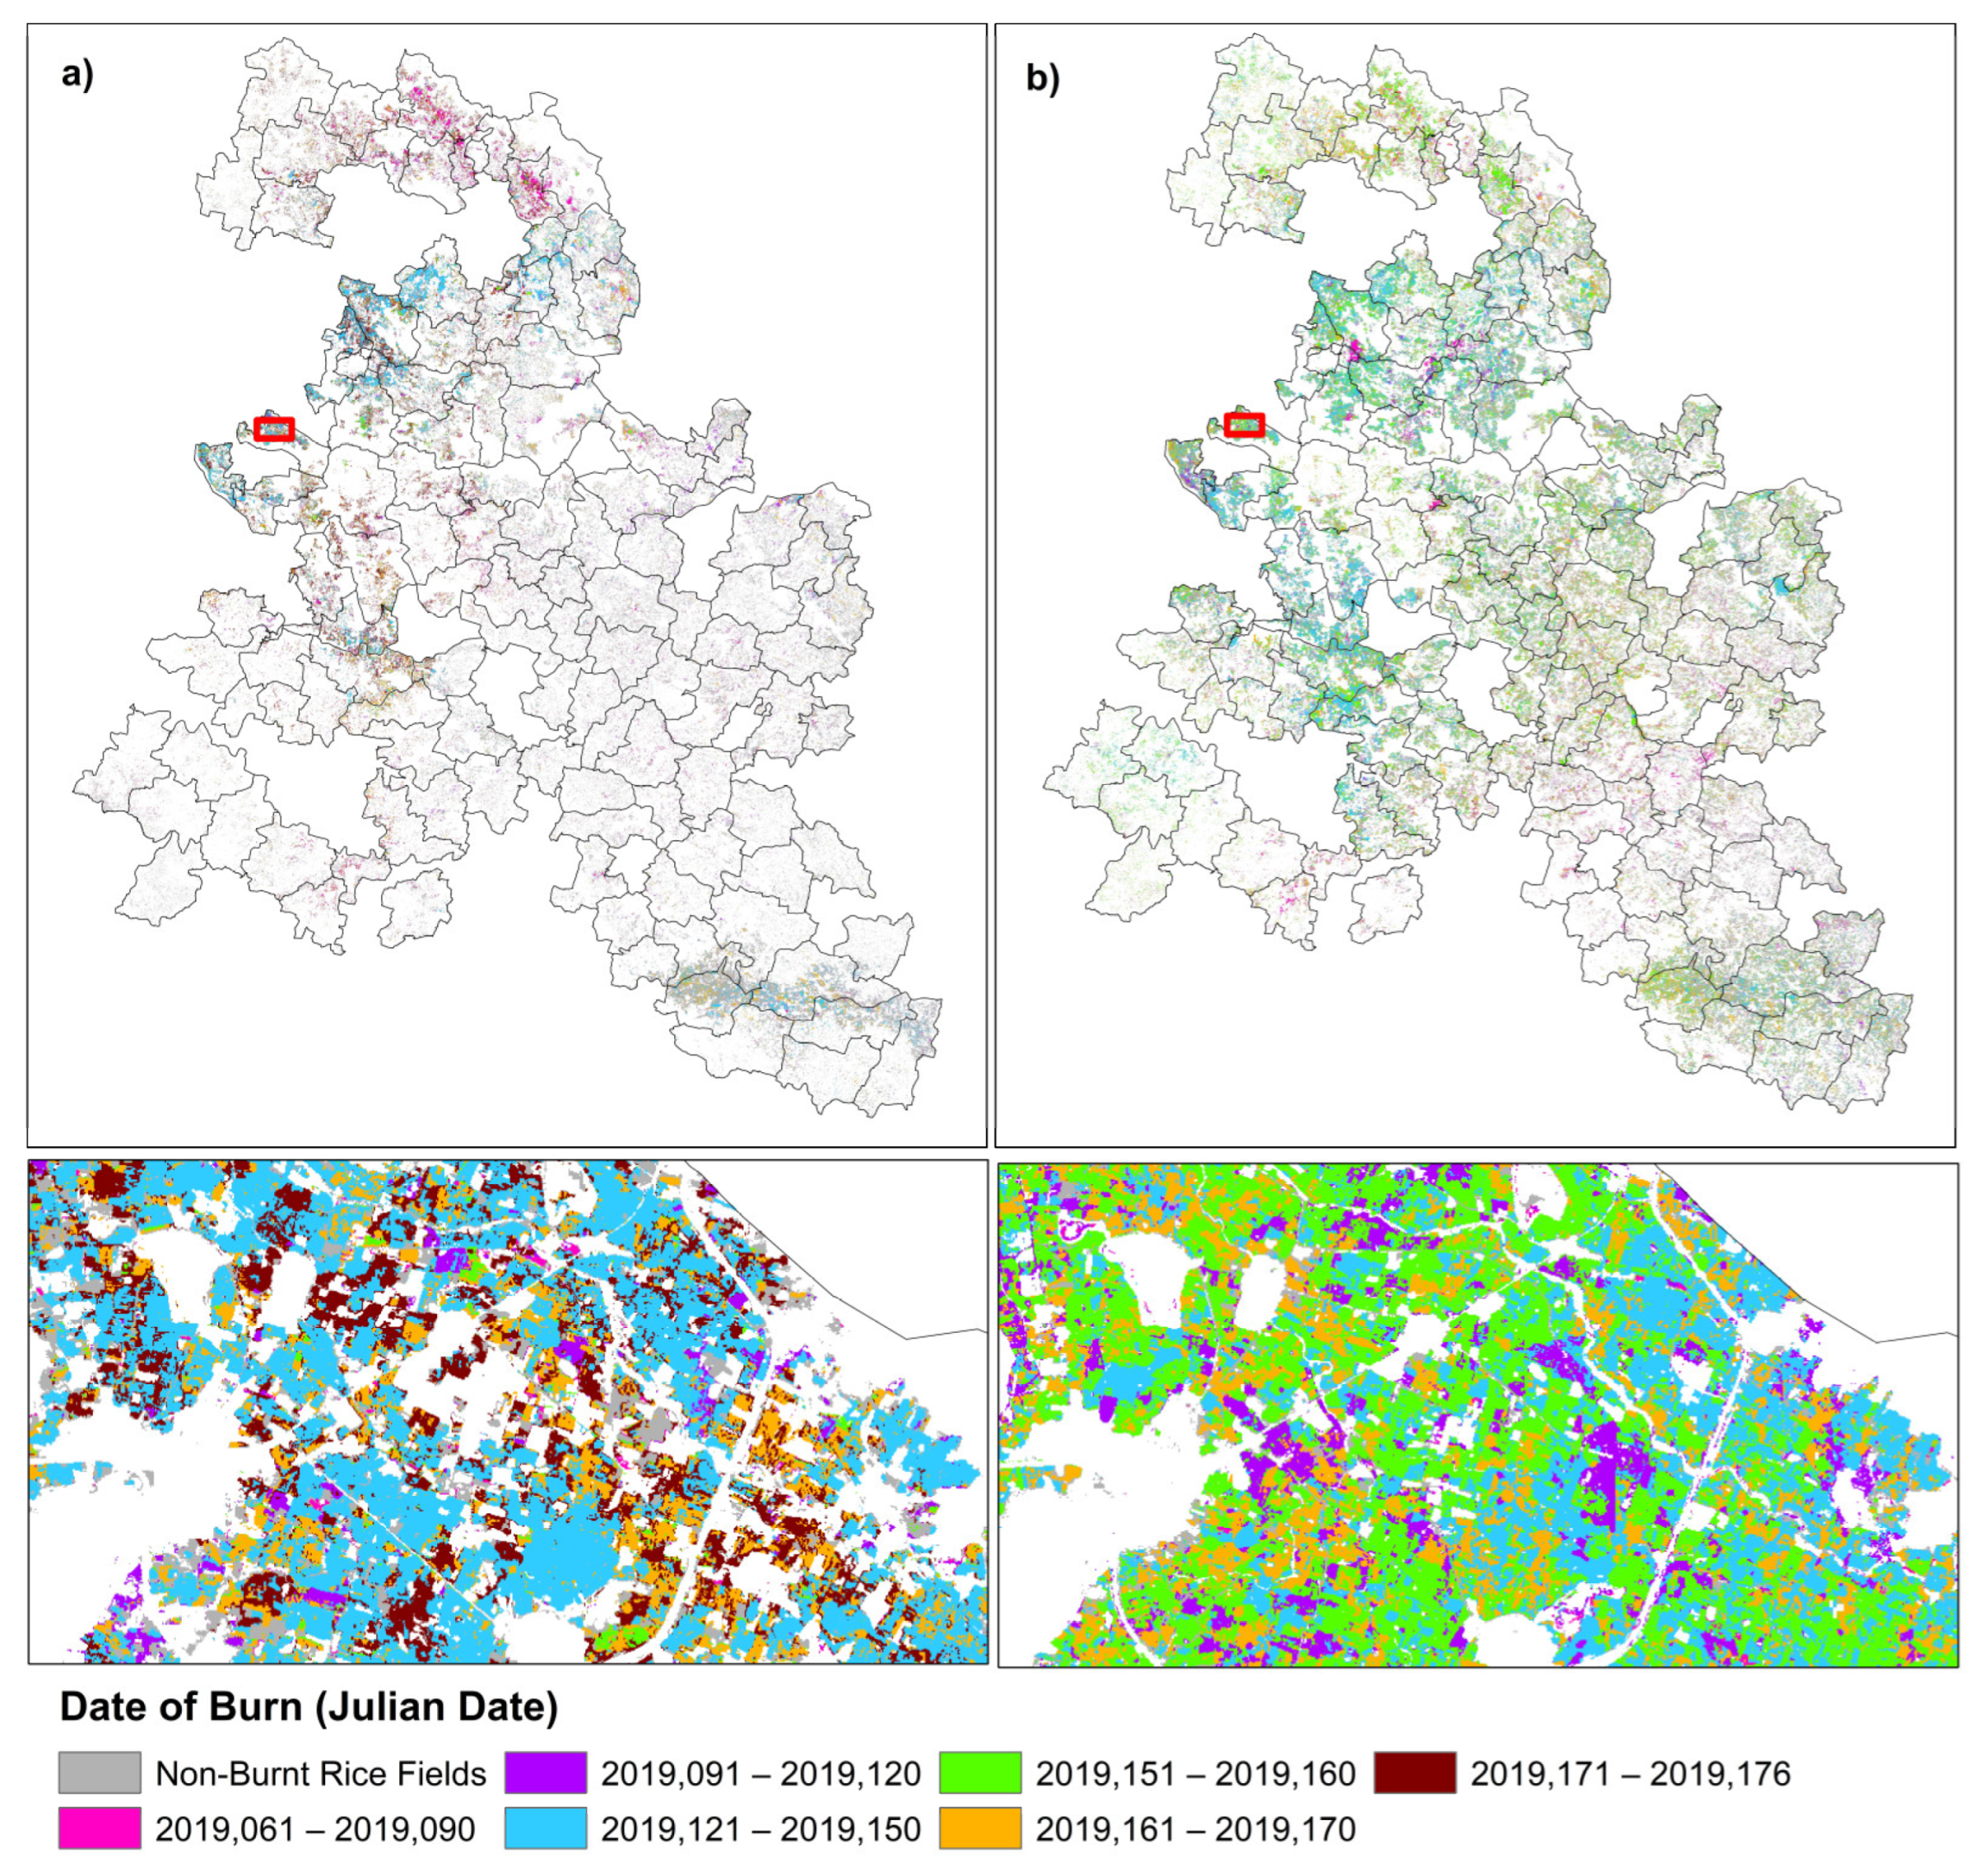
The analysis of burn dates across various locations in 2019 and 2023 shows significant shifts in the timing of rice crop residue burning, both earlier and later (
Figure 9). Notably, several locations experienced substantial advancements in their burn dates. For instance, Alladurg’s burn date shifted from 20 June 2019, to 4 June 2023, indicating an advancement of 16 days. Banswada saw a shift from 25 June 2019 to 25 May 2023, a significant 31-day advancement. Similarly, Hathnoora’s burn date moved from 15 June 2019 to 30 May 2023, showing a shift of 16 days earlier, while Medak saw a remarkable 49-day advancement from 25 June 2019 to 7 May 2023.
Conversely, some locations exhibited delays in their burn dates. For example, Bhiknoor’s burn date moved from 4 March 2019 to 1 June 2023, reflecting a delay of 89 days. Birkoor experienced a delay from 11 May 2019 to 14 June 2023, marking a 34-day shift later. Similarly, Yadagirigutta’s burn date shifted from 3 April 2019 to 3 March 2023, indicating a 31-day delay. The range of shifts across different locations suggests a complex interplay of factors influencing burn dates.
The shifts in rice crop residue burning dates from 2019 to 2023 could reflect significant changes in agricultural practices or environmental conditions. Advances in harvesting techniques and machinery might allow for the earlier completion of the rice harvest, leading to earlier residue burning. Changes in crop rotation schedules and the introduction of short-duration rice varieties could impact burn timings.
Economic factors could also drive farmers to clear fields earlier to prepare for the next planting season, maximizing yield and income. Early burning could be part of a strategy to ensure timely sowing of subsequent crops. The adoption of new technologies for residue management, such as in-field decomposition or alternative uses for crop residues, might influence the timing and necessity of burning practices, leading to variations in burn dates. The significant shifts in rice crop residue burning dates observed between 2019 and 2023 highlight the dynamic nature of agricultural practices in response to various influencing factors. Understanding these shifts and their underlying causes is crucial for developing adaptive strategies that support sustainable agriculture while minimizing environmental harm. Further research into localized conditions and broader trends will help in crafting targeted interventions to optimize burn practices and enhance overall agricultural resilience.
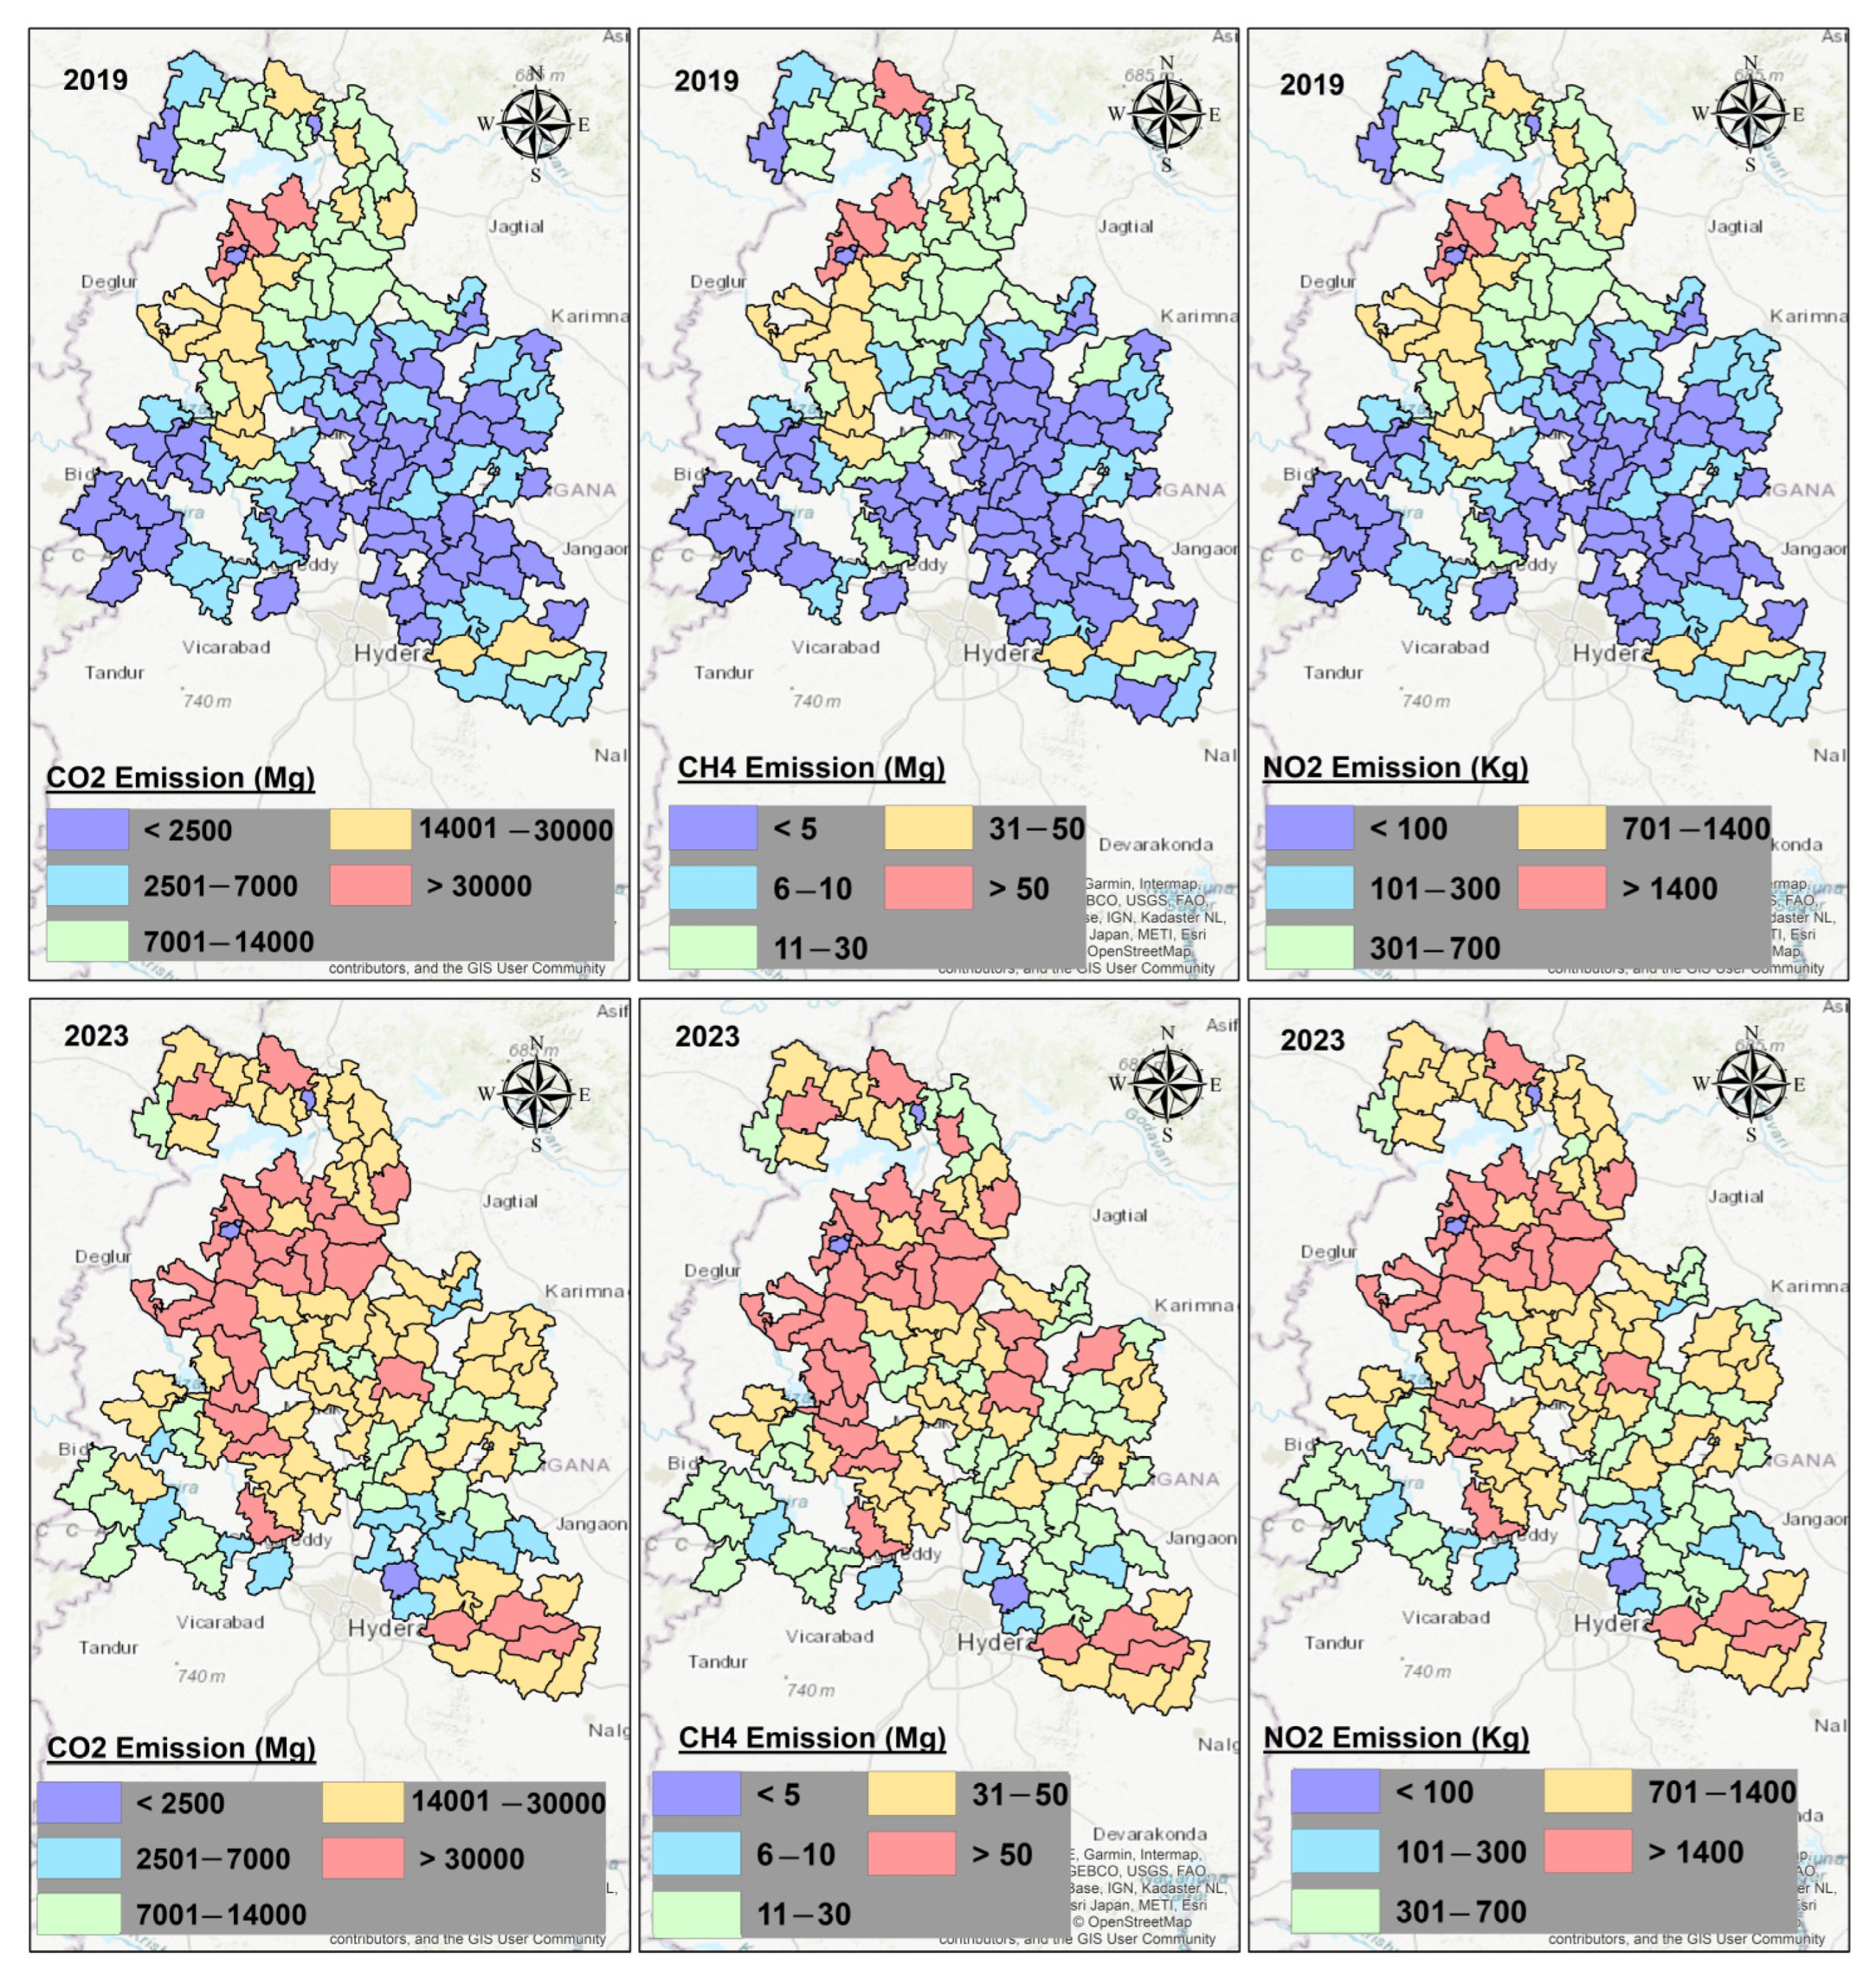
3.4. Emissions Due to Rice Crop Residue Burning and Rice Cultivation
The study investigates CO
2, CH
4, and N
2O emissions from rice crop residue burning across Mandals in the Kaleshwaram command area for the years 2019 and 2023 (
Figure 10). The findings highlight significant variations in emissions, reflecting the impact of agricultural practices on regional greenhouse gas emissions and air quality. CO
2 emissions increased notably from 2019 to 2023 across most Mandals, indicating intensified agricultural activities and rice residue burning. For instance, Mandals like Armoor showed an increase from 37,772.95 Mg in 2019 to 57,179.01 Mg in 2023, while Banswada increased from 19,939.82 Mg to 42,377.58 Mg over the same period. These increases underscore the carbon-intensive nature of residue burning practices in these regions. Urgent measures are necessary to mitigate CO
2 emissions through improved residue management and alternative agricultural practices.
Methane emissions, though lower in quantity compared to CO2, showed distinct spatial patterns across Mandals. Makloor consistently reported the highest methane emissions, increasing from 87.76 Mg in 2019 to 114.70 Mg in 2023, suggesting localized factors influencing methane release during residue burning. Given methane’s potent greenhouse effect over shorter timescales, strategies like alternate wetting and drying (AWD) techniques are crucial for mitigating climate impacts at a local level.
The analysis of carbon emissions due to rice crop residue reveals a marked increase in CO2 equivalent (CO2e) emissions. The data indicates a significant rise in emissions, with values escalating across the board. For instance, emissions in Armoor increased from 39,456 CO2e in 2019 to 59,727 CO2e in 2023, highlighting a substantial rise of 20,271 CO2e. Similarly, Papannapet experienced a dramatic increase from 25,260 CO2e to 64,770 CO2e, amounting to a rise of 39,510 CO2e. This trend is reflective of a broader pattern observed across multiple Mandals, underscoring the growing environmental impact of rice crop residue burning.
The increase in emissions suggests a significant opportunity for the implementation of carbon credit mechanisms. By curtailing or halting the practice of burning crop residues, there exists a considerable potential for reducing CO2e emissions. This reduction could enable the generation and sale of carbon credits, providing a financial incentive for adopting sustainable agricultural practices. The potential revenue from carbon credits could serve as an additional income stream for farmers and local governments, while simultaneously fostering environmental benefits.
N2O emissions were notable in Mandals with intensive agricultural activities. Makloor, Dichpally, and Sarangapur recorded high N2O emissions, indicative of nitrogen-rich rice residues and combustion. Makloor, for example, increased from 2275.26 kg in 2019 to 2973.70 kg in 2023. N2O poses significant health risks and contributes to regional air pollution. Effective regulatory measures and emission reduction technologies are essential to mitigate N2O emissions and improve air quality in affected areas.
Methane emissions, although comparatively lower, necessitate targeted interventions such as AWD techniques to minimize emissions without compromising crop yields. Meanwhile, N2O emissions underscore the importance of regulatory frameworks and technological innovations to address air quality concerns arising from agricultural burning.
3.5. Methane Emissions from Rice Sowing to Harvesting Periods
The analysis of methane emissions due to rice cultivation across various Mandals in the Kaleshwaram command area reveals notable trends between 2019 and 2023 (
Figure 11). Methane emissions have increased significantly across most Mandals, indicating an upward trend in rice cultivation activities and subsequent methane release.
For instance, Alair’s emissions rose from 0.53 × 10⁻⁶ Tg/season in 2019 to 1.08 × 10⁻⁶ Tg/season in 2023, and Athmakur (M) saw a substantial increase from 0.51 × 10⁻⁶ Tg/season to 2.13 × 10⁻⁶ Tg/season. Similarly, Mandals like B. Pochampally, Banswada, Bejjanki, and Bhiknoor also demonstrated marked increases in methane emissions, reflecting intensified rice farming practices. Noteworthy are the Mandals such as Ramannapet, where emissions climbed from 1.92 × 10⁻⁶ Tg/season in 2019 to 3.02 × 10⁻⁶ Tg/season in 2023, and Valigonda, which saw an increase from 3.14 × 10⁻⁶ Tg/season to 4.83 × 10⁻⁶ Tg/season. Conversely, a few Mandals, including Ghatkesar, Nirmal, and Sangareddy, reported lower or relatively stable emissions, suggesting variations in agricultural practices or crop management techniques or changes in cropping patterns.
Overall, the increase in methane emissions is widespread, with many Mandals exhibiting a two- to three-fold increase over the four-year period, underscoring the significant impact of rice cultivation on methane release in the region. The observed increase in methane emissions across the Mandals in the Kaleshwaram command area from 2019 to 2023 can be attributed to several factors. The expansion of rice cultivation area, adoption of water-intensive farming practices, and limited implementation of methane-reducing techniques contribute to the rising emissions.
High-emission Mandals such as Ramannapet and Valigonda, which reported significant increases in methane emissions, highlight the need for targeted interventions. Implementing alternative wetting and drying (AWD) practices, promoting aerobic rice cultivation, and encouraging the use of organic amendments can significantly reduce methane emissions from rice paddies.
Furthermore, the variations in emissions among different Mandals suggest that localized agricultural practices and environmental conditions play a crucial role in methane production. Policy measures and farmer education programs are essential to disseminate knowledge about sustainable agricultural practices and methane mitigation strategies. The government and agricultural extension services should focus on providing technical support, financial incentives, and training farmers for adopting low-emission technologies.
While rice cultivation is a vital economic activity in the Kaleshwaram command area, it is imperative to address its environmental impacts, particularly methane emissions. By adopting sustainable practices and innovative technologies, the region can achieve a balance between agricultural productivity and environmental sustainability, contributing to the broader goals of climate change mitigation and improved air quality.
3.6. Summary of Key Findings
Our analysis revealed significant changes in rice cultivation, residue burning, and greenhouse gas (GHG) emissions in the Kaleshwaram command area. Rice cultivation expanded by 82.1%, increasing from 313,929 hectares in 2018–2019 to 571,632 hectares in 2022–2023, primarily due to irrigation interventions under the Kaleshwaram project. Meanwhile, the cultivation of millets and maize declined by 15.2%, from 73,604 hectares to 62,396 hectares, and fallow lands decreased by 30.3%, from 754,954 hectares to 526,559 hectares.
Residue burning increased sharply across multiple Mandals. In Alladurg, burn areas expanded from 332.2 hectares in 2019 to 1260.0 hectares in 2023, marking a 276% increase. Similarly, Dharpally witnessed a 238% rise, with burnt areas growing from 1511.3 hectares to 5095.4 hectares. The proportion of rice-producing areas affected by residue burning also rose significantly, with Armoor increasing from 76.65% in 2019 to 90.16% in 2023, while Jharasangam saw a surge from 21.86% to 97.00% over the same period.
A notable shift in residue burning dates was observed. In Alladurg, the burning date advanced by 16 days, from 20 June 2019 to 4 June 2023, while in Medak, it advanced by 49 days, from 25 June 2019, to 7 May 2023. Conversely, Bhiknoor experienced a delay of 89 days, shifting from 4 March 2019 to 1 June 2023.
GHG emissions increased significantly across the region. In Armoor, CO2 emissions rose from 37,772.95 Mg in 2019 to 57,179.01 Mg in 2023, while in Banswada, emissions nearly doubled from 19,939.82 Mg to 42,377.58 Mg. Methane emissions also showed an upward trend, with Alair increasing from 0.53 × 10⁻⁶ Tg/season in 2019 to 1.08 × 10⁻⁶ Tg/season in 2023, and Valigonda rising from 3.14 × 10⁻⁶ Tg/season to 4.83 × 10⁻⁶ Tg/season.
These findings highlight the urgent need for sustainable agricultural practices. The increase in residue burning and methane emissions, particularly in high-emission Mandals like Ramannapet and Valigonda, underscores the importance of implementing targeted interventions such as alternate wetting-drying (AWD) techniques and residue recycling. Overall, the study provides a detailed understanding of the spatial and temporal changes in rice cultivation, residue burning, and emissions, emphasizing the challenge of balancing agricultural productivity with environmental sustainability.
3.7. Comparison with Recent Studies
This study builds on and extends recent research on crop residue burning and methane emissions, offering novel insights through its focus on precise burn date identification and emission quantification. Pazhanivelan et al. (2024) assessed methane emissions from rice fields using satellite-derived land surface temperature [
45]. Their work primarily emphasized spatial patterns rather than temporal precision. In contrast, our study highlights the importance of identifying exact burn dates, enabling timely interventions to mitigate environmental impacts.
The observed increase in greenhouse gas emissions aligns with Qian et al. (2023), who reviewed mitigation strategies for rice agriculture, emphasizing region-specific interventions like alternate wetting–drying (AWD) techniques [
44]. However, their study lacked detailed emission estimates from residue burning, which we address by quantifying CO
2, CH
4, and N
2O emissions. Additionally, Lin and Begho (2022) reviewed crop residue burning in South Asia but focused on reactive nitrogen losses rather than precise emission quantifications or temporal shifts [
18]. Our research fills this gap by analyzing changes in burn dates and their implications for emission mitigation.
Recent advancements in remote sensing, such as those made by Roteta et al. (2019) and Von Nonn et al. (2024), have improved burn area mapping but often lack the high-resolution temporal analysis provided in this study [
33,
35]. By using Sentinel-2 data and machine learning algorithms, we achieve greater accuracy in identifying small-scale residue burn areas and estimating emissions. Our study integrates residue burning into its analysis, offering a holistic view of rice farming’s environmental impacts.
In summary, this study advances current understandings by combining high-resolution satellite data, machine learning, and ground truth validation to identify burn areas, quantify emissions, and analyze temporal patterns. These contributions provide a foundation for sustainable residue management and informed policy development.
4. Conclusions
This study analyzed rice residue burn areas, their dates, and associated greenhouse gas (GHG) emissions in the Kaleshwaram command area using Sentinel-2 satellite imagery, machine learning, and ground truth data. Our key findings reveal an 82.1% increase in rice cultivation from 2018–2019 to 2022–2023, accompanied by a worrying rise in residue burning. For example, burn areas in Alladurg and Dharpally increased by 276% and 238%, respectively. Shifts in burn dates, both earlier and later, highlight the dynamic nature of agricultural practices. The study quantified significant increases in CO2, CH4, and N2O emissions due to residue burning and rice cultivation. For instance, CO2 emissions rose by 51% in Armoor and 156% in Papannapet. Methane emissions also increased markedly, particularly in high-emission Mandals like Ramannapet and Valigonda. These trends underscore the urgent need for sustainable practices such as alternate wetting–drying (AWD), residue recycling, and low-emission technologies.
While burning offers immediate benefits like efficient land clearing, it also contributes to air pollution, soil degradation, and greenhouse gas emissions. Remote sensing plays a critical role in monitoring these activities, providing valuable data for regulatory compliance and mitigation strategies. Comparing our results with recent studies, this research highlights the importance of precise burn date monitoring and high-resolution data for effective emission mitigation. The findings provide a foundation for region-specific policies to balance agricultural productivity with environmental sustainability.
In conclusion, balancing increased rice production with environmental sustainability requires targeted interventions, innovative technologies, and farmer education. Sustainable agricultural practices are crucial for maintaining productivity while protecting the environment and public health.


 ,
, 


