Abstract
Carbon emission fluxes in urban sewer systems and the microbial community structure in sewer sediments remain unclear. In this study, a sewer system located in southern China was utilized to investigate the water quality characteristics. The results showed that the chemical oxygen demand loss rates in the branch pipe and sub-main pipe were 27.1% and 14.1%, respectively. The estimated carbon emission flux was estimated by the carbon emission factor method. The results revealed that the total carbon emission flux from the sewer system was 1.39 kg CO2-eq/m3 and the emission fluxes of methane and carbon dioxide were 0.87 kg CO2-eq/m3 and 0.51 kg CO2-eq/m3, accounting for 62% and 36.4%. The microbial community structure was analyzed by 16S rRNA. The results indicated that the methanogenic archaea in the sediments of the branch pipe and sub-main pipe were Methanobacterium, Methanosaeta, and Methanobrevibacter. The methanogenic activity of the sewer sediments was further assessed. This study further confirmed that the branch pipe and sub-main pipe were the main sources of carbon emissions and methane and carbon dioxide are the main greenhouse gases in the sewer system. This study furnishes novel insights for the control of carbon emissions in municipal sewage systems.
1. Introduction
The urban sewer system is the key infrastructure of urban environmental protection and is mainly responsible for the realization of urban sewage collection, transportation, and treatment [1]. However, the long-term shortage of influent carbon sources faced by downstream wastewater treatment plants (WWTP) in China is believed to be related to the efficiency of sewer transportation [2]. Inflow and infiltration can explain the decrease in influent carbon source concentrations but cannot explain the decrease in the carbon–nitrogen ratio. It is considered that the main cause of carbon source loss is particulate organic carbon (PCOD) deposition and biofilm microbial metabolism during sewage transportation [3]. The sedimentation of particulate sediment in sewage not only changes the structure of the sewage network and affects the transportation efficiency of the sewage network but even blocks the pipe network in serious cases, resulting in serious environmental problems. Additionally, many studies have reported that sewer systems are a huge bioreactor, in which the deposited particulate organic matter is hydrolyzed and fermented by microorganisms to produce greenhouse gases, including carbon dioxide (CO2), nitrous oxide (N2O), and methane (CH4) [3,4]. The discharge of these greenhouse gases (GHGs) into the environment from the sewer system can have a non-negligible impact on the environment and human health [4]. Moreover, it has been proved that CH4 is not only a greenhouse gas with a strong greenhouse effect but also a serious threat to public health and safety due to its low explosive limit [5]. Consequently, the global impacts of the large amount of GHGs emitted by sewer systems have garnered increasing attention in recent years.
In the past decades, sewer systems have been extensively developed in China and have made great contributions to urban development and cleanliness [6,7]. However, these sewer systems inevitably emit large amounts of GHGs in the process of transporting sewage [8]. For instance, it was reported that the total GHG emissions of the 37 km municipal sewer system in Xi’an City amounts to 199 t/d [9], and the average concentration of methane emissions from four drainage pipelines in the Shanghai city center is 10.52 ± 9.39 mg/L [10]. Additionally, the type of urban sewer system, including gravity sewers and pressure sewers, has a significant impact on greenhouse gas emissions [11]. It is reported that up to 100 mg COD/L of methane is produced in a rising main pipe in Australia [12]. Moreover, it was estimated that force mains contribute 30% of the total sewer-generated methane compared to gravity pipes [13]. The vast amount of GHGs emitted by municipal sewers cannot be ignored in China. The Chinese government has adopted strategies to reduce carbon emissions from sewage treatment facilities [14,15,16]. However, the complexity and variability of the environment make it difficult to accurately estimate GHG emissions from the sewer system, which limits the implementation of effective measures [17]. It is reported that the composition of domestic sewage and the surrounding environmental conditions have an impact on greenhouse gas emissions in the sewer system [18]. Studies have shown that the anaerobic environment could be destroyed by the high DO concentrations in domestic sewage, inhibit microbial activity, and eventually lead to a decrease in methane production [19,20,21]. Moreover, the concentration of organic matter contained in domestic sewage has an impact on the carbon emissions of sewer systems. Many studies have confirmed that CH4 and CO2 emissions from urban sewer systems are related to microbial respiration and energy metabolism [22]. The abundance of hydrolytic, fermentative bacteria, and methanogenic archaea in sewer systems has a significant impact on sewer methane and carbon dioxide emissions [23]. The nitrogen-converting microorganisms contained in the biofilm attached to the sewer system also release a small amount of N2O [24]. Therefore, it is necessary to accurately estimate the greenhouse gas emissions of sewer systems and take effective measures to control them.
The Intergovernmental Panel on Climate Change (IPCC) has proposed authoritative global framework standards and mathematical models based on emission factors, which provide a method for estimating GHGs in sewer systems [25]. According to the IPCC, CO2 produced through biochemical cycles such as animal and plant respiration is classified as biogenic CO2. Therefore, the CO2 produced in the sewage treatment process comes from the biological decomposition process of organic matter in sewage. This biological carbon (Bio-C) does not cause a net increase in atmospheric CO2 and is therefore not counted in the national greenhouse gas inventory. However, studies in recent years have found that, because about 20% of the organic carbon in sewage treatment, especially in domestic sewage, belongs to mineral sources (mainly related to detergents), CO2 in sewage treatment processes should be included in the accounting system [6]. Further research has also confirmed that on a global scale, carbon emissions generated by 20% of the carbon sourced from ores have a very significant impact on the global greenhouse effect [7]. Furthermore, many studies have proved that estimating the greenhouse gas quantity of sewage networks based on emission factors is a feasible method [26,27]. The greenhouse gas emissions of most sewer systems are quantitatively assessed on their carbon emissions and are briefly calculated based on the principle of local gas production and method application [28]. These reports emphasize the isolated effects of emission factors on the wastewater treatment process and ignore the mechanistic effects of microorganisms on greenhouse gas production [29,30]. Many studies have confirmed that the interaction between different microbial species in sewers is the main pathway for methane and hydrogen sulfide production [31]. The estimation and control of greenhouse gas emissions from the sewer system have rarely been reported in China. Therefore, identifying the primary causes of carbon loss and the key sources of carbon emissions in the pipeline network is of critical importance.
In this study, a sewer system located in southern China was selected to analyze the composition of domestic sewage. The GHG emission fluxes were estimated based on the IPCC emission factor method. The sediments of the sewer system were collected to evaluate the methanogenic activity of sewer sediments. The microbial community structure in the sediment was analyzed by 16S rRNA. This study can provide some suggestions and guidance for the study of greenhouse gas emissions and production mechanisms in sewer systems.
2. Materials and Methods
2.1. Study Area
An approximately 7 km long sewer system located in Xiamen Jimei district, China, was used to study the water quality characteristics of sewage and greenhouse gas emission fluxes (Figure 1). This sewer system is used to collect domestic sewage from various communities and deliver it to the downstream wastewater treatment plant (WWTP). Given Xiamen’s geographical location in southern China and the relative homogeneity of domestic wastewater characteristics across urban residential zones (standard deviation of COD < 15% based on municipal monitoring data), a representative residential community’s wastewater (i.e., W1–W4) was selected as the primary research subject. The sewer system was the rain and pollution diversion system, and the main drainage system was the gravity pipe network system. The sewer system consists of branch pipes, sub-main pipes, and main pipes. A total of 10 sampling points were set up for sample collection and data analysis. As shown in Figure 1, W1 was the community outlet, W2–W4 were the branch pipe sampling points, W4–W7 were the sub-main pipe sampling points, W7–W10 were the municipal main pipe sampling points, and W10 was the WWTP inlet sampling point.
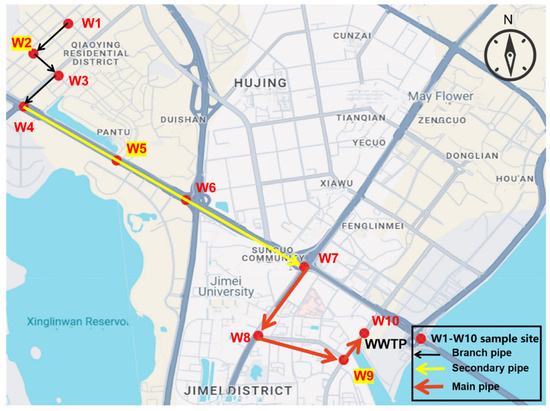
Figure 1.
Study area for the water quality characteristics and greenhouse gas (GHG) emission measurements in the Xiamen Jimei district.
2.2. Sampling Collection
An automatic sampler (THwater, Beijing Qinghuan Smart Water Technology Co., Ltd., Beijing, China) was set up at each sampling point (W1–W10) to collect mixed samples of sewage to avoid the instantaneous effects of the samples. The sampling time was set to sample once every 30 min and the pump to function for 1 min each time. After sampling 48 times a day, the collected water samples were transferred to the laboratory. A sample from each point was collected three times. The water samples were filtered with a 0.45 μm filter membrane for the determination of the chemical oxygen demand (COD), total nitrogen (TN), and ammonia nitrogen (NH4+-N). Approximately 20 g of sediment samples from W2, W5, and W9 were scraped with a sterile sampler and stored in a sterile centrifuge tube. The sediment samples used for the microbial community structure analysis were centrifuged at 5000 rpm and stored at −80 °C for future use. The remaining sediment samples were used in batch experiments to analyze methanogenic activity. The water flow rate at each point was determined by a portable flowmeter (HACH-av9000, Hach Company, Loveland, CO, USA). At the sampling site, the values of temperature, pH, and ORP were measured by portable monitors (Multi3620, WTW Company, Hamburg, Germany).
2.3. GHG Emission Flux Measurements and Calculations
The carbon emission accounting in this study focuses on the carbon emissions generated during the operation of the sewer, including CH4 and N2O production by biological metabolism and CO2 production from fossil sewage sources. The carbon emission accounting of the sewer system was based on the standard method [19] and the findings of Jin et al. [23] in this study. There was no pumping station along the pipe network system. This study only considers the direct carbon emissions generated by the sewer system in the process of transporting sewage. According to the IPCC [17], the potential value of CO2 is considered as 1, the carbon emission equivalent of CH4 is 28, and the carbon emission equivalent of N2O is 265. Consequently, the total carbon emissions in the urban sewer system were calculated according to Equation (1):
where is the total GHG emission flux (kg CO2-eq/m3), is the CO2 emission flux (kg CO2-eq/m3), is the CH4 emission flux (kg CO2-eq/m3), and is the N2O emission flux (kg CO2-eq/m3).
2.3.1. Methods for Calculating CO2 Flux
The proportion of CO2 emissions from petrochemical sources in the sewage network was calculated according to Equations (2)–(4):
where is the CO2 emission flux (kg CO2-eq/m3), is the proportion of emissions from fossil sources (10% [23] was used in this study; IPCC: 5–20%), is the CO2 emission factor (1.47 kg-CO2/kg-COD [19]), (kg-COD/m3) is the loss of COD from the pipe network, and are the initial and final concentrations of COD in the urban sewer system, is the anaerobic conversion rate of , t is the hydraulic retention time (d), is the anaerobic conversion rate of COD at 20 °C (0.221), the value of is 1.117, and is the temperature in the sewer system (°C).
2.3.2. Methods for Calculating CH4 Flux
The proportion of CH4 emissions in the sewage network was calculated according to Equation (5):
where is the CH4 emission flux (kg CO2-eq/m3); is the CH4 emission factor, 0.25 kg-CO2/kg-COD in this study [19]; (kg-COD/m3) is the loss of COD from the pipe network, calculated according to Equation (3); is the anaerobic conversion rate of COD, calculated according to Equation (4); and 28 is the global warming potential of CH4.
2.3.3. Methods for Calculating N2O Flux
The proportion of CH4 emissions in the sewage network was calculated according to Equation (6):
where is the N2O emission flux (kg CO2-eq/m3); is the N2O emission factor, 0.005 kg-N2O/kg-N in this study [19]; is the initial concentration of N in the urban sewer system (kg-N/m3); is the final concentration of N in the urban sewer system (kg-N/m3); and 265 is the global warming potential of N2O.
2.4. Determination of Methanogenic Activity
A batch experiment was designed to assess the methane production rate in sewer sediments. The domestic sewage of a residential building (i.e., W1) was collected and filtered with a 0.22 μm filter membrane to remove microorganisms from the sewage. Then, 200 mL of filtered sewage and 5 g of sediment samples were placed in a 500 mL serum bottle and thoroughly shaken to mix. Sediment samples were collected from branch pipe (W2), sub-main pipe (W5), and main pipe (W9) and fully aerated with helium for 20 min to remove oxygen from the serum bottle. The samples were incubated in an incubator sheltered from light for 12 h at 21 ± 0.2 °C. After 12 h, a headspace gas sample was collected from the serum bottle to determine the concentration of methane in the gas phase. For the dissolved methane, a 2.5 mL water sample was filtered through a 0.22 μm membrane and quickly transferred to a 10 mL sealed vacuum tube. The tube was left at room temperature for 24 h to achieve a gas–liquid equilibrium [21]. A gas chromatograph (GC, Agilent 7890A) equipped with a flame ionization detector (FID) was used to determine the concentration of methane. The concentration of dissolved methane in the liquid phase was calculated using the mass balance and Henry’s law in accordance with Liu et al. [24].
2.5. DNA Extraction and 16S rRNA Sequencing
To determine the microbial community structure in the branch pipe, sub-main pipe, and main pipe in the sewer system, sediment samples from W2, W5, and W9 were collected to sequence the 16S ribosomal RNA gene (16S rRNA gene). The genomic DNA of the sediment samples was extracted using the Qiagen DNeasy PowerSoil Kit (Qiagen, Hilden, Germany) following the manufacturer’s instructions. The genomic DNA was sequenced at Majorbio Technology Co., Ltd. (Shanghai, China). Universal primers were used for the amplification of the 16S rRNA gene: 515FmodF (5′-GTGYCAGCMGCCGCGGTAA-3′) and 806RmodR (5′-GGACTACNVGGGTWTCTAAT-3′). PCR amplification was conducted as follows: 5 min of pre-denaturation at 94 °C, and then, 30 s of denaturation at 95 °C, cycled 35 times, followed by 30 s of annealing at 55.5 °C and a 5 min final extension at 72 °C. The alignment sequences were demultiplexed and filtered by QIIME (version 1.17). Sequences with a 97% similarity of operational units (OTUs) were clustered using UPARSE, and UCHIME was used to identify and remove chimeras. The classification of each 16S rRNA gene sequence was used at a 70% confidence threshold by the RDP classifier [22].
2.6. Statistical Analysis
Standard methods were used to determine the concentrations of COD, TN, and NH4+-N [26]. The gas phase methane produced by the sediment was collected in a sealed air collection bag and measured with an Agilent 8890 gas chromatograph equipped with a flame ionization detector (GC-FID). The dissolved methane sample was measured according to Yin et al. [27]. Origin 9.0 software was used for a one-way analysis of variance (ANOVA). Significance analysis was conducted using IBM SPSS software (version 27.0). The model assumes independence of observations (ensured by sampling from distinct hydraulic zones), normality (validated via Shapiro–Wilk tests), and homoscedasticity. Post hoc comparisons used Tukey’s HSD, with α = 0.05. p-values of less than 0.01 and 0.05 were considered extremely significant and significant.
3. Results and Discussion
3.1. Septage Composition Characteristics in the Sewer System
The septage composition characteristics of sewer networks are closely related to greenhouse gas emissions [25]. Therefore, the sewage composition characteristics of the 10 sampling points (W1–W10) from the branch pipe, sub-main pipe, and main pipe were further estimated. The sewage composition of these 10 sampling points are shown in Table 1. As shown in Table 1, the temperature range of the sewer system was 21.4–22.4 °C. The pH in the sewer was within the operating range of anaerobic digestion (neutral pH) [26]. The concentrations of dissolved oxygen (DO) and the value of ORP at the pipe network inlet (W1) were 4.39 mg/L and −154.6 mv, respectively. This means the inlet well of the sewer was not in a strictly anaerobic environment [27]. The low DO concentration and ORP indicated that the sampling sites W2–W9 were under anaerobic conditions [26]. This result indicates that there may be active anaerobic digestion in this section of the pipe network [28]. Interestingly, reoxygenation occurred at W10, and the DO concentration was approximately 5.01 mg/L. W10 was the influent well of the WWTP, and the unsealed W10 destroyed the strict anaerobic environment of the pipe network. Many studies have found that large amounts of CH4 transported by sewer systems can be released into the environment at unsealed entrances to wastewater treatment plants [24]. Moreover, the results in Table 1 show that the COD loss in the branch pipe and sub-main pipe were 118.6 mg/L and 61.6 mg/L. The corresponding loss rates were 27.1% and 14.1%, respectively. There was almost no loss of COD in the municipal main pipes. This shows that the main organic loss of the sewer system occurs in the branch pipe and sub-main pipe at a low flow rate, which is consistent with many reports [21,32]. Some studies believe that the organic matter consumed in sewer networks is not only used by microorganisms attached to the pipe network to release CH4 and H2S but also leads to insufficient carbon sources in the downstream WWTP, affecting the pollutant treatment efficiency of the sewage treatment plant [2,33]. At present, many sewage treatment plants in China are facing a shortage of carbon sources for influent water. A large amount of additional carbon sources are required to maintain the stable operation of the WWTP, incurring a large additional cost [34,35]. According to the results of this study, the loss of organic carbon sources in the sewage transportation process mainly occurs in the branch pipes and sub-main pipes of the pipe network (approximately 41.2%). Therefore, effective strategies should be developed to improve sewage transportation efficiency and reduce the loss of organic carbon sources in the future. Additionally, the flow rates in the branch pipe (W1–W4), sub-main pipe (W4–W7), and main pipe (W7–W10) in the pipe network were 0–0.32 m/s, 0.19–0.42 m/s, and 0.41–1.05 m/s (Table 1), respectively. A low flow rate not only leads to the sedimentation of particulate organic matter (PCOD) in sewage but also increases the efficiency of anaerobic biofilm microorganisms using organic matter for life metabolism. Moreover, sewage discharge in the community is significantly lower at night than during the day [14]. In the period of low sewage discharge, it is reported that the hydraulic residence time (HRT) of sewage in the pipe network could be extended, which would improve the COD utilization efficiency of active microorganisms in the pipe network system [27]. On the one hand, the slow flow rate led to the deposition of PCOD in the branch pipe and sub-main pipe; on the other hand, the extension of the HRT of the biological sewage in the community branch pipe increased the utilization efficiency of microorganisms in dissolving organic matter (SCOD). Therefore, the reason for the high COD loss in the branch pipe may be caused by the deposition of PCOD and the consumption of organic matter by microorganisms. The results in Table 1 further show that there was almost no change in the concentration of nitrogen during pipe network transportation.

Table 1.
Septage composition and relevant sewer system conditions in the W1–W10 sampling sites.
3.2. Analysis of GHG Emission Flux in the Sewer System
3.2.1. Emission Fluxes of CH4, CO2, and N2O in the Sewer System
Sewer systems are a critical source of carbon emissions, especially methane [23]. It is of great significance to calculate the carbon emission flux of sewer systems for taking effective measures to control carbon emissions. As shown in Figure 2, the main forms of carbon emissions in the sewer system were methane and carbon dioxide, and nitrous oxide was almost negligible (approximately 1.6%). The emission fluxes of methane and carbon dioxide from the sewer system were 0.87 kg CO2-eq/m3 and 0.51 kg CO2-eq/m3 (Figure 2A), respectively, accounting for 62% and 36.4% of the total greenhouse gas emissions. The statistical results showed that the emission equivalent of methane and carbon dioxide was significantly higher than that of nitrous oxide (Figure 2). Furthermore, methane and carbon dioxide emissions accounted for 98.4% of total greenhouse gas emissions (Figure 2B). This is consistent with the results of many studies [1]. For instance, the results of Jin et al. [23] showed that the main forms of emission were methane (approximately 33.0%) and carbon dioxide (approximately 66.9%) in sewer systems. The production and discharge of nitrous oxide in sewer systems are rarely reported. This may be due to the almost non-existence of denitrification in the sewage network [14]. Moreover, it is reported that septic tanks produce many CH4 and CO2 emissions. For instance, Loi Tan Huynh et al. [29] found that methane and carbon dioxide emission rates from septic tanks were 11.92 and 20.24 g/cap/day, respectively, whereas nitrous oxide emissions were negligible. Nevertheless, most studies on nitrous oxide emissions from sewage facilities have identified wastewater treatment plants as significant sources of nitrous oxide emissions [36]. For methane, 62% of GHG emissions were in the form of methane (Figure 2B), which may be due to the anaerobic environment of the branch pipe and sub-main pipe being conducive to the growth and energy metabolism of methanogenic archaea [1]. It is reported that methanogenic archaea are sensitive to oxygen and easily inhibited by oxygen [37]. Methane generated in sewer systems not only leads to many carbon emissions but also has an important impact on influent carbon source concentrations and methane emissions in downstream wastewater treatment plants [24]. In general, microorganisms can convert organic matter into volatile fatty acids (VFAs) through hydrolysis fermentation under an anaerobic environment, and then, methanogens can metabolize methane using VFAs, such as acetic acid, as substrates [18]. Methane production in sewers consumes organic matter in sewage, resulting in low COD concentrations in wastewater treatment plant influents. Furthermore, the results of Yin et al. [27] showed that about 90% of methane emissions from wastewater treatment plants are related to sewer system transportation. The study further confirmed that about 58% of wastewater plant methane emissions come from dissolved methane delivered by sewer systems, and about 32% of methane emissions come from sewer headspace [38]. Therefore, it is of great significance to continuously pay attention to the methane emissions of sewer systems and take effective measures to control the methane production of carbon emissions in urban sewage facilities.
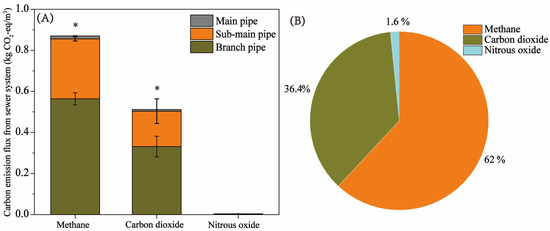
Figure 2.
GHG (CH4, CO2, and N2O) emission fluxes and emission ratios in the sewer system. (A) Emission fluxes of CH4, CO2, and N2O in the sewer system. (B) Carbon emission ratios of CH4, CO2, and N2O in the sewer system. * denotes a significant level.
3.2.2. Location Analysis of GHG Emissions in the Sewer System
The location analysis of GHG emissions in the sewer system contributed to taking measures to reduce carbon emissions. Figure 3 shows the carbon emission fluxes of the branch pipe, sub-main pipe, and main pipe in the sewer system. As shown in Figure 3A, the carbon emission fluxes from the branch pipe and the sub-main pipe were 0.89 kg CO2-eq/m3 and 0.47 kg CO2-eq/m3, respectively. The corresponding carbon emission ratios of the branch pipe and sub-main pipe were 64.8% and 33.6%, respectively (Figure 3B). This indicates that the carbon emission of the sewer system was mainly distributed in the branch pipe and the sub-main pipe. Moreover, the statistical results showed that the GHG emission flux of the branch pipe was extremely significantly higher than that of the main pipe, and the GHG emission flux of the sub-main pipe was significantly higher than that of the main pipe. The results suggest that more attention should be paid to carbon emissions at the community level in the control of GHG emissions in sewage networks. The results of the septage composition characteristics showed that the flow rate was low in the branch pipe and the sub-main pipe (Table 1). A low flow rate in the process of sewage transportation leads to the settlement of particulate organic matter and the formation of sediment in the sewer. It was reported that the sewer sediment is shaped by enriched biologically active substrates involving syntrophic interactions between fermentation bacteria and methanogens [39]. Liu et al. [14] also found that methane and sulfide production in sewer networks is mainly located in the sediment interface layer. The low flow rate leads to the sedimentation of particulate organic matter [40]. The active organic matter in the biofilm is hydrolyzed and fermented and finally produces methane. Therefore, significantly higher GHG emission fluxes in the branch pipe and sub-main pipe than in the main pipe lead to a lower water flow rate. Furthermore, the carbon emission flux from the main pipe was only 0.023 kg CO2-eq/m, and the corresponding carbon emission ratio was 1.6%. The flow rate of the municipal main pipe was usually high, resulting in a reoxygenation phenomenon (Table 1). It may be concluded that these characteristics of the main pipe lead to low methane production and emission. Therefore, the results indicate that effective measures should be taken to reduce the GHG emissions of sewer systems from branch pipes and sub-main pipes.
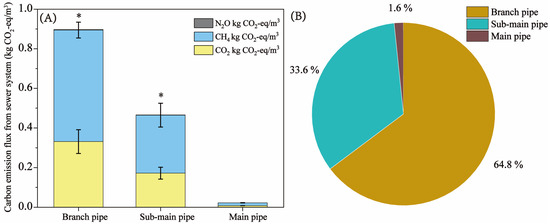
Figure 3.
Carbon emission fluxes and emission ratios in the sewer system. (A) Carbon emission fluxes of the branch pipe, sub-main pipe, and main pipe in the sewer system. (B) Carbon emission ratios of the branch pipe, sub-main pipe, and main pipe in the sewer system. * means a significant level.
3.3. Assessment of the Methane Production Rate in Sewer Sediments
The methane emitted by sewer systems is mainly produced by microorganisms in sediments [39]. Recent studies have demonstrated that the contributions of sewer sediments to methane production cannot be ignored when evaluating methane emissions [21]. Therefore, it is of great significance to evaluate the methane production activity of sediments in sewers for the assessment of methane emission fluxes. Sediment samples from the branch pipe (W2), sub-main pipe (W5), and main pipe (W9) were collected, and the methane production rate of the sewer sediments was further evaluated by a batch experiment. As shown in Figure 4, the highest methane production rate in the sewer sediments was from W2, followed by W5, and the lowest was from W9. The methane production rates of the sediment samples from W2 and W5 were 7.5 mg-CH4/(g·h) and 5.8 mg-CH4/(g·h), respectively. The results indicate that the sediments in the branch pipe and sub-main pipe had high methanogenic activity. However, the methane production rate in this study was less than that reported by Liu et al. [14]. Liu et al. [14] found that the average methane production rate was 1.56 ± 0.14 g CH4/(m2·d) in sewer sediments. The reason may be the methane yield of the mixed samples of sewer sediments assessed in this study, while the study by Liu et al. [24] assessed the methane yield of the active layer at the water–sediment interface. Many studies have confirmed that the water–sediment interface layer of sewage is rich in microorganisms and has a high methane production rate [18]. According to Foley et al. [12], the average methane production rate is 1.56 ± 0.14 g CH4/m2 in a rising main sewer pipe. This suggests that the active interface is the main area of methane production in both the rise and gravity networks. Therefore, most of the strategies adopted to control hydrogen sulfide and methane emissions in sewers are achieved by inhibiting microbial activity in the water–solid interface layer [41,42]. The methane production rate of the sediment sample from W9 was significantly lower than that of the W2 and W5 sediment samples (Figure 4), at approximately 1.8 mg-CH4/(g·h). This suggests that the results of the estimated methane emission flux in the main pipe, being lower than that in the branch pipe and sub-main pipe, was credible (Figure 3). Nevertheless, it was reported that sediment is not the only source of methane in sewer systems—biofilms attached to the inner walls of pipe networks are also important sources of methane production [1].
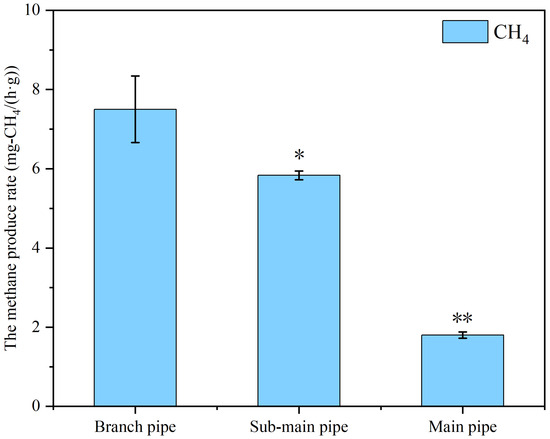
Figure 4.
The methane production potential in the sediments of the branch pipe, sub-main pipe, and main pipe. * means a significant level, ** means extremely significant level.
3.4. Microbial Community Structure Analysis
The methane discharged from sewer systems is produced by the synergistic hydrolytic microorganisms, fermentation microorganisms, and methanogens in the sediment [21]. In this study, sediment samples located in the branch pipe (W2), sub-main pipe (W5), and the main pipe (W9) were collected to analyze the microbial community structure. As shown in Figure 5A, the microbial structure of the branch pipe, the sub-main pipe, and the main pipe were similar. The dominant bacteria genera in the sewer system were Pseudomonas, Acinetobacter, and Bifidobacterium. Pseudomonas and Acinetobacter, which efficiently break down protein and glucose, are common microorganisms in sewer systems [43]. Domestic sewage is rich in protein and cellulose, which are compounds that cannot be directly used by microorganisms. Macromolecular organic matter such as protein and cellulose needs to be hydrolyzed into monosaccharides by hydrolyzing microorganisms before it can be used by microorganisms [20,44,45]. As shown in Figure 5A, in W2 and W5, Pseudomonas accounted for 26.3% and 27.4% and Acinetobacter accounted for 16.6% and 6.3%, respectively. The water flow rate of the W2 and W5 pipes was low (Table 1), and a large amount of particulate organic matter was deposited in W2 and W5. Large molecular organic matter was deposited at low flow rates upstream (i.e., in the branch pipe and sub-main pipe) and was hydrolyzed to small molecular organic matter by hydrolyzing microorganisms. These macromolecules of organic matter are hydrolyzed by hydrolyzing microorganisms into small molecules of organic matter, which are then utilized by fermentation microorganisms and produce VFAs. Therefore, it is reasonable that a high relative abundance of microorganisms with the function of hydrolyzing macromolecular organic matter are widely distributed in the sediments of the W2 and W5 pipes. As shown in Figure 5A, the relative abundance of Pseudomonas dropped to 5.8% at W9. This may be due to the fast flow of water and less sediment at W9. As shown in Figure 5B, the distribution analysis of methanogenic archaea showed that methanogenic bacteria in W2 mainly included Methanobacterium, Methanosaeta, Methanobrevibacter, and Methanospirillum. The relative abundance of these methanogenic archaea was 1.92%, 1.42%, 0.43%, and 0.06%, respectively. In the sub-main pipe in the sewer system (W5), the dominant methanogenic archaea were Methanobacterium, Methanosaeta, and Methanobrevibacter, with a relative abundance of 1.33%, 0.23%, and 0.43%, respectively. However, the species of methanogenic archaea at W9 only included Methanobacterium and Methanosaeta, with a relative abundance of 0.31% and 0.26%. The high flow rate at W9 and the increase in DO concentrations may be the reason for the decrease in the relative abundance of methanogenic archaea. These results indicate that sediments in sewer branches have active methane-producing activity. These results further confirm that the higher methanogenic activity of sediment in the sewer system is in branch pipes and sub-main pipes. It is reported that Methanobacterium generates methane via the hydrogenotrophic methanogenesis pathway, utilizing H2/CO2 as substrates [15]. In contrast, Methanosaeta represents obligate acetoclastic methanogens, which are exclusively dependent on acetate as their carbon and energy source [15]. Notably, Methanobrevibacter exhibits a hydrogenotrophic dominance characterized by competitive hydrogen scavenging in complex microbial consortia [22]. These archaea drive methane emissions in sewer sediments, particularly in low-flow regions, where settled particulate organic carbon (PCOD) undergoes hydrolysis and methanogenesis [23]. The presence of these methanogens further confirms that low-flow areas in pipe networks (e.g., branch pipes) are the main sources of methane emissions. Therefore, targeted mitigation strategies are needed in wastewater infrastructure. Additionally, Desulfobulbus, a type of sulfate-reducing bacteria (SRB), was detected in the sewer system (Figure 5A). The relative abundance of Desulfobulbus in W2, W5, and W9 were 2.1%, 1.5%, and 0.3%, respectively. SRB can reduce sulfates in sewage to hydrogen sulfide (H2S), and gaseous H2S not only produces a foul odor but also poses a hazard to human health [46]. Jin et al. [46] conducted a Spearman rank correlation analysis among microbial communities, environmental factors, and substrates and identified a covariation between microbial community distribution and organic matter metabolism along the sewer system. In this study, it was found that carbon emissions from the sewer system were mainly concentrated in the branch pipe and the sub-main pipe. The low water flow rate in these parts would lead to the deposition of particulate organic matter in the sewage, which would be utilized by microorganisms in the biofilm to produce carbon dioxide and methane emissions. Furthermore, the sediment in the low-flow zone of the pipeline network is rich in SRB, which can produce hydrogen sulfide gas. Therefore, it is necessary to control greenhouse gas emissions and hydrogen sulfide gas in branch pipes and sub-main pipes in sewer systems.
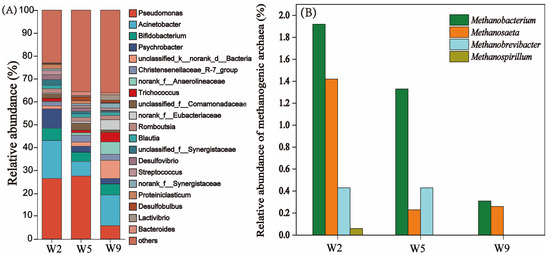
Figure 5.
(A) The relative abundance of microbiomes in the sewer system. (B) Relative abundance of methanogenic archaea in the sewer system.
In conclusion, the contemporary urban sewage network of China faces a myriad of problems. It is vital to improve both the quality and transport efficiency of the sewer system. On the one hand, the loss of carbon sources caused by pipe networks hampers the treatment efficiency of WWTP. The efficient removal of pollutants can only occur after numerous additional carbon sources are added to the wastewater treatment process. This results in additional carbon source costs and extra GHG emissions. For instance, according to the study by Yin et al. [27], nearly 90% of CH4 emissions during the wastewater treatment process in Beijing’s sewage treatment plants is transported through the sewage pipes, and this can even affect emissions in the aerobic zones of biological treatment processes. Furthermore, the study found that methane emissions from wastewater treatment plants are correlated with community water consumption and have a strong correlation with the influent COD [23]. On the other hand, the urban sewer system is a predominant source of methane emissions. Large amounts of methane emissions exacerbate the greenhouse effect and cause serious environmental problems while also posing potential threats to urban safety and human health. Significant improvements to the holistic quality and efficiency of urban sewage networks are necessary to reduce the loss of organic carbon sources and methane emissions during sewage transportation. Unfortunately, the transformation of urban sewer systems necessitates relatively high monetary costs and time. In particular, in some underdeveloped areas, it is very difficult to maintain the efficient and regular maintenance of the sewer system because it involves a large amount of municipal management resources, including personnel and money. Therefore, in the construction of sewer systems, effective municipal planning and adhering to the separation of rain and pollution may be the way to improve the efficiency of sewage pipe network transportation in less developed areas. It is worth noting that the municipal sewer system selected in this study is located in Xiamen, in the south of China. The climate of Xiamen is characterized by mild winters and moderate summers, with the annual average temperature of the city’s sewage network ranging between 15 and 25 °C. However, in regions with more pronounced seasonal variations, it is crucial to consider the impact of seasonal changes on carbon emissions. Moreover, regional differences and living habits may have impacts on GHG emissions from municipal sewer systems in different regions. In addition, in the rainy season, seepage from urban sewers may lead to increases in the water network and the speed of water flow. Therefore, it is necessary to further explore the greenhouse gas emission characteristics of municipal pipe networks in different seasons. The results of this study highlight that the carbon source loss and methane emissions of urban sewer systems are predominantly concentrated in the branch pipe section at the community level. More attention should therefore be paid to improving the quality and efficiency of the branch pipe section at this juncture. In the future, a more accurate assessment of GHG emission fluxes and sources in urban sewage network systems will be of great significance. A method to estimate total sewer methane based on emission factors and official statistics has proved feasible [11]. Additionally, life cycle assessments (LCAs) are widely used in the environmental risk assessment and greenhouse gas emission control of wastewater plants [47]. In the future, the LCA method would be a reasonable method to evaluate and control greenhouse gas emissions from sewage networks. Moreover, based on the LCA method, the majority of carbon emissions from sewers occur during the operational phase and are significantly higher than those generated during the construction and end-of-life stage [48]. Therefore, controlling carbon emissions during the operation of sewage networks is crucial. Some studies have explored the addition of chemical agents to suppress microbial activity and reduce the production of methane and hydrogen sulfide [1,20]. However, the cost of these chemical additives is prohibitively high. As a result, the development of new control technologies, such as the use of specific bacteriophages, is considered a highly promising approach [24,49].
4. Conclusions
In this study, the water quality characteristics, carbon emission flux, and microbial community structure in a sewer system were estimated. The results indicate that the COD loss rates in the branch pipe and sub-main pipe were 27.1% and 14.1%, respectively. The total carbon emission flux from the sewer system was 1.39 kg CO2-eq/m3, and the carbon emissions in the branch pipe and sub-main pipe accounted for 64.8%, and 33.6% of the total greenhouse gas emissions. Microbial community structure analysis showed that methanogenic archaea in the sediments of the branch pips and sub-main pipe were Methanobacterium, Methanosaeta, and Methanobrevibacter. The effects of seasonal changes on carbon emissions and the relationship between carbon emissions and microorganisms in sewers need to be further explored.
Author Contributions
Conceptualization, L.L. and X.M.; methodology, L.L.; software, Y.S.; validation, X.M.; formal analysis, X.W.; investigation, X.W. and T.Z.; resources, L.L. and C.C.; data curation, J.R.; writing—original draft preparation, L.L.; funding acquisition, X.M. All authors have read and agreed to the published version of the manuscript.
Funding
The author(s) declare that financial support was received for the research, authorship, and/or publication of this article. This research was supported by a project funded by the Priority Academic Program Development of Jiangsu Higher Education Institutions (PAPD), the Natural Science Foundation of Jiangsu Province (No. BK20220682), a project funded by the China Postdoctoral Science Foundation (2022M721398), a project funded by the Postdoctoral Science Foundation of Lianyungang (LYG20230005), and the Innovation and Entrepreneurship Project of Jiangsu Ocean University (SZ202311641631004).
Institutional Review Board Statement
Not applicable.
Informed Consent Statement
Not applicable.
Data Availability Statement
The original contributions presented in the study are included in the article; further inquiries can be directed to the corresponding author.
Conflicts of Interest
The authors declare no conflicts of interest.
References
- Gao, Y.; Shi, X.; Jin, X.; Wang, X.C.; Jin, P. A critical review of wastewater quality variation and in-sewer processes during conveyance in sewer systems. Water Res. 2023, 228, 119398. [Google Scholar] [CrossRef] [PubMed]
- Khabiri, B.; Ferdowsi, M.; Buelna, G.; Jones, J.P.; Heitz, M. Bioelimination of low methane concentrations emitted from wastewater treatment plants: A review. Crit. Rev. Biotechnol. 2022, 42, 450–467. [Google Scholar] [CrossRef]
- Zhang, G.; Wang, G.; Zhou, Y.; Zhu, D.Z.; Zhang, Y.; Zhang, T. Simultaneous use of nitrate and calcium peroxide to control sulfide and greenhouse gas emission in sewers. Sci. Total Environ. 2023, 855, 158913. [Google Scholar] [CrossRef] [PubMed]
- Shi, X.; Liu, W.; Xu, D.; Hou, Y.; Ren, B.; Jin, X.; Wang, X.C.; Jin, P. Metagenomics analysis of ecosystem integrating methane and sulfide generation in urban sewer systems. J. Clean. Prod. 2023, 382, 135372. [Google Scholar] [CrossRef]
- Gholkar, P.; Shastri, Y.; Tanksale, A. Renewable hydrogen and methane production from microalgae: A techno-economic and life cycle assessment study. J. Clean. Prod. 2021, 279, 123726. [Google Scholar] [CrossRef]
- Griffith, D.R.; Barnes, R.T.; Raymond, P.A. Inputs of fossil carbon from wastewater treatment plants to US rivers and oceans. Environ. Sci. Technol. 2009, 43, 5647–5651. [Google Scholar] [CrossRef]
- Rodriguez-Garcia, G.; Hospido, A.; Bagley, D.M.; Moreira, T.; Feijoo, G. A methodology to estimate greenhouse gases emissions in life cycle inventories of wastewater treatment plants. Environ. Impact Asses. Rev. 2012, 37, 37–46. [Google Scholar] [CrossRef]
- Liao, Z.; Chu, J.; Zhou, S.; Chen, H. Evaluation of the pollutant interactions between different overlying water and sediment in simulated urban sewer system by excitation-emission matrix fluorescence spectroscopy. Environ. Sci. Pollut. Res. 2022, 29, 46188–46199. [Google Scholar] [CrossRef]
- Chen, J.J.; Wang, H.C.; Yin, W.X.; Wang, Y.Q.; Lv, J.Q.; Wang, A.J. Deciphering carbon emissions in urban sewer networks: Bridging urban sewer networks with city-wide environmental dynamics. Water Res. 2024, 256, 121576. [Google Scholar] [CrossRef]
- Du, W.J.; Lu, J.Y.; Hu, Y.-R.; Xiao, J.; Yang, C.; Wu, J.; Huang, B.; Cui, S.; Wang, Y.; Li, W.W. Spatiotemporal pattern of greenhouse gas emissions in China’s wastewater sector and pathways towards carbon neutrality. Nat. Water 2023, 1, 166–175. [Google Scholar] [CrossRef]
- Zhu, H.; Wang, Q.; Liu, J.; Zheng, X.; Xu, M. Closing the gap in methane emission from urban wastewater sewer system in China. J. Clean. Prod. 2024, 437, 140722. [Google Scholar] [CrossRef]
- Foley, J.; Yuan, Z.; Lant, P. Dissolved methane in rising main sewer systems: Field measurements and simple model development for estimating greenhouse gas emissions. Water Sci. Technol. 2009, 60, 2963–2971. [Google Scholar] [CrossRef] [PubMed]
- Beelen, B.; Parker, W. A probabilistic approach to the quantification of methane generation in sewer networks. J. Environ. Manag. 2022, 320, 115775. [Google Scholar] [CrossRef]
- Liu, S.; Liu, K.; Wang, K.; Chen, X.; Wu, K. Fossil-fuel and food systems equally dominate anthropogenic methane emissions in China. Environ. Sci. Technol. 2023, 57, 2495–2505. [Google Scholar] [CrossRef]
- McIlroy, S.J.; Leu, A.O.; Zhang, X.; Newell, R.; Woodcroft, B.J.; Yuan, Z.; Hu, S.; Tyson, G.W. Anaerobic methanotroph ‘Candidatus Methanoperedens nitroreducens’ has a pleomorphic life cycle. Nat. Microbiol. 2023, 8, 321–331. [Google Scholar] [CrossRef]
- Moore, D.P.; Li, N.P.; Wendt, L.P.; Castaneda, S.R.; Falinski, M.M.; Zhu, J.J.; Song, C.; Ren, Z.J.; Zondlo, M.A. Underestimation of sector-wide methane emissions from United States wastewater treatment. Environ. Sci. Technol. 2023, 57, 4082–4090. [Google Scholar] [CrossRef]
- Intergovernmental Panel on Climate Change (IPCC). Direct Global Warming Potentials—AR4 WGI Chapter 2: Changes in Atmospheric Constituents and in Radiative Forcing; IPCC: Geneva, Switzerland, 2007. [Google Scholar]
- Singh, V.; Phuleria, H.C.; Chandel, M.K. Estimation of greenhouse gas emissions from municipal wastewater treatment systems in India. Water. Environ. J. 2017, 31, 537–544. [Google Scholar] [CrossRef]
- Guidelines for Carbon Accounting and Emission Reduction in the Urban Water Sector; IWA Publishing: London, UK, 2022.
- Cen, X.; Li, J.; Jiang, G.; Zheng, M. A critical review of chemical uses in urban sewer systems. Water Res. 2023, 240, 120108. [Google Scholar] [CrossRef] [PubMed]
- Gao, R.; Zhang, Z.; Zhang, T.; Liu, J.; Lu, J. Upstream Natural Pulsed Ventilation: A simple measure to control the sulfide and methane production in gravity sewer. Sci. Total Environ. 2020, 742, 140579. [Google Scholar] [CrossRef]
- Ren, B.; Shi, X.; Chi, Y.; Ren, T.X.; Wang, X.C.; Jin, P. A comprehensive assessment of fungi in urban sewer biofilms: Community structure, environmental factors, and symbiosis patterns. Sci. Total Environ. 2022, 806, 150728. [Google Scholar] [CrossRef]
- Jin, P.; Gu, Y.; Shi, X.; Yang, W. Non-negligible greenhouse gases from urban sewer system. Biotechnol. Biofuels 2019, 12, 100. [Google Scholar] [CrossRef] [PubMed]
- Liu, Y.; Ni, B.J.; Ganigue, R.; Werner, U.; Sharma, K.R.; Yuan, Z. Sulfide and methane production in sewer sediments. Water Res. 2015, 70, 350–359. [Google Scholar] [CrossRef]
- Li, J.; Xu, K.; Liu, T.; Bai, G.; Liu, Y.; Wang, C.; Zheng, M. Achieving stable partial nitritation in an acidic nitrifying bioreactor. Environ. Sci. Technol. 2020, 54, 456–463. [Google Scholar] [CrossRef] [PubMed]
- American Public Health Association (APHA). Standard Methods for the Examination of Water and Wastewater; American Public Health Association: Washington, DC, USA, 2017. [Google Scholar]
- Yin, Y.; Qi, X.; Gao, L.; Lu, X.; Yang, X.; Xiao, K.; Liu, Y.; Qiu, Y.; Huang, X.; Liang, P. Quantifying methane influx from sewer into wastewater treatment processes. Environ. Sci. Technol. 2024, 58, 9582–9590. [Google Scholar] [CrossRef]
- He, C.; Li, J.; Jiang, G.; Chen, S.; Niel, C.; Yuan, Z.; Mueller, J.F.; Thai, P. Transformation of phthalates and their metabolites in wastewater under different sewer conditions. Water Res. 2021, 190, 116754. [Google Scholar] [CrossRef]
- Huynh, L.T.; Harada, H.; Fujii, S.; Nguyen, L.P.H.; Hoang, T.H.T.; Huynh, H.T. Greenhouse gas emissions from blackwater septic systems. Environ. Sci. Technol. 2021, 55, 1209–1217. [Google Scholar] [CrossRef] [PubMed]
- Jia, Y.; Zheng, F.; Maier, H.R.; Ostfeld, A.; Creaco, E.; Savic, D.; Langeveld, J.; Kapelan, Z. Water quality modeling in sewer networks: Review and future research directions. Water Res. 2021, 202, 117419. [Google Scholar] [CrossRef]
- Zhao, Z.; Yin, H.; Xu, Z.; Peng, J.; Yu, Z. Pin-pointing groundwater infiltration into urban sewers using chemical tracer in conjunction with physically based optimization model. Water Res. 2020, 175, 115689. [Google Scholar] [CrossRef]
- Lu, X.; Yan, G.; Fu, L.; Cui, B.; Wang, J.; Zhou, D. A review of filamentous sludge bulking controls from conventional methods to emerging quorum quenching strategies. Water Res. 2023, 236, 119922. [Google Scholar] [CrossRef]
- Kulandaivelu, J.; Choi, P.M.; Shrestha, S.; Li, X.; Song, Y.; Li, J.; Sharma, K.; Yuan, Z.; Mueller, J.F.; Wang, C.; et al. Assessing the removal of organic micropollutants from wastewater by discharging drinking water sludge to sewers. Water Res. 2020, 181, 115945. [Google Scholar] [CrossRef]
- Jin, P.; Wang, B.; Jiao, D.; Sun, G.; Wang, B.; Wang, X.C. Characterization of microflora and transformation of organic matters in urban sewer system. Water Res. 2015, 84, 112–119. [Google Scholar] [CrossRef]
- Chen, H.; Ye, J.; Zhou, Y.; Wang, Z.; Jia, Q.; Nie, Y.; Li, L.; Liu, H.; Benoit, G. Variations in CH4 and CO2 productions and emissions driven by pollution sources in municipal sewers: An assessment of the role of dissolved organic matter components and microbiota. Environ. Pollut. 2020, 263, 114489. [Google Scholar] [CrossRef]
- Somlai, C.; Knappe, J.; Gill, L. Spatial and temporal variation of CO2 and CH4 emissions from a septic tank soakaway. Sci. Total Environ. 2019, 679, 185–195. [Google Scholar] [CrossRef] [PubMed]
- Liu, Y.; Ni, B.J.; Sharma, K.R.; Yuan, Z. Methane emission from sewers. Sci. Total Environ. 2015, 524–525, 40–51. [Google Scholar] [CrossRef]
- Laso-Perez, R.; Wu, F.; Cremiere, A.; Speth, D.R.; Magyar, J.S.; Zhao, K.; Krupovic, M.; Orphan, V.J. Evolutionary diversification of methanotrophic ANME-1 archaea and their expansive virome. Nat. Microbiol. 2023, 8, 231–245. [Google Scholar] [CrossRef] [PubMed]
- Sharma, E.; Sivakumar, M.; Kelso, C.; Zhang, S.; Shi, J.; Gao, J.; Gao, S.; Zhou, X.; Jiang, G. Effects of sewer biofilms on the degradability of carbapenems in wastewater using laboratory scale bioreactors. Water Res. 2023, 233, 119796. [Google Scholar] [CrossRef] [PubMed]
- Chen, H.; Wang, Z.; Liu, H.; Nie, Y.; Zhu, Y.; Jia, Q.; Ye, J. Variable sediment methane production in response to different source-associated sewer sediment types and hydrological patterns: Role of the sediment microbiome. Water Res. 2021, 190, 116670. [Google Scholar] [CrossRef]
- Zuo, Z.; Xing, Y.; Duan, H.; Ren, D.; Zheng, M.; Liu, Y.; Huang, X. Reducing sulfide and methane production in gravity sewer sediments through urine separation, collection and intermittent dosing. Water Res. 2023, 234, 119820. [Google Scholar] [CrossRef]
- Zuo, Z.; Liu, T.; Zheng, M.; Xing, Y.; Ren, D.; Li, H.; Yang, S.; Liu, Y.; Yuan, Z.; Huang, X. Recovery of ammonium nitrate solution from urine wastewater via novel free nitrous acid (FNA)-mediated two-stage processes. Chem. Eng. J. 2022, 440, 135826. [Google Scholar] [CrossRef]
- Xin, K.; Chen, X.; Zhang, Z.; Zhang, Z.; Pang, H.; Yang, J.; Jiang, H.; Lu, J. Trace antibiotics increase the risk of antibiotic resistance genes transmission by regulating the biofilm extracellular polymeric substances and microbial community in the sewer. J. Hazard. Mater. 2022, 432, 128634. [Google Scholar] [CrossRef]
- Zamri, M.F.M.A.; Hasmady, S.; Akhiar, A.; Ideris, F.; Shamsuddin, A.H.; Mofijur, M.; Fattah, I.M.R.; Mahlia, T.M.I. A comprehensive review on anaerobic digestion of organic fraction of municipal solid waste. Renew. Sust. Energy Rev. 2021, 137, 110637. [Google Scholar] [CrossRef]
- Zheng, T.; Li, W.; Ma, Y.; Liu, J. Time-based succession existed in rural sewer biofilms: Bacterial communities, sulfate-reducing bacteria and methanogenic archaea, and sulfide and methane generation. Sci. Total Environ. 2021, 765, 144397. [Google Scholar] [CrossRef] [PubMed]
- Jin, P.; Shi, X.; Sun, G.; Yang, L.; Cai, Y.; Wang, X.C. Co-variation between distribution of microbial communities and biological metabolization of organics in urban sewer systems. Environ. Sci. Technol. 2018, 52, 1270–1279. [Google Scholar] [CrossRef]
- Castagnoli, A.; Ahmed, M.S.; Desideri, U.; Pecorini, I. Environmental assessment of gasification and green hydrogen potential role in waste management decarbonization. J. Clean. Prod. 2024, 482, 144174. [Google Scholar] [CrossRef]
- Roldán, M.; Bouzas, A.; Seco, A.; Mena, E.; Mayor, Á.; Barat, R. An integral approach to sludge handling in a WWTP operated for EBPR aiming phosphorus recovery: Simulation of alternatives, LCA and LCC analyses. Water Res. 2020, 175, 115647. [Google Scholar] [CrossRef]
- Schoelmerich, M.; Ouboter, H.; Sachdeva, R.; Penev, P.; Amano, Y.; West-Roberts, J.; Welte, C.U.; Banfield, J. A widespread group of large plasmids in methanotrophic Methanoperedens archaea. Nat. Commun. 2022, 13, 7085. [Google Scholar] [CrossRef]
Disclaimer/Publisher’s Note: The statements, opinions and data contained in all publications are solely those of the individual author(s) and contributor(s) and not of MDPI and/or the editor(s). MDPI and/or the editor(s) disclaim responsibility for any injury to people or property resulting from any ideas, methods, instructions or products referred to in the content. |
© 2025 by the authors. Licensee MDPI, Basel, Switzerland. This article is an open access article distributed under the terms and conditions of the Creative Commons Attribution (CC BY) license (https://creativecommons.org/licenses/by/4.0/).