
Creating a Thermally Comfortable Environment for Public Spaces in Coastal Villages Considering Both Spatial Genetics and Landscape Elements


Abstract
1. Introduction
2. Materials and Methods
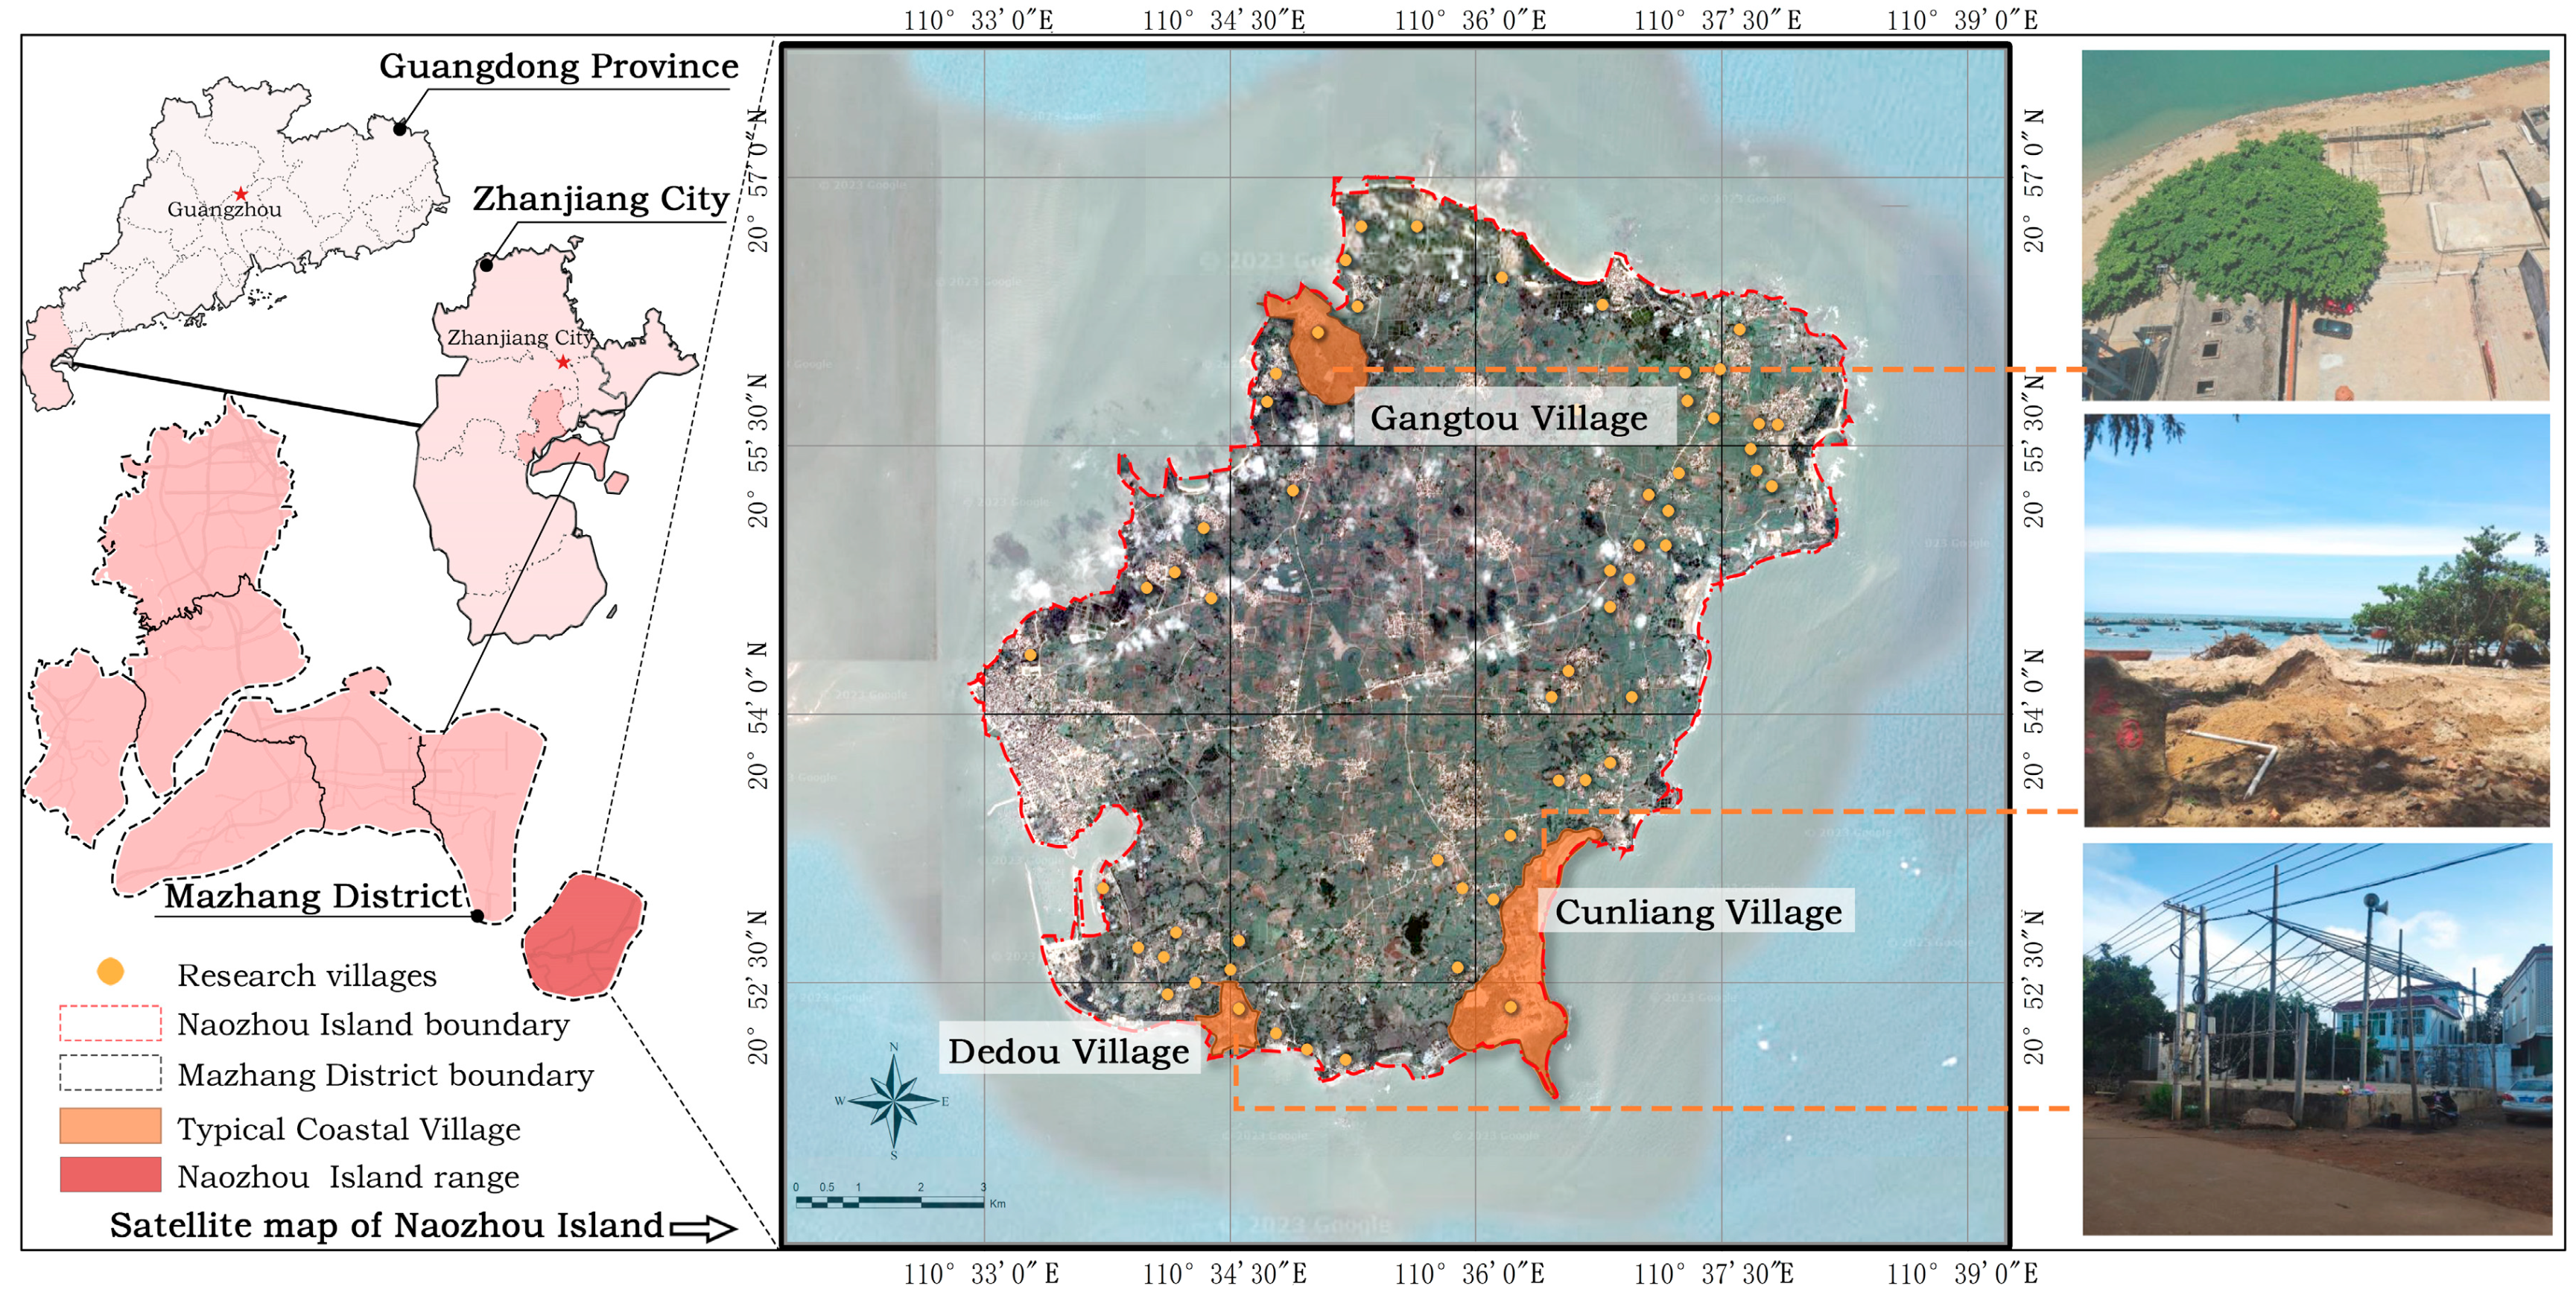
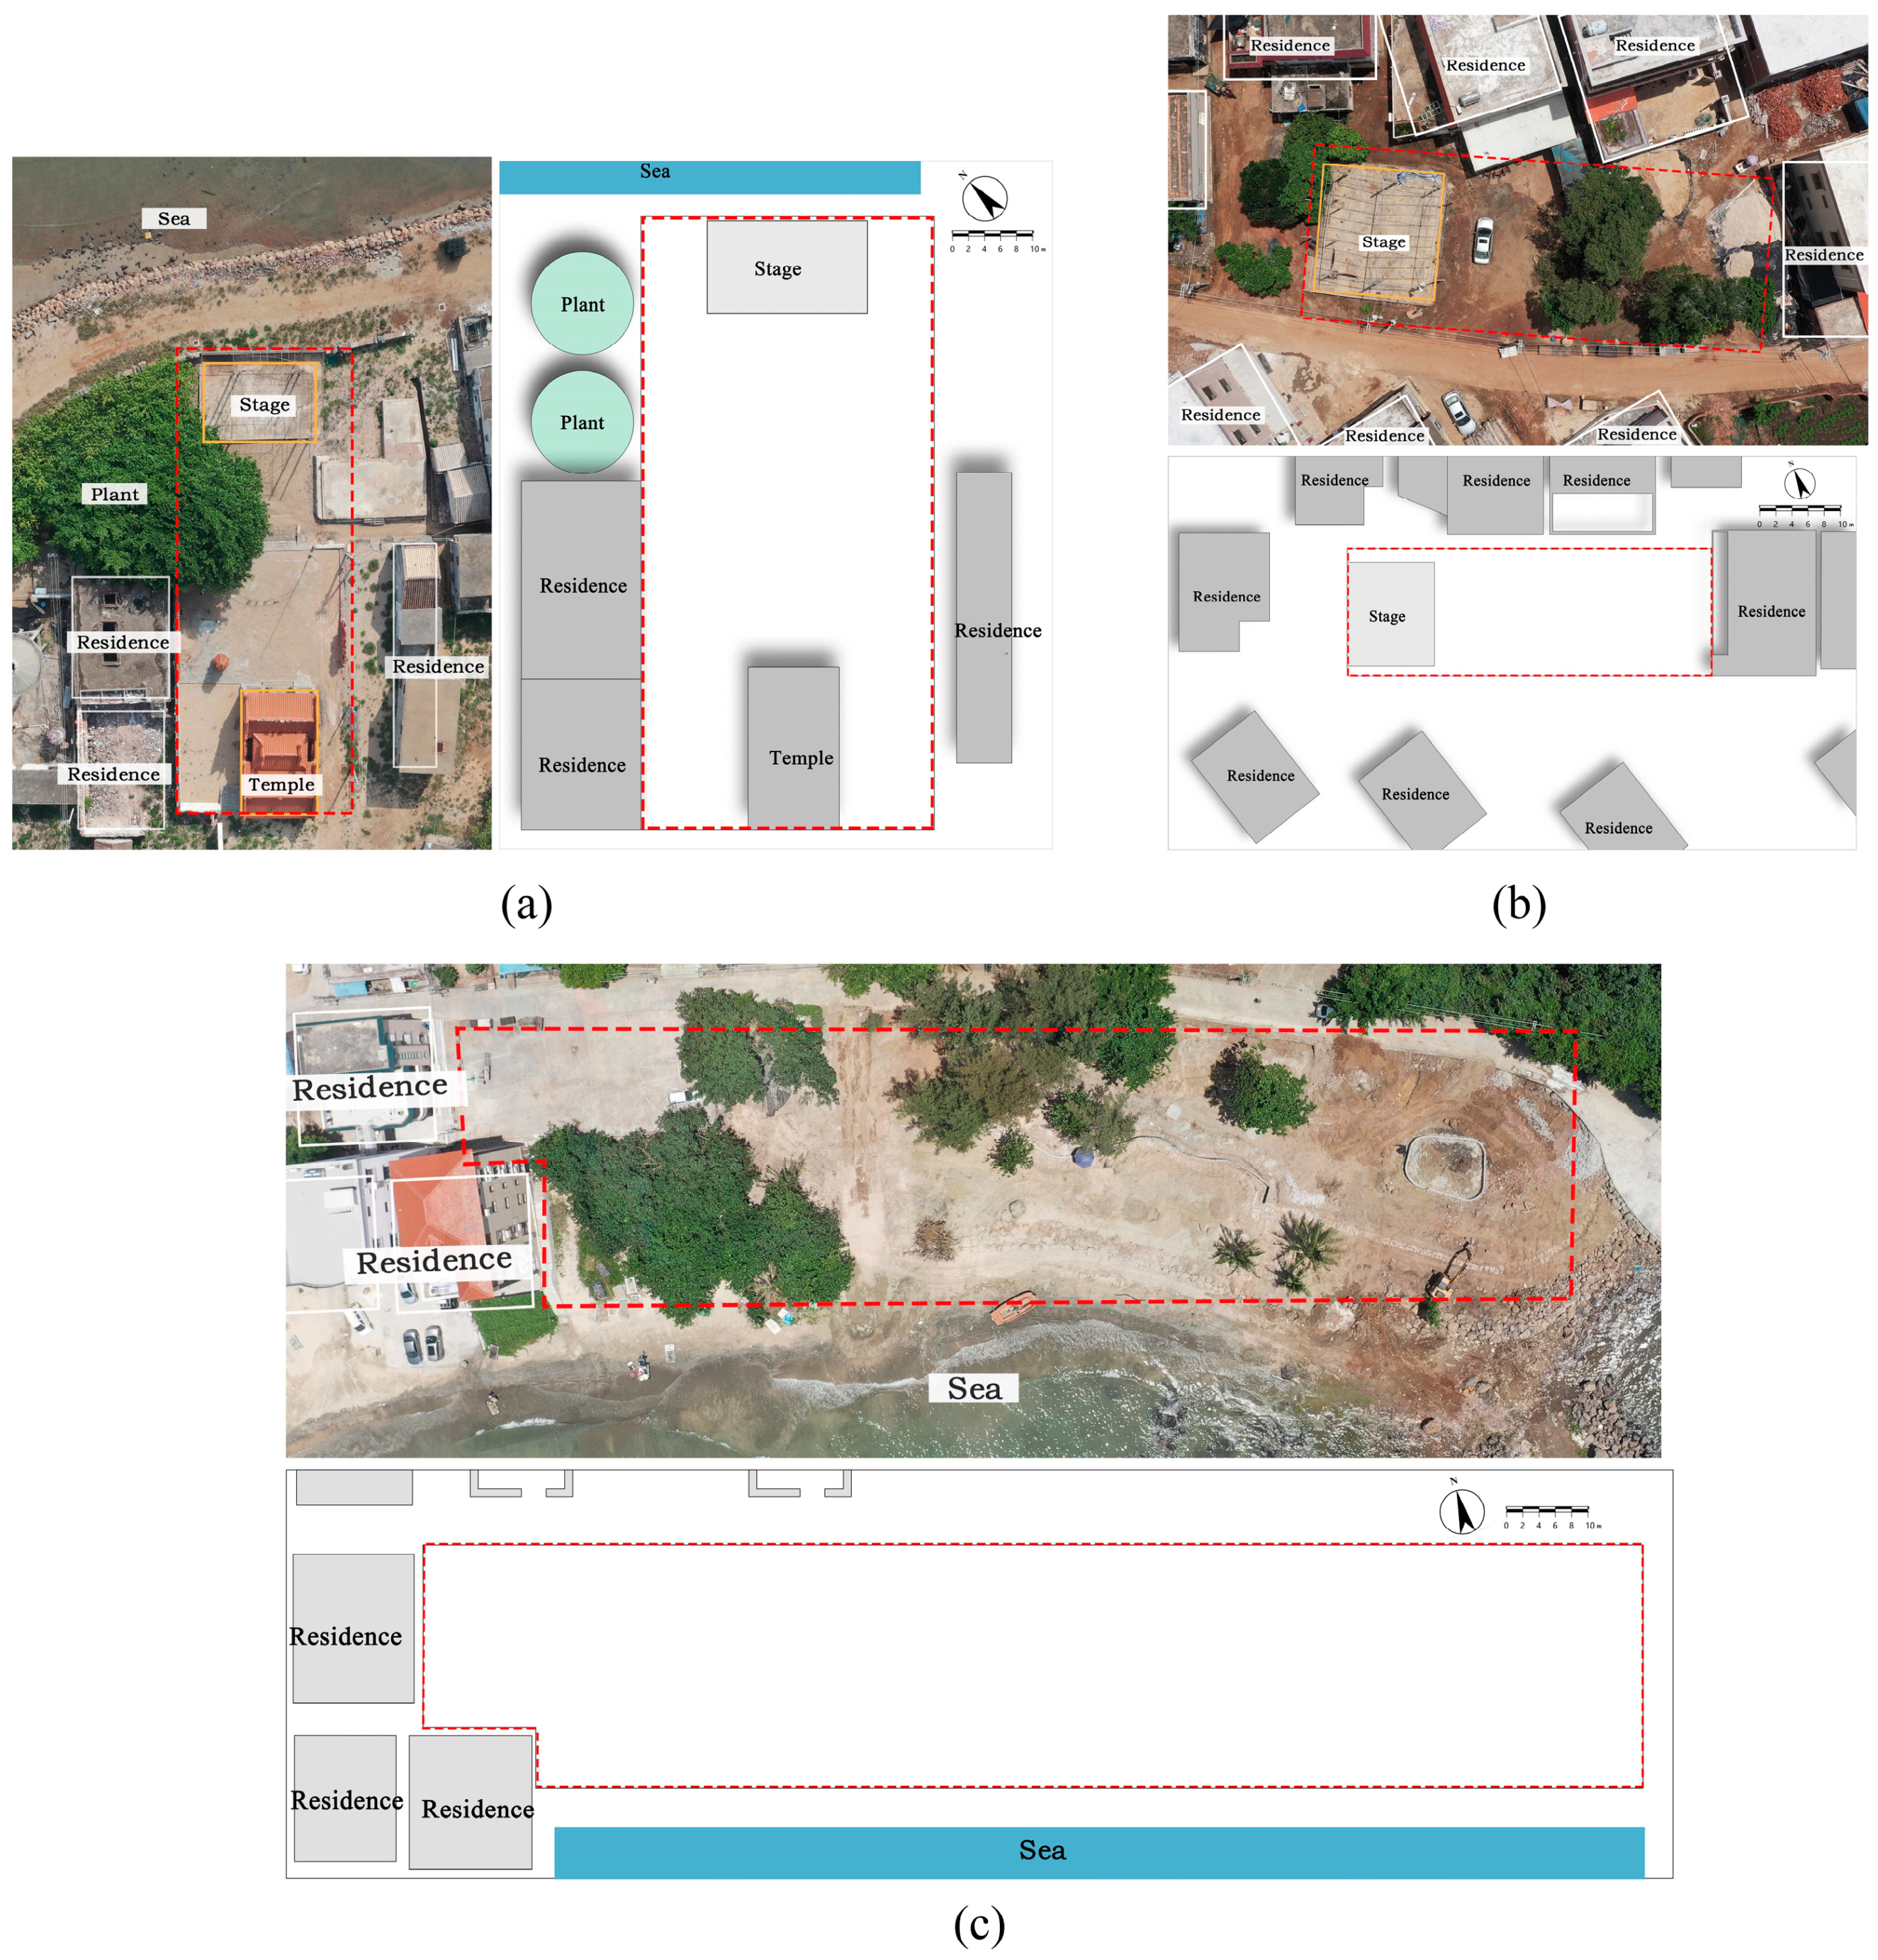
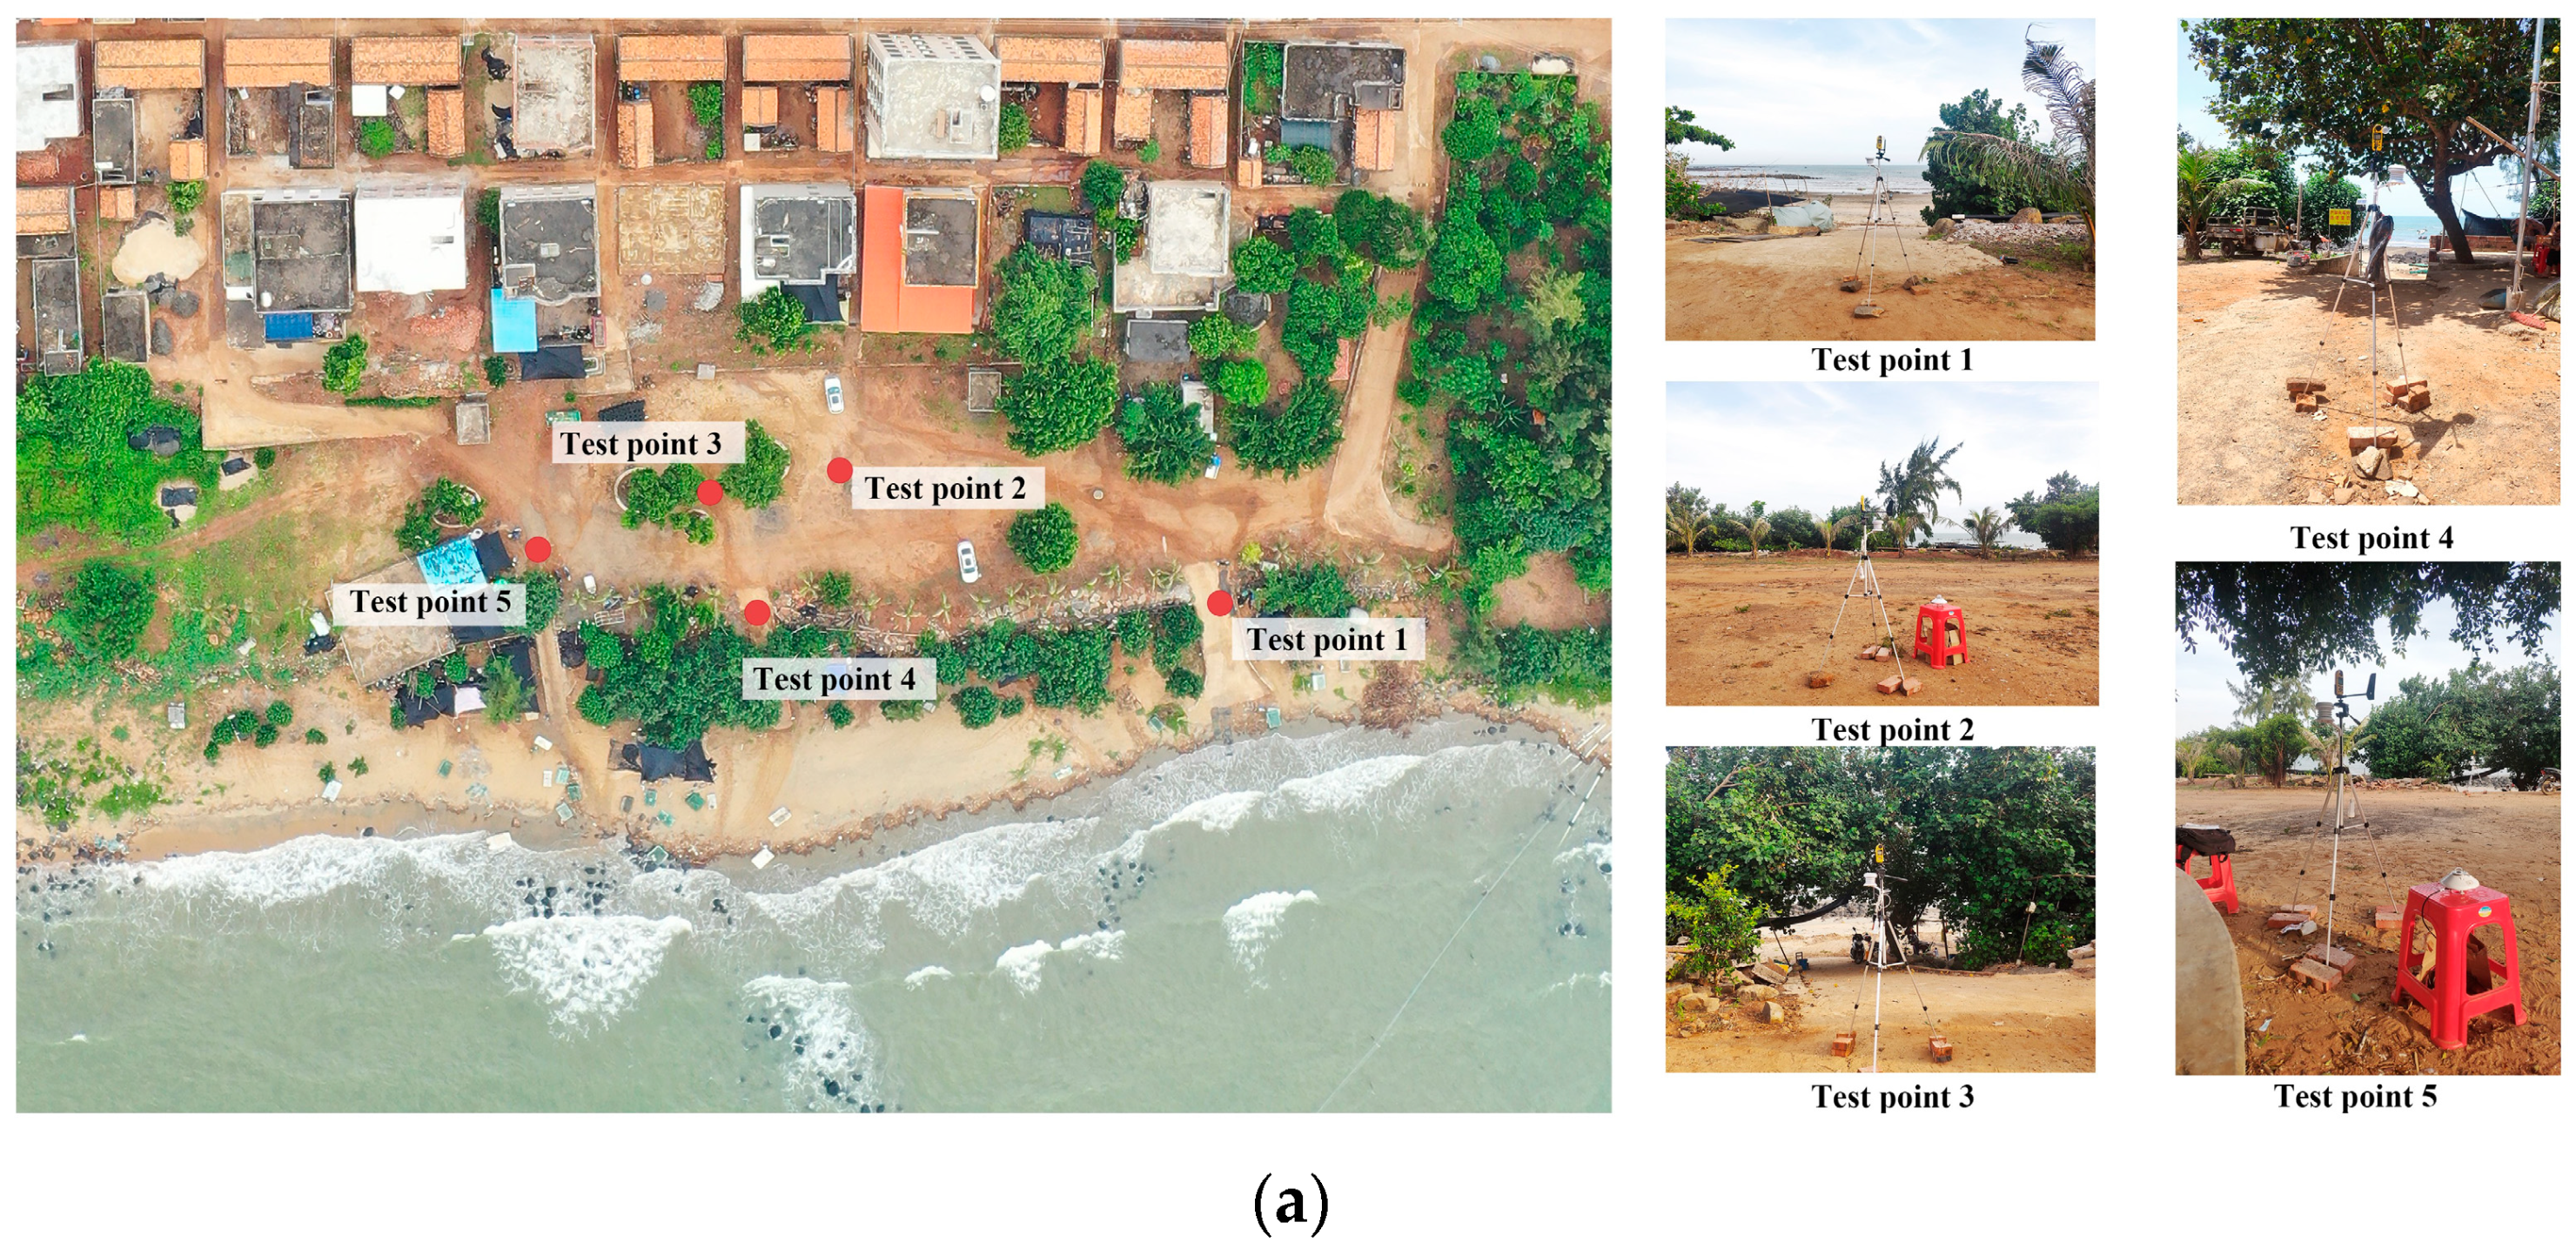
2.1. Study Area
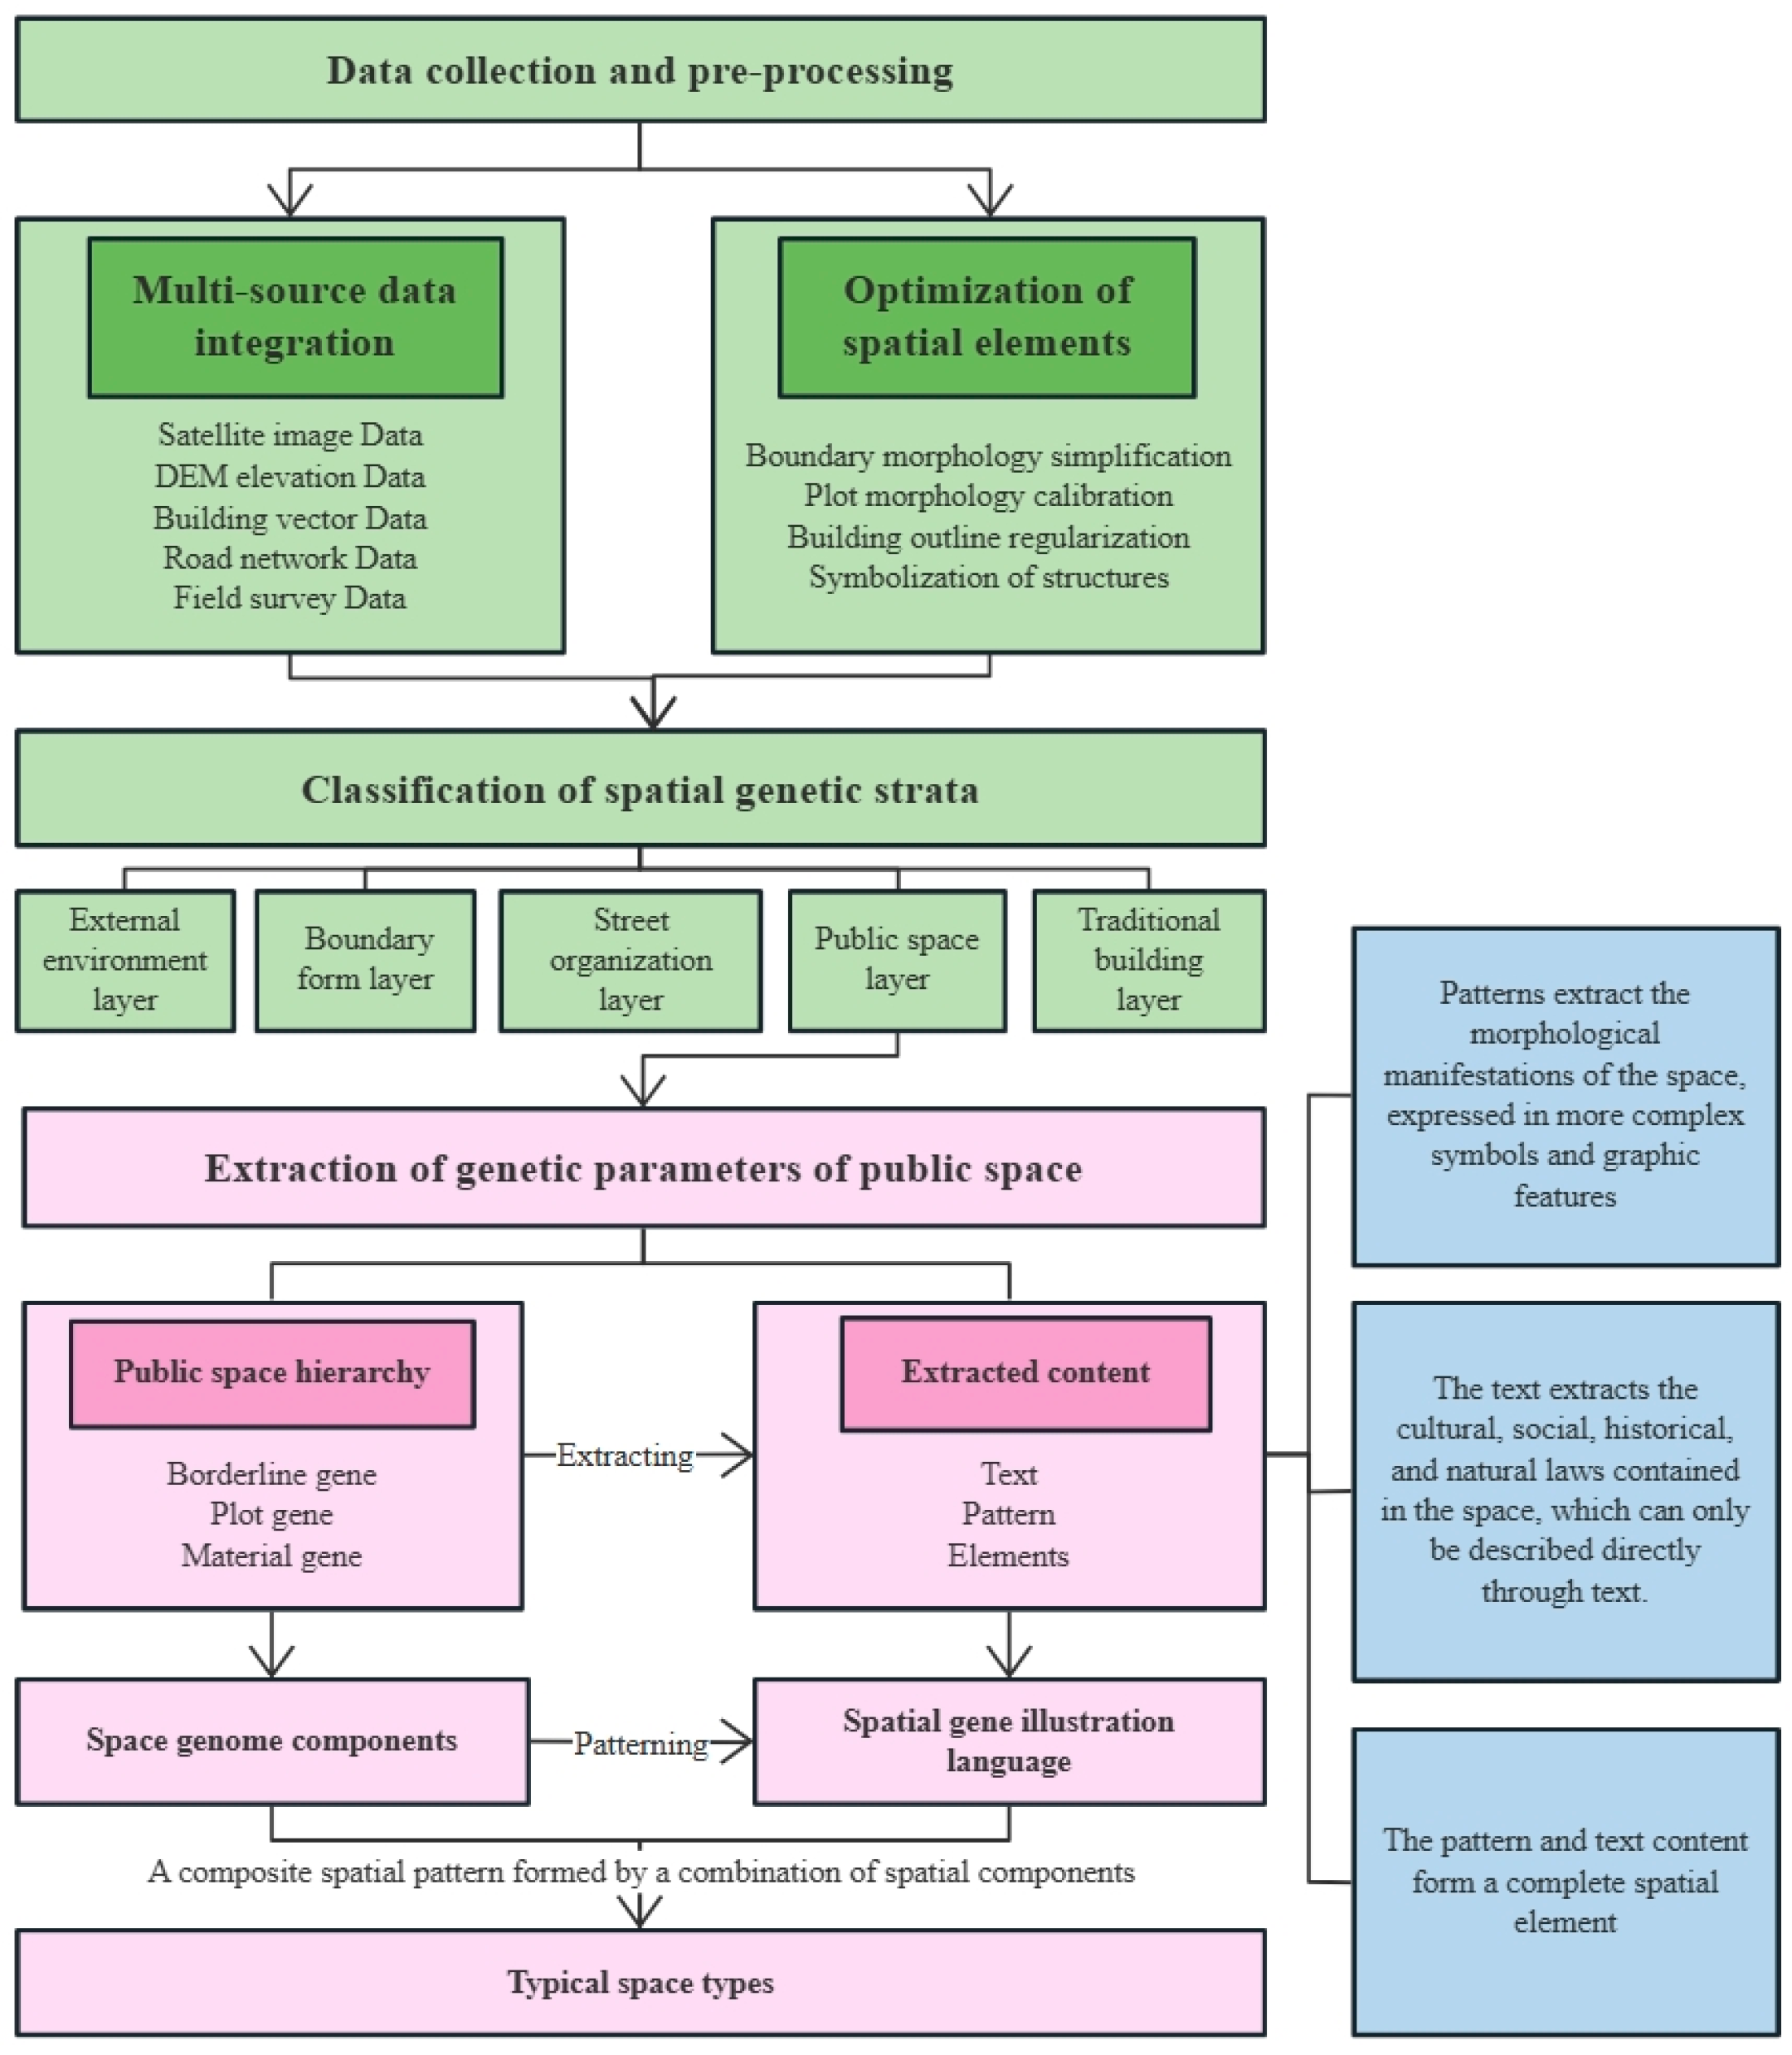
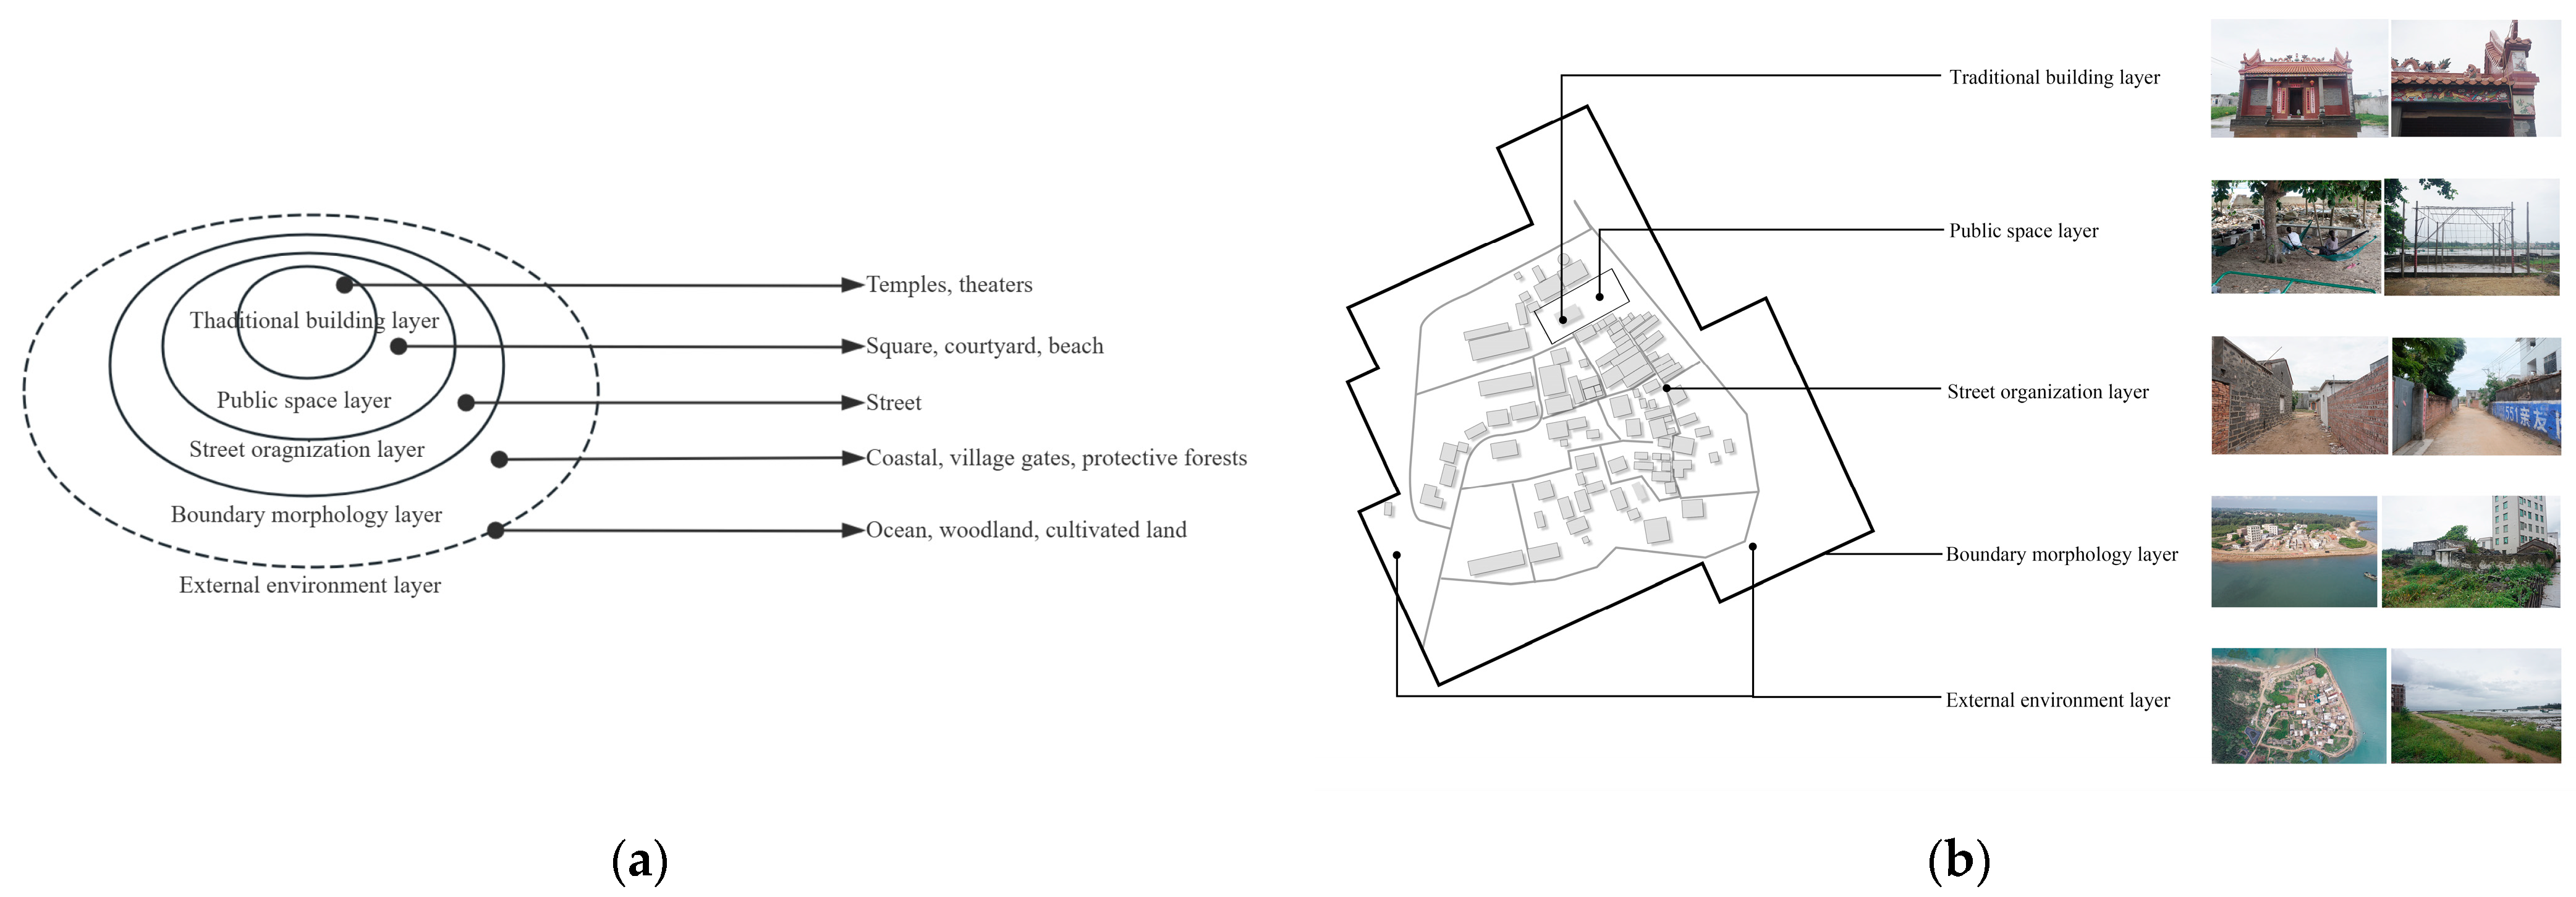
2.2. Plane Characteristics of Public Spaces in Coastal Villages Based on the Spatial Genetic Approach
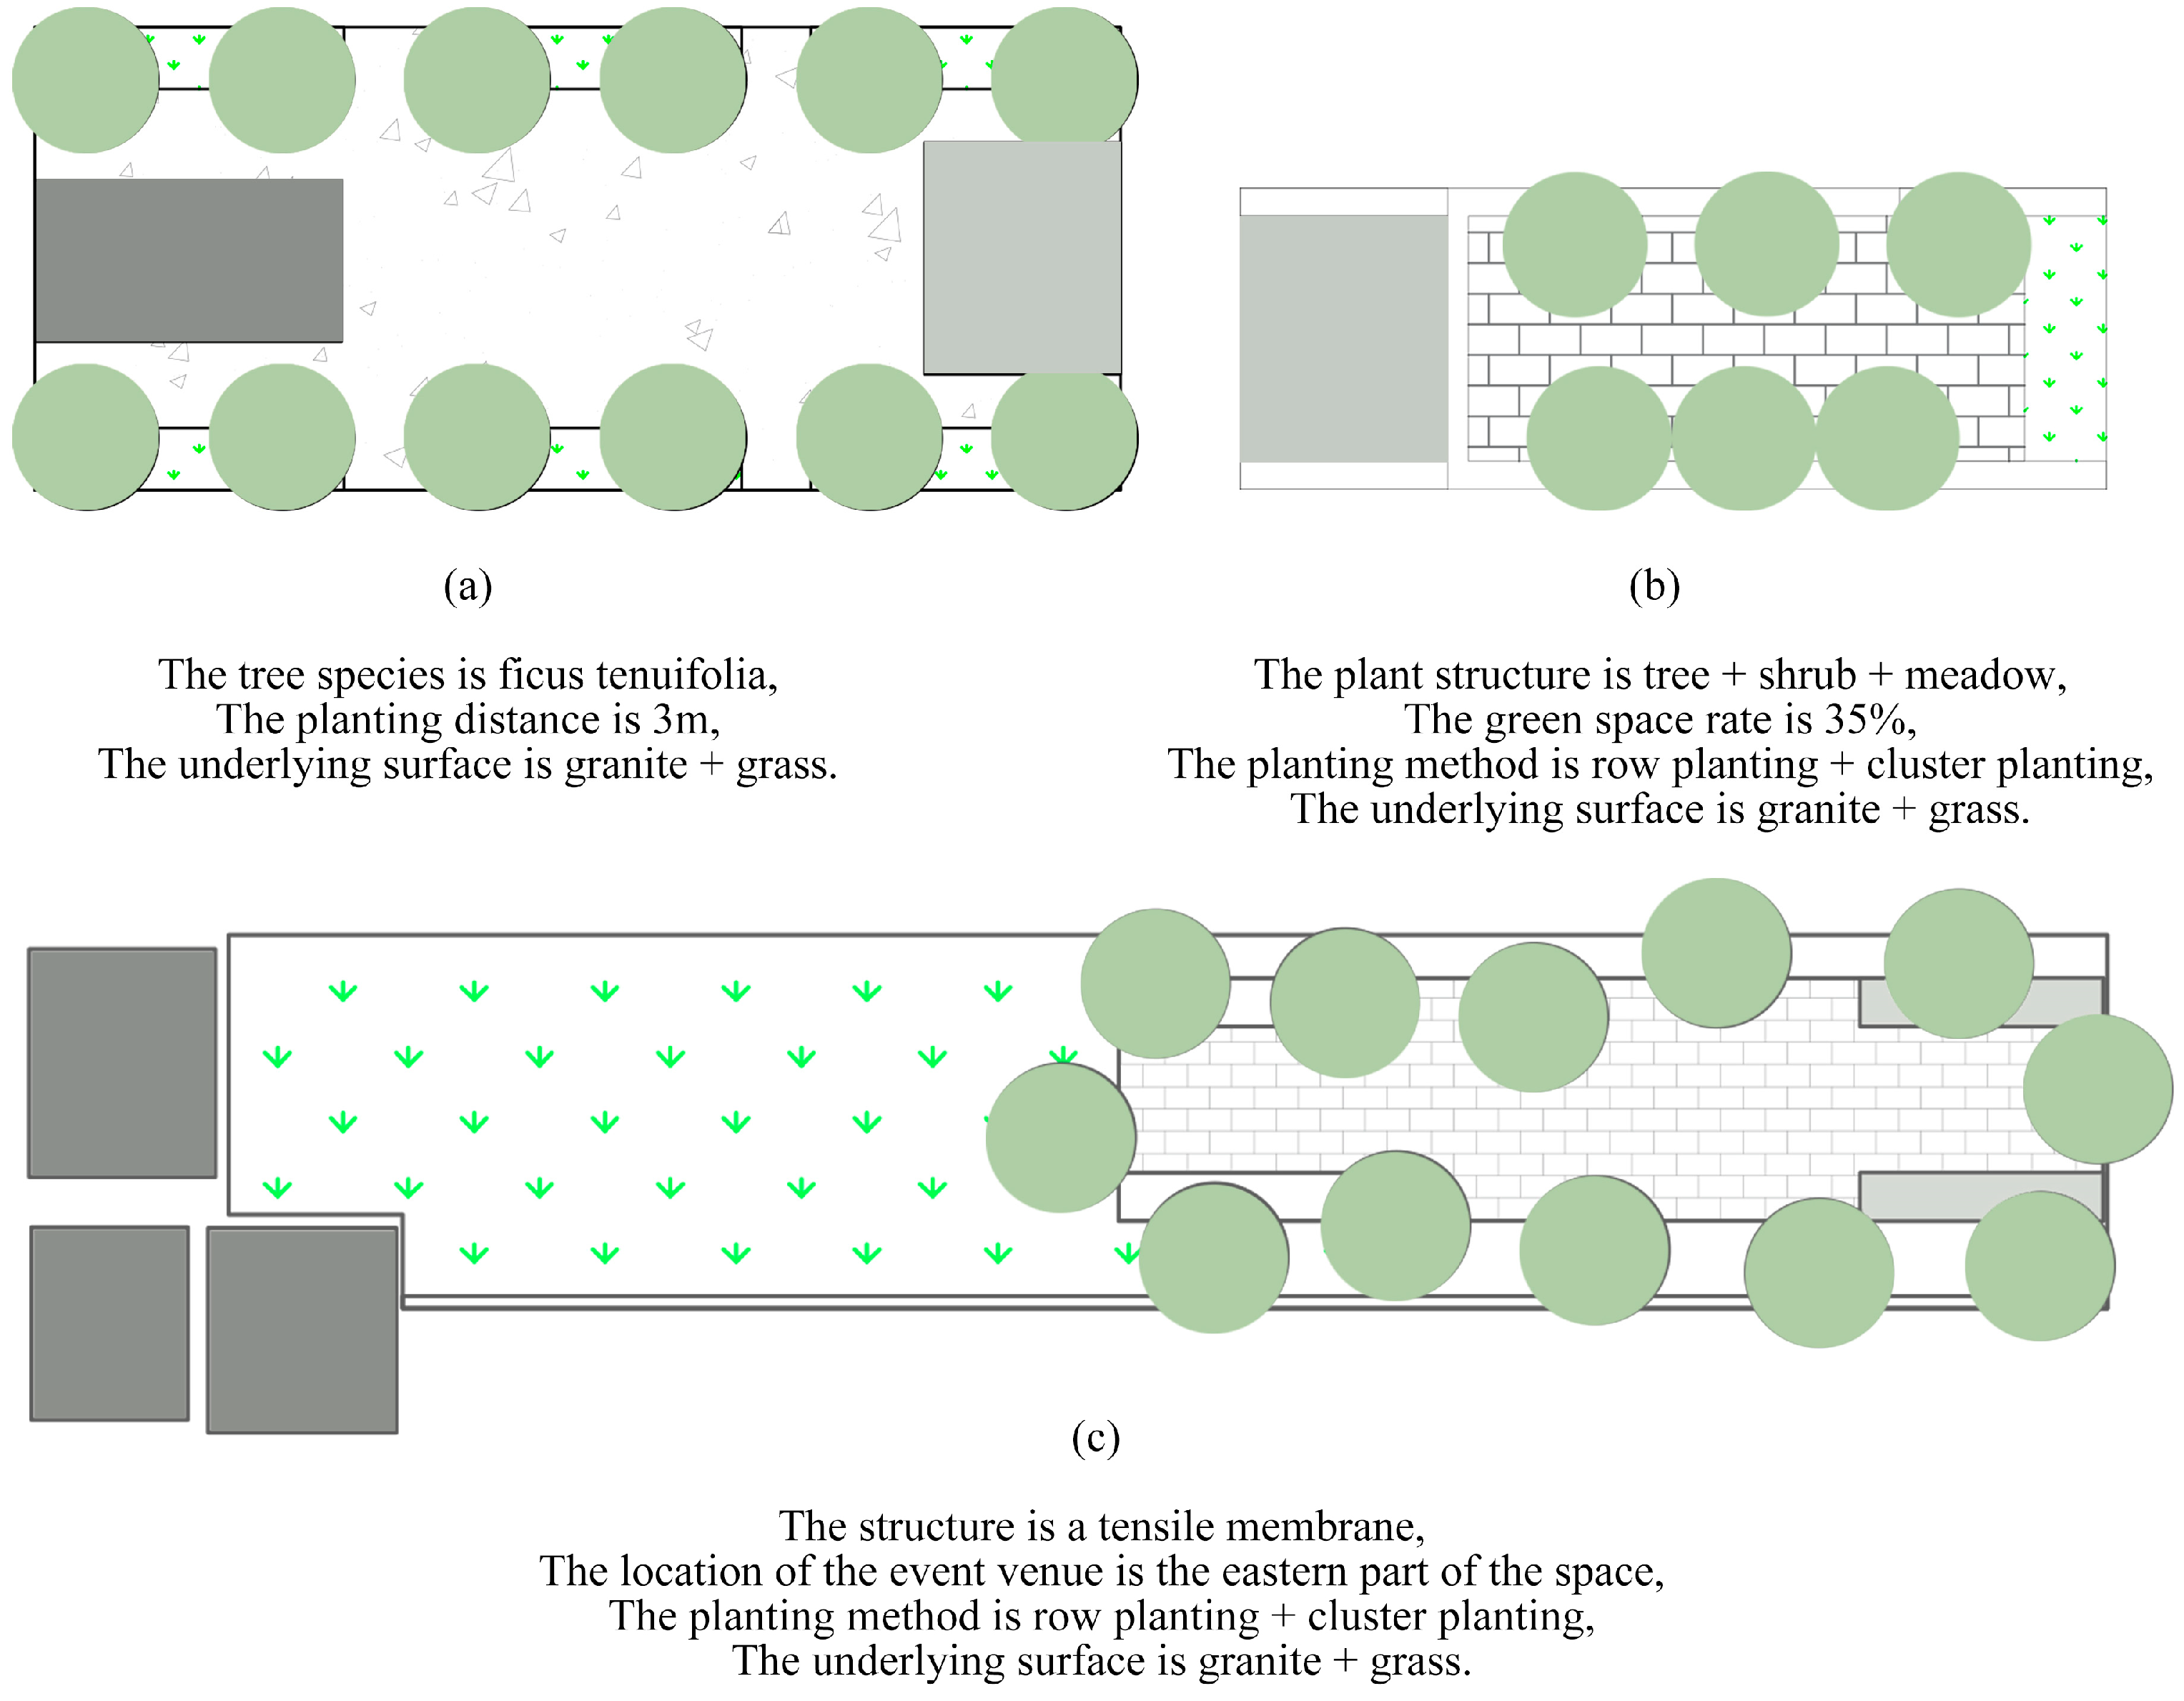
2.3. Typical Public Spaces in Coastal Villages
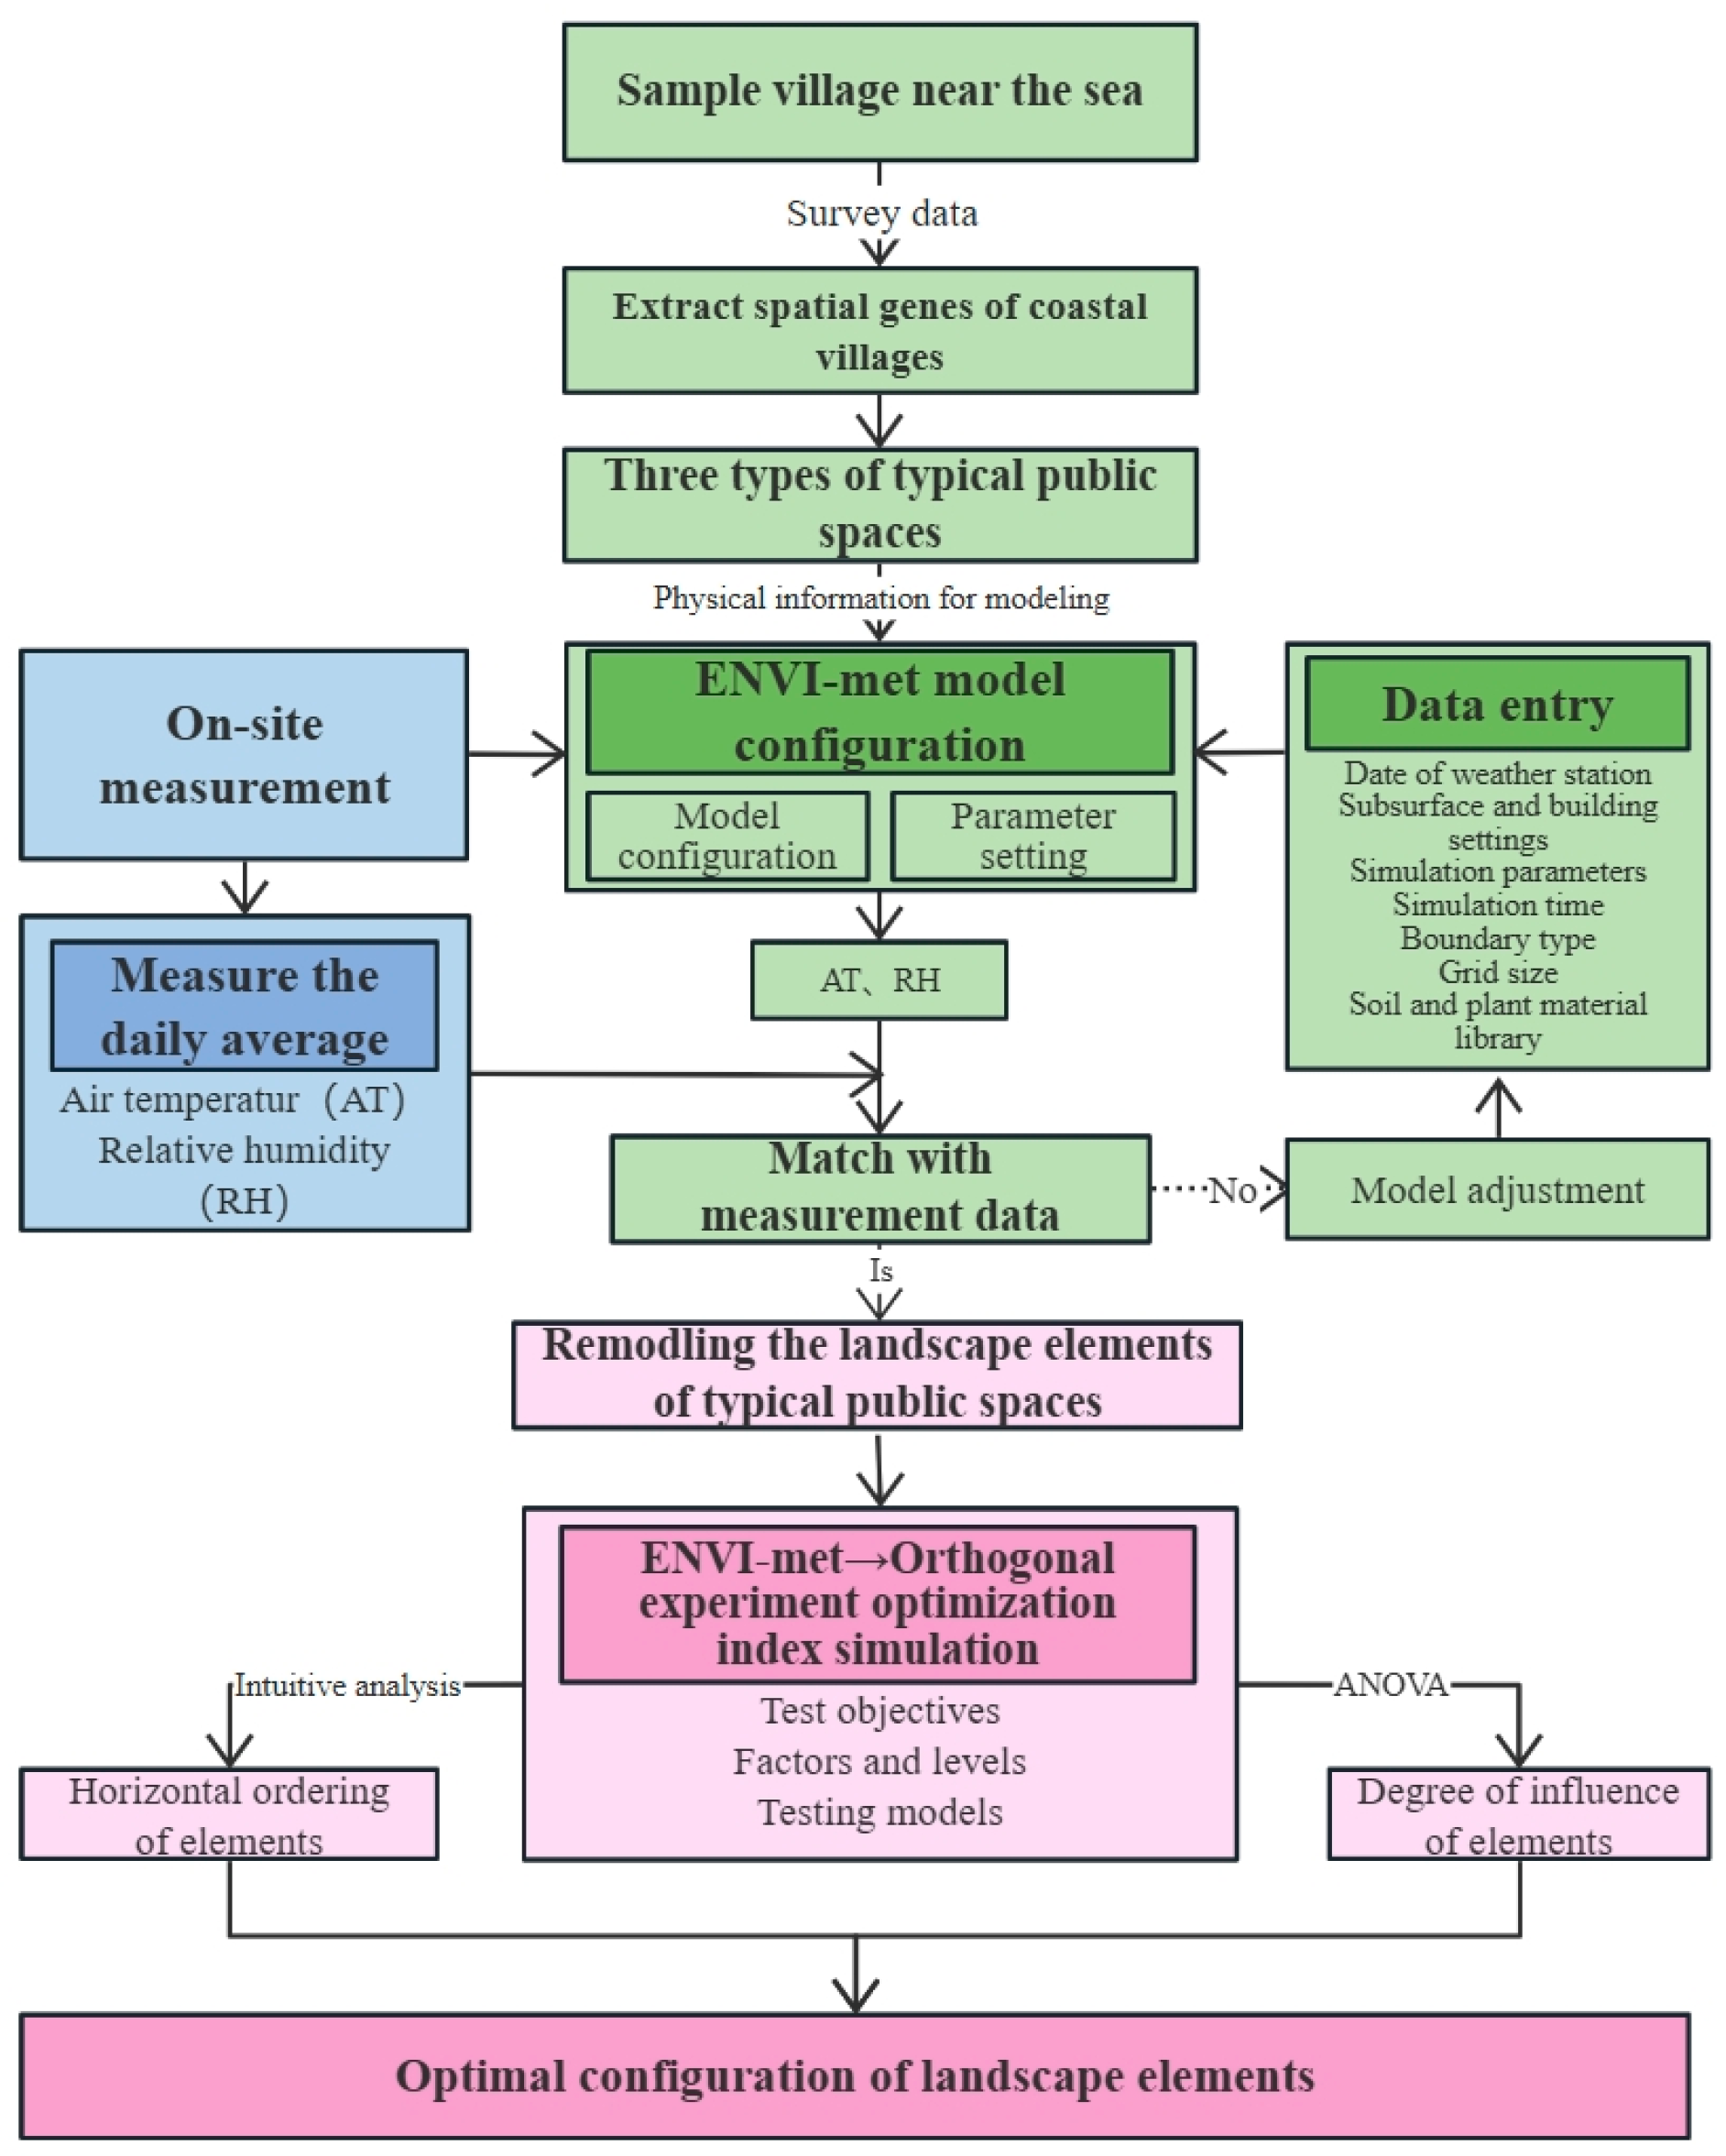
2.4. Numerical Simulation Methods
2.4.1. Thermal Environment Modeling Setup
2.4.2. Software Feasibility Verification
2.4.3. Thermal Comfort Evaluation Criteria
2.5. Remodeling
2.5.1. Establishment of Test Factors and Levels
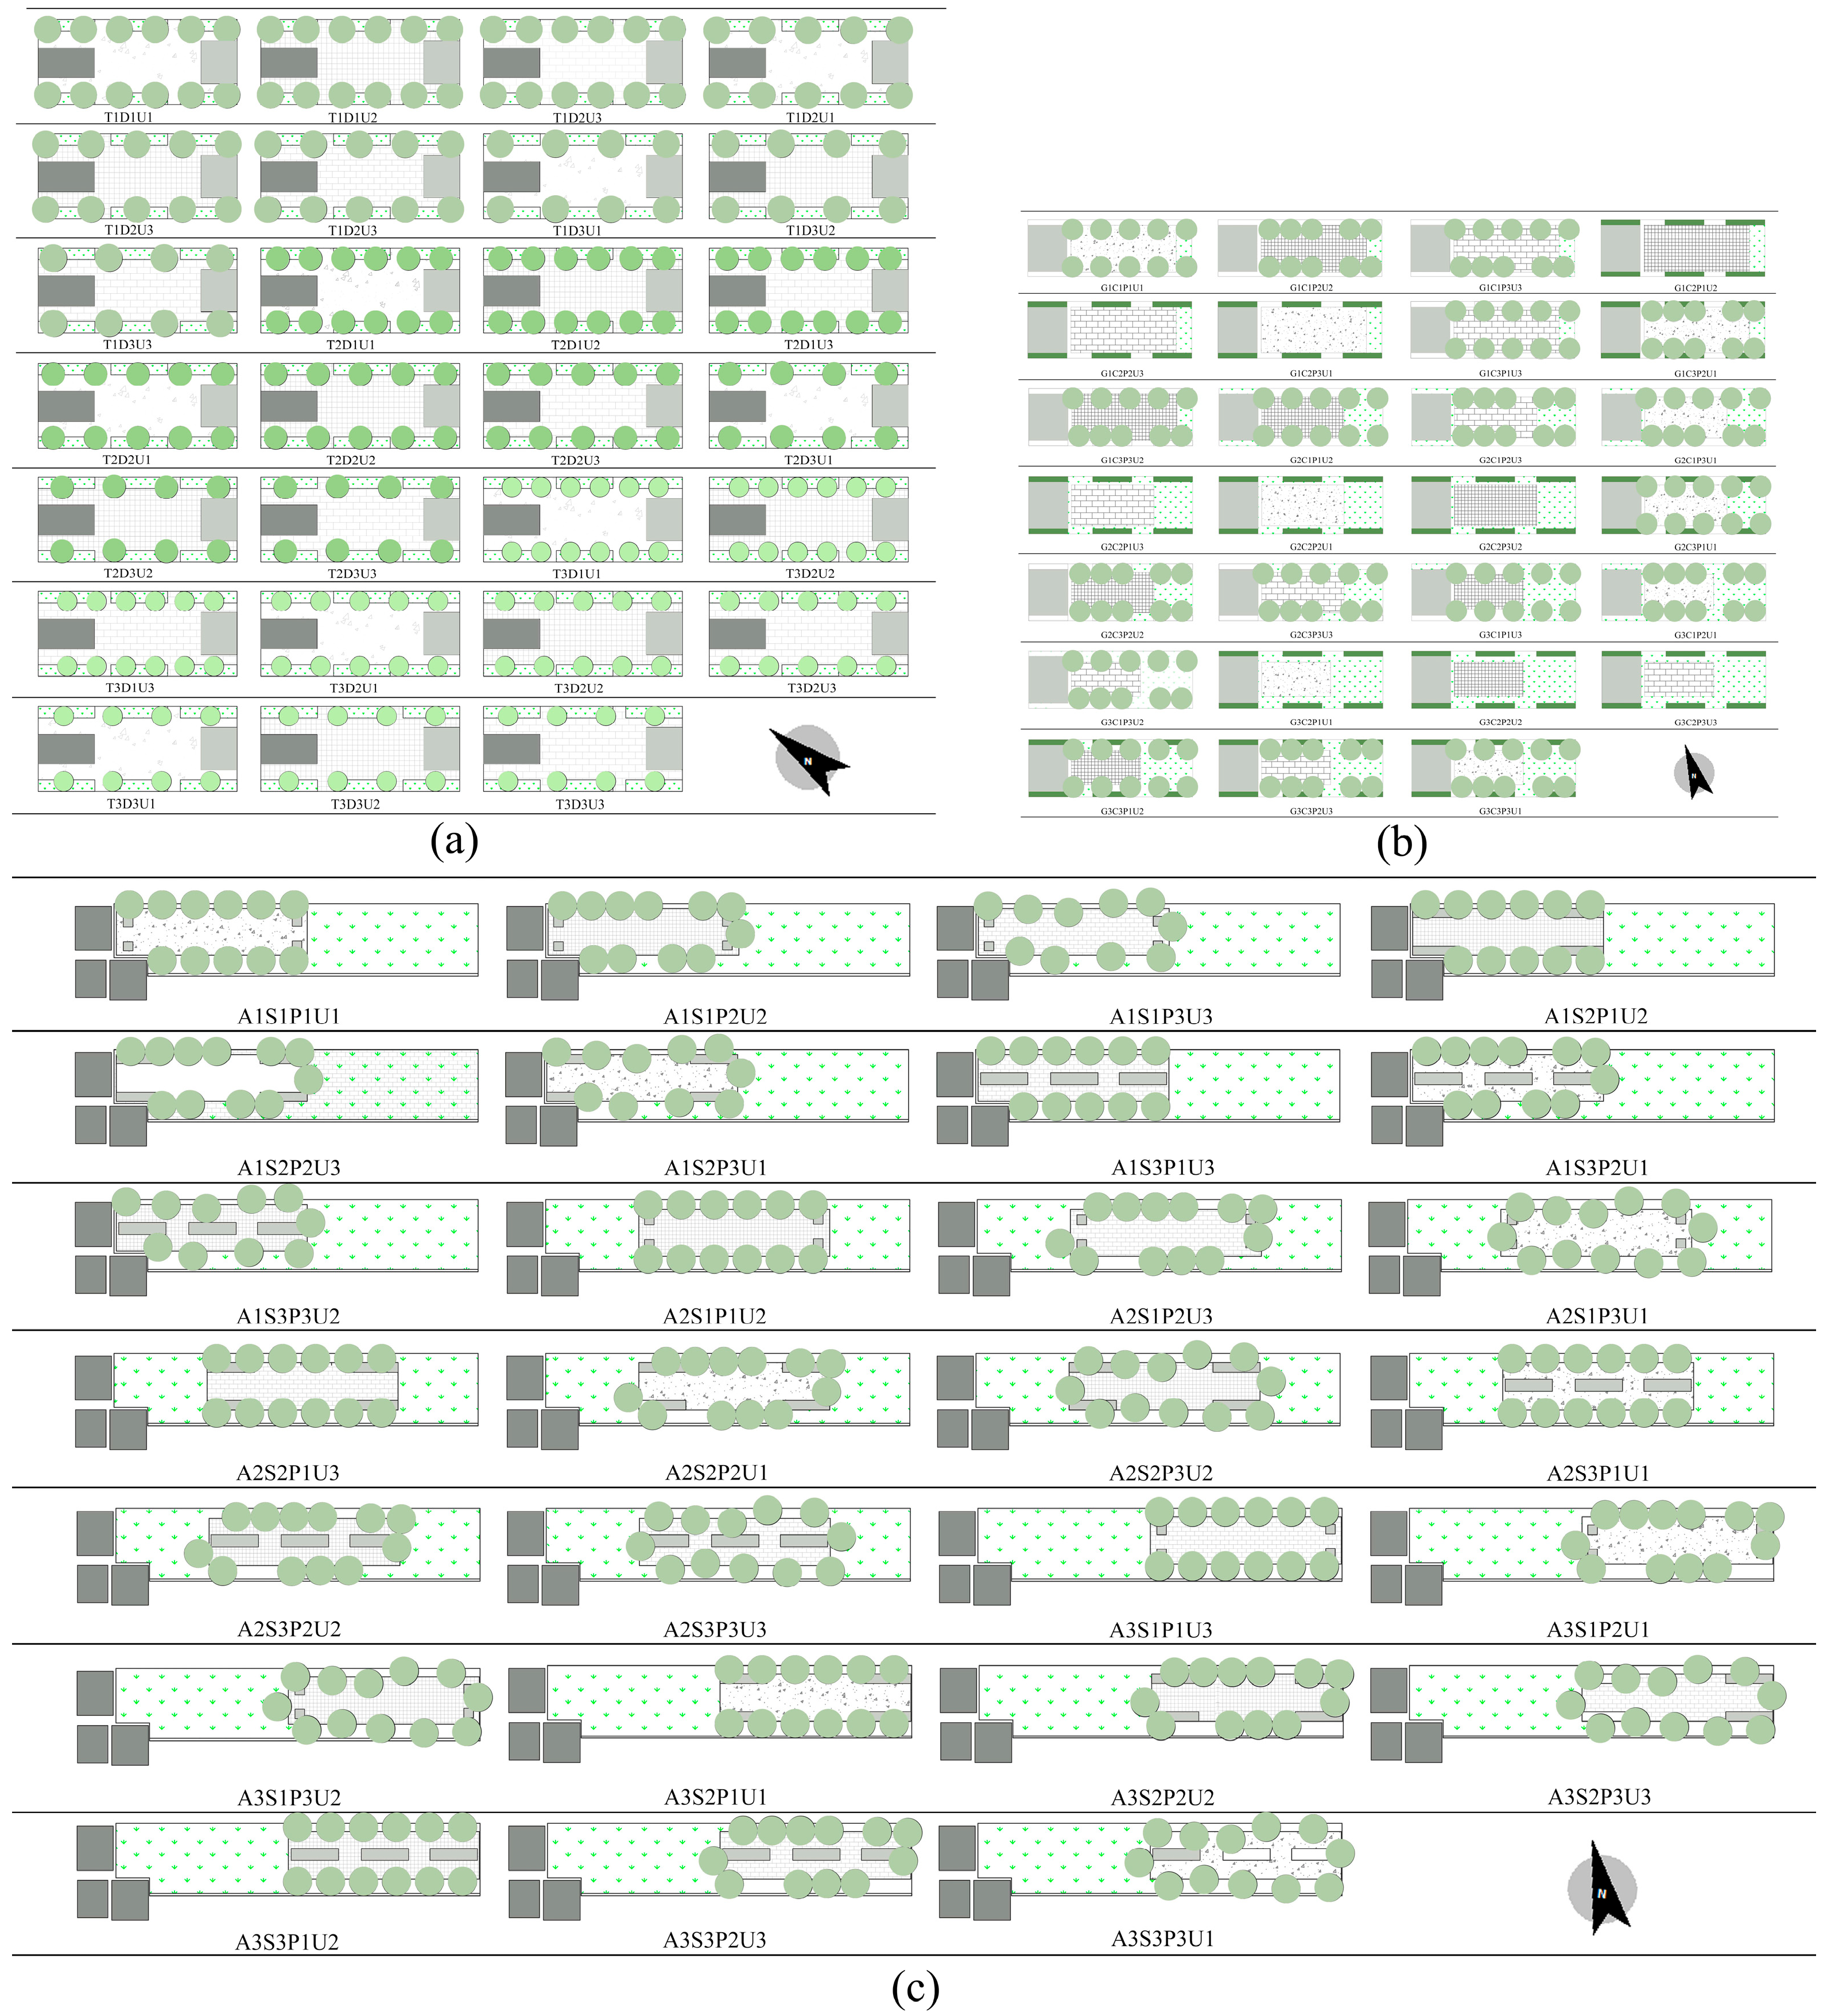
2.5.2. Test Modeling
3. Results
3.1. Ranking of the Thermal Comfort Impact Level of Landscape Elements
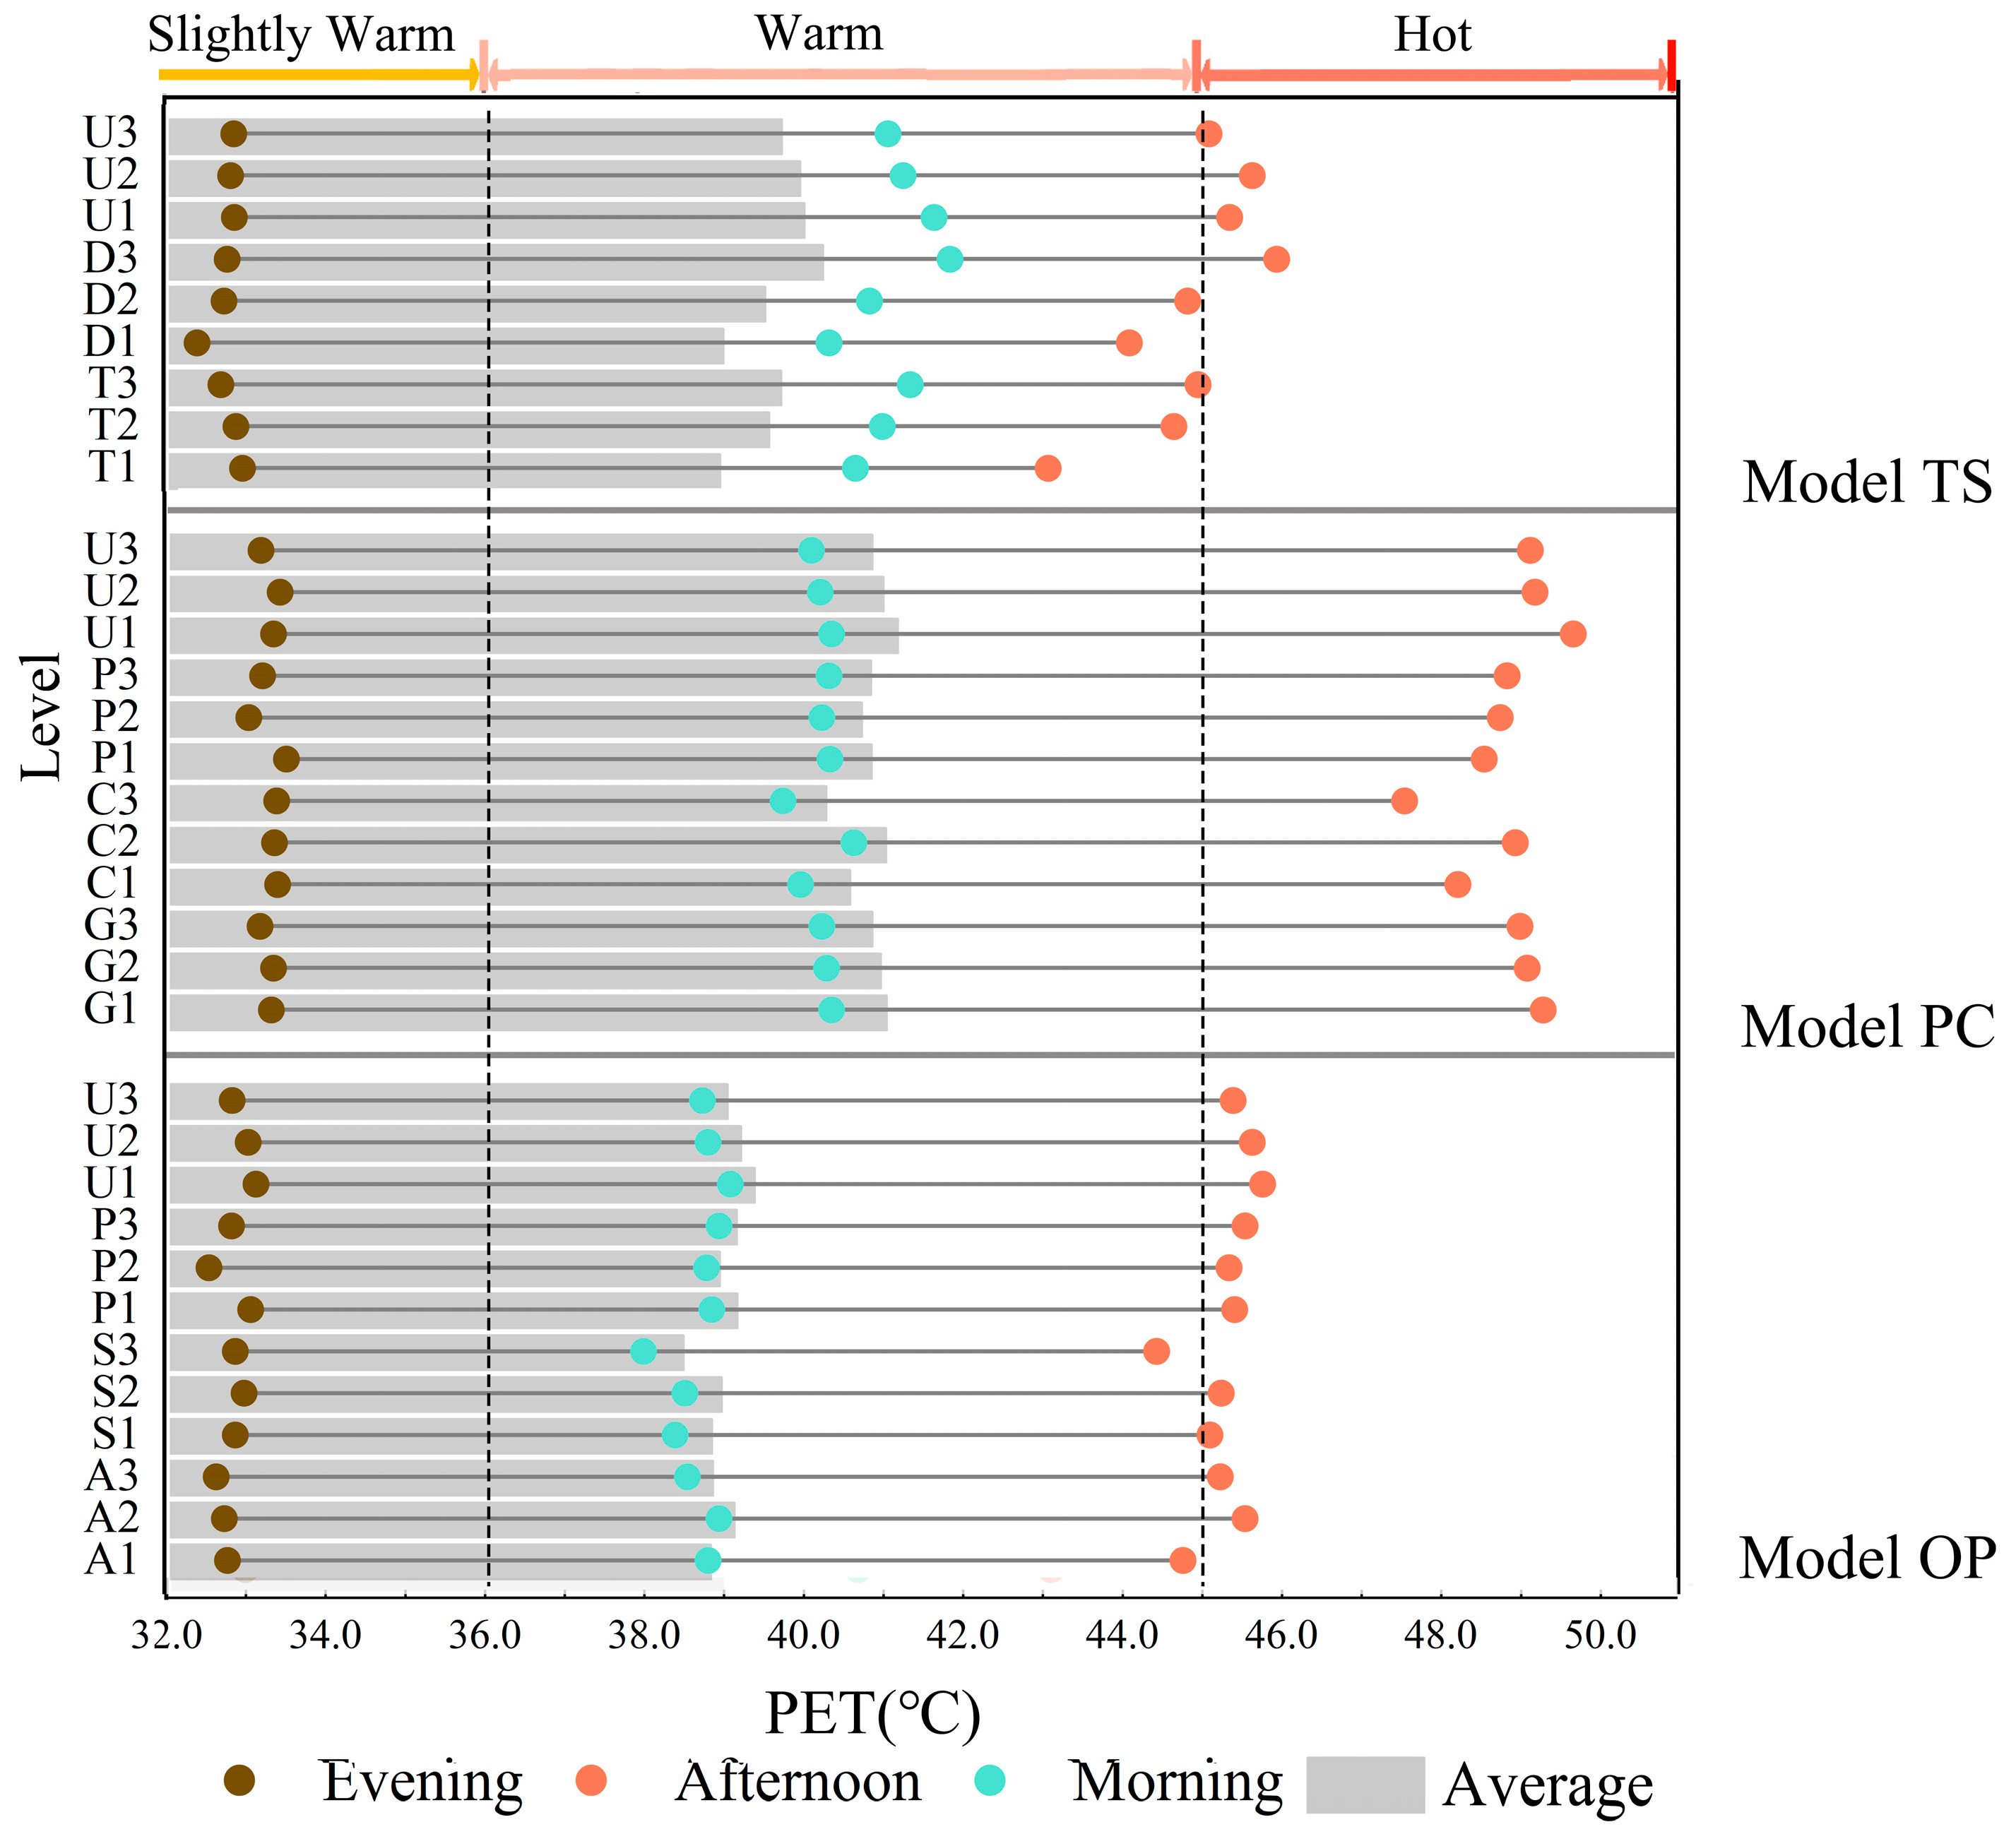
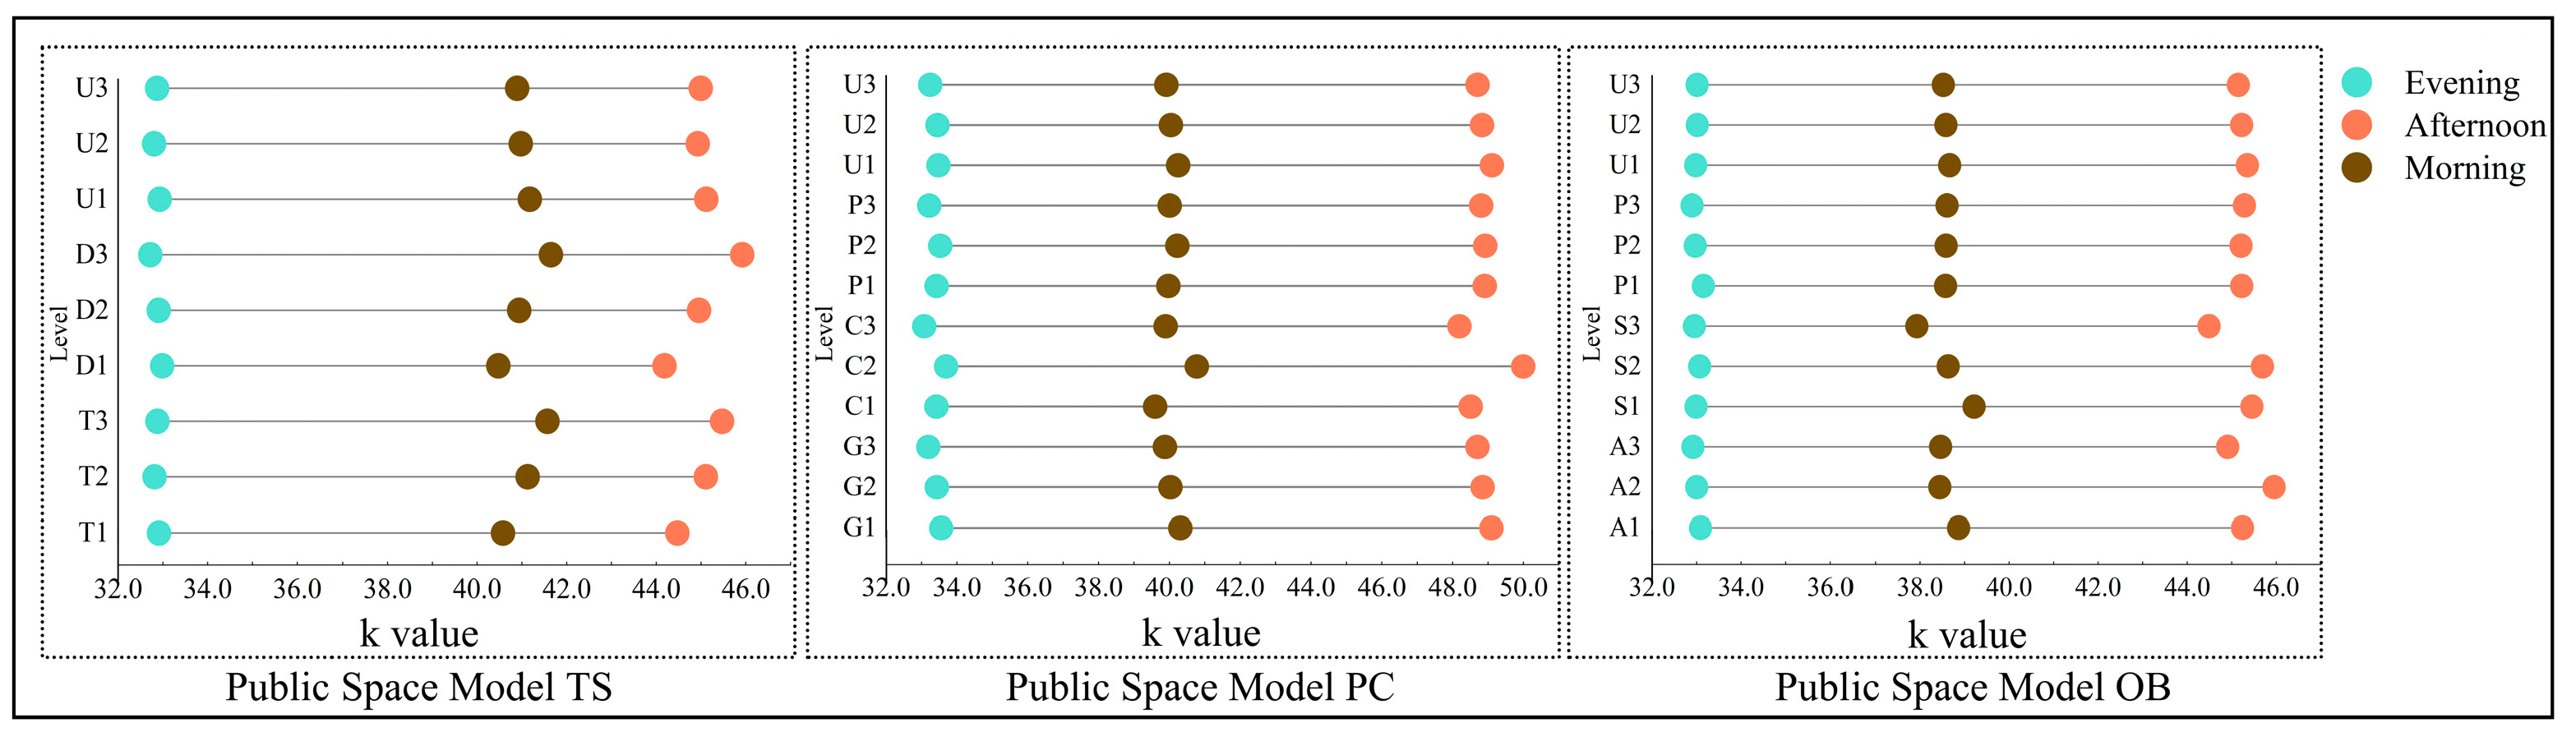
3.1.1. PET Trends of Typical Public Spaces
3.1.2. Factor Ranking in Order of Preference
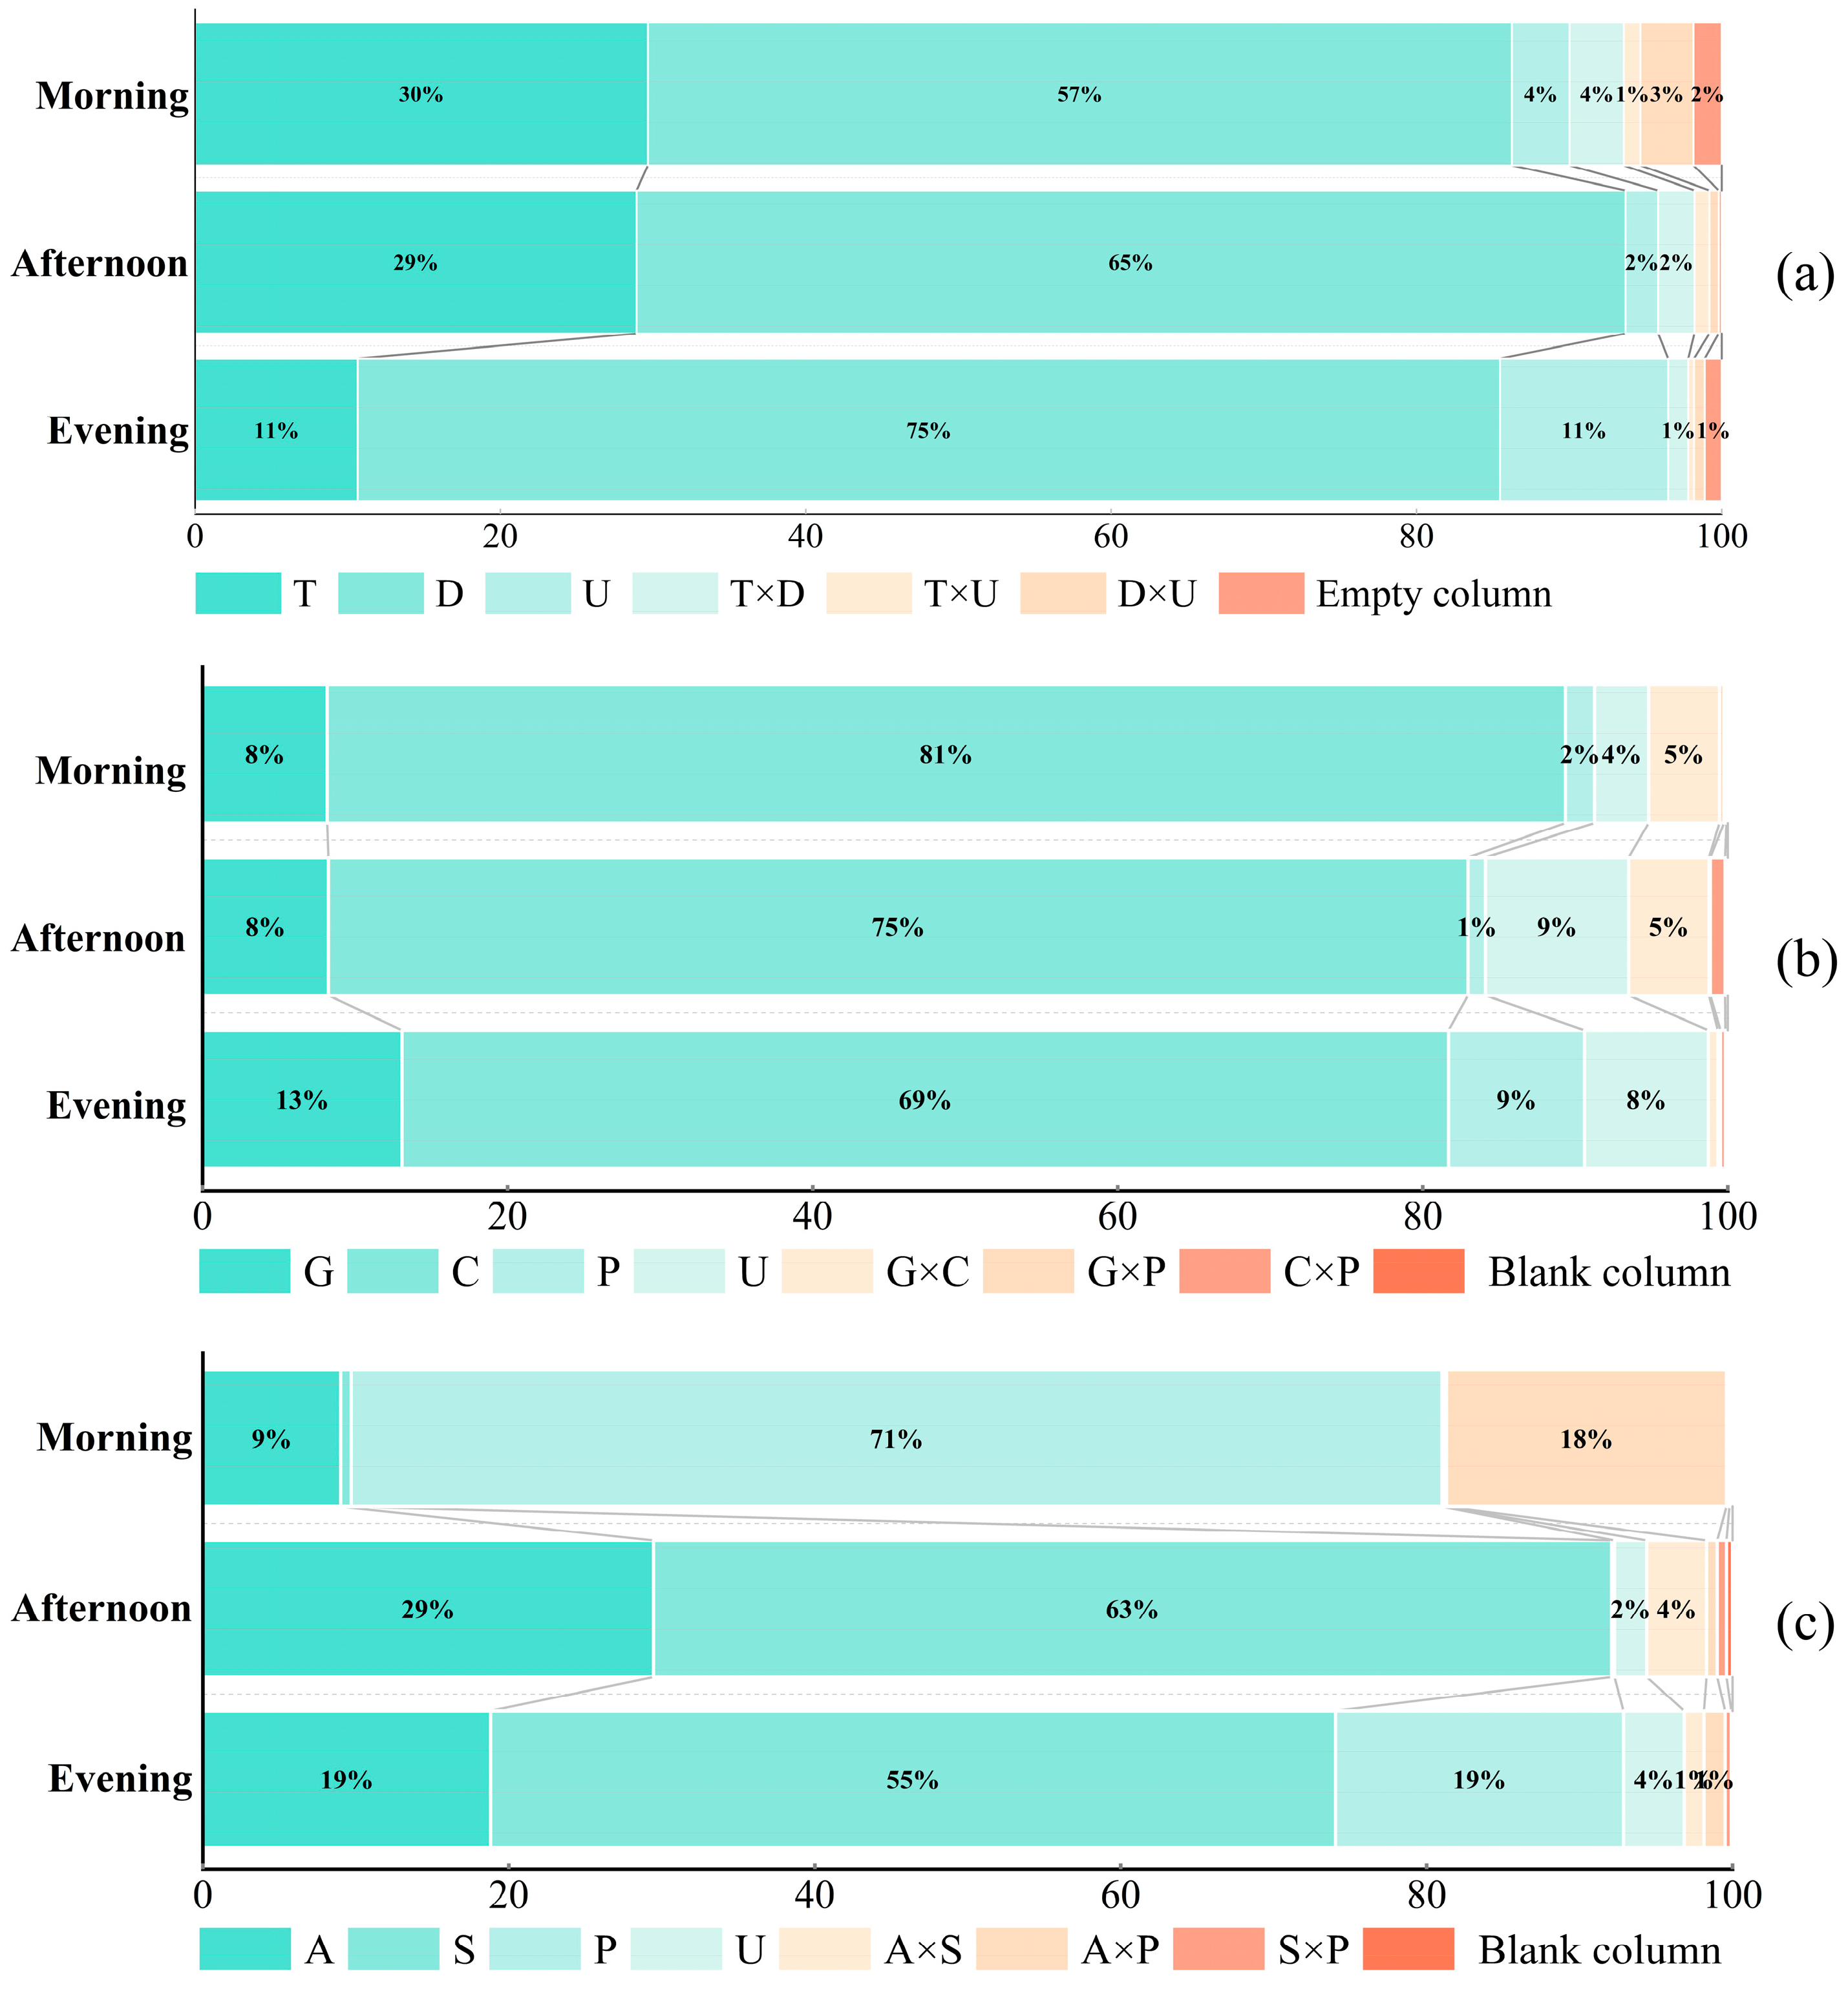
3.2. Factor Effect Level and Significance Analysis
3.3. Optimal Combination Analysis Considering Factor Interactions
4. Discussion
5. Conclusions
Author Contributions
Funding
Institutional Review Board Statement
Informed Consent Statement
Data Availability Statement
Conflicts of Interest
Abbreviations
| PET | Physiological Equivalent Temperature |
| RMSE | Root Mean Square Error |
| MAPE | Mean Absolute Percentage Error |
| ANOVA | Analysis of variance |
| ρj | Contribution rate |
| Sj | Sum of squares of column deviations |
Appendix A

| Exp | 1 | 2 | 3 | 4 | 5 | 6 | 7 | 8 | 9 | 10 | 11 | 12 | 13 |
|---|---|---|---|---|---|---|---|---|---|---|---|---|---|
| T | D | T × D | T × D | U | T × U | T × U | D × U | Error Column | Error | D × U | Error | Error | |
| 1 | 1 | 1 | 1 | 1 | 1 | 1 | 1 | 1 | 1 | 1 | 1 | 1 | 1 |
| 2 | 1 | 1 | 1 | 1 | 2 | 2 | 2 | 2 | 2 | 2 | 2 | 2 | 2 |
| 3 | 1 | 1 | 1 | 1 | 3 | 3 | 3 | 3 | 3 | 3 | 3 | 3 | 3 |
| 4 | 1 | 2 | 2 | 2 | 1 | 1 | 1 | 2 | 2 | 2 | 3 | 3 | 3 |
| 5 | 1 | 2 | 2 | 2 | 2 | 2 | 2 | 3 | 3 | 3 | 1 | 1 | 1 |
| 6 | 1 | 2 | 2 | 2 | 3 | 3 | 3 | 1 | 1 | 1 | 2 | 2 | 2 |
| 7 | 1 | 3 | 3 | 3 | 1 | 1 | 1 | 3 | 3 | 3 | 2 | 2 | 2 |
| 8 | 1 | 3 | 3 | 3 | 2 | 2 | 2 | 1 | 1 | 1 | 3 | 3 | 3 |
| 9 | 1 | 3 | 3 | 3 | 3 | 3 | 3 | 2 | 2 | 2 | 1 | 1 | 1 |
| 10 | 2 | 1 | 2 | 3 | 1 | 2 | 3 | 1 | 2 | 3 | 1 | 2 | 3 |
| 11 | 2 | 1 | 2 | 3 | 2 | 3 | 1 | 2 | 3 | 1 | 2 | 3 | 1 |
| 12 | 2 | 1 | 2 | 3 | 3 | 1 | 2 | 3 | 1 | 2 | 3 | 1 | 2 |
| 13 | 2 | 2 | 3 | 1 | 1 | 2 | 3 | 2 | 3 | 1 | 3 | 1 | 2 |
| 14 | 2 | 2 | 3 | 1 | 2 | 3 | 1 | 3 | 1 | 2 | 1 | 2 | 3 |
| 15 | 2 | 2 | 3 | 1 | 3 | 1 | 2 | 1 | 2 | 3 | 2 | 3 | 1 |
| 16 | 2 | 3 | 1 | 2 | 1 | 2 | 3 | 3 | 1 | 2 | 2 | 3 | 1 |
| 17 | 2 | 3 | 1 | 2 | 2 | 3 | 1 | 1 | 2 | 3 | 3 | 1 | 2 |
| 18 | 2 | 3 | 1 | 2 | 3 | 1 | 2 | 2 | 3 | 1 | 1 | 2 | 3 |
| 19 | 3 | 1 | 3 | 2 | 1 | 3 | 2 | 1 | 3 | 2 | 1 | 3 | 2 |
| 20 | 3 | 1 | 3 | 2 | 2 | 1 | 3 | 2 | 1 | 3 | 2 | 1 | 3 |
| 21 | 3 | 1 | 3 | 2 | 3 | 2 | 1 | 3 | 2 | 1 | 3 | 2 | 1 |
| 22 | 3 | 2 | 1 | 3 | 1 | 3 | 2 | 2 | 1 | 3 | 3 | 2 | 1 |
| 23 | 3 | 2 | 1 | 3 | 2 | 1 | 3 | 3 | 2 | 1 | 1 | 3 | 2 |
| 24 | 3 | 2 | 1 | 3 | 3 | 2 | 1 | 1 | 3 | 2 | 2 | 1 | 3 |
| 25 | 3 | 3 | 2 | 1 | 1 | 3 | 2 | 3 | 2 | 1 | 2 | 1 | 3 |
| 26 | 3 | 3 | 2 | 1 | 2 | 1 | 3 | 1 | 3 | 2 | 3 | 2 | 1 |
| 27 | 3 | 3 | 2 | 1 | 3 | 2 | 1 | 2 | 1 | 3 | 1 | 3 | 2 |
| Exp | 1 | 2 | 3 | 4 | 5 | 6 | 7 | 8 | 9 | 10 | 11 | 12 | 13 |
|---|---|---|---|---|---|---|---|---|---|---|---|---|---|
| G | C | G × C | G × C | P | G × P | G × P | C × P | U | Error | C × P | Error | Error | |
| 1 | 1 | 1 | 1 | 1 | 1 | 1 | 1 | 1 | 1 | 1 | 1 | 1 | 1 |
| 2 | 1 | 1 | 1 | 1 | 2 | 2 | 2 | 2 | 2 | 2 | 2 | 2 | 2 |
| 3 | 1 | 1 | 1 | 1 | 3 | 3 | 3 | 3 | 3 | 3 | 3 | 3 | 3 |
| 4 | 1 | 2 | 2 | 2 | 1 | 1 | 1 | 2 | 2 | 2 | 3 | 3 | 3 |
| 5 | 1 | 2 | 2 | 2 | 2 | 2 | 2 | 3 | 3 | 3 | 1 | 1 | 1 |
| 6 | 1 | 2 | 2 | 2 | 3 | 3 | 3 | 1 | 1 | 1 | 2 | 2 | 2 |
| 7 | 1 | 3 | 3 | 3 | 1 | 1 | 1 | 3 | 3 | 3 | 2 | 2 | 2 |
| 8 | 1 | 3 | 3 | 3 | 2 | 2 | 2 | 1 | 1 | 1 | 3 | 3 | 3 |
| 9 | 1 | 3 | 3 | 3 | 3 | 3 | 3 | 2 | 2 | 2 | 1 | 1 | 1 |
| 10 | 2 | 1 | 2 | 3 | 1 | 2 | 3 | 1 | 2 | 3 | 1 | 2 | 3 |
| 11 | 2 | 1 | 2 | 3 | 2 | 3 | 1 | 2 | 3 | 1 | 2 | 3 | 1 |
| 12 | 2 | 1 | 2 | 3 | 3 | 1 | 2 | 3 | 1 | 2 | 3 | 1 | 2 |
| 13 | 2 | 2 | 3 | 1 | 1 | 2 | 3 | 2 | 3 | 1 | 3 | 1 | 2 |
| 14 | 2 | 2 | 3 | 1 | 2 | 3 | 1 | 3 | 1 | 2 | 1 | 2 | 3 |
| 15 | 2 | 2 | 3 | 1 | 3 | 1 | 2 | 1 | 2 | 3 | 2 | 3 | 1 |
| 16 | 2 | 3 | 1 | 2 | 1 | 2 | 3 | 3 | 1 | 2 | 2 | 3 | 1 |
| 17 | 2 | 3 | 1 | 2 | 2 | 3 | 1 | 1 | 2 | 3 | 3 | 1 | 2 |
| 18 | 2 | 3 | 1 | 2 | 3 | 1 | 2 | 2 | 3 | 1 | 1 | 2 | 3 |
| 19 | 3 | 1 | 3 | 2 | 1 | 3 | 2 | 1 | 3 | 2 | 1 | 3 | 2 |
| 20 | 3 | 1 | 3 | 2 | 2 | 1 | 3 | 2 | 1 | 3 | 2 | 1 | 3 |
| 21 | 3 | 1 | 3 | 2 | 3 | 2 | 1 | 3 | 2 | 1 | 3 | 2 | 1 |
| 22 | 3 | 2 | 1 | 3 | 1 | 3 | 2 | 2 | 1 | 3 | 3 | 2 | 1 |
| 23 | 3 | 2 | 1 | 3 | 2 | 1 | 3 | 3 | 2 | 1 | 1 | 3 | 2 |
| 24 | 3 | 2 | 1 | 3 | 3 | 2 | 1 | 1 | 3 | 2 | 2 | 1 | 3 |
| 25 | 3 | 3 | 2 | 1 | 1 | 3 | 2 | 3 | 2 | 1 | 2 | 1 | 3 |
| 26 | 3 | 3 | 2 | 1 | 2 | 1 | 3 | 1 | 3 | 2 | 3 | 2 | 1 |
| 27 | 3 | 3 | 2 | 1 | 3 | 2 | 1 | 2 | 1 | 3 | 1 | 3 | 2 |
| Exp | 1 | 2 | 3 | 4 | 5 | 6 | 7 | 8 | 9 | 10 | 11 | 12 | 13 |
|---|---|---|---|---|---|---|---|---|---|---|---|---|---|
| A | S | A × S | A × S | P | A × P | A × P | P × U | U | Error | P × U | Error | Error | |
| 1 | 1 | 1 | 1 | 1 | 1 | 1 | 1 | 1 | 1 | 1 | 1 | 1 | 1 |
| 2 | 1 | 1 | 1 | 1 | 2 | 2 | 2 | 2 | 2 | 2 | 2 | 2 | 2 |
| 3 | 1 | 1 | 1 | 1 | 3 | 3 | 3 | 3 | 3 | 3 | 3 | 3 | 3 |
| 4 | 1 | 2 | 2 | 2 | 1 | 1 | 1 | 2 | 2 | 2 | 3 | 3 | 3 |
| 5 | 1 | 2 | 2 | 2 | 2 | 2 | 2 | 3 | 3 | 3 | 1 | 1 | 1 |
| 6 | 1 | 2 | 2 | 2 | 3 | 3 | 3 | 1 | 1 | 1 | 2 | 2 | 2 |
| 7 | 1 | 3 | 3 | 3 | 1 | 1 | 1 | 3 | 3 | 3 | 2 | 2 | 2 |
| 8 | 1 | 3 | 3 | 3 | 2 | 2 | 2 | 1 | 1 | 1 | 3 | 3 | 3 |
| 9 | 1 | 3 | 3 | 3 | 3 | 3 | 3 | 2 | 2 | 2 | 1 | 1 | 1 |
| 10 | 2 | 1 | 2 | 3 | 1 | 2 | 3 | 1 | 2 | 3 | 1 | 2 | 3 |
| 11 | 2 | 1 | 2 | 3 | 2 | 3 | 1 | 2 | 3 | 1 | 2 | 3 | 1 |
| 12 | 2 | 1 | 2 | 3 | 3 | 1 | 2 | 3 | 1 | 2 | 3 | 1 | 2 |
| 13 | 2 | 2 | 3 | 1 | 1 | 2 | 3 | 2 | 3 | 1 | 3 | 1 | 2 |
| 14 | 2 | 2 | 3 | 1 | 2 | 3 | 1 | 3 | 1 | 2 | 1 | 2 | 3 |
| 15 | 2 | 2 | 3 | 1 | 3 | 1 | 2 | 1 | 2 | 3 | 2 | 3 | 1 |
| 16 | 2 | 3 | 1 | 2 | 1 | 2 | 3 | 3 | 1 | 2 | 2 | 3 | 1 |
| 17 | 2 | 3 | 1 | 2 | 2 | 3 | 1 | 1 | 2 | 3 | 3 | 1 | 2 |
| 18 | 2 | 3 | 1 | 2 | 3 | 1 | 2 | 2 | 3 | 1 | 1 | 2 | 3 |
| 19 | 3 | 1 | 3 | 2 | 1 | 3 | 2 | 1 | 3 | 2 | 1 | 3 | 2 |
| 20 | 3 | 1 | 3 | 2 | 2 | 1 | 3 | 2 | 1 | 3 | 2 | 1 | 3 |
| 21 | 3 | 1 | 3 | 2 | 3 | 2 | 1 | 3 | 2 | 1 | 3 | 2 | 1 |
| 22 | 3 | 2 | 1 | 3 | 1 | 3 | 2 | 2 | 1 | 3 | 3 | 2 | 1 |
| 23 | 3 | 2 | 1 | 3 | 2 | 1 | 3 | 3 | 2 | 1 | 1 | 3 | 2 |
| 24 | 3 | 2 | 1 | 3 | 3 | 2 | 1 | 1 | 3 | 2 | 2 | 1 | 3 |
| 25 | 3 | 3 | 2 | 1 | 1 | 3 | 2 | 3 | 2 | 1 | 2 | 1 | 3 |
| 26 | 3 | 3 | 2 | 1 | 2 | 1 | 3 | 1 | 3 | 2 | 3 | 2 | 1 |
| 27 | 3 | 3 | 2 | 1 | 3 | 2 | 1 | 2 | 1 | 3 | 1 | 3 | 2 |
References
- National Bureau of Statistics of China. China Population Statistics Yearbook. Available online: https://www.stats.gov.cn/sj/ndsj/2023/indexch.htm (accessed on 30 May 2024).
- Zhen, M.; Dong, Q.; Chen, P.; Ding, W.; Zhou, D.; Feng, W. Urban Outdoor Thermal Comfort in Western China. J. Asian Archit. Build. Eng. 2021, 20, 222–236. [Google Scholar] [CrossRef]
- Xie, X.; Liao, H.; Wang, R.; Gou, Z. Thermal Comfort in the Overhead Public Space in Hot and Humid Climates: A Study in Shenzhen. Buildings 2022, 12, 1454. [Google Scholar] [CrossRef]
- Ma, K.; Tang, X.; Ren, Y.; Wang, Y. Research on the Spatial Pattern Characteristics of the Taihu Lake “Dock Village” Based on Microclimate: A Case Study of Tangli Village. Sustainability 2019, 11, 368. [Google Scholar] [CrossRef]
- Cai, Z.; Li, J.; Wang, J. The Protection and Landscape Characteristics of Traditional Villages in Coastal Areas of SW China. J. Coast. Res. 2020, 111, 331–335. [Google Scholar] [CrossRef]
- Zoelch, T.; Rahman, M.A.; Pfleiderer, E.; Wagner, G.; Pauleit, S. Designing Public Squares with Green Infrastructure to Optimize Human Thermal Comfort. Build. Environ. 2019, 149, 640–654. [Google Scholar] [CrossRef]
- Xu, M.; Hong, B.; Mi, J.; Yan, S. Outdoor Thermal Comfort in an Urban Park during Winter in Cold Regions of China. Sustain. Cities Soc. 2018, 43, 208–220. [Google Scholar] [CrossRef]
- Zhang, J.; Gou, Z.; Lu, Y. Outdoor Thermal Environments and Related Planning Factors for Subtropical Urban Parks. Indoor Built Environ. 2021, 30, 363–374. [Google Scholar] [CrossRef]
- Jin, H.; Liu, S.; Kang, J. Thermal Comfort Range and Influence Factor of Urban Pedestrian Streets in Severe Cold Regions. Energy Build. 2019, 198, 197–206. [Google Scholar] [CrossRef]
- Park, C.Y.; Lee, D.K.; Krayenhoff, E.S.; Heo, H.K.; Hyun, J.H.; Oh, K.; Park, T.Y. Variations in Pedestrian Mean Radiant Temperature Based on the Spacing and Size of Street Trees. Sustain. Cities Soc. 2019, 48, 101521. [Google Scholar] [CrossRef]
- Yang, J.; Ren, J.; Sun, D.; Xiao, X.; Xia, J.; Jin, C.; Li, X. Understanding Land Surface Temperature Impact Factors Based on Local Climate Zones. Sustain. Cities Soc. 2021, 69, 102818. [Google Scholar] [CrossRef]
- Yang, J.; Wang, Y.; Xiu, C.; Xiao, X.; Xia, J.; Jin, C. Optimizing Local Climate Zones to Mitigate Urban Heat Island Effect in Human Settlements. J. Clean Prod. 2020, 275, 123767. [Google Scholar] [CrossRef]
- Yang, J.; Zhan, Y.; Xiao, X.; Xia, J.C.; Sun, W.; Li, X. Investigating the Diversity of Land Surface Temperature Characteristics in Different Scale Cities Based on Local Climate Zones. Urban Clim. 2020, 34, 100700. [Google Scholar] [CrossRef]
- Xiao, T.; Sheng, L.; Zhang, S.; Zheng, L.; Shui, T. Thermal Comfort Improvement Strategies for Outdoor Spaces in Traditional Villages Based on ENVI-Met: Shimengao Village in Chizhou City. Sustainability 2023, 15, 11785. [Google Scholar] [CrossRef]
- Fan, Q.; Du, F.; Li, H.; Zhang, C. Thermal-Comfort Evaluation of and Plan for Public Space of Maling Village, Henan, China. PLoS ONE 2021, 16, e0256439. [Google Scholar] [CrossRef]
- Tang, P.; Li, Q.; Lu, X.; Peng, H.; Mi, J.; Meng, Q. Field Assessments of Mean Radiant Temperature Estimation Methods at Beach Areas: A Case Study of Hailing Island, China. Build. Environ. 2023, 232, 110039. [Google Scholar] [CrossRef]
- Wang, H.; Shi, C.; Li, W.; Wang, L.; Wang, J.; Wang, G.; Hu, S. Field Investigation on Thermal Environment and Comfort of People in a Coastal Village of Qingdao (China) during Winter. Build. Environ. 2021, 191, 107585. [Google Scholar] [CrossRef]
- Xiong, Y.; Zhang, J.; Yan, Y.; Sun, S.; Xu, X.; Higueras, E. Effect of the Spatial Form of Jiangnan Traditional Villages on Microclimate and Human Comfort. Sustain. Cities Soc. 2022, 87, 104136. [Google Scholar] [CrossRef]
- Wang, S.; Sobel, A.H. Factors Controlling Rain on Small Tropical Islands: Diurnal Cycle, Large-Scale Wind Speed, and Topography. J. Atmos. Sci. 2017, 74, 3515–3532. [Google Scholar] [CrossRef]
- Limona, S.S.; Al-hagla, K.S.; El-sayad, Z.T. Using Simulation Methods to Investigate the Impact of Urban Form on Human Comfort. Case Study: Coast of Baltim, North Coast, Egypt. Alex. Eng. J. 2019, 58, 273–282. [Google Scholar] [CrossRef]
- Guo, Q.; Liu, X. Evaluation and Optimization Design for Microclimate Comfort of Traditional Village Squares Based on Extension Correlation Function. J. Environ. Public Health 2022, 2022, e6106463. [Google Scholar] [CrossRef]
- Guo, T.; Zhao, Y.; Yang, J.; Zhong, Z.; Ji, K.; Zhong, Z.; Luo, X. Effects of Tree Arrangement and Leaf Area Index on the Thermal Comfort of Outdoor Children’s Activity Space in Hot-Humid Areas. Buildings 2023, 13, 214. [Google Scholar] [CrossRef]
- Gadish, I.; Saaroni, H.; Pearlmutter, D. A Predictive Analysis of Thermal Stress in a Densifying Urban Business District under Summer Daytime Conditions in a Mediterranean City. Urban Clim. 2023, 48, 101298. [Google Scholar] [CrossRef]
- Cheng, Y.; Liu, X.; Zeng, Z.; Liu, S.; Wang, Z.; Tang, X.; He, B.-J. Impacts of Water Bodies on Microclimates and Outdoor Thermal Comfort: Implications for Sustainable Rural Revitalization. Front. Environ. Sci. 2022, 10, 940482. [Google Scholar] [CrossRef]
- Yu, H.; Zhang, T.; Fukuda, H.; Ma, X. The Effect of Landscape Configuration on Outdoor Thermal Environment: A Case of Urban Plaza in Xi’an, China. Build. Environ. 2023, 231, 110027. [Google Scholar] [CrossRef]
- GB 50176-2016; Code for Thermal Design of Civil Building. China Architecture & Building Press: Beijing, China, 2016.
- Wang, H.; Chiou, S. Study on the Sustainable Development of Human Settlement Space Environment in Traditional Villages. Sustainability 2019, 11, 4186. [Google Scholar] [CrossRef]
- Ma, X.; Tan, J.; Zhang, J. Spatial–Temporal Correlation between the Tourist Hotel Industry and Town Spatial Morphology: The Case of Phoenix Ancient Town, China. Sustainability 2022, 14, 10577. [Google Scholar] [CrossRef]
- Jia, W.; Wang, L. Morphological Typology Pedigree of Centripetal Spatial Schema in Traditional Chinese Settlements. Front. Archit. Res. 2024, 13, 1198–1214. [Google Scholar] [CrossRef]
- Duan, J.; Shao, R.; Lan, W.; Liu, J.; Jiang, Y. Space Gene. City Plan. Rev 2019, 43, 14–21. [Google Scholar]
- Nie, Z.; Li, N.; Pan, W.; Yang, Y.; Chen, W.; Hong, C. Quantitative Research on the Form of Traditional Villages Based on the Space Gene—A Case Study of Shibadong Village in Western Hunan, China. Sustainability 2022, 14, 8965. [Google Scholar] [CrossRef]
- Duan, J.; Jiang, Y.; Li, Y.; Lan, W. Space Gene: Connotation and Functional Mechanism. City Plan. Rev 2022, 46, 7–14. [Google Scholar]
- Jiang, Y.; Li, N.; Wang, Z. Parametric Reconstruction of Traditional Village Morphology Based on the Space Gene Perspective—The Case Study of Xiaoxi Village in Western Hunan, China. Sustainability 2023, 15, 2088. [Google Scholar] [CrossRef]
- Hu, Z.; Strobl, J.; Min, Q.; Tan, M.; Chen, F. Visualizing the Cultural Landscape Gene of Traditional Settlements in China: A Semiotic Perspective. Herit. Sci. 2021, 9, 115. [Google Scholar] [CrossRef]
- Liu, P.L. On Construction and Utilization of Chinese Traditional Settlements Landscape’s Genetic Map; Peking University: Beijing, China, 2011. [Google Scholar]
- Wang, Y.; Bakker, F.; de Groot, R.; Wörtche, H.; Leemans, R. Effects of Urban Green Infrastructure (UGI) on Local Outdoor Microclimate during the Growing Season. Environ. Monit. Assess. 2015, 187, 732. [Google Scholar] [CrossRef]
- Faustini, F.B.; de Faria, J.R.G.; Fontes, M.S.G.d.C. The Influence of Thermal Comfort Conditions on User’s Exposure Time in Open Spaces. Int. J. Biometeorol. 2020, 64, 243–252. [Google Scholar] [CrossRef]
- Fabbri, K.; Canuti, G.; Ugolini, A. A Methodology to Evaluate Outdoor Microclimate of the Archaeological Site and Vegetation Role: A Case Study of the Roman Villa in Russi (Italy). Sustain. Cities Soc. 2017, 35, 107–133. [Google Scholar] [CrossRef]
- Liu, Z.; Cheng, W.; Jim, C.Y.; Morakinyo, T.E.; Shi, Y.; Ng, E. Heat Mitigation Benefits of Urban Green and Blue Infrastructures: A Systematic Review of Modeling Techniques, Validation and Scenario Simulation in ENVI-Met V4. Build. Environ. 2021, 200, 107939. [Google Scholar] [CrossRef]
- Chai, T.; Draxler, R.R. Root Mean Square Error (RMSE) or Mean Absolute Error (MAE)? Arguments against Avoiding RMSE in the Literature. Geosci. Model Dev. 2014, 7, 1247–1250. [Google Scholar] [CrossRef]
- Mayer, H.; Höppe, P. Thermal Comfort of Man in Different Urban Environments. Theor. Appl. Climatol. 1987, 38, 43–49. [Google Scholar] [CrossRef]
- Liu, Y.; Yao, W.; Gao, W. Thermal Environment Evaluation and Thermal Comfort Zone Deviation—A Case Study of Chinese Seaweed House in Summer. J. Build. Eng. 2023, 78, 107703. [Google Scholar] [CrossRef]
- Fang, Z.; Feng, X.; Xu, X.; Zhou, X.; Lin, Z.; Ji, Y. Investigation into Outdoor Thermal Comfort Conditions by Different Seasonal Field Surveys in China, Guangzhou. Int. J. Biometeorol. 2019, 63, 1357–1368. [Google Scholar] [CrossRef]
- Yang, J.; Zhao, Y.; Zou, Y.; Xia, D.; Lou, S.; Liu, W.; Ji, K. Effects of Tree Species and Layout on the Outdoor Thermal Environment of Squares in Hot-Humid Areas of China. Buildings 2022, 12, 1867. [Google Scholar] [CrossRef]
- CJJT85-2017; Standard for Classification of Urban Green Space. Ministry of Housing and Urban-Rural Development of the People’s Republic: Beijing, China, 2017.
- Rutty, M.; Scott, D. Thermal Range of Coastal Tourism Resort Microclimates. Tour. Geogr. 2014, 16, 346–363. [Google Scholar] [CrossRef]
- Luo, T.; He, Q.; Wang, W.; Fan, X. Response of Summer Land Surface Temperature of Small and Medium-Sized Cities to Their Neighboring Urban Spatial Morphology. Build. Environ. 2024, 250, 111198. [Google Scholar] [CrossRef]
- Li, Y.Y.; Hu, C.R. Experimental Design and Data Processing; Chemical Industry Press: Beijing, China, 2008. [Google Scholar]
- Fang, Y.; Que, Q.; Tu, R.; Liu, Y.; Gao, W. How Do Landscape Elements Affect Public Health in Subtropical High-Density City: The Pathway through the Neighborhood Physical Environmental Factors. Build. Environ. 2021, 206, 108336. [Google Scholar] [CrossRef]
- Yu, H.; Fukuda, H.; Zhou, M.; Ma, X. Improvement Strategies for Microclimate and Thermal Comfort for Urban Squares: A Case of a Cold Climate Area in China. Buildings 2022, 12, 944. [Google Scholar] [CrossRef]
- Hami, A.; Abdi, B.; Zarehaghi, D.; Maulan, S.B. Assessing the Thermal Comfort Effects of Green Spaces: A Systematic Review of Methods, Parameters, and Plants’ Attributes. Sustain. Cities Soc. 2019, 49, 101634. [Google Scholar] [CrossRef]
- Kántor, N.; Chen, L.; Gál, C.V. Human-Biometeorological Significance of Shading in Urban Public Spaces—Summertime Measurements in Pécs, Hungary. Landsc. Urban Plan. 2018, 170, 241–255. [Google Scholar] [CrossRef]
- Lin, Z.; Xu, H.; Yao, X.; Yang, C.; Ye, D. How Does Urban Thermal Environmental Factors Impact Diurnal Cycle of Land Surface Temperature? A Multi-Dimensional and Multi-Granularity Perspective. Sustain. Cities Soc. 2024, 101, 105190. [Google Scholar] [CrossRef]
- Tsutsumi, J.-I.; Katayama, T.; Hayashi, T.; Kitayama, H.; Ishii, A. Statistical Analysis for the Characteristics of Sea-Land Breeze and Its Effect on Urban Thermal Environment. Energy Build. 1991, 16, 1003–1008. [Google Scholar] [CrossRef]
- Papangelis, G.; Tombrou, M.; Dandou, A.; Kontos, T. An Urban “Green Planning” Approach Utilizing the Weather Research and Forecasting (WRF) Modeling System. A Case Study of Athens, Greece. Landsc. Urban Plan. 2012, 105, 174–183. [Google Scholar] [CrossRef]
- Guan, H.; Kumar, V.; Clay, R.; Kent, C.; Bennett, J.; Ewenz, C.; Hopkins, G.; Simmons, C.T. Temporal and Spatial Patterns of Air Temperature in a Coastal City with a Slope Base Setting. J. Geophys. Res. Atmos. 2016, 121, 5336–5355. [Google Scholar] [CrossRef]
- Hu, Y.; Tan, J.; Grimmond, S.; Ao, X.; Yan, Y.; Liu, D. Observed and Modeled Urban Heat Island and Sea-Breeze Circulation Interactions: A Shanghai Case Study. J. Appl. Meteorol. Climatol. 2022, 61, 239–259. [Google Scholar] [CrossRef]
- Reu Junqueira, J.; Serrao-Neumann, S.; White, I. Developing and Testing a Cost-Effectiveness Analysis to Prioritize Green Infrastructure Alternatives for Climate Change Adaptation. Water Environ. J. 2023, 37, 242–255. [Google Scholar] [CrossRef]


| Public Space Hierarchy | Identifying Factor | Genome Component Indicators | Extracted Contents |
|---|---|---|---|
| Plot genetics | Parcel subdivision type | Squares, courtyards, beaches, streets, village entrances | Pattern |
| Plot function | Places of faith Open space Tourist places | Text | |
| Number of public spaces | Rich, common, crowded | Text | |
| Borderline gene | Boundary composition type | Sea areas, beaches, windbreaks, fences, roads | Pattern and text |
| Boundary layout form | Vertical, parallel, separate | Pattern | |
| Boundary space forms | rectangles, irregular | Pattern | |
| Material gene | Building footprint form | L-shaped, rectangular | Pattern |
| Ancillary structure | Theater, cultural pagoda, village gate | Pattern and text | |
| Location of buildings in the space | In space, enclosing space, embedding space | Pattern and text | |
| Building function | Faith-based buildings, residential buildings, public facilities | Pattern and text | |
| Vegetative | Form of planting, number, species, symbolism | Pattern and text |
| Location | Space Type | Space Genome Components | Graphical Language |
|---|---|---|---|
| Gangtou Village | Temple annex plaza | Temple buildings in the center |  |
| Rectangular boundary | |||
| Vertical sea |  | ||
| Subsidiary theater |  | ||
| Dedou Village | Public courtyard | Residential building enclosure |  |
| Rectangular boundary | |||
| Subsidiary theater |  | ||
| Isolated sea area |  | ||
| Cunliang Village | Open beach | Residential building embedded |  |
| Banded rectangular boundary | |||
| Parallel sea area |  |
| Name | Parameter Selection |
|---|---|
| Simulation location | Naozhou Island (20.91° N, 110.59° E) |
| Number of grids (x, y, z) | 80, 80, 20 |
| Size of x, y, and z grid cells | 2 m, 2 m, 1 m |
| Simulation time | 18 July 2022, 8:00–20:00, 12 h |
| Temperature range | 28–36 °C |
| Humidity range | 70–90% |
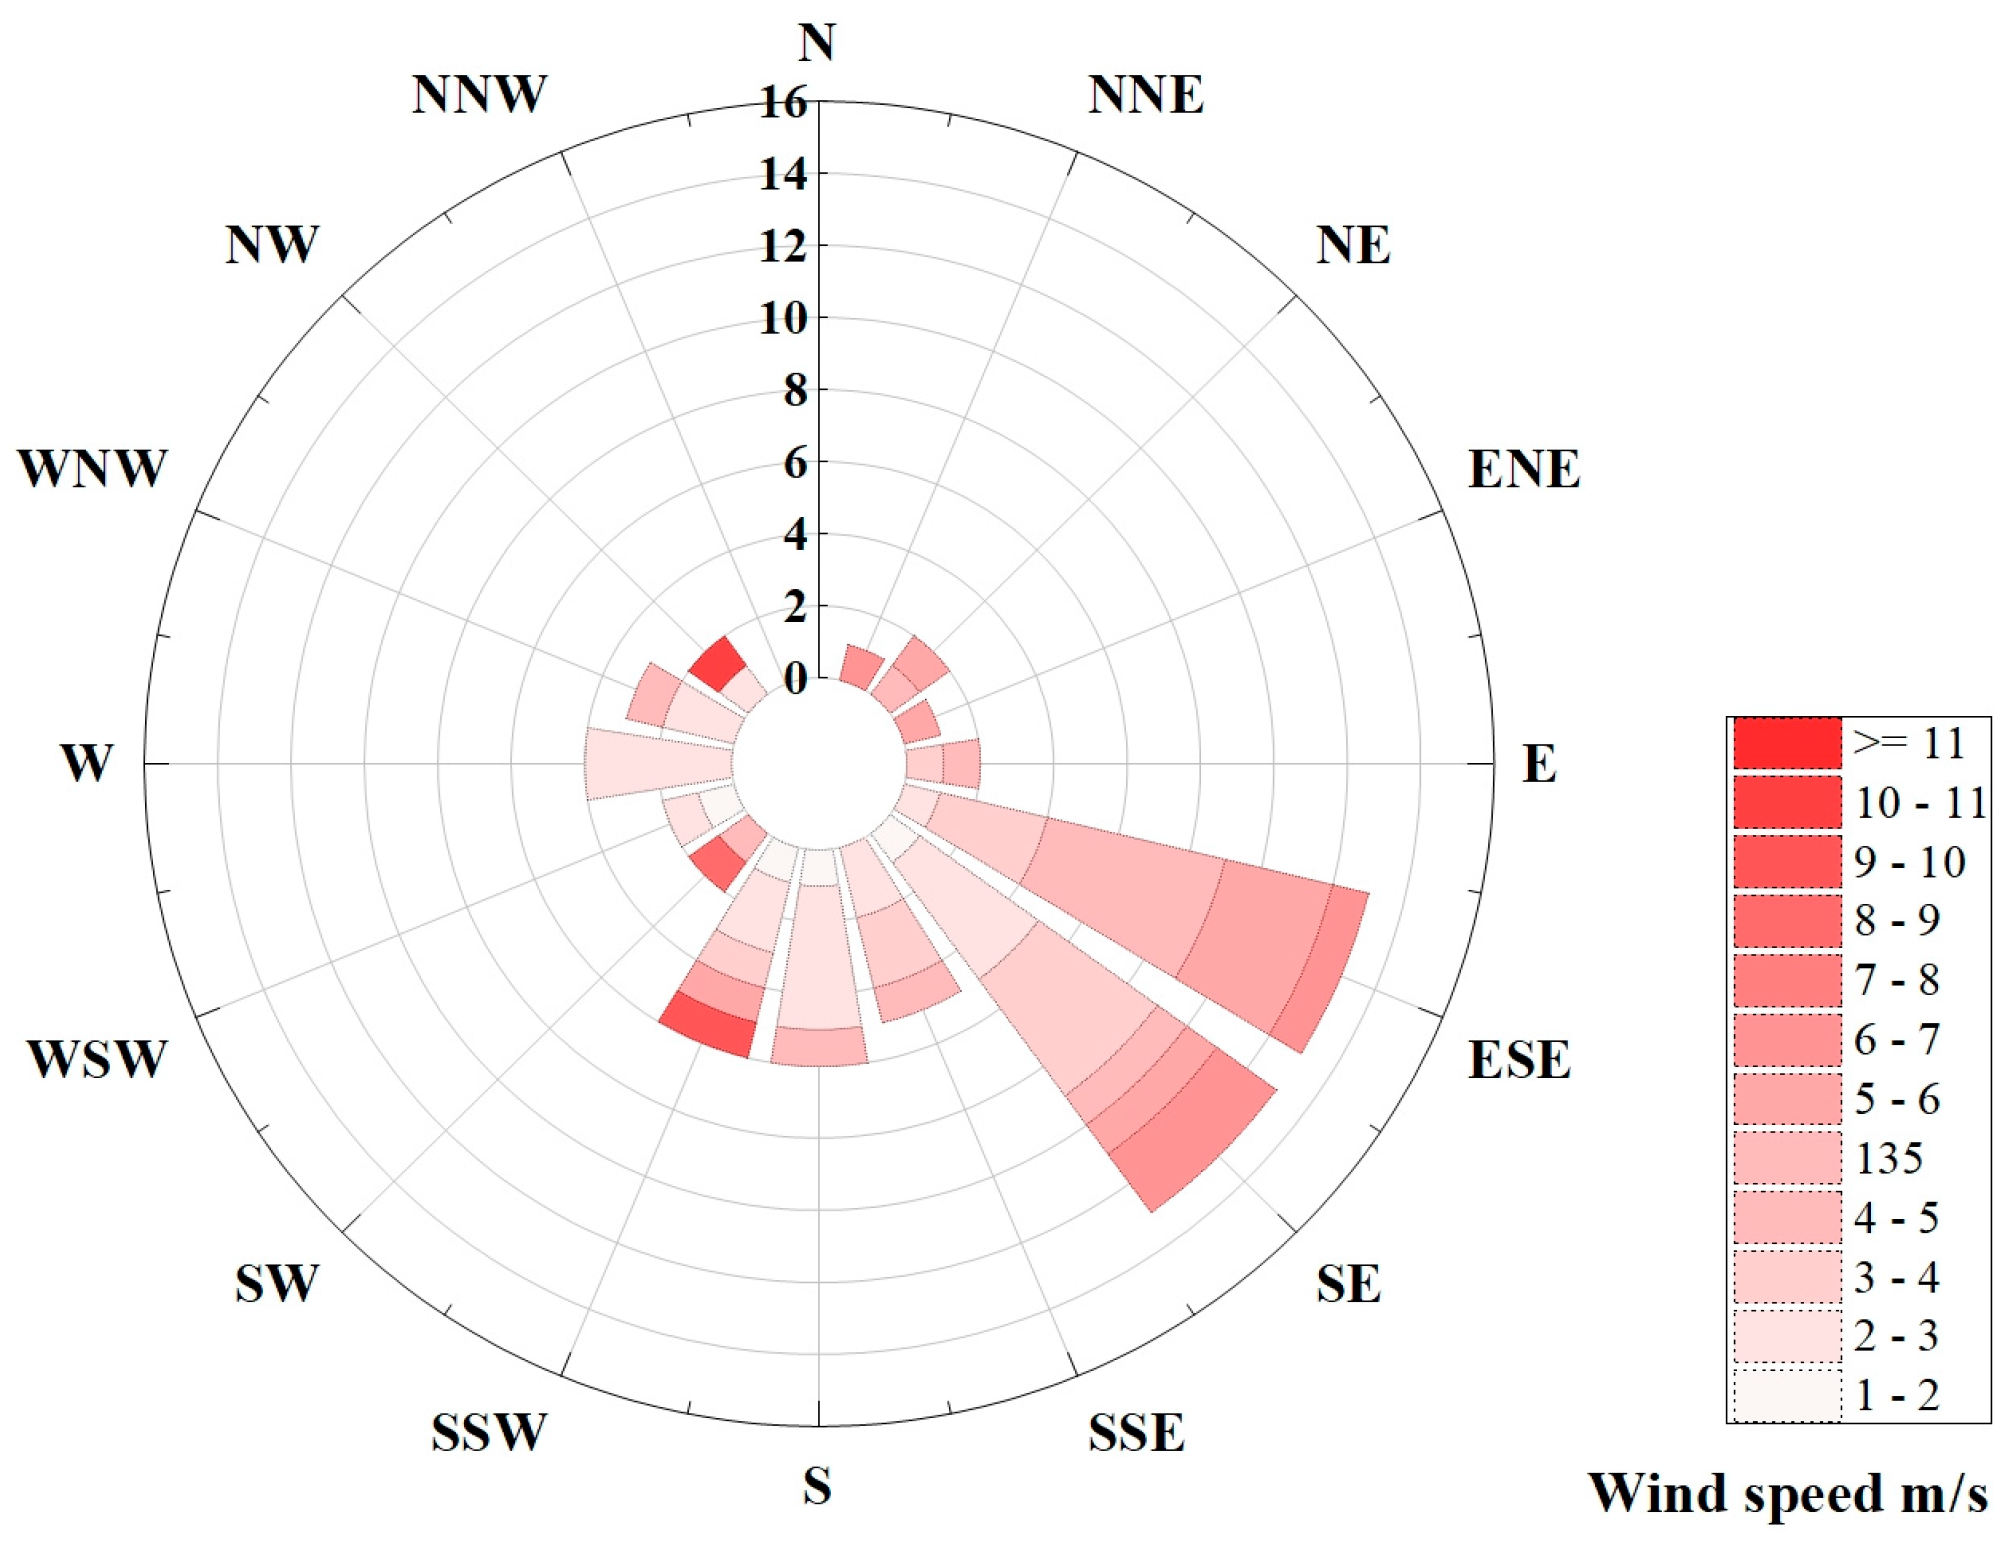
| Wind speed and direction | Data recorded by KESTREL 5500 anemometer (Nielsen-Kellerman Co., Boothwyn, PA, USA), wind direction 135° (southeast) |
| Surface roughness | 0.01 m (ENVI-met5.1.1 default) |
| Cloudiness | 0 |
| Vegetation | Trees 8 m high and 10 m wide, LAD = 4.0 m2/m3; trees 10 m high and 12 m wide, LAD = 5.0 m2/m3; trees 8 m high and 6 m wide, LAD = 3.5 m2/m3 |
| Buildings | Thermal transmittance of walls and roofs: 0.5 W m−2 K−1 (default value) Albedo of walls and roofs: 0.5 (default value) |
| Underlayment | Sand and clay (albedo: 0), concrete (albedo: 0.5), granite (albedo: 0.5), grass (albedo: 0.2), pervious tiles (albedo: 0.2) |
| Meteorological Factors | Validation Metrics | Measurement Point | ||||
|---|---|---|---|---|---|---|
| 1 | 2 | 3 | 4 | 5 | ||
| Air temperature | RMSE/°C | 0.58 | 0.71 | 0.52 | 0.70 | 0.56 |
| MAPE/% | 1.63 | 1.71 | 1.49 | 1.96 | 1.55 | |
| Relative humidity | RMSE/°C | 4.72 | 4.71 | 4.87 | 4.66 | 4.78 |
| MAPE/% | 4.95 | 4.76 | 4.80 | 4.98 | 4.87 | |
| PET Value (°C) | Thermal Sensation |
|---|---|
| ≤11.3 | Cool |
| 11.3–19.2 | Slightly cool |
| 19.2–28.7 | Neutral |
| 28.7–36.0 | Slightly warm |
| 36.0–43.2 | Warm |
| 43.2–53.6 | Hot |
| ≥53.6 | Very hot |
| Public Space Model | Factor | Level | ||
|---|---|---|---|---|
| 1 | 2 | 3 | ||
| Temple square (TS) | T | Ficus (T1) | Olive tree (T2) | Hibiscus (T3) |
| D | 3 m (D1) | 6 m (D2) | 9 m (D3) | |
| U | Concrete + grass (U1) | Permeable brick + grass (U2) | Granite + grass (U3) | |
| Public courtyard (PC) | G | 35% (G1) | 50% (G2) | 65% (G3) |
| C | Arbor + grass (C1) | Shrub + grass (C2) | Tree + shrub + grass (C3) | |
| P | Column planting (P1) | Cluster planting (P2) | Column + cluster (P3) | |
| U | Concrete + grass (U1) | Permeable brick + grass (U2) | Granite + grass (U3) | |
| Open beach (OB) | A | Space west (A1) | Center of space (A2) | Space east (A3) |
| S | Pavilion (S1) | Promenade (S2) | Tensioned membrane (S3) | |
| P | Column planting (P1) | Cluster planting (P2) | Column + cluster (P3) | |
| U | Concrete + grass (U1) | Permeable brick + grass (U2) | Granite + grass (U3) |
| Morning | Afternoon | Night | ||||||||
|---|---|---|---|---|---|---|---|---|---|---|
| Space PC | G1 | G2 | G3 | G1 | G2 | G3 | G1 | G2 | G3 | |
| C1 | 39.87 | 39.85 | 39.92 | 48.79 | 49.72 | 48.12 | 33.64 | 33.34 | 33.67 | |
| C2 | 40.02 | 40.03 | 40.62 | 49.52 | 48.19 | 48.37 | 33.30 | 33.67 | 33.85 | |
| C3 | 39.45 | 39.87 | 40.02 | 48.21 | 48.35 | 49.54 | 33.85 | 33.88 | 33.27 | |
Disclaimer/Publisher’s Note: The statements, opinions and data contained in all publications are solely those of the individual author(s) and contributor(s) and not of MDPI and/or the editor(s). MDPI and/or the editor(s) disclaim responsibility for any injury to people or property resulting from any ideas, methods, instructions or products referred to in the content. |
© 2025 by the authors. Licensee MDPI, Basel, Switzerland. This article is an open access article distributed under the terms and conditions of the Creative Commons Attribution (CC BY) license (https://creativecommons.org/licenses/by/4.0/).
Share and Cite
Pang, Y.; Tang, X.; Wang, C.; Li, L. Creating a Thermally Comfortable Environment for Public Spaces in Coastal Villages Considering Both Spatial Genetics and Landscape Elements. Sustainability 2025, 17, 2488. https://doi.org/10.3390/su17062488
Pang Y, Tang X, Wang C, Li L. Creating a Thermally Comfortable Environment for Public Spaces in Coastal Villages Considering Both Spatial Genetics and Landscape Elements. Sustainability. 2025; 17(6):2488. https://doi.org/10.3390/su17062488
Chicago/Turabian StylePang, Yue, Xueyu Tang, Cheng Wang, and Li Li. 2025. "Creating a Thermally Comfortable Environment for Public Spaces in Coastal Villages Considering Both Spatial Genetics and Landscape Elements" Sustainability 17, no. 6: 2488. https://doi.org/10.3390/su17062488
APA StylePang, Y., Tang, X., Wang, C., & Li, L. (2025). Creating a Thermally Comfortable Environment for Public Spaces in Coastal Villages Considering Both Spatial Genetics and Landscape Elements. Sustainability, 17(6), 2488. https://doi.org/10.3390/su17062488