Article

Long-Term Response of Soil Moisture to Vegetation Changes in the Drylands of Northern China

1
Yinshanbeilu Grassland Eco-Hydrology National Observation and Research Station, China Institute of Water Resources and Hydropower Research, Beijing 100038, China
2
The National Key Laboratory of Water Disaster Prevention, Nanjing Hydraulic Research Institute, Nanjing 210029, China
3
Research Center for Climate Change, Nanjing 210029, China
4
Ministry of Water Resources, Institute of Water Resources for Pastoral Area, Hohhot 010020, China
5
Yangtze Institute for Conservation and Development, Nanjing 210098, China
*
Author to whom correspondence should be addressed.
Sustainability 2025, 17(6), 2483; https://doi.org/10.3390/su17062483
Submission received: 8 January 2025 / Revised: 2 March 2025 / Accepted: 4 March 2025 / Published: 12 March 2025
(This article belongs to the Special Issue Ecology, Environment, and Watershed Management)

Abstract

:
Soil moisture plays a critical role in the water and energy cycle within the soil–vegetation–atmosphere system and is a primary limiting factor in dryland ecosystems. Given the ongoing vegetation restoration in drylands, understanding the impact of vegetation changes on soil moisture is crucial for maintaining ecosystem stability and ensuring the sustainability of restoration efforts. This study combined long-term satellite data with eco-hydrological modeling to investigate the interannual and seasonal responses of soil moisture to vegetation changes in the Yinshanbeilu region during 1982–2018. The results indicated that vegetation in the region predominantly exhibited a greening trend, with 60.43% of the area experiencing significant increases in LAI. In areas with vegetation greening, soil moisture declined, with the effect being more pronounced at deeper soil profiles. Furthermore, the soil moisture trends shifted from wetting to drying, or, in more cases, from drying to intensified drying. The influence of vegetation greening on soil moisture exhibited seasonal variations, with more significant effects found in summer and autumn. This study highlights the complex responses of soil moisture to vegetation changes in grassland ecosystems in northern China’s drylands and provides a scientific guidance for ecological restoration and water management in these regions.

1. Introduction

Soil moisture constitutes a vital component of the soil–vegetation–atmosphere continuum [1,2]. Changes in soil moisture not only directly impact plant growth and productivity but also regulate water and energy exchanges between the land and atmosphere, thereby affecting climate systems [3,4,5] and ecological processes [6,7,8]. Drylands occupy about 41% of the Earth’s land area and sustain over 38% of the global population [9]. In comparison to other ecosystems, dryland ecosystems are water-scarce and ecologically fragile, resulting in significant variability in vegetation and soil moisture [10,11]. In recent decades, drylands have undergone substantial vegetation greening globally [12,13,14], which has altered local ecosystem functions and also impacted the soil moisture dynamics over space and time. Soil moisture is the primary constraint in dryland ecosystems [15,16] and functions as the main water source for vegetation. Meanwhile, vegetation growth can directly and indirectly modulate the soil moisture dynamics by intercepting precipitation and regulating evapotranspiration through the canopy [17,18,19], thereby affecting the terrestrial water cycle process. Understanding how vegetation changes affect soil moisture is, therefore, essential, particularly in water-scarce dryland regions.
A growing body of studies has explored the interactions between vegetation changes and soil moisture across various temporal and spatial scales [16,20,21]. However, controversy remains regarding whether vegetation greening results in soil drying or wetting. Research over the past decades has consistently shown that vegetation greening enhances canopy interception and transpiration, leading to excessive root-zone soil water uptake [15,20,22,23]. This increased water consumption can result in a negative soil water balance, causing soil desiccation [24,25,26,27,28,29], reducing groundwater storage [30,31], and, in severe cases, contributing to ecological droughts [32]. On the other hand, other studies have highlighted the positive impacts of vegetation greening on soil moisture with plant canopy shading, lowering surface temperatures, and reducing soil evaporation [18,33,34]. The ecological functions of vegetation in water conservation and storage have also been reported [35]. In addition, vegetation changes can significantly influence precipitation patterns by altering the local water and energy balance. Vegetation greening may enhance precipitation, potentially offsetting soil moisture losses driven by elevated evapotranspiration [36,37,38]. Overall, the effect of vegetation changes on soil moisture varies with factors such as climate conditions [20,39,40], vegetation types [28,41,42], and vegetation age [24].
Although significant advances have been made in studying the response of soil moisture to vegetation changes, existing research has largely concentrated on forests or shrublands in semi-humid and semi-arid areas where vegetation restoration projects are implemented [28,42,43]. In contrast, there has been less attention to quantitative research on the relationship between grassland ecosystems and soil moisture in drylands. Grasslands are one of the largest ecosystems globally, covering about 30% of the Earth’s land area, and play a vital role in maintaining ecosystem functions. The interaction between soil moisture and grassland ecosystems directly influences pasture productivity, food supplies, and human livelihoods, particularly in water-scarce regions. Therefore, further investigation into the effects of grassland greening on soil moisture is needed. Furthermore, most research relied on traditional experimental approaches and short-term observations [44,45], which are effective for studying soil moisture changes at smaller scales, such as patches or hillslopes [29,35,39,45]. However, given the significant spatial and temporal heterogeneity of soil moisture, findings from the smaller-scale studies, especially those involving vegetation restoration, may not be applicable to larger regional or global scales [46]. Recent advances in remote sensing techniques integrated with Earth system models or land surface models have been extensively applied to investigate the regional hydrological responses to environmental changes [21,47,48,49], enabling large-scale and long-term analyses that capture spatial and temporal variations.
The grasslands in the Yinshanbeilu region are the main component of China’s northern sand-proof belt, facing severe degradation of grasslands, desertification, and soil erosion, along with highly fragile ecological conditions. These challenges pose a serious threat to the ecological security of northern China. In response, vegetation restoration and ecological protection programs have been initiated in recent years, gradually restoring some ecological functions. However, research on vegetation dynamics and its hydrological impacts in the region is still limited. Most existing studies are limited to small watersheds or single-point observations and experiments [50,51], lacking comprehensive and long-term regional analysis, which hinders the overall understanding of eco-hydrological processes in the region and their responses to restoration measures and vegetation changes. Therefore, there is an urgent need for large-scale, long-term studies to evaluate hydrological responses to vegetation changes, particularly by integrating satellite remote sensing data and land surface models, to provide a scientific basis for sustainable ecological management in this ecologically sensitive area.
This study integrates long-term remote sensing data with the Community Land Model (CLM) to explore the responses of soil moisture to vegetation changes in the Yinshanbeilu region from 1982 to 2018. The specific objectives are to
  • Assess the performance of the CLM in estimating soil moisture in this region;
  • Analyze long-term soil moisture variations under the influence of vegetation changes;
  • Investigate the seasonal and interannual responses of soil moisture to vegetation changes.
By addressing these objectives, this study aims to enhance the understanding of how vegetation changes affect soil moisture, providing key insights for ecosystem restoration, water management, and climate adaptation strategies.

2. Materials and Methods
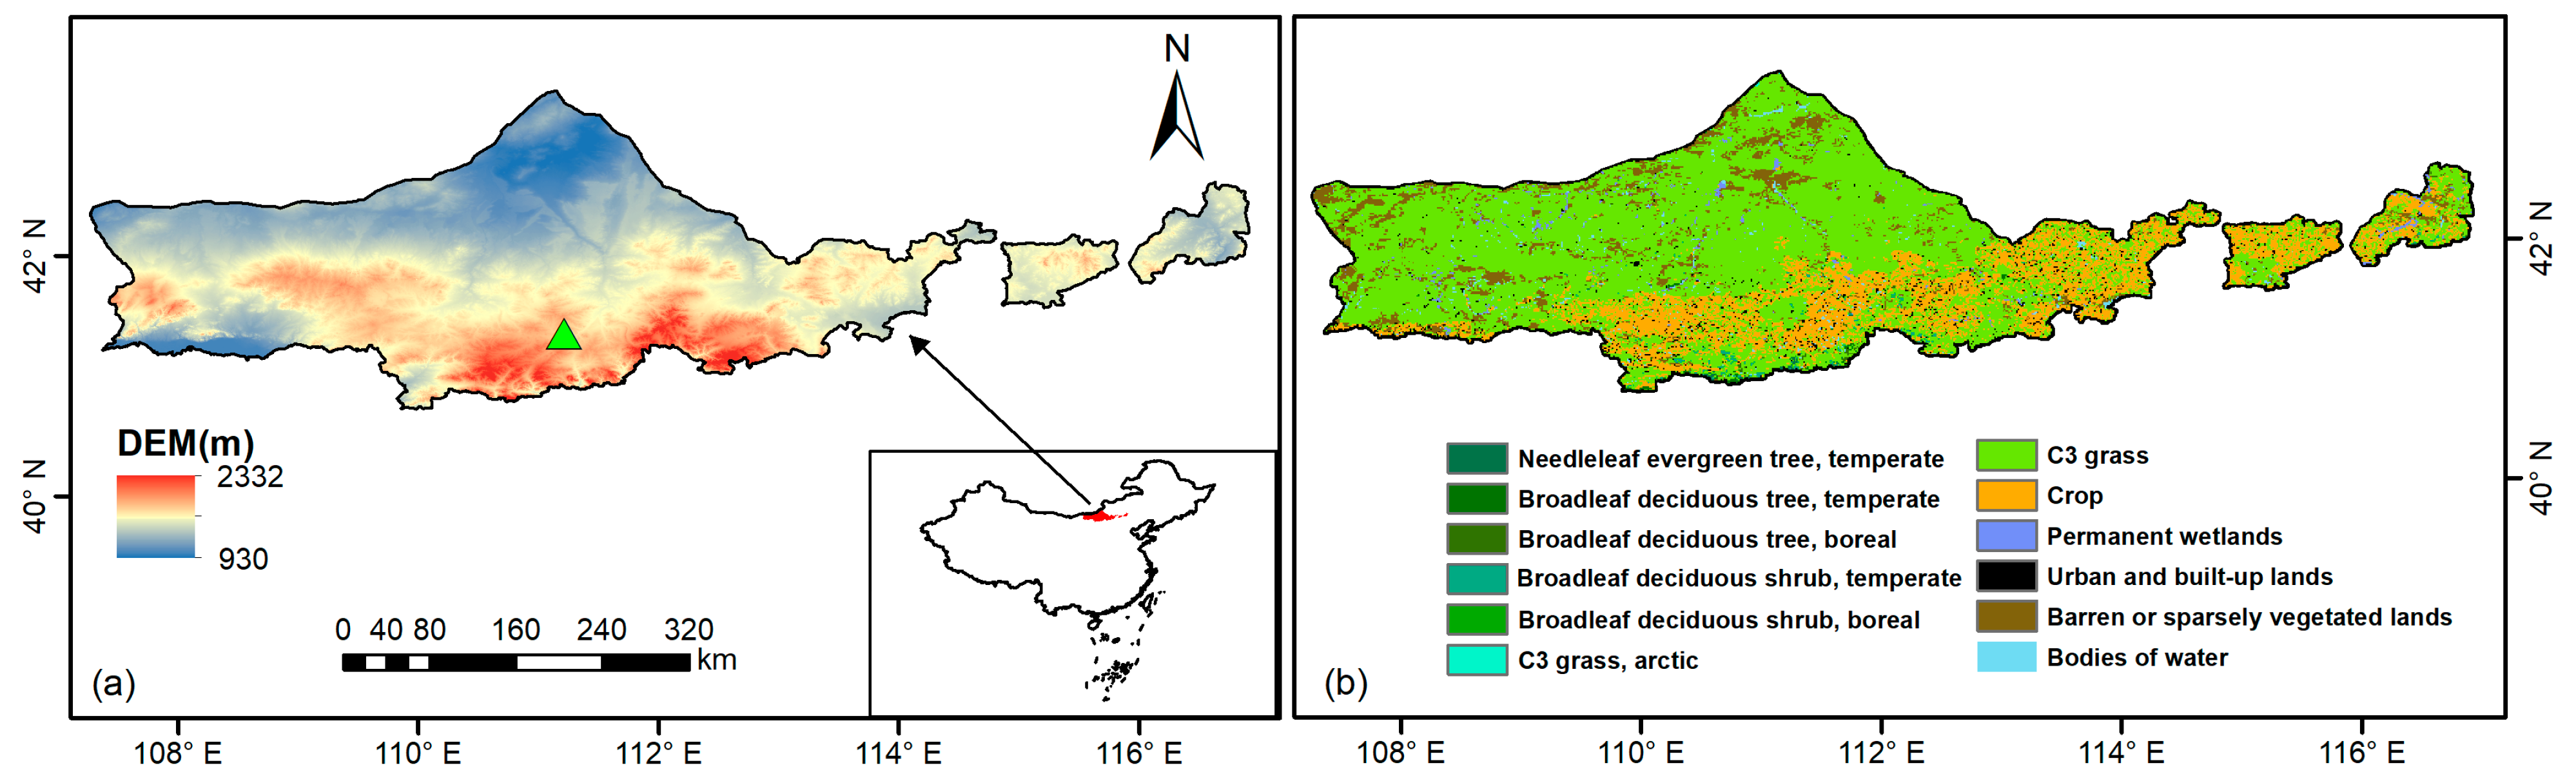
2.1. Study Area

This work focuses on the Yinshanbeilu region (107°17′–116°53′ E and 40°43′–43°23′ N), located in central Inner Mongolia, as shown in Figure 1a. Situated in the transitional zone between the Yinshan Mountains and the Mongolian Plateau, it is a typical area of agricultural–livestock farming interaction, covering a total area of 97,250.5 km2. The landscape of the Yinshanbeilu region is characterized by high plains, low hills, and basins, with altitudes decreasing from south to north. The region experiences an arid to semi-arid climate, with average annual precipitation ranging from 200 to 400 mm, a mean annual temperature between 1.3 and 3.9 °C, and annual evaporation ranging from 1748 to 2300 mm [52]. Figure 1b shows the plant functional types (PFTs) of Yinshanbeilu that are derived from Ran and Ma [53]. The primary vegetation types are forest steppe and desert steppe, with grasslands predominating in the north and crops in the south. Most of the region consists of desert grasslands, characterized by a simple ecosystem structure, making it extremely vulnerable to both human activities and natural disasters.

2.2. Model Description

The Community Land Model, version 4.5 (CLM4.5), is the land component of the Community Earth System Model, version 1.2 (CESM1.2) [54]. It has been demonstrated to be an effective tool for analyzing ecological and hydrological processes across various spatial and temporal scales [55,56]. CLM4.5 simulates biogeophysical and biogeochemical processes, including canopy and soil hydrology, energy fluxes between land and atmosphere, carbon and nitrogen cycling, and vegetation dynamics and phenology. The model accounts for heterogeneity in land surface characteristics within the grid scale by using nested sub-grids, where each grid contains multiple land units, columns, and PFTs. To better represent land surface hydrological processes, CLM4.5 divides the soil into fifteen layers with varying depths, with soil water calculated in the top ten layers, while the bottom five layers are treated as bedrock. Vertical soil moisture movement is governed by factors such as infiltration, gravity, surface and subsurface runoff, diffusion along gradients, canopy transpiration via root absorption, and interactions with groundwater. Further details are available in Oleson et al. [54].

2.3. Data Sources and Experimental Design

The datasets used in this study are presented in Table 1. The GLOBMAP leaf area index (LAI), version 3, delivers LAI data at a global scale from 1981 to 2020 at an 8 km resolution [57]. The China Meteorological Forcing Dataset (CMFD) was used to drive the model, which provides high-resolution forcing data with a 3 h temporal interval and a 0.1° × 0.1° spatial resolution [58,59]. It was created by integrating remotely sensed data, reanalysis products, and ground-based observations, covering the period from 1979 to 2018. The dataset combines Advanced Very-High-Resolution Radiometer (AVHRR) LAI (1981–2000) at a half-month interval and Moderate Resolution Imaging Spectroradiometer (MODIS) LAI (2001–present) at an eight-day interval. The PFTs dataset, with a 1 km resolution, was obtained from Ran and Ma [53]. Datasets of soil properties, including clay, sand, and organic matter fractions, with a 1 km resolution, were sourced from Shangguan et al. [60].
Soil moisture data from the ERA5-Land reanalysis product [61] were adopted to assess the simulated soil moisture. The ERA5-Land reanalysis product delivers a comprehensive and long-term perspective on the evolution of land processes with an improved spatial resolution compared to ERA5. It provides soil moisture data at four depth layers: 0–7 cm, 7–28 cm, 28–100 cm, and 100–289 cm. The quality of the ERA5-Land soil moisture has been comprehensively evaluated through comparisons with in situ observations, satellite-derived datasets, and other reanalysis products [62,63,64]. To further evaluate the model, we compared the simulated daily soil moisture with in situ observations from the Yinshanbeilu Grassland Eco-hydrology National Observation and Research Station. The observations provided daily soil moisture data (at 10 cm, 20 cm, and 30 cm depths) for the period 2014–2018. Considering the impact of soil freezing on the performance of the observation instruments, only the data from April to October each year were used.
To investigate the impact of vegetation changes on soil moisture, two simulation scenarios were established for the period from 1982 to 2018. The first simulation (CTL) used a monthly LAI from 1982, obtained from the GLOBMAP dataset, which remained constant throughout the simulation period, to represent a static vegetation condition. In contrast, the second simulation (DYN) employed a dynamically changing monthly LAI from 1982 to 2018, enabling the model to capture temporal changes in vegetation cover during the study period. In both scenarios, only vegetation cover, as represented by LAI, was allowed to vary, while vegetation types and soil properties remained unchanged. The two simulations were run at a resolution of 0.05° × 0.05°, with a time step of 1800 s. Before the formal simulations, we recycled the meteorological forcing for approximately 80 years as the spin-up to reach equilibrium.

2.4. Analysis Methods

The variations in the LAI, precipitation, air temperature, and soil moisture were quantified using the slopes of linear regressions, while t-tests were applied to assess trend significance. ERA5-Land monthly soil moisture data from 2000 to 2018 were utilized to evaluate simulated soil moisture, focusing on three depth layers: 0–7 cm, 7–28 cm, and 28–100 cm. Model performance was evaluated through three metrics, including a Pearson correlation coefficient (CC), root mean square error (RMSE), and mean bias. To explore soil moisture responses to vegetation changes, we calculated the differences between the DYN and CTL experiments, focusing on four layers: 0–7 cm (surface), 7–28 cm (shallow), 28–100 cm (deep), and 0–100 cm (total profile). The differences were analyzed at annual and seasonal scales, with t-tests applied to determine differences of statistical significance.

3. Results

3.1. Changes in Vegetation Cover and Climate

Vegetation changes across the Yinshanbeilu region were analyzed using a satellite-based LAI derived from the GLOBMAP product during 1982–2018. Figure 2a,c display the spatial distribution of the mean annual and growing season LAI, respectively. Overall, the LAI decreased from southeast to northwest. Areas with lower LAI values were predominantly desert steppes, while regions with higher LAI values were primarily covered by grasslands, crops, and forests. The LAI pattern during the growing season closely resembled the annual mean but generally showed higher values, reflecting the enhanced vegetation activity during this period. Figure 2b,d illustrate the linear trends in the mean annual and growing season LAI during 1982–2018. Most areas exhibited an upward trend in the mean annual LAI, especially in the eastern and southwestern areas, with 60.43% of the area experiencing significant increases. Conversely, a few regions showed a declining trend in the LAI, potentially attributed to regional climate change or human disturbances. Notably, the increasing trend of the growing season LAI was more pronounced than the annual mean, with 74.06% of the region exhibiting significant increases.
Figure 2e,f present the interannual time series of an LAI anomaly and cumulative anomaly from 1982 to 2018, respectively. The annual mean and growing season LAI exhibited significant upward trends of 0.0009 m2 m−2 yr−1 and 0.0020 m2 m−2 yr−1, respectively, indicating a general improvement in vegetation over the past 37 years. Cumulative anomalies of both the annual mean LAI and growing season LAI showed notable declines during the 1980s and 1990s, followed by significant increases after 2000. These variations may be related to regional climate change or vegetation restoration efforts, such as the Grain for Green Program (GGP) and the Three-North Shelterbelt Forest Program (NSFP). In general, the vegetation cover in the Yinshanbeilu region demonstrated a trend of improvement, particularly during the growing season. However, localized areas of vegetation degradation remain a concern, highlighting the need for targeted interventions to mitigate ecological decline and promote sustainable land management practices.
The spatial patterns of mean annual precipitation (MAP) and mean annual temperature (MAT) are presented in Figure 3a,b, respectively. The MAP decreased from southeast to northwest, with higher precipitation observed in the southeastern regions and lower values in the northwest. This distribution is influenced by the topography and climate pattern of the region, as the southeast is closer to moist air sources, while the northwest is located in the arid transition zone. In contrast, the MAT exhibited an opposite pattern, increasing from southeast to northwest. The linear trends in MAP and MAT from 1982 to 2018 are shown in Figure 3c,d, respectively. The MAP demonstrated an increasing trend across most of the region, increasing by 1.49 mm per year on average (Figure 3e), and significant increases are observed in the central areas. Meanwhile, the MAT showed a consistent and significant warming trend across the entire region, rising by an average of 0.05 °C per year (Figure 3f). The increase in precipitation may have positively influenced vegetation growth and ecological restoration efforts. However, the concurrent warming trend may enhance evapotranspiration, potentially exerting adverse effects on the soil water balance and amplifying challenges related to water availability.

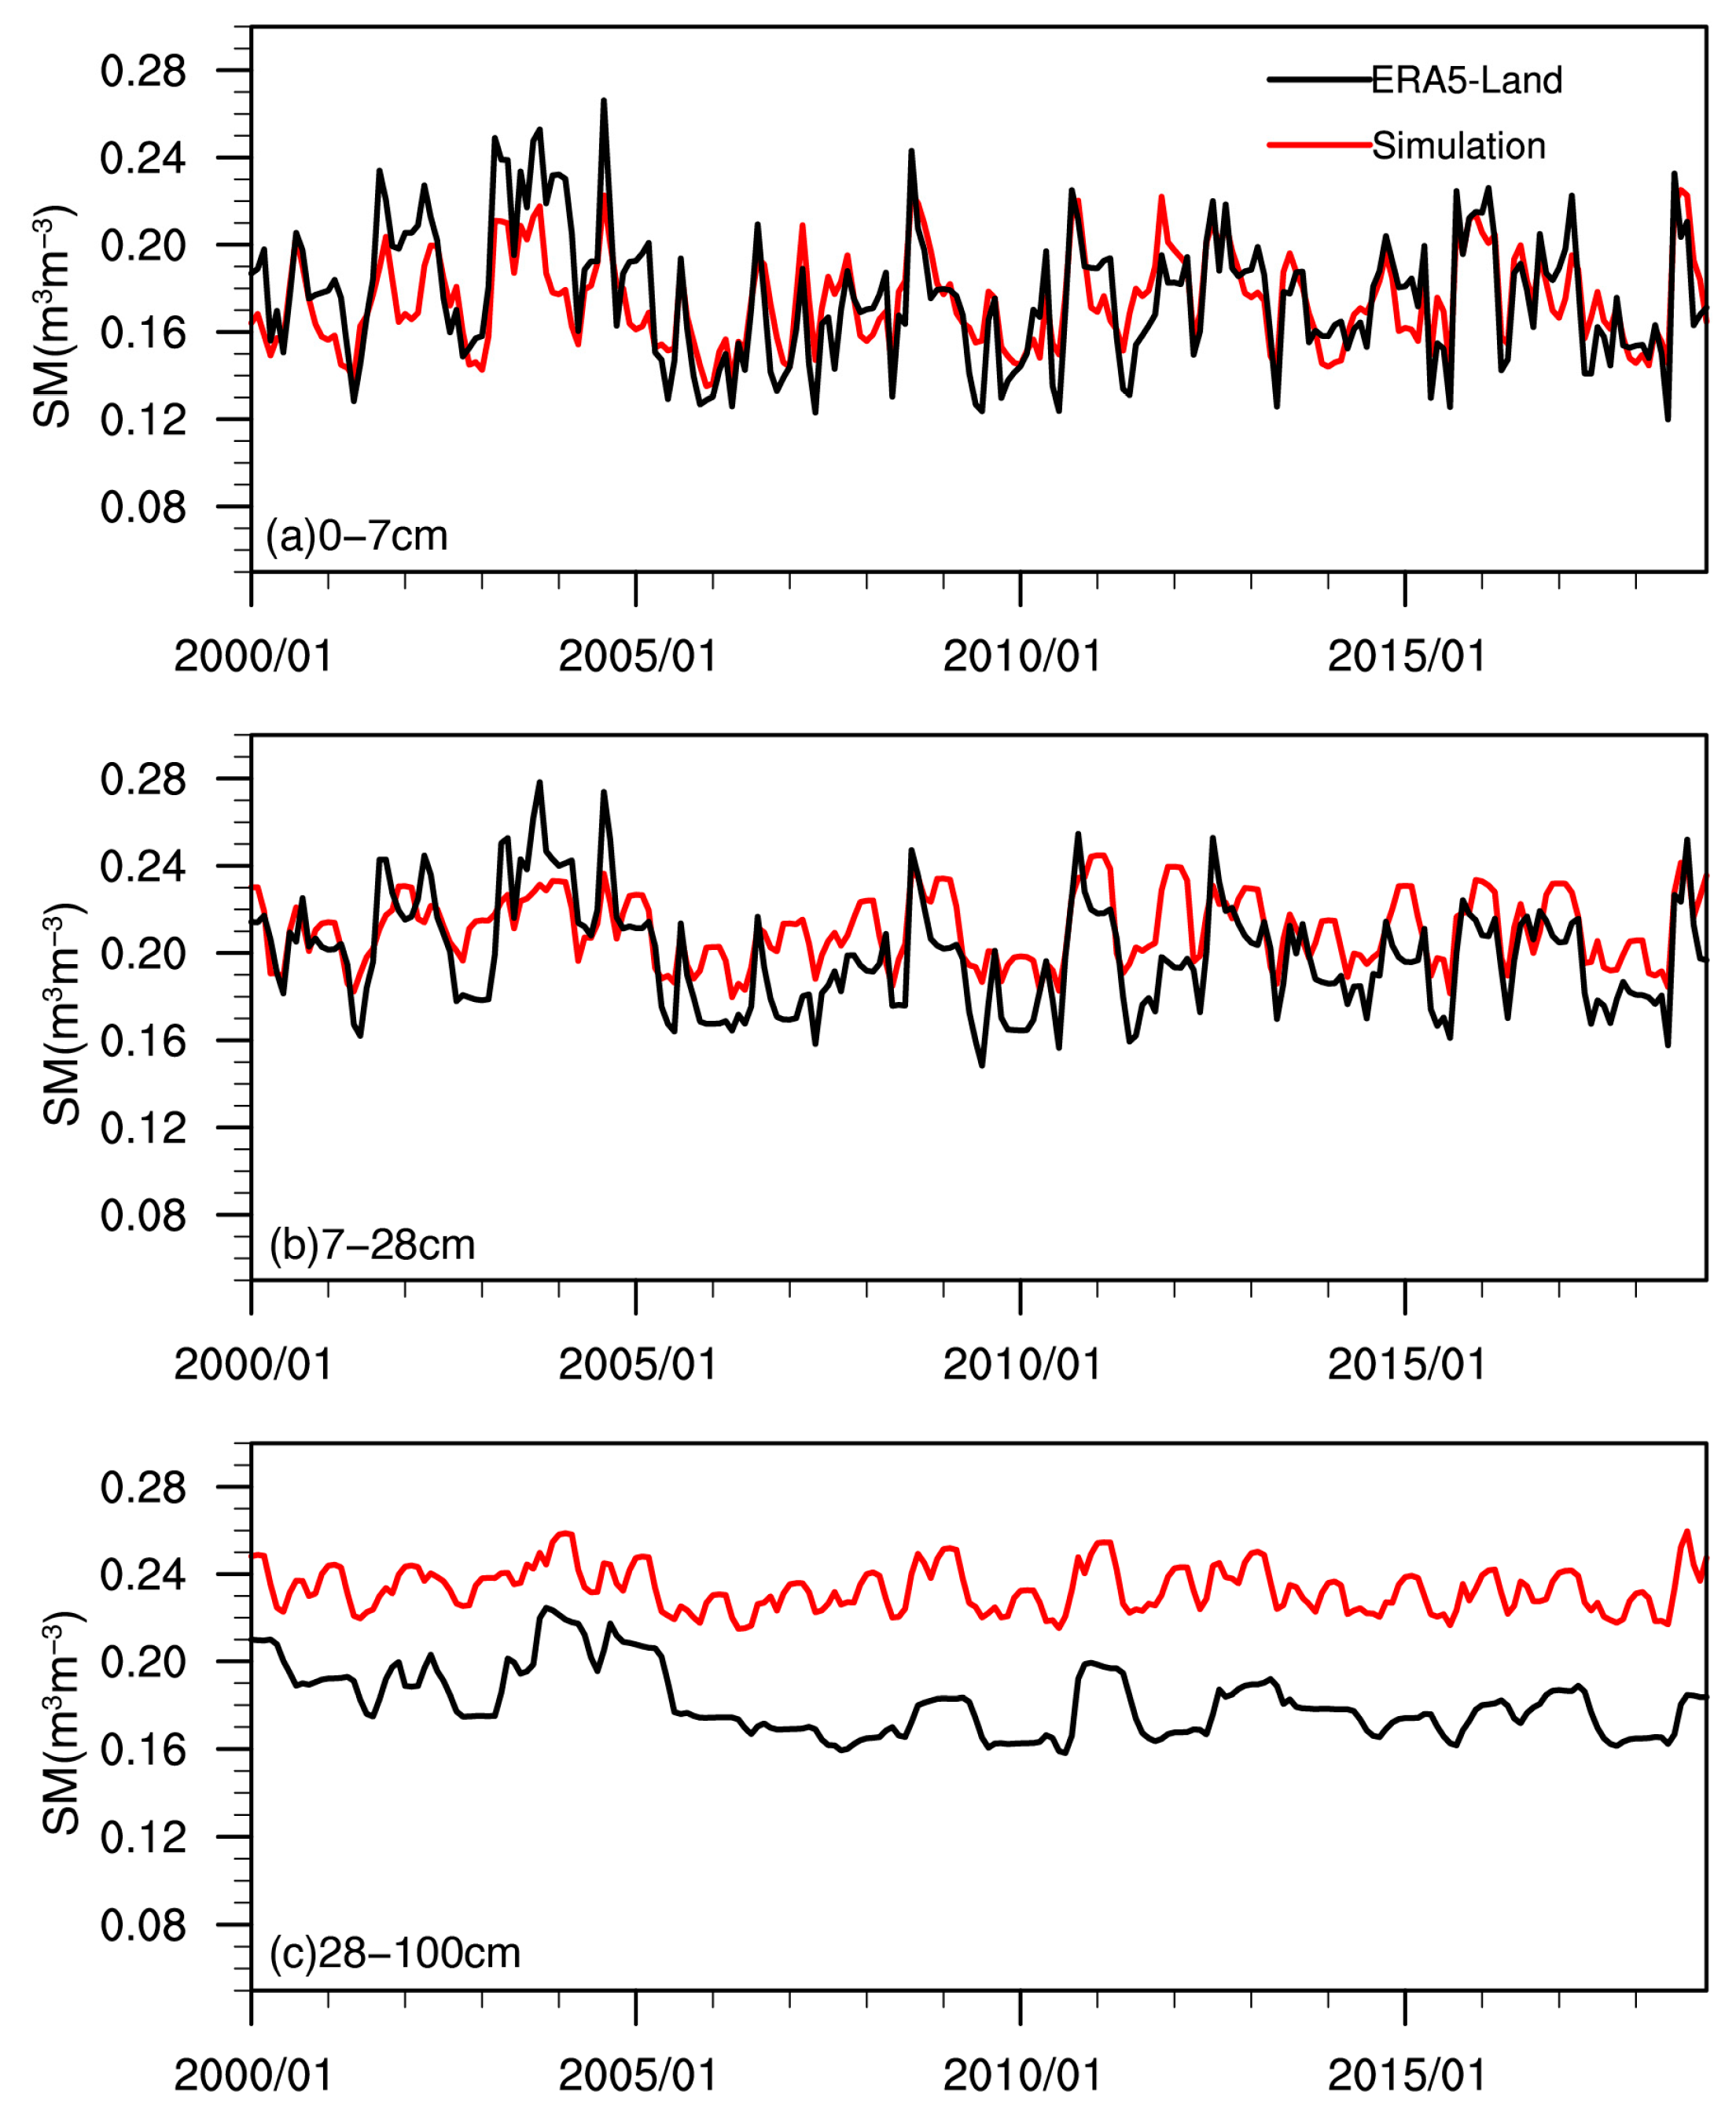
3.2. Model Performance

Compared to the ERA5-Land soil moisture, the model exhibited stronger correlations with soil moisture at 0–7 cm and 7–28 cm (Figure 4a,d). However, the correlation weakened at depths of 7–28 cm and 28–100 cm in the northwestern part, which is predominantly covered by desert steppes. The area-average CC over the Yinshanbeilu region was 0.63 and 0.56 for the 0–7 cm and 7–28 cm soil moisture, respectively, while the average RMSE was 0.07 m3 m−3 and 0.04 m3 m−3, respectively. The model generally overestimated 0–7 cm soil moisture in the northwestern area but tended to underestimate moisture in most other parts of the region. On average, the model slightly underestimated soil moisture in the 0–7 cm layer, with a bias of −0.002 m3 m−3, and overestimated the soil moisture in the 7–28 cm and 28–100 cm layers, with biases of 0.01 m3 m−3 and 0.05 m3 m−3, respectively.
Figure 5 compares the monthly time series of ERA5-Land soil moisture and simulated soil moisture during 2000–2018 at varying depths. The model demonstrated good performance in capturing the variations in 0–7 cm soil moisture (Figure 5a), effectively reflecting the sensitivity of surface soil moisture to seasonal fluctuations and precipitation changes. However, some discrepancies were observed in the simulated 7–28 cm and 28–100 cm soil moisture time series when compared to ERA5-Land datasets. Specifically, at the 7–28 cm depth, the model exhibited less variability, failing to capture certain peaks and lows observed in the ERA5-Land data (Figure 5b). In the case of the 28–100 cm soil moisture, the model tended to overestimate moisture levels, although it still captured the overall trends and variations reasonably well (Figure 5c). Overall, as soil depth increased, the simulation accuracy appeared to decline, as indicated by a reduction in the CC, an increase in the RMSE, and an increase in the mean bias. Nevertheless, the simulated soil moisture effectively captured the dynamic spatial patterns in the Yinshanbeilu region and agreed well with the temporal trends of area-average soil moisture across the entire region.
As shown in Figure 6, the simulation results showed good agreement with in situ observations at 10 cm depth, capturing seasonal and interannual variations effectively. However, the model tended to overestimate soil moisture at 20 cm and 30 cm depths, with greater discrepancies observed at 30 cm, particularly in 2016 and 2017. This indicates potential challenges in simulating deeper soil water dynamics, possibly arising from inaccurate soil parameters or limitations in representations of water transport processes. Overall, the model performed well for surface layers but requires improvements for deeper soil moisture simulations.

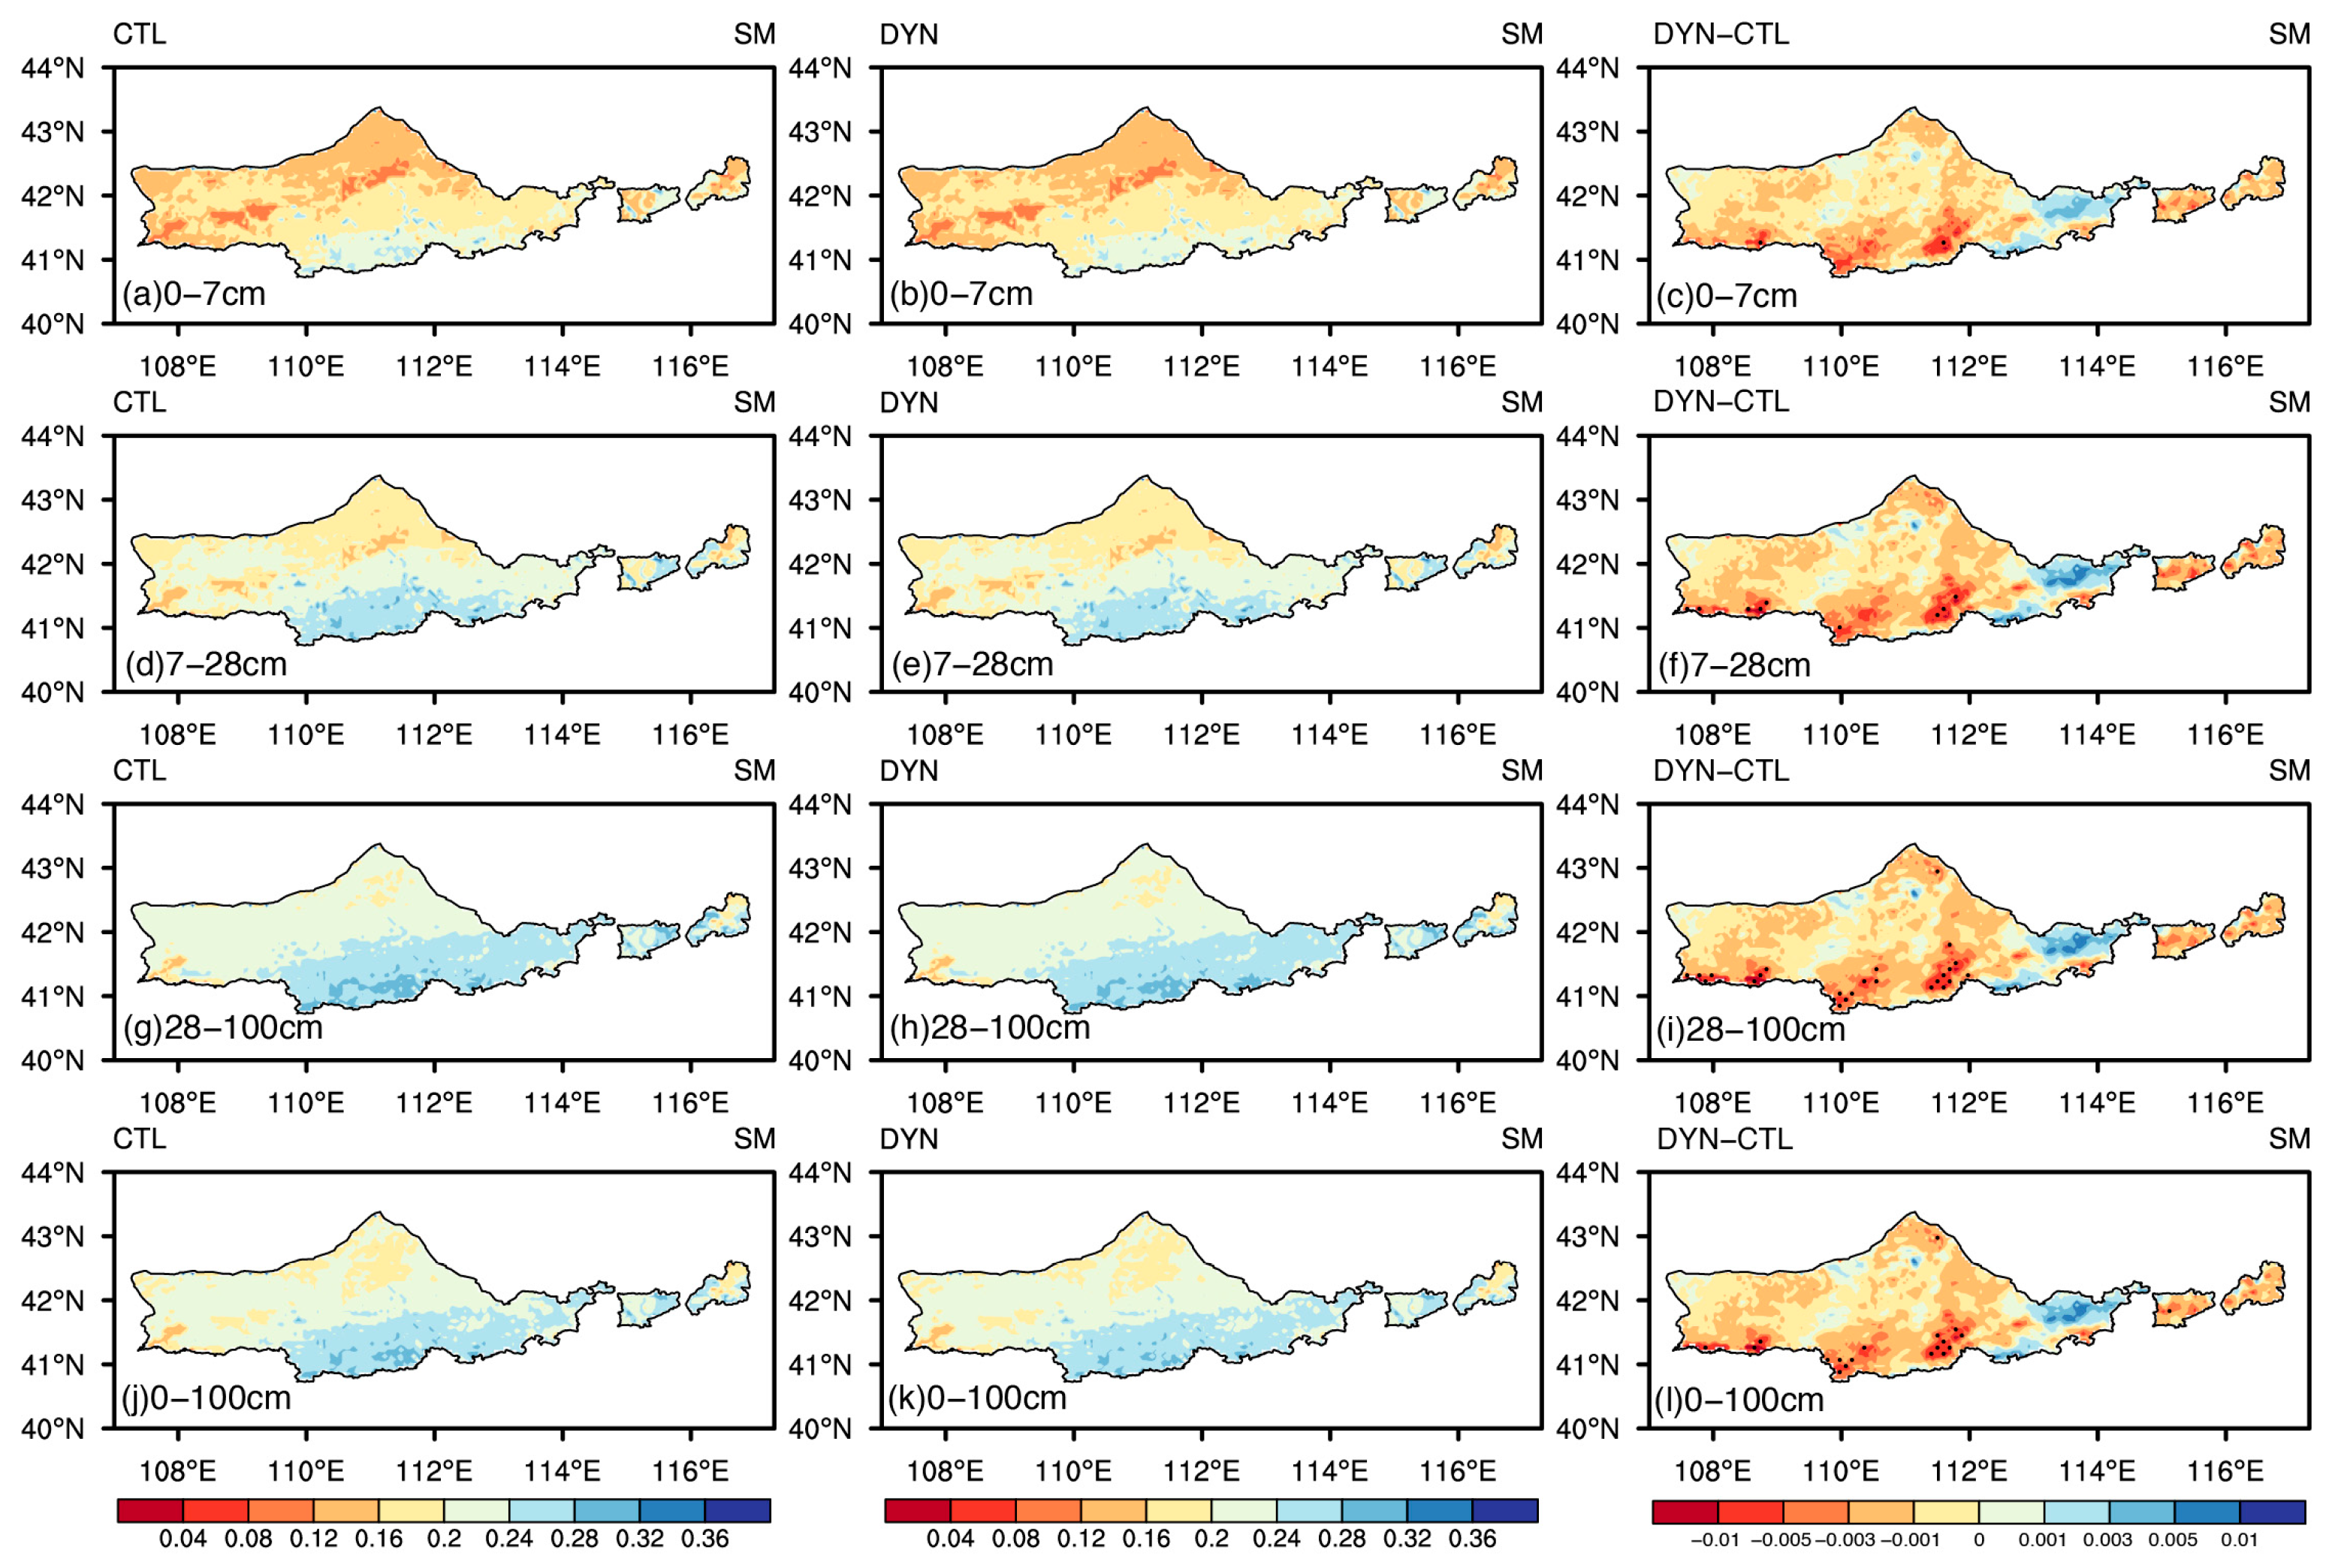
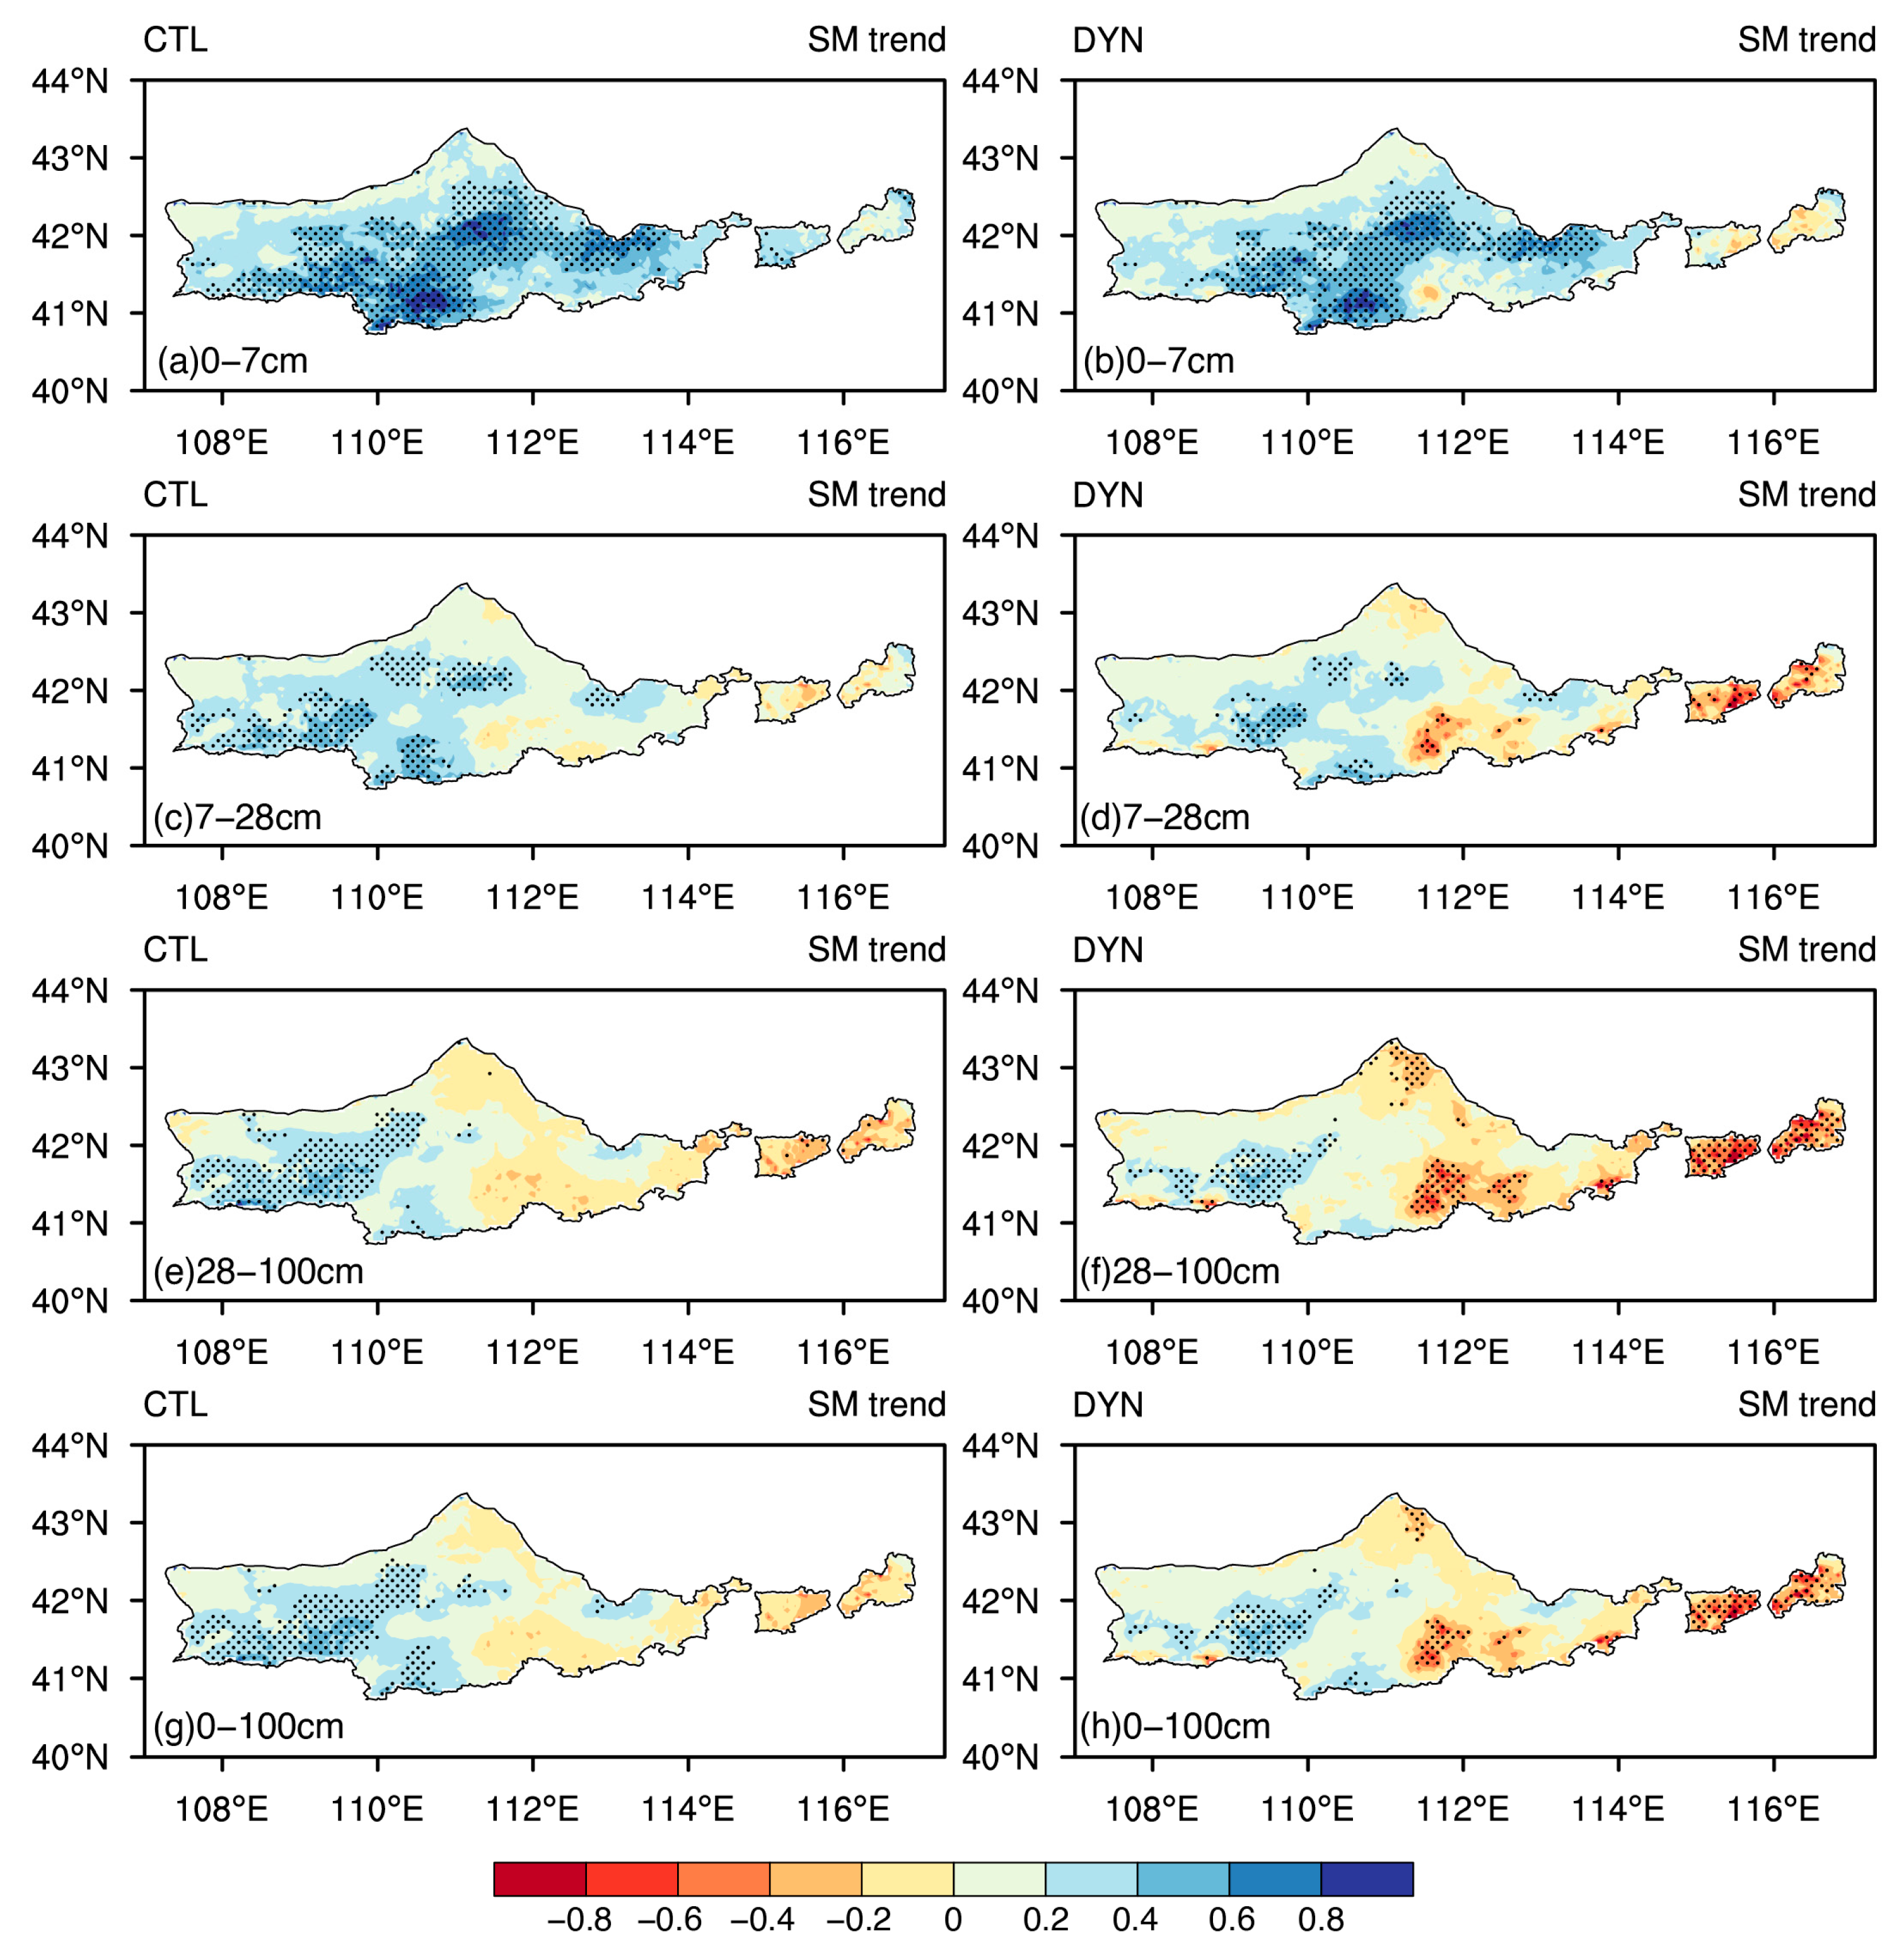
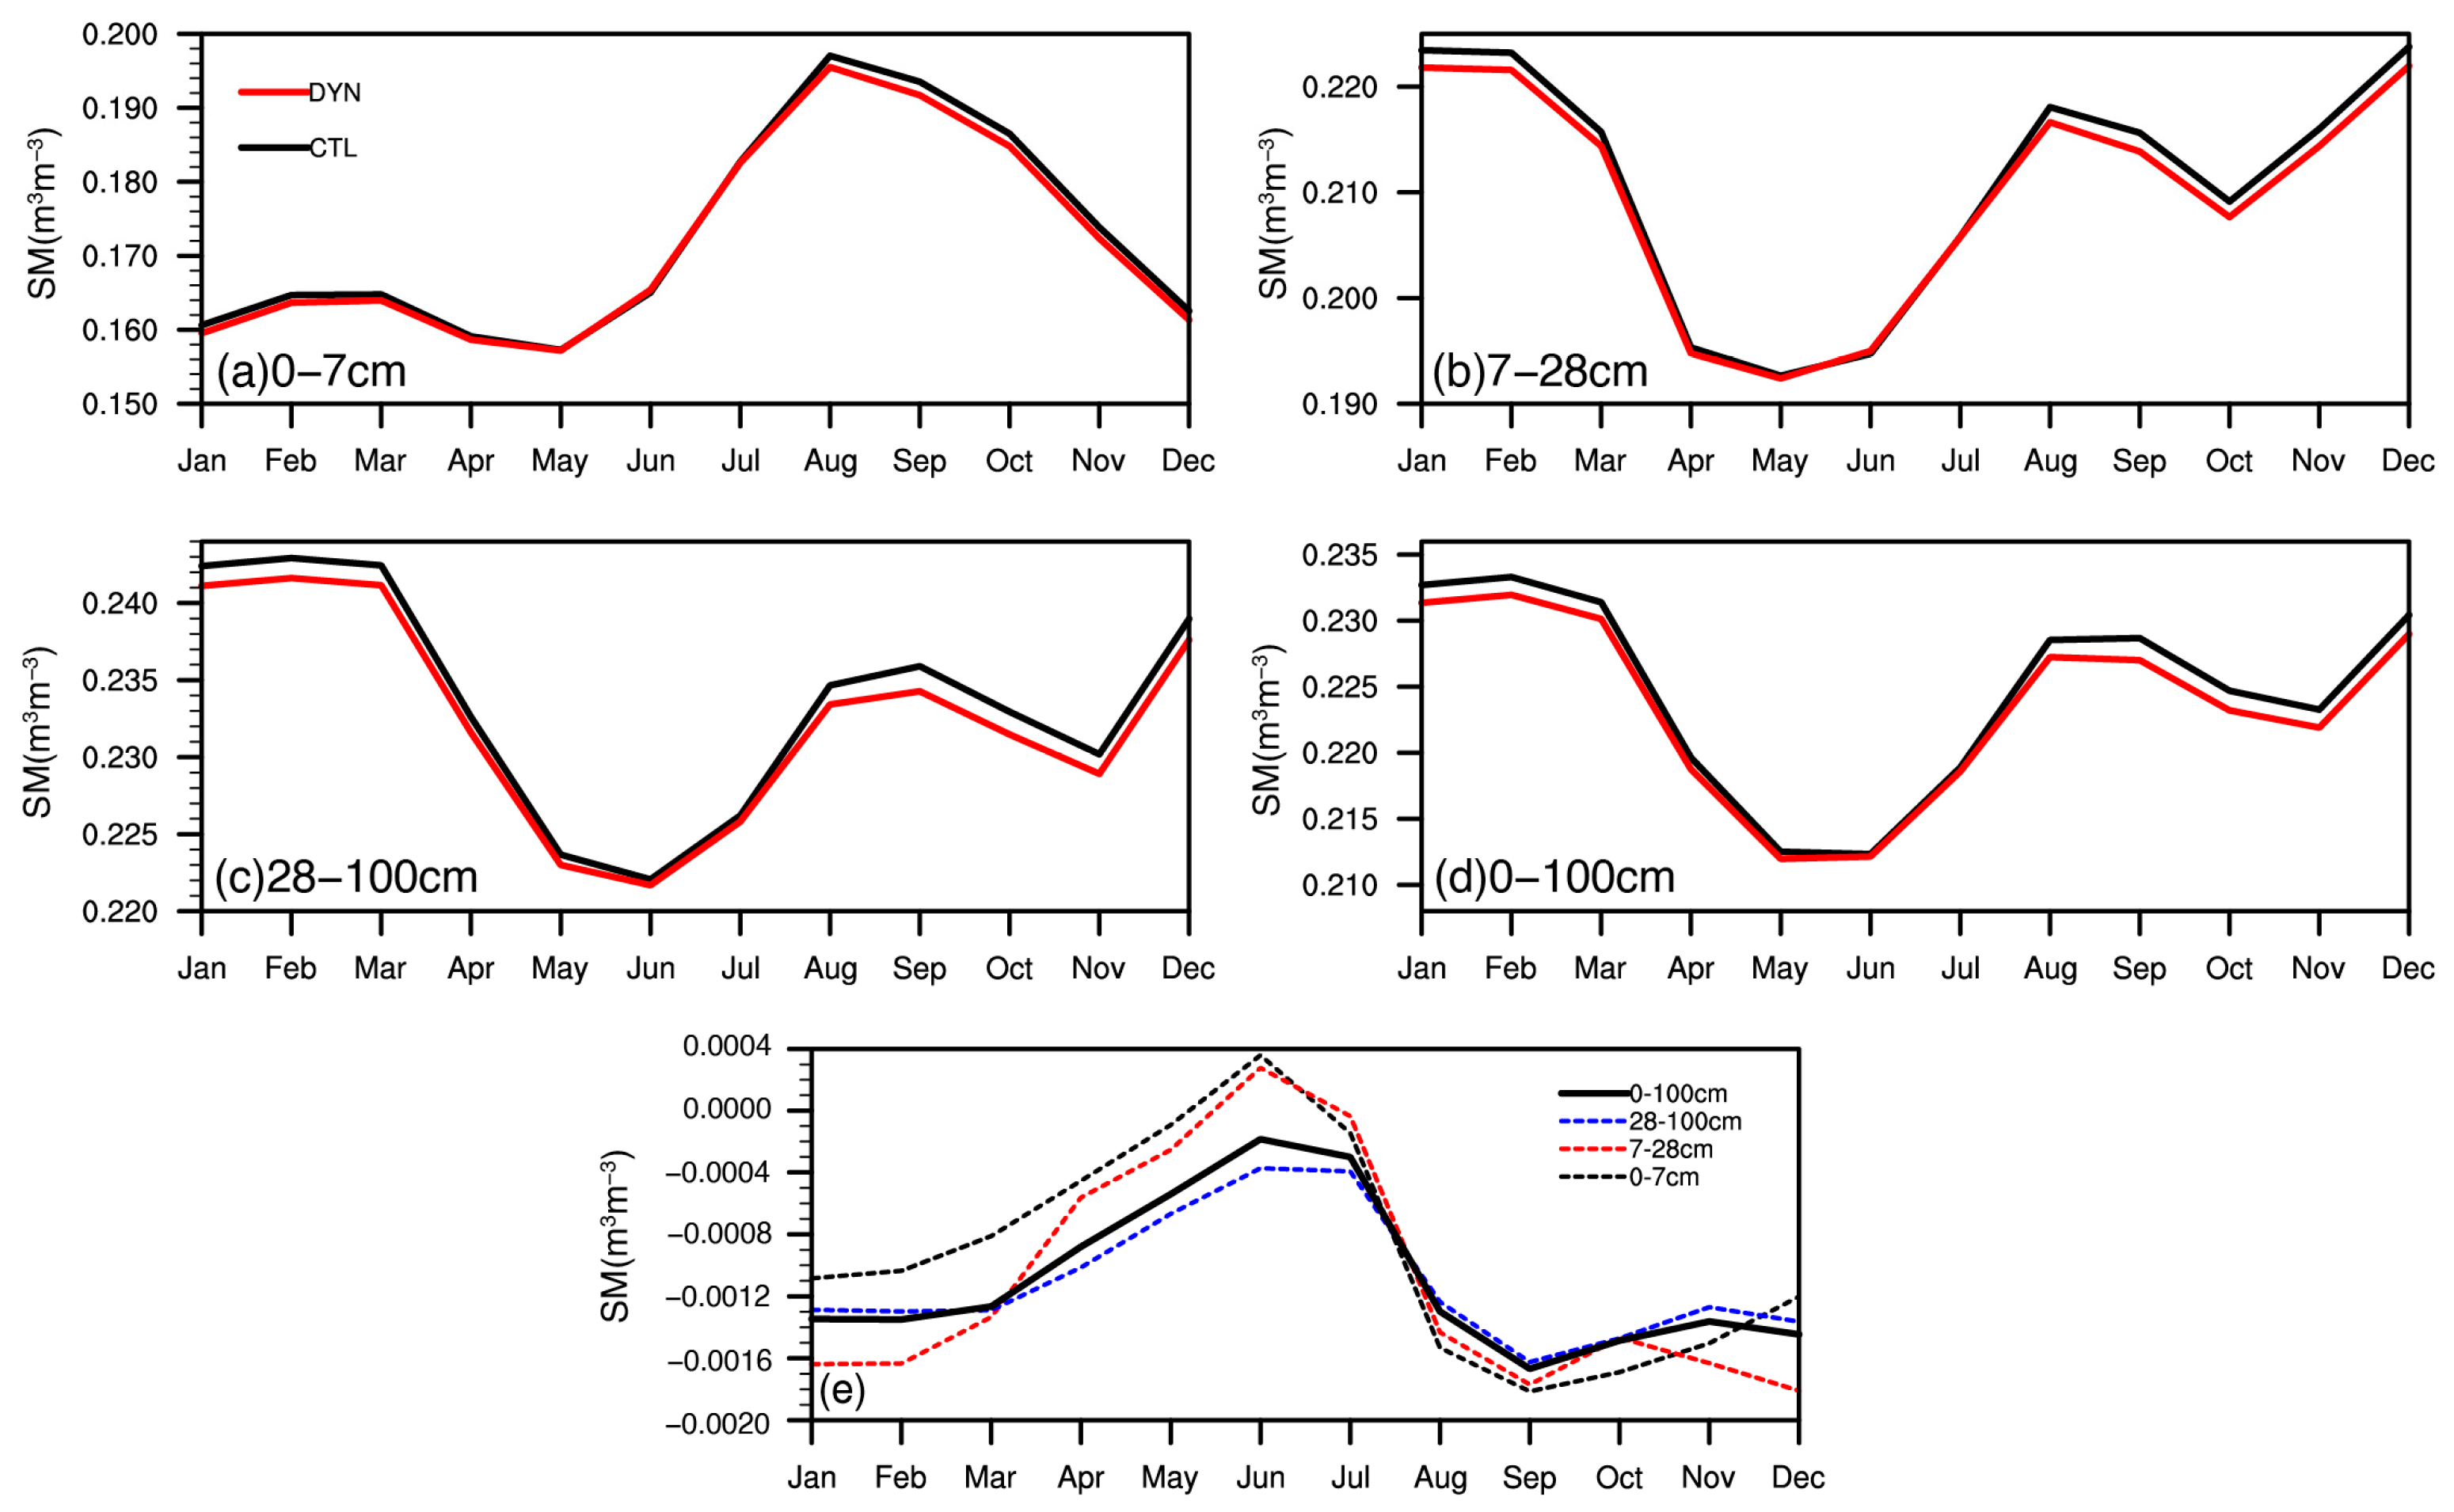
3.3. Interannual and Seasonal Variations in Soil Moisture

The spatial patterns of the simulated annual average soil moisture at the 0–7 cm, 7–28 cm, and 28–100cm layers from the DYN experiment are shown in Figure 7b,e,h. The soil moisture at three layers in the region displayed distinct spatial heterogeneity, with the northwestern areas showing lower moisture levels while the southeastern areas had higher moisture content. This pattern closely corresponds with the distribution of precipitation (Figure 3a) and the LAI (Figure 2a,c). Importantly, the simulated soil moisture was higher in the deeper layers (7–28 cm, 28–100cm) compared to the surface layer (0–7 cm), likely due to factors such as greater water retention capacity of deeper soils, vertical movement of water from the surface, and reduced evaporation at greater depths. In contrast, surface soil moisture (0–7 cm) is significantly influenced by higher evaporation rates and plant transpiration, and compounded by limited precipitation in arid regions.
Regarding the trends in soil moisture (Figure 8b,d,f,h), surface soil moisture (0–7 cm) in the eastern region displayed a decreasing trend, while in other regions, particularly in the central area, surface soil moisture exhibited a significantly increasing trend (Figure 8b). Similarly, deeper soil moisture (7–28 cm and 28–100 cm) also exhibited an increasing trend (Figure 8d,f), although the extent of this trend diminished with greater soil depth. With increasing soil depth, the proportion of significant soil dryness increased. On a regional scale, the overall average soil moisture exhibited a general increase in the western region, where precipitation significantly increased, while the eastern region tended to experience a decrease in soil moisture (Figure 8h).
For the regional averages (Figure 9), surface soil moisture (0–7 cm) exhibited a statistically significant increasing trend (2.97 × 10⁻⁴ m3 m−3 yr−1, p < 0.05) with considerable interannual variability, primarily driven by variations in precipitation, evaporation, and plant transpiration. However, the interannual variations in soil moisture diminished with increasing soil depth. Specifically, shallow soil moisture (7–28 cm) exhibited a smaller fluctuation, with a non-significant increasing trend. Similarly, the changes in deep soil moisture (28–100 cm) were also relatively minor, exhibiting a non-significant decreasing trend. These variations in deeper soil moisture were primarily driven by factors such as the groundwater table, vertical water movement, and water uptake by plant roots.
Figure 10 depicts the seasonal variation in soil moisture at varying depths in the Yinshanbeilu region, with distinct patterns shown across the various layers. At the surface layer (0–7 cm), soil moisture remained relatively stable during the winter months (December–February) but experienced a slight decrease in the spring (Figure 10a). This reduction was likely attributable to increased evaporation resulting from rising temperatures and intensified transpiration as plant growth began to accelerate. However, despite the increase in spring precipitation, it was inadequate to fully replenish the soil moisture in the arid regions. In the summer (June–August), soil moisture gradually increased with higher precipitation, while a decline was observed in the autumn (September–November) as precipitation decreased. Additionally, shallow soil moisture (7–28 cm) exhibited stability during the winter months but showed a notable decline in spring, from 0.21 m3 m−3 in March to 0.19 m3 m−3 in May (Figure 10b). This decline was followed by an increase in soil moisture with the onset of summer precipitation. It is noteworthy that shallow soil moisture (7–28 cm) was higher during the winter than in the autumn, which can be attributed to the lack of precipitation and higher evapotranspiration during the autumn, while the lower evapotranspiration rates in the winter helped to maintain or increase soil moisture. Seasonal fluctuations in deep and shallow soil moisture were similar, but the magnitude of change was smaller, with a delayed response (Figure 10c). In general, surface soil moisture (0–7 cm) was more sensitive to temperature, precipitation, and evapotranspiration variations, leading to more pronounced seasonal fluctuations. In contrast, deeper soil moisture (7–28 cm and 28–100 cm) exhibited slower variations, largely influenced by the delayed vertical movement of water from the surface, and was relatively less directly affected by atmospheric conditions. For the upper 100 cm of soil (Figure 10d), soil moisture was higher and more stable in the winter, decreased in the spring, increased with higher precipitation in the summer, and decreased in the autumn as precipitation declined.

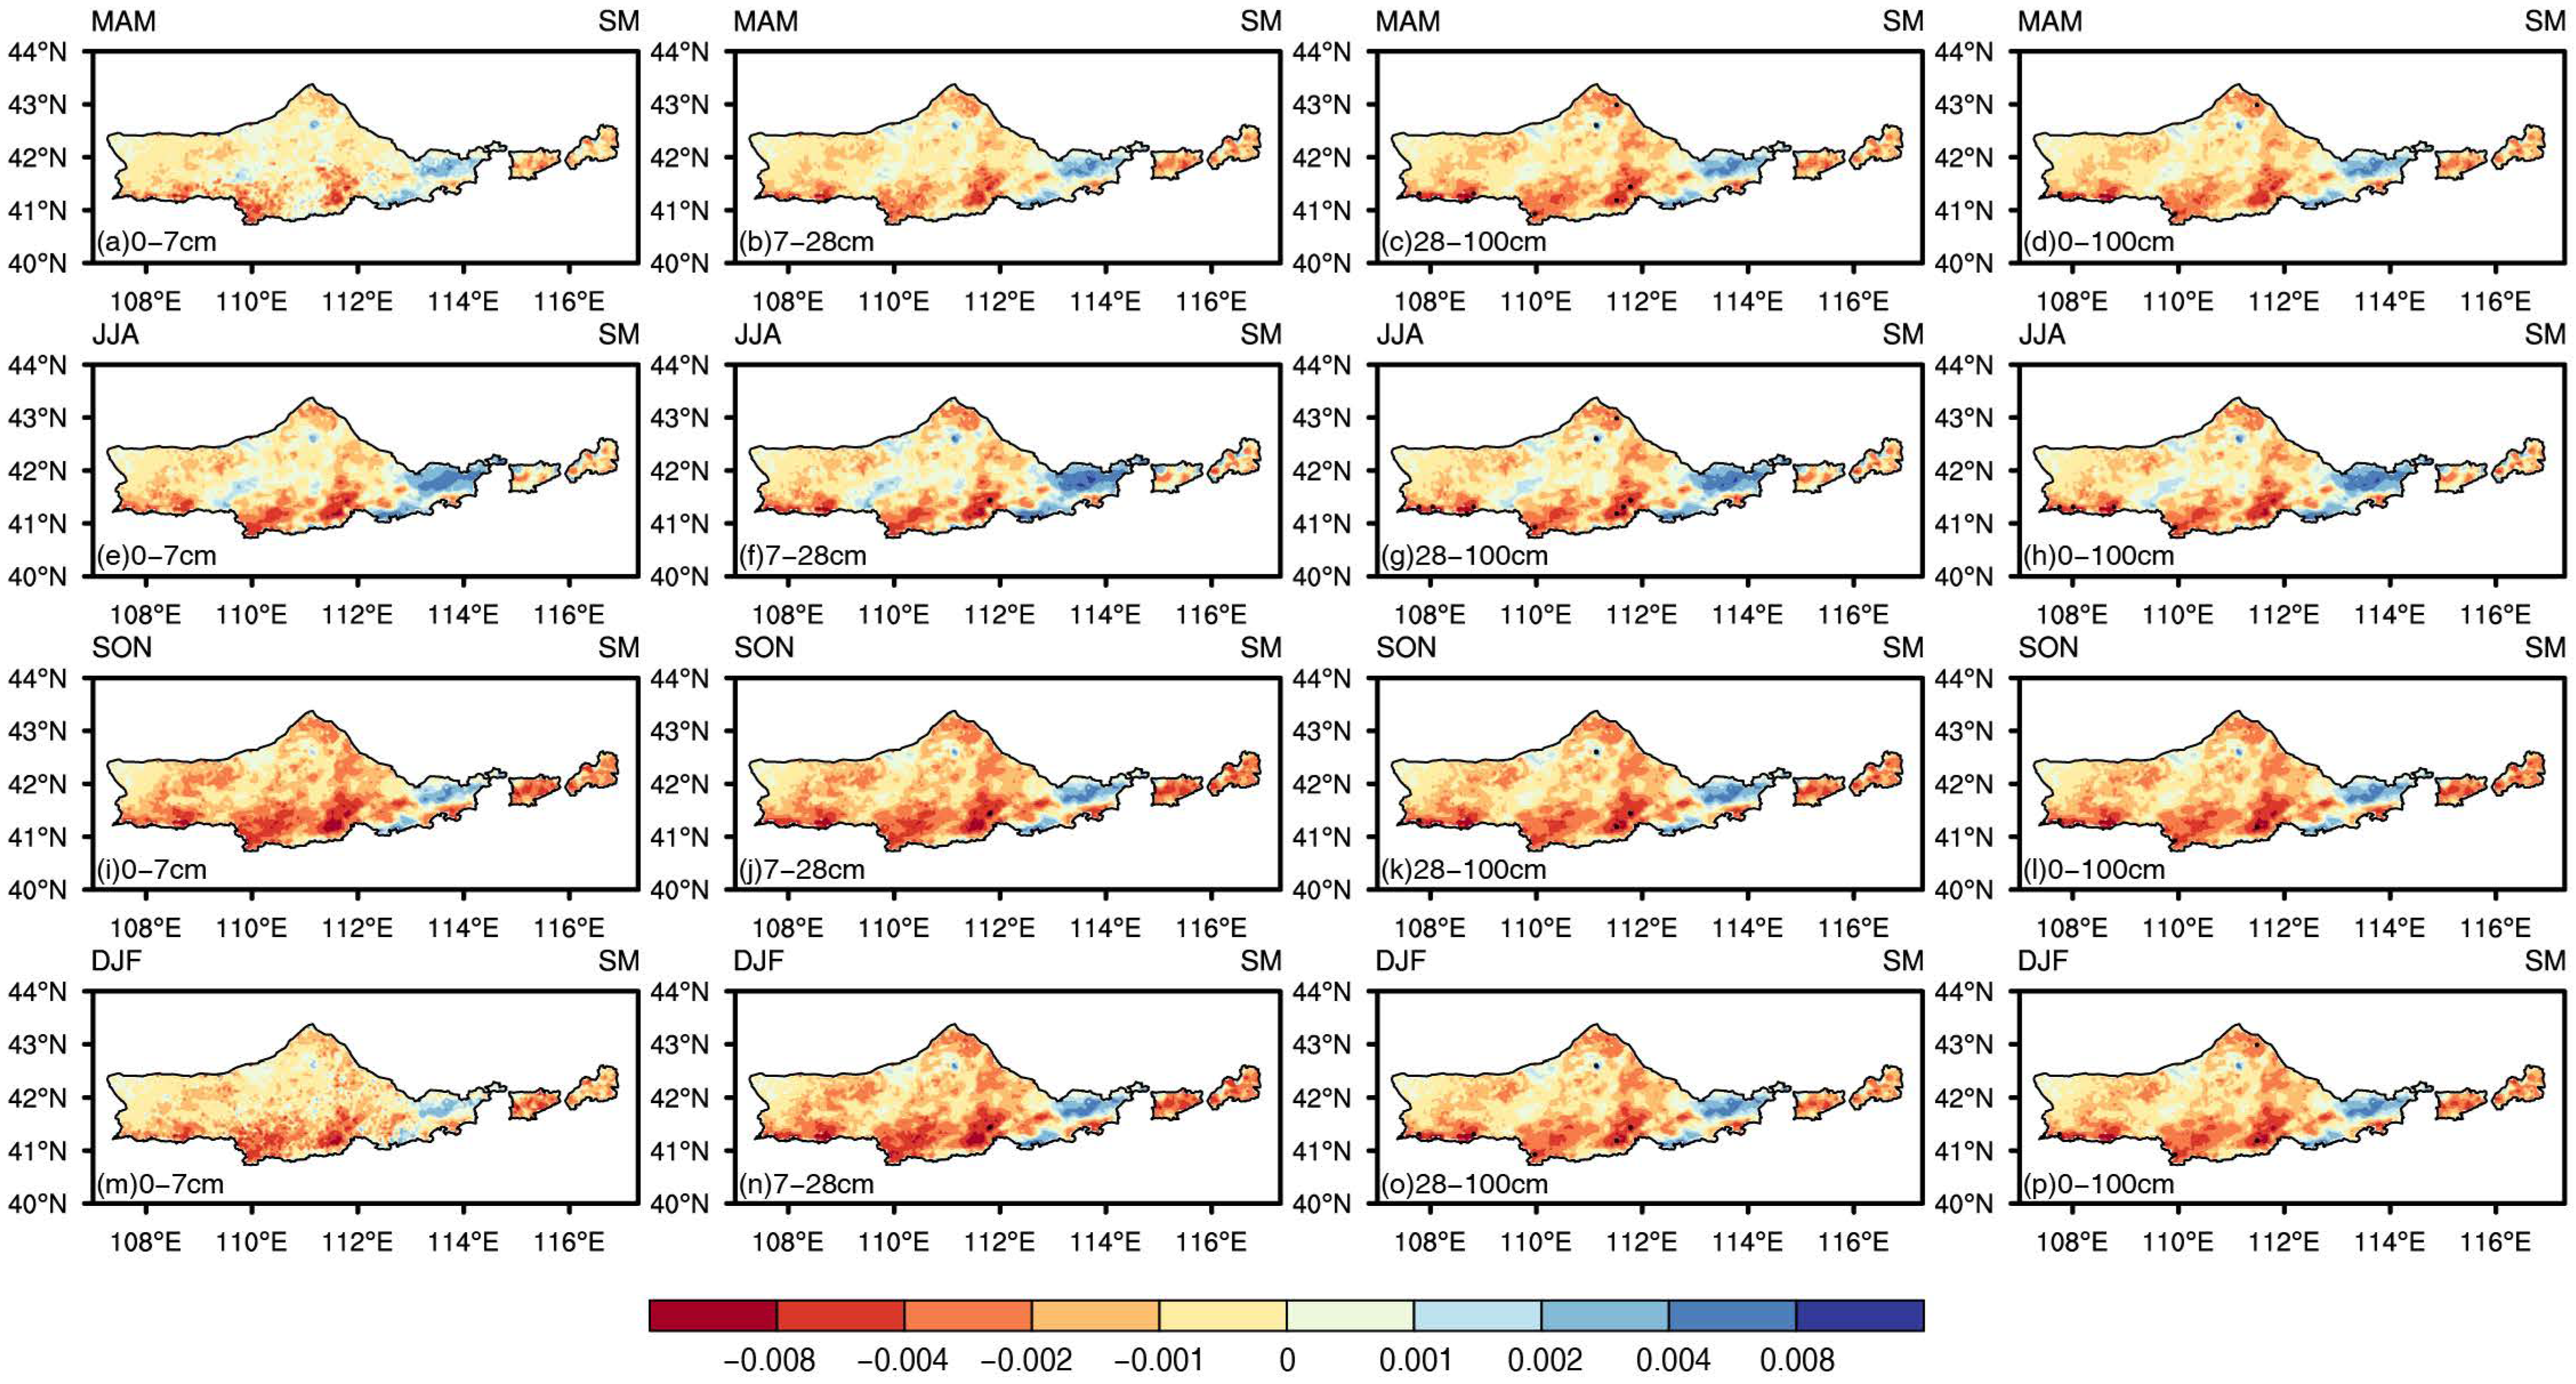
3.4. Response of Soil Moisture to Vegetation Changes

Figure 7 illustrates the spatial variations in soil moisture for both the CTL and DYN scenarios, aiming to examine how soil moisture responded to vegetation changes in the Yinshanbeilu region. While the general patterns of soil moisture in both scenarios were comparable, significant differences highlighted a decrease in soil moisture in regions with vegetation greening and a slight increase in regions with degraded vegetation. Vegetation greening resulted in a slight decrease in surface soil moisture (0–7 cm), especially in the southwestern part of the region, with an average decrease of 0.93 × 10⁻³ m3 m−3. As depicted in Figure 8a and Figure 9a, surface soil moisture (0–7 cm) from CTL showed an overall wetting trend, with an average of 3.78 × 10⁻⁴ m3 m−3 yr−1 (p < 0.01). However, after accounting for vegetation changes, there was a shift from a wetting trend to a drying trend in certain areas of the southeast (Figure 8b). The spatial changes in deeper soil moisture (7–28 cm and 28–100cm) were consistent with the changes in surface soil moisture (0–7 cm), although the reduction extent increased with depth. The areas of significant moisture decline expanded in deeper layers, and the magnitude of reduction was greater with increasing depths (Figure 7f,i). On a regional average, shallow soil moisture (7–28 cm) decreased by 1.12 × 10⁻³ m3 m−3, while deep soil moisture (28–100 cm) experienced a similar reduction of 1.11 × 10⁻³ m3 m−3. Correspondingly, the extent of wetting trends in deeper soils decreased, and the extent of drying trends expanded, especially in the eastern part. Figure 9 further illustrates the interannual time series of soil moisture in the upper 100 cm between CTL and DYN. Although the interannual variations in surface soil moisture (0–7 cm) were generally similar between the two simulations, deeper soil moisture (7–28 cm and 28–100 cm) showed more pronounced differences. From 1982 to 2018, the divergence in soil moisture between the DYN and CTL simulations increased, particularly after 2000, highlighting the important role of vegetation changes in soil moisture dynamics.
Figure 10 and Figure 11 present a further investigation into the seasonal response of soil moisture to vegetation changes. For surface soil moisture (0–7 cm), vegetation greening led to soil drying; although the change was not statistically significant, it was more pronounced in the summer (Figure 11e) and autumn (Figure 11i). Vegetation changes had a relatively limited influence on surface soil moisture (0–7 cm) during the spring season (Figure 11a). This may be due to the low precipitation in arid regions during the spring, combined with the relatively low water demand of vegetation at this time. As a result, the uptake and transpiration of moisture by vegetation may not have resulted in significant changes in soil moisture during this period. As vegetation grew rapidly during the growing season, the increase in the vegetation LAI resulted in significant uptake of soil water by plant roots, which was subsequently released into the atmosphere through canopy transpiration, leading to increased soil drying. For deeper soils (7–28 cm and 28–100 cm), the seasonal response of soil moisture to changes in vegetation (greening or browning) was similar but more pronounced. Overall, seasonal soil moisture in the upper 100 cm in DYN was smaller than that in CTL, with regional differences of −0.88 × 10⁻³ m3 m−3, −0.59 × 10⁻³ m3 m−3, −1.49 × 10⁻³ m3 m−3, and −1.31 × 10⁻³ m3 m−3 in the four seasons, respectively. These differences were most noticeable in the southern part of the Yinshanbeilu region (Figure 11d,h,l,p), reflecting the more significant impacts of vegetation changes in these areas.

4. Discussion

4.1. Long-Term Vegetation Changes

The changes in vegetation across the Yinshanbeilu region were analyzed using a satellite-based LAI from 1982 to 2018. The spatial pattern of the LAI in the region, influenced by local climate patterns, showed a decrease from southeast to northwest. As depicted in Figure 2e,f, the mean annual LAI demonstrated a significant increasing trend of 0.0009 m2 m−2 yr−1 over the study period, although a notable decline was observed around 2000. This decline could be related to the decrease in precipitation during that time (Figure 3e). Vegetation greening in the region increased significantly after 2000, with a linear trend of 0.0020 m² m⁻² yr⁻¹ from 2000 to 2018, resulting from the combined impacts of climate change and vegetation restoration efforts. Spatially, 96.84% of the area experienced an upward trend in the annual mean LAI, with 60.43% of the area exhibiting a statistically significant increase. The most substantial improvements in vegetation cover were found in the southern part of the region, mainly dominated by crops and grasslands, consistent with previous research findings [52,65]. In contrast, parts of the eastern and central areas displayed a slight decline in LAI despite a greening trend in the growing season LAI. Such trends suggest that, despite the general greening trend, localized areas are still facing challenges that hinder vegetation recovery or cause degradation.
Numerous studies have also investigated the drivers behind vegetation cover changes, highlighting climate change, land use change, and CO2 fertilization as the main influencing factors [13,66]. The Yinshanbeilu region, situated in the drylands of northern China, is distinguished by a relatively extreme climate, limited precipitation, and large seasonal temperature fluctuations. Therefore, the vegetation LAI in this region is highly responsive to temperature and precipitation changes. Previous research has emphasized that moisture availability is the primary determinant of vegetation growth and productivity. In the Yinshanbeilu region, the recent trend toward warmer and more humid conditions (Figure 3) has significantly improved the environment for vegetation, fostering more favorable conditions for growth and enhancing overall ecosystem productivity. Additionally, the implementation of large-scale environmental initiatives, such as the NSFP and GGP since 2000, has significantly contributed to rehabilitation in the study area [65,67].

4.2. Interannual and Seasonal Response of Soil Moisture to Vegetation Changes in Drylands

Our results revealed that the long-term impact of vegetation change on soil moisture exhibited significant spatial and temporal variability. In general, soil moisture declined in regions experiencing vegetation greening, particularly in the southwestern part of the Yinshanbeilu region, while small areas experiencing vegetation browning showed a slight increase in soil moisture (Figure 7). Although surface soil moisture slightly decreased in some areas, deeper soil moisture showed greater reductions, particularly in the 28–100 cm layer. This can largely be attributed to the increase in evapotranspiration and root water uptake associated with vegetation greening [17,68,69,70]. These results are consistent with earlier research, which has emphasized the critical role of vegetation in shaping soil moisture dynamics through evapotranspiration, root water uptake, and ground cover [20,42,46,71]. However, other research has also indicated that surface soil moisture responded positively to vegetation greening in humid and semi-arid regions [20,34,72], with this positive effect often linked to its promotion of precipitation [18,73]. The difference in soil moisture trends between the CTL and DYN simulations further indicated the critical role of vegetation dynamics in soil moisture interannual variability. In regions where vegetation greening occurred, the soil moisture trend shifted from wetting to drying or, in more cases, from a drying trend to an intensified drying trend (Figure 8). These shifts corroborate the findings of Deng et al. [20], which demonstrated that half of the global vegetation greening areas shifted toward drier conditions, particularly in dryland regions, reinforcing the trend from drying to more intense drying.
The effect of vegetation changes on soil moisture demonstrated distinct seasonal variations, with the impact being more pronounced in the summer and autumn (Figure 10 and Figure 11). In the spring, vegetation started to grow as temperatures and precipitation increased. During this period, water demand was relatively low, and the combined effects of vegetation transpiration and root water uptake led to limited changes in soil moisture. However, from June to September, with the rise in temperature and rapid vegetation growth, water demand and evapotranspiration increased significantly, causing a substantial decline in soil moisture. Conversely, from October to February, as temperatures decreased and vegetation entered dormancy, the changes in soil moisture stabilized. Other studies have also emphasized the importance of plant phenology in the seasonal response of soil moisture, noting that soil moisture decreases rapidly during the growing season [72,74]. In the non-growing season, the effect of vegetation on soil moisture diminished, mainly because of the reduced root water uptake [44], and in many cases, vegetation-driven effects on soil moisture could be compensated during this period [75]. However, in water-scarce regions, particularly those where vegetation significantly depletes soil moisture, vegetation greening may lead to permanent soil desiccation.
The findings of this research have important implications for regional water management and ecological restoration. While vegetation greening supports ecological recovery, it can also reduce soil moisture, particularly in deeper layers, due to increased evapotranspiration and root water uptake. Policymakers and land managers should consider local hydrological conditions when designing vegetation restoration projects, balancing short-term greening benefits with long-term water availability. Adopting integrated and region-specific approaches that combine ecological restoration with sustainable water management is essential. In drylands, vegetation greening can lead to soil moisture depletion over time, especially in water-limited areas. Approaches such as selecting drought-resistant species, optimizing planting density, and improving soil conservation can help mitigate moisture depletion risks. For sustainable afforestation in drylands, it is crucial to select species adapted to local climate and soil conditions, particularly those with deep root systems or lower water demands. Afforestation projects should also include water conservation practices, such as drip irrigation and mulching, to improve water use efficiency and reduce evaporation. Additionally, adaptive management and long-term monitoring are essential to identify and address potential negative impacts on soil moisture, ensuring the sustainability of restoration efforts.

4.3. Limitations and Future Work

Our work underscores the responses of soil moisture to vegetation changes using the widely used land surface model CLM4.5, providing valuable insights into the interannual and seasonal variability of soil moisture in relation to vegetation dynamics. However, several limitations and uncertainties need to be addressed.
First, the model performance in simulating soil moisture varied across different soil layers, with relatively lower accuracy in deeper layers. This discrepancy can be attributed to several factors. The model’s representation of soil hydraulic properties, such as hydraulic conductivity and porosity, may oversimplify the complex heterogeneity of soils, particularly in deeper layers. Moreover, uncertainties in the lower boundary conditions (e.g., groundwater table) could further amplify errors in simulating deep soil moisture dynamics. In addition, the lack of high-quality, long-term observational data for deeper soil layers presents a significant challenge for model calibration and validation. Uncertainties in input data, such as meteorological forcing and soil properties, may contribute to overestimations or inaccuracies in simulating deep soil moisture. The reduced accuracy in deep layers may lead to inaccuracies in long-term soil moisture trends and in water and energy fluxes, such as evapotranspiration and groundwater recharge.
Second, the simulations in this study assumed that land cover, including soil, topography, and vegetation types, remained constant throughout the study period, except for changes in the LAI. Moreover, land cover types in CLM4.5 are represented by fractional PFTs, with a uniform parameterization for each specific PFT. However, differences between plant species may lead to varied responses to soil moisture, even within the same vegetation type [41].
Third, datasets used in this study, such as CMFD-forcing and the GLOBMAP LAI, may contain uncertainties due to factors such as spatial and temporal resolution limitations, biases in observational data assimilation, and interpolation methods. A limitation of our study is the reliance on a single LAI product (GLOBMAP), which may not fully capture the regional variations in vegetation dynamics. Future studies could benefit from integrating multiple LAI datasets (e.g., MODIS and GLASS) to reduce uncertainties and improve the accuracy of vegetation cover.
Furthermore, the two experiments implemented in this study were offline simulations without considerations of land–atmosphere interactions. Since vegetation changes play a crucial role in regulating the flux of water and energy between atmosphere and land, potentially altering precipitation patterns. For instance, increased vegetation cover can enhance evapotranspiration, releasing more water vapor into the atmosphere and potentially influencing local and regional precipitation patterns [37,38,76]. Moreover, vegetation alters surface properties such as albedo aerodynamic roughness, which can alter the energy balance at the land–atmosphere interface, influencing atmospheric circulation patterns and cloud dynamics, thus further regulating precipitation patterns [77,78]. In addition, changes in vegetation can influence the regional atmospheric pressure systems, leading to shifts in wind patterns that could further affect precipitation distribution. These shifts may have profound implications not only for local hydrological cycles but also for regional and even global climate systems [36,37]. As a result, shifts in vegetation cover, especially in water-limited regions, may play a significant role in shaping long-term regional climate patterns and hydrological cycles, with potential effects on water availability, agriculture, and ecosystems. Given these dynamics, understanding the full scope of vegetation–climate feedback is crucial for predicting future hydrological changes in response to vegetation restoration or land-use changes, particularly in the context of climate change.
Therefore, future research should focus on unraveling the complex vegetation–climate feedback to gain a deeper understanding of their potential impacts on water availability and precipitation patterns, which are essential for designing sustainable restoration strategies and mitigating potential water scarcity risks in the context of climate change. While this study mainly addressed the impact of vegetation changes on soil moisture, it is important to recognize that soil moisture also directly influences vegetation growth and productivity [21,40]. Consequently, future studies should give more attention to the interactions between soil, vegetation, and climate, which are critical for understanding ecosystem responses to climate change [79,80,81]. Furthermore, to reduce uncertainties and improve the effectiveness of restoration efforts, future research should focus on incorporating more localized, high-quality data, enabling more accurate predictions and more insightful management strategies.

5. Conclusions

In this work, we explored the long-term spatiotemporal dynamics of soil moisture in response to vegetation changes in the Yinshanbeilu region using the land surface model CLM4.5. Our findings revealed a significant greening trend across the region, leading to a decline in soil moisture, especially in deeper layers. This suggests that increased vegetation cover enhances evapotranspiration and root water uptake, reducing water availability throughout the soil profile. Additionally, soil moisture trends shifted from wetting to drying or, in many instances, from drying to more intensified drying. The impact of vegetation on soil moisture varied seasonally, with the strongest effects observed in the summer and autumn.
By integrating satellite remote sensing vegetation data with the CLM4.5 model, this study provides a comprehensive analysis of the long-term impacts of vegetation changes on soil moisture dynamics in the Yinshanbeilu region, a critical dryland area in northern China. Our research contributes to the understanding of soil moisture-vegetation interactions by demonstrating that vegetation greening—driven by the LAI—enhances evapotranspiration and root water uptake, ultimately reducing soil moisture across different soil depths and seasons in dryland ecosystems. These findings also provide a basis for more reliable predictions of how soil moisture may respond to future vegetation changes under different environmental conditions. Moreover, this study contributes to the broader understanding of dryland ecosystem dynamics, offering valuable insights for the development of sustainable land management strategies and the optimization of water resource management in these regions.

Author Contributions

Conceptualization, Y.W. (Yan Wang) and G.W.; methodology, Y.W. (Yan Wang) and G.W.; formal analysis, Y.W. (Yan Wang); investigation, Y.W. (Yan Wang), Y.W. (Yingjie Wu) and S.Z.; data curation, Y.W. (Yingjie Wu) and S.Z.; writing—original draft preparation, Y.W. (Yan Wang) and G.W.; writing—review and editing, Y.W. (Yan Wang) and G.W. All authors have read and agreed to the published version of the manuscript.

Funding

This research was funded by the Open Research Fund of Yinshanbeilu Grassland Eco-hydrology National Observation and Research Station, China Institute of Water Resources and Hydropower Research, grant number YSS202312; the National Key Research and Development Program of China, grant numbers 2022YFC3202302, 2021YFC3201104; the Postdoctoral Science Foundation of China, grant number 2023M731748; and Jiangsu Funding Program for Excellent Postdoctoral Talent, grant number 2022ZB445.

Institutional Review Board Statement

Not applicable.

Informed Consent Statement

Not applicable.

Data Availability Statement

All data resources are provided in the manuscript with links.

Acknowledgments

The work was performed on TianHe Next Generation at the National Supercomputer Center in Tianjin.

Conflicts of Interest

The authors declare no conflicts of interest.

References

  1. Rodriguez-Iturbe, I. Ecohydrology: A Hydrologic Perspective of Climate-Soil-Vegetation Dynamics. Water Resour. Res. 2000, 36, 3–9. [Google Scholar] [CrossRef]
  2. Legates, D.R.; Mahmood, R.; Levia, D.F.; DeLiberty, T.L.; Quiring, S.M.; Houser, C.; Nelson, F.E. Soil Moisture: A Central and Unifying Theme in Physical Geography. Prog. Phys. Geogr. Earth Environ. 2011, 35, 65–86. [Google Scholar] [CrossRef]
  3. Koster, R.D.; Suarez, M.J. Soil Moisture Memory in Climate Models. J. Hydrometeorol. 2001, 2, 558–570. [Google Scholar] [CrossRef]
  4. Seneviratne, S.I.; Corti, T.; Davin, E.L.; Hirschi, M.; Jaeger, E.B.; Lehner, I.; Orlowsky, B.; Teuling, A.J. Investigating Soil Moisture–Climate Interactions in a Changing Climate: A Review. Earth-Sci. Rev. 2010, 99, 125–161. [Google Scholar] [CrossRef]
  5. Orth, R.; Seneviratne, S.I. Variability of Soil Moisture and Sea Surface Temperatures Similarly Important for Warm-Season Land Climate in the Community Earth System Model. J. Clim. 2017, 30, 2141–2162. [Google Scholar] [CrossRef]
  6. Carol Adair, E.; Reich, P.B.; Trost, J.J.; Hobbie, S.E. Elevated CO2 Stimulates Grassland Soil Respiration by Increasing Carbon Inputs Rather than by Enhancing Soil Moisture. Glob. Change Biol. 2011, 17, 3546–3563. [Google Scholar] [CrossRef]
  7. Stocker, B.D.; Zscheischler, J.; Keenan, T.F.; Prentice, I.C.; Seneviratne, S.I.; Peñuelas, J. Drought Impacts on Terrestrial Primary Production Underestimated by Satellite Monitoring. Nat. Geosci. 2019, 12, 264–270. [Google Scholar] [CrossRef]
  8. Green, J.K.; Seneviratne, S.I.; Berg, A.M.; Findell, K.L.; Hagemann, S.; Lawrence, D.M.; Gentine, P. Large Influence of Soil Moisture on Long-Term Terrestrial Carbon Uptake. Nature 2019, 565, 476–479. [Google Scholar] [CrossRef]
  9. Reynolds, J.F.; Smith, D.M.S.; Lambin, E.F.; Turner, B.L.; Mortimore, M.; Batterbury, S.P.J.; Downing, T.E.; Dowlatabadi, H.; Fernández, R.J.; Herrick, J.E.; et al. Global Desertification: Building a Science for Dryland Development. Science 2007, 316, 847–851. [Google Scholar] [CrossRef]
  10. Song, C.; Yuan, L.; Yang, X.; Fu, B. Ecological-Hydrological Processes in Arid Environment: Past, Present and Future. J. Geogr. Sci. 2017, 27, 1577–1594. [Google Scholar] [CrossRef]
  11. Zhang, L.; Xiao, J.; Zheng, Y.; Li, S.; Zhou, Y. Increased Carbon Uptake and Water Use Efficiency in Global Semi-Arid Ecosystems. Environ. Res. Lett. 2020, 15, 034022. [Google Scholar] [CrossRef]
  12. Burrell, A.L.; Evans, J.P.; De Kauwe, M.G. Anthropogenic Climate Change Has Driven over 5 Million Km2 of Drylands towards Desertification. Nat. Commun. 2020, 11, 3853. [Google Scholar] [CrossRef] [PubMed]
  13. Piao, S.; Wang, X.; Park, T.; Chen, C.; Lian, X.; He, Y.; Bjerke, J.W.; Chen, A.; Ciais, P.; Tømmervik, H.; et al. Characteristics, Drivers and Feedbacks of Global Greening. Nat. Rev. Earth Environ. 2020, 1, 14–27. [Google Scholar] [CrossRef]
  14. Li, C.; Fu, B.; Wang, S.; Stringer, L.C.; Wang, Y.; Li, Z.; Liu, Y.; Zhou, W. Drivers and Impacts of Changes in China’s Drylands. Nat. Rev. Earth Environ. 2021, 2, 858–873. [Google Scholar] [CrossRef]
  15. Feng, X.; Fu, B.; Piao, S.; Wang, S.; Ciais, P.; Zeng, Z.; Lü, Y.; Zeng, Y.; Li, Y.; Jiang, X.; et al. Revegetation in China’s Loess Plateau Is Approaching Sustainable Water Resource Limits. Nat. Clim. Change 2016, 6, 1019–1022. [Google Scholar] [CrossRef]
  16. Feng, X.; Li, J.; Cheng, W.; Fu, B.; Wang, Y.; Lü, Y.; Shao, M. Evaluation of AMSR-E Retrieval by Detecting Soil Moisture Decrease Following Massive Dryland Re-Vegetation in the Loess Plateau, China. Remote Sens. Environ. 2017, 196, 253–264. [Google Scholar] [CrossRef]
  17. Chen, H.; Shao, M.; Li, Y. Soil Desiccation in the Loess Plateau of China. Geoderma 2008, 143, 91–100. [Google Scholar] [CrossRef]
  18. Ye, L.; Fang, L.; Shi, Z.; Deng, L.; Tan, W. Spatio-Temporal Dynamics of Soil Moisture Driven by ‘Grain for Green’ Program on the Loess Plateau, China. Agric. Ecosyst. Environ. 2019, 269, 204–214. [Google Scholar] [CrossRef]
  19. Amantai, N.; Meng, Y.; Wang, J.; Ge, X.; Tang, Z. Climate Overtakes Vegetation Greening in Regulating Spatiotemporal Patterns of Soil Moisture in Arid Central Asia in Recent 35 Years. GIScience Remote Sens. 2024, 61, 2286744. [Google Scholar] [CrossRef]
  20. Deng, Y.; Wang, S.; Bai, X.; Luo, G.; Wu, L.; Chen, F.; Wang, J.; Li, C.; Yang, Y.; Hu, Z.; et al. Vegetation Greening Intensified Soil Drying in Some Semi-Arid and Arid Areas of the World. Agric. For. Meteorol. 2020, 292–293, 108103. [Google Scholar] [CrossRef]
  21. Hao, Y.; Yuan, X.; Zhang, M. Enhanced Relationship Between Seasonal Soil Moisture Droughts and Vegetation Under Climate Change over China. Agric. For. Meteorol. 2024, 358, 110258. [Google Scholar] [CrossRef]
  22. Cao, S.; Zhang, J.; Chen, L.; Zhao, T. Ecosystem Water Imbalances Created During Ecological Restoration by Afforestation in China, and Lessons for Other Developing Countries. J. Environ. Manag. 2016, 183, 843–849. [Google Scholar] [CrossRef] [PubMed]
  23. Zeng, Z.; Peng, L.; Piao, S. Response of Terrestrial Evapotranspiration to Earth’s Greening. Curr. Opin. Environ. Sustain. 2018, 33, 9–25. [Google Scholar] [CrossRef]
  24. Deng, L.; Yan, W.; Zhang, Y.; Shangguan, Z. Severe Depletion of Soil Moisture Following Land-Use Changes for Ecological Restoration: Evidence from Northern China. For. Ecol. Manag. 2016, 366, 1–10. [Google Scholar] [CrossRef]
  25. Jia, X.; Shao, M.; Zhang, C.; Zhao, C. Regional Temporal Persistence of Dried Soil Layer along South–North Transect of the Loess Plateau, China. J. Hydrol. 2015, 528, 152–160. [Google Scholar] [CrossRef]
  26. Yang, L.; Wei, W.; Chen, L.; Chen, W.; Wang, J. Response of Temporal Variation of Soil Moisture to Vegetation Restoration in Semi-Arid Loess Plateau, China. CATENA 2014, 115, 123–133. [Google Scholar] [CrossRef]
  27. Cao, J.; Tian, H.; Adamowski, J.F.; Zhang, X.; Cao, Z. Influences of Afforestation Policies on Soil Moisture Content in China’s Arid and Semi-Arid Regions. Land Use Policy 2018, 75, 449–458. [Google Scholar] [CrossRef]
  28. Liu, Y.; Miao, H.-T.; Huang, Z.; Cui, Z.; He, H.; Zheng, J.; Han, F.; Chang, X.; Wu, G.-L. Soil Water Depletion Patterns of Artificial Forest Species and Ages on the Loess Plateau (China). For. Ecol. Manag. 2018, 417, 137–143. [Google Scholar] [CrossRef]
  29. Zhang, X.; Zhang, G.; Hu, C.; Ping, J.; Jian, S. Response of Soil Moisture to Landscape Restoration in the Hilly and Gully Region of the Loess Plateau, China. Biologia 2020, 75, 827–839. [Google Scholar] [CrossRef]
  30. Gao, Z.; Zhang, L.; Cheng, L.; Zhang, X.; Cowan, T.; Cai, W.; Brutsaert, W. Groundwater Storage Trends in the Loess Plateau of China Estimated from Streamflow Records. J. Hydrol. 2015, 530, 281–290. [Google Scholar] [CrossRef]
  31. Wang, Y.; Han, T.; Yang, Y.; Hai, Y.; Wen, Z.; Li, R.; Zheng, H. Revealing the Hidden Consequences of Increased Soil Moisture Storage in Greening Drylands. Remote Sens. 2024, 16, 1819. [Google Scholar] [CrossRef]
  32. Tietjen, B.; Schlaepfer, D.R.; Bradford, J.B.; Lauenroth, W.K.; Hall, S.A.; Duniway, M.C.; Hochstrasser, T.; Jia, G.; Munson, S.M.; Pyke, D.A.; et al. Climate Change-Induced Vegetation Shifts Lead to More Ecological Droughts Despite Projected Rainfall Increases in Many Global Temperate Drylands. Glob. Change Biol. 2017, 23, 2743–2754. [Google Scholar] [CrossRef] [PubMed]
  33. Jiang, F.; Xie, X.; Wang, Y.; Liang, S.; Zhu, B.; Meng, S.; Zhang, X.; Chen, Y.; Liu, Y. Vegetation Greening Intensified Transpiration but Constrained Soil Evaporation on the Loess Plateau. J. Hydrol. 2022, 614, 128514. [Google Scholar] [CrossRef]
  34. Wang, X.; Wang, B.; Xu, X.; Liu, T.; Duan, Y.; Zhao, Y. Spatial and Temporal Variations in Surface Soil Moisture and Vegetation Cover in the Loess Plateau from 2000 to 2015. Ecol. Indic. 2018, 95, 320–330. [Google Scholar] [CrossRef]
  35. Feng, T.; Wei, W.; Chen, L.; Keesstra, S.D.; Yu, Y. Effects of Land Preparation and Plantings of Vegetation on Soil Moisture in a Hilly Loess Catchment in China. Land Degrad. Dev. 2018, 29, 1427–1441. [Google Scholar] [CrossRef]
  36. Zeng, Z.; Piao, S.; Li, L.Z.X.; Wang, T.; Ciais, P.; Lian, X.; Yang, Y.; Mao, J.; Shi, X.; Myneni, R.B. Impact of Earth Greening on the Terrestrial Water Cycle. J. Clim. 2018, 31, 2633–2650. [Google Scholar] [CrossRef]
  37. Li, Y.; Piao, S.; Li, L.Z.X.; Chen, A.; Wang, X.; Ciais, P.; Huang, L.; Lian, X.; Peng, S.; Zeng, Z.; et al. Divergent Hydrological Response to Large-Scale Afforestation and Vegetation Greening in China. Sci. Adv. 2018, 4, eaar4182. [Google Scholar] [CrossRef]
  38. Cui, J.; Lian, X.; Huntingford, C.; Gimeno, L.; Wang, T.; Ding, J.; He, M.; Xu, H.; Chen, A.; Gentine, P.; et al. Global Water Availability Boosted by Vegetation-Driven Changes in Atmospheric Moisture Transport. Nat. Geosci. 2022, 15, 982–988. [Google Scholar] [CrossRef]
  39. Chen, X.; Zhang, Z.; Chen, X.; Shi, P. The Impact of Land Use and Land Cover Changes on Soil Moisture and Hydraulic Conductivity along the Karst Hillslopes of Southwest China. Environ. Earth Sci. 2009, 59, 811–820. [Google Scholar] [CrossRef]
  40. Zhao, F.; Wang, X.; Wu, Y.; Sivakumar, B.; Liu, S. Enhanced Dependence of China’s Vegetation Activity on Soil Moisture Under Drier Climate Conditions. J. Geophys. Res. Biogeosci. 2023, 128, e2022JG007300. [Google Scholar] [CrossRef]
  41. Aranda, I.; Forner, A.; Cuesta, B.; Valladares, F. Species-Specific Water Use by Forest Tree Species: From the Tree to the Stand. Agric. Water Manag. 2012, 114, 67–77. [Google Scholar] [CrossRef]
  42. Wang, Q.; Liu, H.; Liang, B.; Shi, L.; Wu, L.; Cao, J. Will Large-Scale Forestation Lead to a Soil Water Deficit Crisis in China’s Drylands? Sci. Bull. 2024, 69, 1506–1514. [Google Scholar] [CrossRef] [PubMed]
  43. Liang, H.; Xue, Y.; Li, Z.; Wang, S.; Wu, X.; Gao, G.; Liu, G.; Fu, B. Soil Moisture Decline Following the Plantation of Robinia pseudoacacia Forests: Evidence from the Loess Plateau. For. Ecol. Manag. 2018, 412, 62–69. [Google Scholar] [CrossRef]
  44. Wang, T.; Wedin, D.A.; Franz, T.E.; Hiller, J. Effect of Vegetation on the Temporal Stability of Soil Moisture in Grass-Stabilized Semi-Arid Sand Dunes. J. Hydrol. 2015, 521, 447–459. [Google Scholar] [CrossRef]
  45. Jost, G.; Schume, H.; Hager, H.; Markart, G.; Kohl, B. A Hillslope Scale Comparison of Tree Species Influence on Soil Moisture Dynamics and Runoff Processes during Intense Rainfall. J. Hydrol. 2012, 420–421, 112–124. [Google Scholar] [CrossRef]
  46. Jiao, Q.; Li, R.; Wang, F.; Mu, X.; Li, P.; An, C. Impacts of Re-Vegetation on Surface Soil Moisture over the Chinese Loess Plateau Based on Remote Sensing Datasets. Remote Sens. 2016, 8, 156. [Google Scholar] [CrossRef]
  47. Anav, A.; Murray-Tortarolo, G.; Friedlingstein, P.; Sitch, S.; Piao, S.; Zhu, Z. Evaluation of Land Surface Models in Reproducing Satellite Derived Leaf Area Index over the High-Latitude Northern Hemisphere. Part II: Earth System Models. Remote Sens. 2013, 5, 3637–3661. [Google Scholar] [CrossRef]
  48. Fisher, R.A.; Koven, C.D.; Anderegg, W.R.L.; Christoffersen, B.O.; Dietze, M.C.; Farrior, C.E.; Holm, J.A.; Hurtt, G.C.; Knox, R.G.; Lawrence, P.J.; et al. Vegetation Demographics in Earth System Models: A Review of Progress and Priorities. Glob. Change Biol. 2018, 24, 35–54. [Google Scholar] [CrossRef]
  49. Jiao, Y.; Lei, H.; Yang, D.; Huang, M.; Liu, D.; Yuan, X. Impact of Vegetation Dynamics on Hydrological Processes in a Semi-Arid Basin by Using a Land Surface-Hydrology Coupled Model. J. Hydrol. 2017, 551, 116–131. [Google Scholar] [CrossRef]
  50. Liu, T. A Study on Eco-Hydrologic Process of Small Basin of Desert Steppe in Inner Mongolia—A Case Study of Shangdong River Basin. Ph.D. Thesis, Inner Mongolia University, Hohhot, China, 2018. (In Chinese). [Google Scholar]
  51. Fang, F.; Qin, F.; Li, L.; Yang, Z. Study on Soil Water Storage Performance of Different Forest Types at the North Piedmont of Yinshan Mountains. J. Agric. Sci. Technol. 2020, 22, 140–148. [Google Scholar] [CrossRef]
  52. Wang, S.; Liu, X.; Wu, Y. Considering Climatic Factors, Time Lag, and Cumulative Effects of Climate Change and Human Activities on Vegetation NDVI in Yinshanbeilu, China. Plants 2023, 12, 3312. [Google Scholar] [CrossRef] [PubMed]
  53. Ran, Y.; Ma, H. 1 km Plant Functional Types Map over China in 2000. Remote Sens. Technol. Appl. 2016, 31, 827–832. [Google Scholar] [CrossRef]
  54. Oleson, K.W.; Lawrence, D.M.; Bonan, G.B.; Drewniak, B.; Huang, M.; Levis, S.; Li, F.; Riley, W.J.; Swenson, S.C.; Thornton, P.E.; et al. Technical Description of Version 4.5 of the Community Land Model (CLM); Original Work Published 2013; National Center for Atmospheric Research: Boulder, CO, USA, 2013; Available online: https://opensky.ucar.edu/islandora/object/technotes:515 (accessed on 7 September 2023).
  55. Wang, A.; Zeng, X.; Guo, D. Estimates of Global Surface Hydrology and Heat Fluxes from the Community Land Model (CLM4.5) with Four Atmospheric Forcing Datasets. J. Hydrometeorol. 2016, 17, 2493–2510. [Google Scholar] [CrossRef]
  56. Yuan, Y.; Lai, X.; Gong, Y.; Chen, J. The Impacts of Late Spring Soil Moisture in the Tibetan Plateau on Summer Precipitation in Eastern China. Int. J. Climatol. 2021, 41, 862–877. [Google Scholar] [CrossRef]
  57. Liu, Y.; Liu, R.; Chen, J.M. Retrospective Retrieval of Long-Term Consistent Global Leaf Area Index (1981–2011) from Combined AVHRR and MODIS Data. J. Geophys. Res. Biogeosci. 2012, 117, 2012JG002084. [Google Scholar] [CrossRef]
  58. He, J.; Yang, K.; Tang, W.; Lu, H.; Qin, J.; Chen, Y.; Li, X. The First High-Resolution Meteorological Forcing Dataset for Land Process Studies over China. Sci. Data 2020, 7, 25. [Google Scholar] [CrossRef]
  59. Yang, K.; He, J.; Tang, W.; Qin, J.; Cheng, C.C.K. On Downward Shortwave and Longwave Radiations over High Altitude Regions: Observation and Modeling in the Tibetan Plateau. Agric. For. Meteorol. 2010, 150, 38–46. [Google Scholar] [CrossRef]
  60. Shangguan, W.; Dai, Y.; Liu, B.; Zhu, A.; Duan, Q.; Wu, L.; Ji, D.; Ye, A.; Yuan, H.; Zhang, Q.; et al. A China Data Set of Soil Properties for Land Surface Modeling. J. Adv. Model. Earth Syst. 2013, 5, 212–224. [Google Scholar] [CrossRef]
  61. Muñoz-Sabater, J.; Dutra, E.; Agustí-Panareda, A.; Albergel, C.; Arduini, G.; Balsamo, G.; Boussetta, S.; Choulga, M.; Harrigan, S.; Hersbach, H.; et al. ERA5-Land: A State-of-the-Art Global Reanalysis Dataset for Land Applications. Earth Syst. Sci. Data 2021, 13, 4349–4383. [Google Scholar] [CrossRef]
  62. Cheng, M.; Zhong, L.; Ma, Y.; Zou, M.; Ge, N.; Wang, X.; Hu, Y. A Study on the Assessment of Multi-Source Satellite Soil Moisture Products and Reanalysis Data for the Tibetan Plateau. Remote Sens. 2019, 11, 1196. [Google Scholar] [CrossRef]
  63. Chen, Y.; Yuan, H. Evaluation of Nine Sub-Daily Soil Moisture Model Products over China Using High-Resolution In Situ Observations. J. Hydrol. 2020, 588, 125054. [Google Scholar] [CrossRef]
  64. Zheng, Y.; Coxon, G.; Woods, R.; Power, D.; Rico-Ramirez, M.A.; McJannet, D.; Rosolem, R.; Li, J.; Feng, P. Evaluation of Reanalysis Soil Moisture Products Using Cosmic Ray Neutron Sensor Observations across the Globe. Hydrol. Earth Syst. Sci. 2024, 28, 1999–2022. [Google Scholar] [CrossRef]
  65. Zhang, H.; Zhang, X.; Shang, Y.; Kattel, G.; Miao, L. Continuously Vegetation Greening over Inner Mongolia for the Past Three Decades. Remote Sens. 2021, 13, 2446. [Google Scholar] [CrossRef]
  66. Zhu, Z.; Piao, S.; Myneni, R.B.; Huang, M.; Zeng, Z.; Canadell, J.G.; Ciais, P.; Sitch, S.; Friedlingstein, P.; Arneth, A.; et al. Greening of the Earth and Its Drivers. Nat. Clim. Change 2016, 6, 791–795. [Google Scholar] [CrossRef]
  67. Hu, Y.; Li, H.; Wu, D.; Chen, W.; Zhao, X.; Hou, M.; Li, A.; Zhu, Y. LAI-Indicated Vegetation Dynamic in Ecologically Fragile Region: A Case Study in the Three-North Shelter Forest Program Region of China. Ecol. Indic. 2021, 120, 106932. [Google Scholar] [CrossRef]
  68. Wang, Y.; Zhang, Y.; Yu, X.; Jia, G.; Liu, Z.; Sun, L.; Zheng, P.; Zhu, X. Grassland Soil Moisture Fluctuation and Its Relationship with Evapotranspiration. Ecol. Indic. 2021, 131, 108196. [Google Scholar] [CrossRef]
  69. Jia, X.; Shao, M.; Zhu, Y.; Luo, Y. Soil Moisture Decline Due to Afforestation Across the Loess Plateau, China. J. Hydrol. 2017, 546, 113–122. [Google Scholar] [CrossRef]
  70. Wang, Y.; Hu, W.; Sun, H.; Zhao, Y.; Zhang, P.; Li, Z.; Zhou, Z.; Tong, Y.; Liu, S.; Zhou, J.; et al. Soil Moisture Decline in China’s Monsoon Loess Critical Zone: More a Result of Land-Use Conversion than Climate Change. Proc. Natl. Acad. Sci. USA 2024, 121, e2322127121. [Google Scholar] [CrossRef]
  71. Qiu, L.; Wu, Y.; Shi, Z.; Yu, M.; Zhao, F.; Guan, Y. Quantifying Spatiotemporal Variations in Soil Moisture Driven by Vegetation Restoration on the Loess Plateau of China. J. Hydrol. 2021, 600, 126580. [Google Scholar] [CrossRef]
  72. Peng, D.; Zhou, Q.; Tang, X.; Yan, W.; Chen, M. Changes in Soil Moisture Caused Solely by Vegetation Restoration in the Karst Region of Southwest China. J. Hydrol. 2022, 613, 128460. [Google Scholar] [CrossRef]
  73. Xu, L.; Gao, G.; Wang, X.; Fu, B. Distinguishing the Effects of Climate Change and Vegetation Greening on Soil Moisture Variability Along Aridity Gradient in the Drylands of Northern China. Agric. For. Meteorol. 2023, 343, 109786. [Google Scholar] [CrossRef]
  74. Zhang, X.; Zhao, W.; Liu, Y.; Fang, X.; Feng, Q. The Relationships Between Grasslands and Soil Moisture on the Loess Plateau of China: A Review. CATENA 2016, 145, 56–67. [Google Scholar] [CrossRef]
  75. Miao, Y.; Niu, J.; Wang, D.; Berndtsson, R.; Zhang, L.; Yang, S.; Dou, T.; Wang, M.; Yang, T. Greening of China and Possible Vegetation Effects on Soil Moisture. Ecol. Indic. 2024, 158, 111382. [Google Scholar] [CrossRef]
  76. Zeng, Y.; Yang, X.; Fang, N.; Shi, Z. Large-Scale Afforestation Significantly Increases Permanent Surface Water in China’s Vegetation Restoration Regions. Agric. For. Meteorol. 2020, 290, 108001. [Google Scholar] [CrossRef]
  77. Chen, C.; Li, D.; Li, Y.; Piao, S.; Wang, X.; Huang, M.; Gentine, P.; Nemani, R.R.; Myneni, R.B. Biophysical Impacts of Earth Greening Largely Controlled by Aerodynamic Resistance. Sci. Adv. 2020, 6, eabb1981. [Google Scholar] [CrossRef]
  78. Portmann, R.; Beyerle, U.; Davin, E.; Fischer, E.M.; De Hertog, S.; Schemm, S. Global Forestation and Deforestation Affect Remote Climate via Adjusted Atmosphere and Ocean Circulation. Nat. Commun. 2022, 13, 5569. [Google Scholar] [CrossRef]
  79. Manoli, G.; Domec, J.-C.; Novick, K.; Oishi, A.C.; Noormets, A.; Marani, M.; Katul, G. Soil–Plant–Atmosphere Conditions Regulating Convective Cloud Formation above Southeastern US Pine Plantations. Glob. Change Biol. 2016, 22, 2238–2254. [Google Scholar] [CrossRef]
  80. Adams, M.A.; Buckley, T.N.; Turnbull, T.L. Diminishing CO2-Driven Gains in Water-Use Efficiency of Global Forests. Nat. Clim. Change 2020, 10, 466–471. [Google Scholar] [CrossRef]
  81. Humphrey, V.; Berg, A.; Ciais, P.; Gentine, P.; Jung, M.; Reichstein, M.; Seneviratne, S.I.; Frankenberg, C. Soil Moisture–Atmosphere Feedback Dominates Land Carbon Uptake Variability. Nature 2021, 592, 65–69. [Google Scholar] [CrossRef]
Figure 1. (a) Location of the Yinshanbeilu region, and (b) plant functional types (PFTs) in the Yinshanbeilu region. The green triangle represents the location of the Yinshanbeilu Grassland Eco-hydrology National Observation and Research Station.
Sustainability 17 02483 g001
Figure 2. Spatial distribution of the multi-year average (a) annual mean LAI and (c) growing season LAI, and the linear trend in (b) annual mean LAI, and (d) growing season LAI from 1982 to 2018. Dots indicate regions where the linear trends are statistically significant at p = 0.05. Interannual time series of (e) LAI anomaly, and (f) cumulative LAI anomaly from 1982 to 2018. ** and *** represent statistical significance at p = 0.01 and p = 0.001, respectively.
Sustainability 17 02483 g002
Figure 3. Spatial distribution of the (a) mean annual precipitation (MAP) and (b) mean annual temperature (MAT), and the linear trend in (c) MAP and (d) MAT from 1982 to 2018. Dots indicate regions where the linear trends are statistically significant at p = 0.05. Interannual time series of (e) MAP anomaly and (f) MAT anomaly from 1982 to 2018. *** represents statistical significance at p = 0.001.
Sustainability 17 02483 g003
Figure 4. Spatial distribution of (a,d,g) correlation coefficient, (b,e,h) root mean square error, and (c,f,i) mean bias between simulated and ERA5-Land soil moisture from 2000 to 2018 at different depths: (ac) 0–7 cm, (df) 7–28 cm, and (gi) 28–100 cm.
Sustainability 17 02483 g004
Figure 5. Comparisons of monthly time series between simulated soil moisture (red lines) and ERA5-Land soil moisture (black lines) from 2000 to 2018 at depths of (a) 0–7 cm, (b) 7–28 cm, and (c) 28–100 cm.
Sustainability 17 02483 g005
Figure 6. Comparisons of daily time series between simulated soil moisture (blue lines) and observed soil moisture (black lines) from 2014 to 2018 at depths of (a) 10 cm, (b) 20 cm, and (c) 30 cm.
Sustainability 17 02483 g006
Figure 7. Spatial patterns of simulated annual average soil moisture (units: m3 m−3) at soil depths of (ac) 0–7 cm, (df) 7–28 cm, (gi) 28–100 cm, and (jl) 0–100cm from the (a,d,g,j) CTL and (b,e,h,k) DYN; and (c,f,i,l) the difference of soil moisture between CTL and DYN.
Sustainability 17 02483 g007
Figure 8. Spatial distributions of the linear trends in (a,b) 0–7 cm, (c,d) 7–28 cm, (e,f) 28–100 cm, and (g,h) 0–100 cm soil moisture (units: 10−3 m3 m−3 yr−1) for (a,c,e,g) CTL and (b,d,f,h) DYN from 1982 to 2018.
Sustainability 17 02483 g008
Figure 9. Interannual variations in the (a) 0–7 cm, (b) 7–28 cm, (c) 28–100 cm, (d) 0–100 cm soil moisture for CTL (black lines) and DYN (red lines) from 1982 to 2018, and (e) the difference between CTL and DYN for the four soil profiles.
Sustainability 17 02483 g009
Figure 10. Seasonal variations in the (a) 0–7 cm, (b) 7–28 cm, (c) 28–100 cm, and (d) 0–100 cm soil moisture for CTL (black lines) and DYN (red lines) from 1982 to 2018, and (e) the difference between CTL and DYN for the four soil profiles.
Sustainability 17 02483 g010
Figure 11. The difference of (a,e,i,m) 0–7 cm, (b,f,j,n) 7–28 cm, (c,g,k,o) 28–100 cm, and (d,h,l,p) 0–100 cm soil moisture (units: m3 m−3) between CTL and DYN in (ad) March–May, (eh) June–August, (il) September–November, and (mp) December-–February.
Sustainability 17 02483 g011
Table 1. Datasets used in this study.
DataTime PeriodResolutionSource
GLOBMAP V3 LAI1982–20208 km/Half month (1981–2000), 8-day (2001–present)https://zenodo.org/records/4700264,
(accessed on 7 September 2023)
China Meteorological Forcing Dataset1979–20180.1° × 0.1°/3 hhttps://data.tpdc.ac.cn/en/data/8028b944-daaa-4511-8769-965612652c49/, (accessed on 22 April 2022)
Plant functional types map in China (1 km)20001 kmhttps://data.tpdc.ac.cn/en/data/ab193a70-63a5-4df6-9bc1-d9b5ac5fb044/, (accessed on 1 September 2022)
The Soil Database of China for Land Surface Modeling/1 kmhttp://globalchange.bnu.edu.cn/research/soil2, (accessed on 6 February 2023)
ERA5-Land reanalysis soil moisture1950 to present9 km/monthlyhttps://cds.climate.copernicus.eu/datasets/reanalysis-era5-land-monthly-means?tab=download, (accessed on 3 March 2024)
In situ soil moisture2014–2018DailyThe Yinshanbeilu Grassland Eco-hydrology National Observation and Research Station
Disclaimer/Publisher’s Note: The statements, opinions and data contained in all publications are solely those of the individual author(s) and contributor(s) and not of MDPI and/or the editor(s). MDPI and/or the editor(s) disclaim responsibility for any injury to people or property resulting from any ideas, methods, instructions or products referred to in the content.

