Article

V-Shaped Dynamic Morphology Curve: A Sustainable Approach to Automotive Wheel Design

1
School of Mechanical Engineering, Yanshan University, Qinhuangdao 066004, China
2
North Automatic Control Technology Institute, Taiyuan 030006, China
3
School of Arts and Design, Hebei Design Innovation and Industrial Development Research Center, Yanshan University, Qinhuangdao 066004, China
4
School of Intelligent Manufacturing and Aeronautics, Zhuhai College of Science and Technology, Zhuhai 519000, China
*
Author to whom correspondence should be addressed.
Sustainability 2025, 17(6), 2463; https://doi.org/10.3390/su17062463
Submission received: 17 January 2025 / Revised: 11 February 2025 / Accepted: 4 March 2025 / Published: 11 March 2025

Abstract

:
The increasing demand for efficiency, brand consistency, and sustainability in automotive design has led to the exploration of innovative methods. This study investigated the impact of the V-shaped Dynamic Morphology Curve (VDMC) on design efficiency, brand consistency, and sustainability outcomes in automobile wheel design. A total of 24 designers took part, divided into an experimental group using VDMC and a control group using traditional CAD methods. VDMC uses parametric modeling to accelerate design iterations while maintaining brand identity. The experimental group completed the design task 31.5% faster, achieved significantly higher brand consistency (9.1/10 vs. 7.8/10), and reduced the number of design iterations by 53.2% compared to the control group. Furthermore, the experimental group made 50.9% fewer design changes, indicating higher design stability. These results show that VDMC significantly improves design efficiency and sustainability by reducing both time and resource consumption while ensuring greater alignment with brand guidelines. This study highlights the potential of VDMC to transform traditional design practices and offers notable benefits for both creative processes and environmental impact. The results suggest that integrating VDMC into design workflows could lead to significant improvements in efficiency and sustainability in the automotive industry and beyond.

1. Introduction

In the rapidly evolving automotive industry, wheels are not merely functional components ensuring basic vehicle mobility and safety but have progressively evolved into essential and highly visible elements that significantly contribute to a vehicle’s comprehensive aesthetic identity, overall brand perception, and crucial market differentiation [1,2]. As one of the most visually prominent and stylistically impactful parts of an automobile, the wheel design profoundly influences immediate consumer perception, playing a demonstrably crucial role in shaping vehicle purchasing decisions and effectively differentiating competing brands within an intensely competitive global automotive market [3,4]. However, a persistent and increasingly critical challenge within the contemporary automotive industry is the observable and intensifying “homogenization” of automotive wheel designs, with a growing number of products from diverse global manufacturers appearing strikingly and often undesirably similar in terms of overall styling, visual attributes, and readily perceived aesthetic characteristics [5]. This pervasive and accelerating lack of meaningful visual distinctiveness not only fundamentally undermines carefully cultivated brand identity and potentially dilutes hard-earned brand equity but also demonstrably stifles genuine design innovation, limits creative exploration within design teams, and restricts overall aesthetic diversity within the industry, consequently hindering effective market segmentation, impeding brand differentiation efforts, and potentially diminishing long-term consumer engagement and brand loyalty [6,7]. Consequently, there is an escalating and critically important demand across the automotive sector for the development and widespread adoption of demonstrably more systematic, significantly more efficient, and, crucially, genuinely innovative design methodologies that can proactively and effectively address these multifaceted and interconnected challenges, consistently foster more compelling and readily recognizable distinctive product identities, and meaningfully enhance robust brand differentiation within the intensely competitive global automotive marketplace [8,9].
Traditionally, the inherently complex development process of automotive wheels has been deeply and inextricably rooted in individual designers’ subjective artistic intuition, extensive accumulated tacit knowledge acquired over years of practice, and specialized professional expertise honed through direct experience [10]. This predominantly experience-driven design approach typically involves inherently iterative and often protracted cycles of manual sketching and freehand drawing, intricate physical modeling using clay or foam prototypes, and resource-intensive performance prototyping and physical testing, with automotive designers progressively refining their conceptual designs and iteratively improving physical prototypes based primarily on subjective aesthetic preferences, qualitative feedback from stakeholders, and objective engineering performance constraints derived from physical testing and simulation [11]. While this long-established, craft-centric method undeniably allows for considerable creative freedom in individual expression and the nuanced incorporation of subtle and often highly refined aesthetic sensibilities, it is also demonstrably time-consuming and inherently inefficient in terms of resource utilization and design cycle duration, and it frequently results in demonstrably suboptimal designs that may not fully capitalize on latent opportunities for comprehensive multiobjective performance optimization, robust and readily apparent brand differentiation in crowded markets, or the proactive integration of truly sustainable manufacturing and full product life-cycle practices [12,13].
Additionally, when the automotive wheel design process remains predominantly reliant on the subjective interpretations, individual creative skills, and tacit knowledge of specific designers, meticulously maintaining a cohesive and demonstrably consistent brand identity, visual language, and aesthetic DNA across a diverse and rapidly expanding portfolio of increasingly complex wheel designs and vehicle models becomes progressively more complex, exceptionally challenging to manage effectively, and potentially prone to unintended inconsistencies, subjective variations, and gradual brand dilution, ultimately leading to weakened overall brand equity and less clearly defined market positioning [14]. This critical and evolving context urgently underscores the pressing and industry-wide need for the accelerated development and proactive, widespread adoption of demonstrably more structured, rigorously formalized, and demonstrably data-driven design methods, advanced computational tools, and integrated digital workflows that can simultaneously and effectively promote genuine and impactful design innovation, proactively ensure robust and readily verifiable brand consistency across diverse product lines, and seamlessly integrate increasingly critical sustainability considerations directly into mainstream automotive wheel design and manufacturing processes [15,16].
To overcome the inherent limitations and widely recognized inefficiencies of these traditional, predominantly intuition-based automotive wheel design approaches, parametric design has progressively emerged as a truly central, fundamentally transformative, and increasingly indispensable methodology in contemporary automotive wheel engineering, advanced automotive styling, and broader sophisticated product development across a diverse spectrum of global industries [17,18]. Pioneering and highly influential research rigorously conducted by Wu et al. [19] effectively and definitively demonstrated the significant efficacy and numerous practical advantages of well-implemented parametric design for creating genuinely innovative biomimetic wheels exhibiting enhanced structural performance, skillfully utilizing advanced computational software tools and algorithmic design methods to accurately simulate complex natural shapes, organic forms, and biologically inspired structural hierarchies that inherently achieve a superior and often non-intuitive balance between demonstrably lightweight structural configurations, optimized material distribution, and measurably enhanced mechanical strength, long-term durability, and overall structural robustness. Building directly and strategically upon that critically important foundational work, Sun et al. [20,21] subsequently introduced the groundbreaking and demonstrably versatile V-shaped memory curve concept and meticulously established a comprehensive and remarkably adaptable feature system specifically designed for systematically characterizing the inherently complex morphology of diverse automotive wheel shapes with a high degree of precision and quantifiable accuracy. Subsequent in-depth investigations, rigorous empirical studies, and extensive computational analyses meticulously conducted by numerous researchers [22,23,24,25] have comprehensively examined and elucidated the intricate mapping relationships, complex interdependencies, and often subtle nuances between readily quantifiable user preferences, dynamic market trends, evolving consumer tastes, and specific, objectively measurable wheel shape characteristics, key design parameters, and overall aesthetic attributes. Zheng et al. [26] expertly conducted a detailed and systematic parametric study to meticulously evaluate and accurately quantify the nuanced influence of a wide range of critical design and operational parameters, including spoke geometry, rim thickness, and material selection, on the complex vibration characteristics of advanced automotive wheel rims, providing critically important engineering insights, experimentally validated data, and practically applicable design guidelines for proactively enhancing vehicle safety margins, measurably improving overall ride comfort and passenger experience, and optimizing noise, vibration, and harshness (NVH) performance characteristics in next-generation automotive designs intended for diverse global markets and demanding operating conditions. Liu et al. [27], skillfully leveraging the powerful synergistic combination of bio-inspired morpho-biomimetic parametric design principles, advanced computational topology optimization algorithms, and robust finite element analysis (FEA) software such as ANSYS 2024 R1, comprehensively investigated innovative lightweight design strategies and reliable fatigue life prediction methodologies specifically tailored for advanced automotive wheel rims constructed from lightweight materials such as aluminum alloys and composite materials, with the overarching aim of simultaneously achieving demonstrably enhanced structural durability and long-term fatigue resistance, significant reductions in overall material consumption and component weight, and measurably improved resource efficiency throughout the entire wheel manufacturing life cycle, from raw material extraction to component end-of-life recycling and sustainable disposal. Dong et al. [28] further optimized the intricate internal structure and heterogeneous material distribution within high-performance automotive wheel rims through the strategic application of advanced biomimetic design approaches and nature-inspired optimization algorithms, actively seeking to effectively mimic nature’s inherently efficient, materially optimized, and structurally robust solutions commonly found in diverse biological systems, natural organisms, and evolutionary design strategies observed in living organisms. Xu et al. [29] proposed a novel and demonstrably effective lightweight construction method specifically and optimally tailored for mass-manufactured automotive wheel rims, directly and proactively addressing the increasingly critical industry-wide demand for substantial weight reduction in both modern electric vehicles (EVs) and high-volume conventional internal combustion engine (ICE) vehicles in order to significantly improve overall vehicle energy efficiency, reduce harmful greenhouse gas emissions contributing to climate change, and enhance vehicle driving range and overall operational efficiency for consumers and fleet operators. These collective and convergent studies robustly and unequivocally demonstrate, through both rigorous experimental validation and extensive computational simulation, that well-implemented and thoughtfully integrated parametric design methodologies offer significant and multifaceted advantages in drastically reducing overall design cycle time, substantially enhancing design efficiency across complex workflows, and simultaneously providing automotive designers with unprecedented levels of granular flexibility, precise geometric control, and data-driven optimization capabilities in effectively customizing both the essential functional physical properties and the compelling aesthetic attributes of truly innovative and market-leading automotive wheel products designed for diverse global customer segments [30,31].
However, despite these noteworthy advancements, compelling empirical evidence, and demonstrable practical benefits, substantial challenges and unresolved open research questions persistently remain in seamlessly and comprehensively integrating advanced parametric design methodologies into broader, industry-scale automotive design workflows and large-scale manufacturing processes, particularly in the critically important and increasingly urgent context of effectively balancing enhanced design efficiency and accelerated innovation cycles with the paramount imperative of consistently maintaining robust brand identity and visual coherence across diverse and expanding product lines, proactively incorporating increasingly critical sustainability considerations throughout the entire automotive product life cycle, from initial raw material sourcing and environmentally responsible manufacturing processes to component end-of-life management, effective recycling strategies, and broader circular economy principles [32,33].
Furthermore, the increasingly sophisticated and rapidly evolving integration of cutting-edge advanced manufacturing technologies, such as industrial-scale additive manufacturing (3D printing), high-precision multiaxis CNC machining, and advanced robotic assembly systems, with data-driven parametric design workflows and AI-powered design optimization algorithms presents both unprecedented opportunities for radical design innovation, mass customization, and on-demand manufacturing and significant challenges for practical industrial implementation, large-scale production scalability, and robust long-term economic viability in future automotive wheel engineering, manufacturing, and global supply chain management [34,35]. The ongoing and accelerating exploration of novel lightweight materials, advanced high-performance polymers, and innovative multimaterial combinations within adaptable and computationally efficient parametric design frameworks also represents a particularly promising and rapidly expanding avenue for sustained design and engineering innovation, impactful performance enhancements, and significant advancements in achieving truly lightweight, demonstrably high-performance, and inherently sustainable wheel solutions optimized for the next generation of electric, hybrid, and autonomous vehicles [36,37].
In recent years, the application of artificial intelligence (AI) and machine learning (ML) technologies in wheel design has gradually become a research focus. Akande [38] explored the use of generative models such as VAEs and GANs to automate 3D wheel design workflows and optimize performance metrics. Furthermore, Akande and colleagues [39] integrated deep learning into CAD/CAE systems, enabling automatic generation and evaluation of 3D wheel models, thereby significantly improving design efficiency and performance optimization in real-world projects.
To address these challenges, recent advances in computer-aided design and parametric modeling have begun to reshape the automotive design landscape. These methods aim to improve the design process by increasing flexibility, efficiency, and precision. A promising development in this field is the introduction of the V-shaped Dynamic Morphology Curve (VDMC), a novel design framework specifically proposed for derivative designs of automobile wheels. VDMC offers a systematic approach to exploring different design variations while ensuring that the final design is consistent with the brand’s visual identity. This method leverages key design parameters in flexible structures, allowing designers to generate multiple iterations and adaptations of wheel designs while maintaining core brand principles.
VDMC not only serves as a tool to improve design efficiency but also contributes to the broader goal of sustainable product design. By optimizing the design process, VDMC helps reduce resource consumption and minimize environmental impact during both the design and production phases. In this regard, VDMC represents an important step forward, balancing creative freedom, technical feasibility, and environmental responsibility. This is particularly important at a time when both the automotive industry and consumers are increasingly aware of the environmental impact of manufacturing and product life cycles.
The rest of this paper is organized as follows: Section 2 discusses the classification and features of VDMC and highlights its versatility and application in capturing different design styles. Section 3 describes the proposed derived design method and explains the algorithmic rules and procedures for generating new wheel designs in detail. Section 4 presents a case study in which the effectiveness of the VDMC method is validated through a series of design iterations and evaluations. Finally, Section 5 summarizes the key findings and discusses the broader implications of this research for the future of automotive design. By addressing the challenge of product homogenization, this paper proposes a new path to achieve greater innovation, sustainability, and brand differentiation in wheel design.

2. Methods

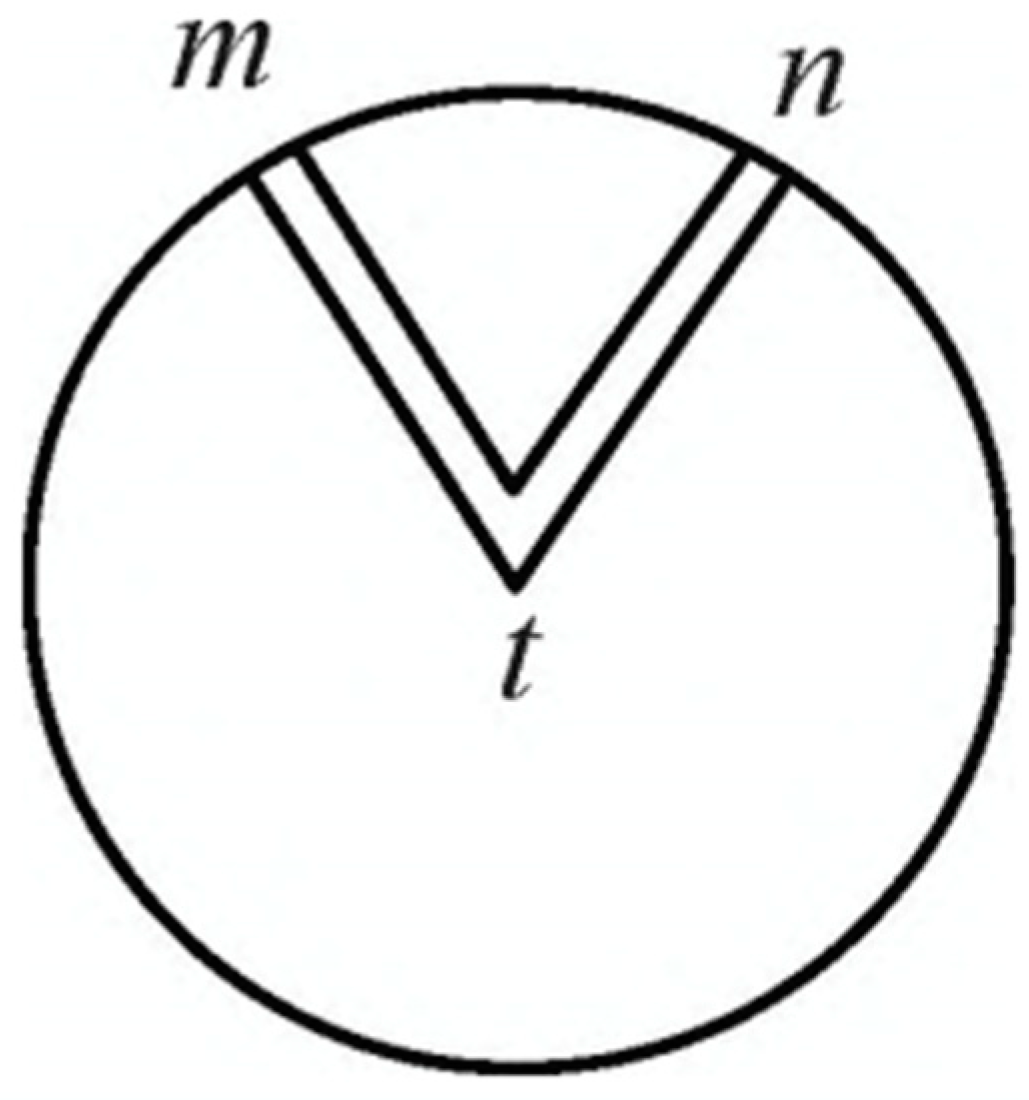
2.1. Overview of the VDMC Theory

The V-shaped Dynamic Morphology Curve (VDMC) theory represents an innovative framework in automotive wheel design, offering a structured approach to integrating dynamic adaptability within the traditionally rigid V-shaped spoke configuration. This methodology enhances design flexibility, allowing for the systematic exploration of diverse aesthetic and functional variations while maintaining brand identity and structural integrity.
Conventional wheel designs primarily rely on static V-shaped spokes, which provide mechanical robustness but often constrain stylistic diversity. VDMC overcomes these limitations by embedding adjustable parametric control points into the design process. These parameters regulate both geometric and aesthetic attributes, facilitating the generation of tailored design iterations that align with evolving market trends and consumer preferences.
A foundational concept influencing VDMC is the V-shaped Memory Curve, originally introduced by Sun Li [40]. This concept categorizes wheel design variations within a structured morphological framework, ensuring continuity in product styling while allowing for adaptive refinements. Within this framework, modifications to the fundamental V-shaped form yield distinct yet coherent design expressions, reinforcing brand heritage and market differentiation.
Moreover, the integration of parametric design principles further enhances the flexibility of the VDMC framework. Parametric modeling has been widely applied across various industrial design disciplines to create complex and adaptable structures that can be modified to meet precise design specifications. In the context of automotive wheels, parametric design optimizes spoke geometry, thereby improving both aesthetic appeal and structural performance. For example, Wang et al. [41] demonstrated a parametric generation approach using Grasshopper 7.0 to address design uniformity in new energy vehicles, and Puangchaum et al. [42] presented an optimization technique for alloy wheels based on dynamic cornering fatigue tests.
By synthesizing dynamic morphology with parametric adaptability, VDMC provides a comprehensive strategy for advancing wheel design. This approach not only expands the spectrum of creative possibilities but also ensures that each design iteration remains consistent with the brand’s visual language. Furthermore, VDMC facilitates a seamless integration of innovative design principles with emerging computational technologies, paving the way for a more adaptive, consumer-responsive, and sustainable approach to automotive product development.

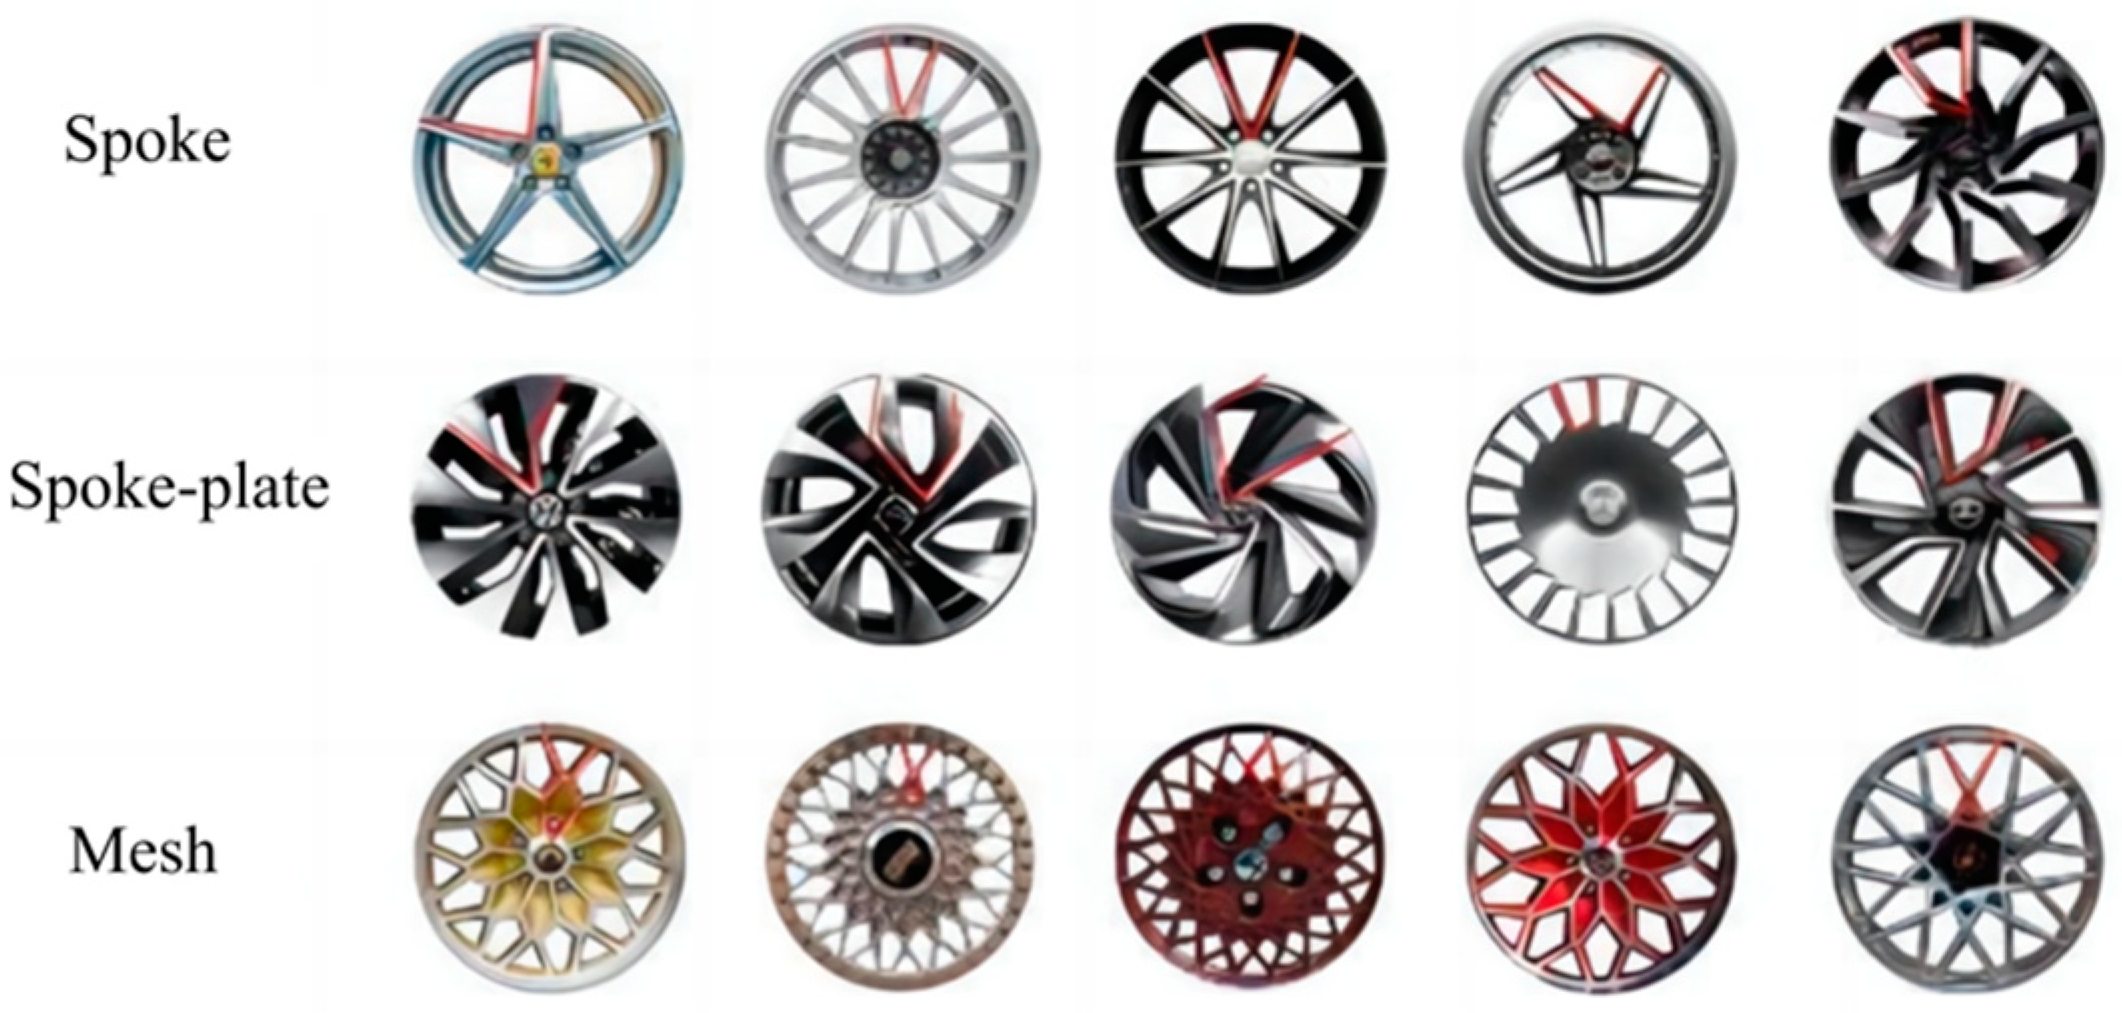
2.2. Extraction and Classification of VDMC

2.2.1. Curve Extraction and Classification

First, a comprehensive dataset of wheel designs was collected from various sources, including automotive design databases, brand websites, and wheel shapes generated using digital design software. The images were taken primarily from the frontal view, which is the most common visual representation of a wheel. Using image processing software (e.g., Photoshop 2022 or MATLAB R2023a), all images were standardized to the same size to ensure uniformity of the dataset. Vectorization algorithms were then applied to extract the underlying shapes of the rims, enabling detailed analysis and curve extraction, as shown in Figure 1.
When looking at the front view of each rim, special attention was paid to the shape of the spokes as they closely follow the shape of the V-shaped curves. These curves reflect the primary arrangement and geometric organization of the wheel’s structural elements. Through special curve fitting and edge detection algorithms, the V-shaped curves were precisely extracted and formed a representative set of VDMCs. The extraction process involved isolating the points of interest (control points) on each curve. These control points, along with their respective curvature changes, served as the basis for further classification and analysis. By identifying and isolating these curves, we were able to collect a dataset that represents the most critical V-shaped features in automotive wheel designs.
After extraction, the VDMCs were classified based on their geometric properties and the degree of dynamic variation of their control parameters. The classification focused on symmetry, control points, and the dynamic transformation of each curve type. The classification scheme consists of two main categories, as shown in Figure 2:
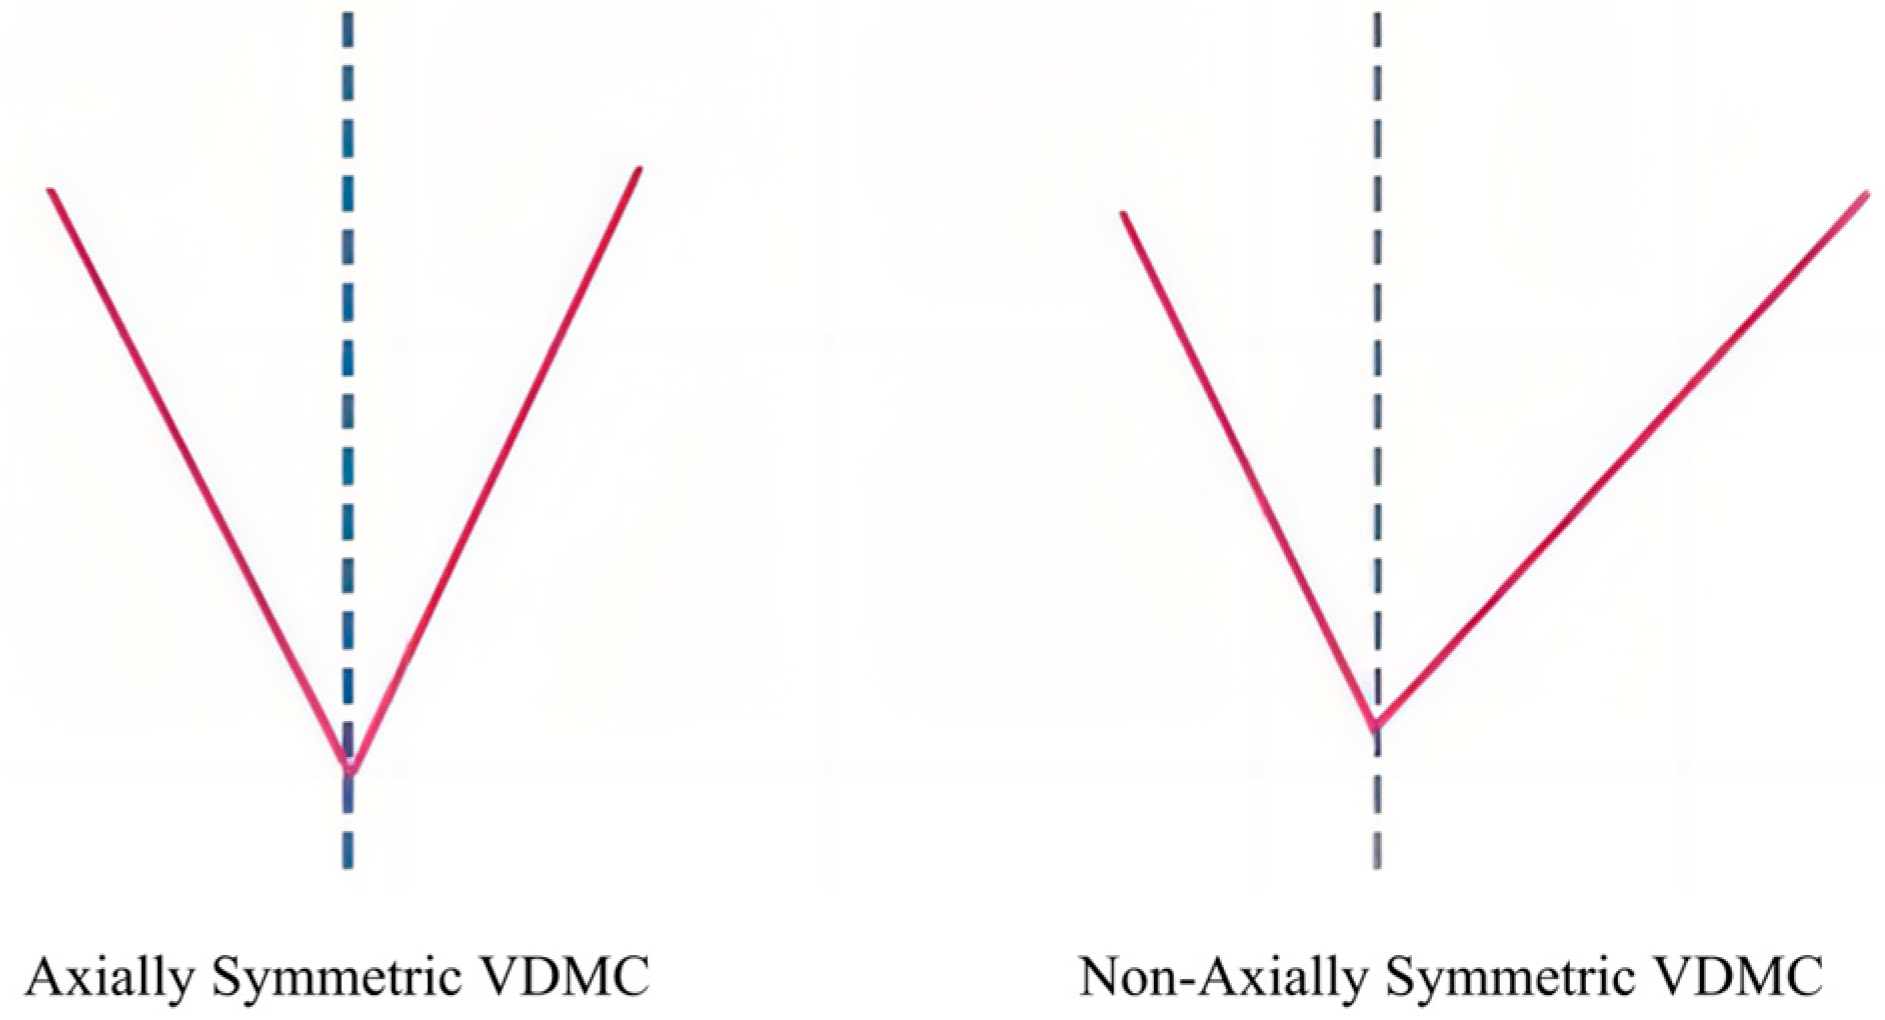
  • Axially symmetric VDMCs: These curves are symmetrical with respect to a central axis, meaning that the left and right sides of the curve follow the same pattern of variation. This symmetry is typically seen in designs that emphasize balance and stability. Axially symmetric VDMCs are generally used in rim designs that emphasize simplicity and classic aesthetics.
  • Non-axially symmetric VDMCs: These curves exhibit no symmetry with respect to a central axis, meaning the variations on the left and right sides of the curve differ in both form and progression. Non-axially symmetric VDMCs are often utilized in more dynamic and modern rim designs, where asymmetry is used to convey movement, innovation, and uniqueness. These curves allow for greater flexibility in shaping the rim’s aesthetic, particularly in designs that emphasize visual complexity or emphasize certain functional aspects of the wheel.
The VDMC is categorized into three types based on its linear shape: double straight line, double broken line, and broken straight line. The broken straight line type is unique to non-axially symmetric VDMCs. As shown in Table 1, axially symmetric VDMCs can be further classified into three categories: basic shape, inward curved shape, and outwardly curved shape.
The non-axially symmetric VDMC is divided into four types: basic shape, contraction–expansion shape, inward curved shape, and outward curved shape, as shown in Table 2.

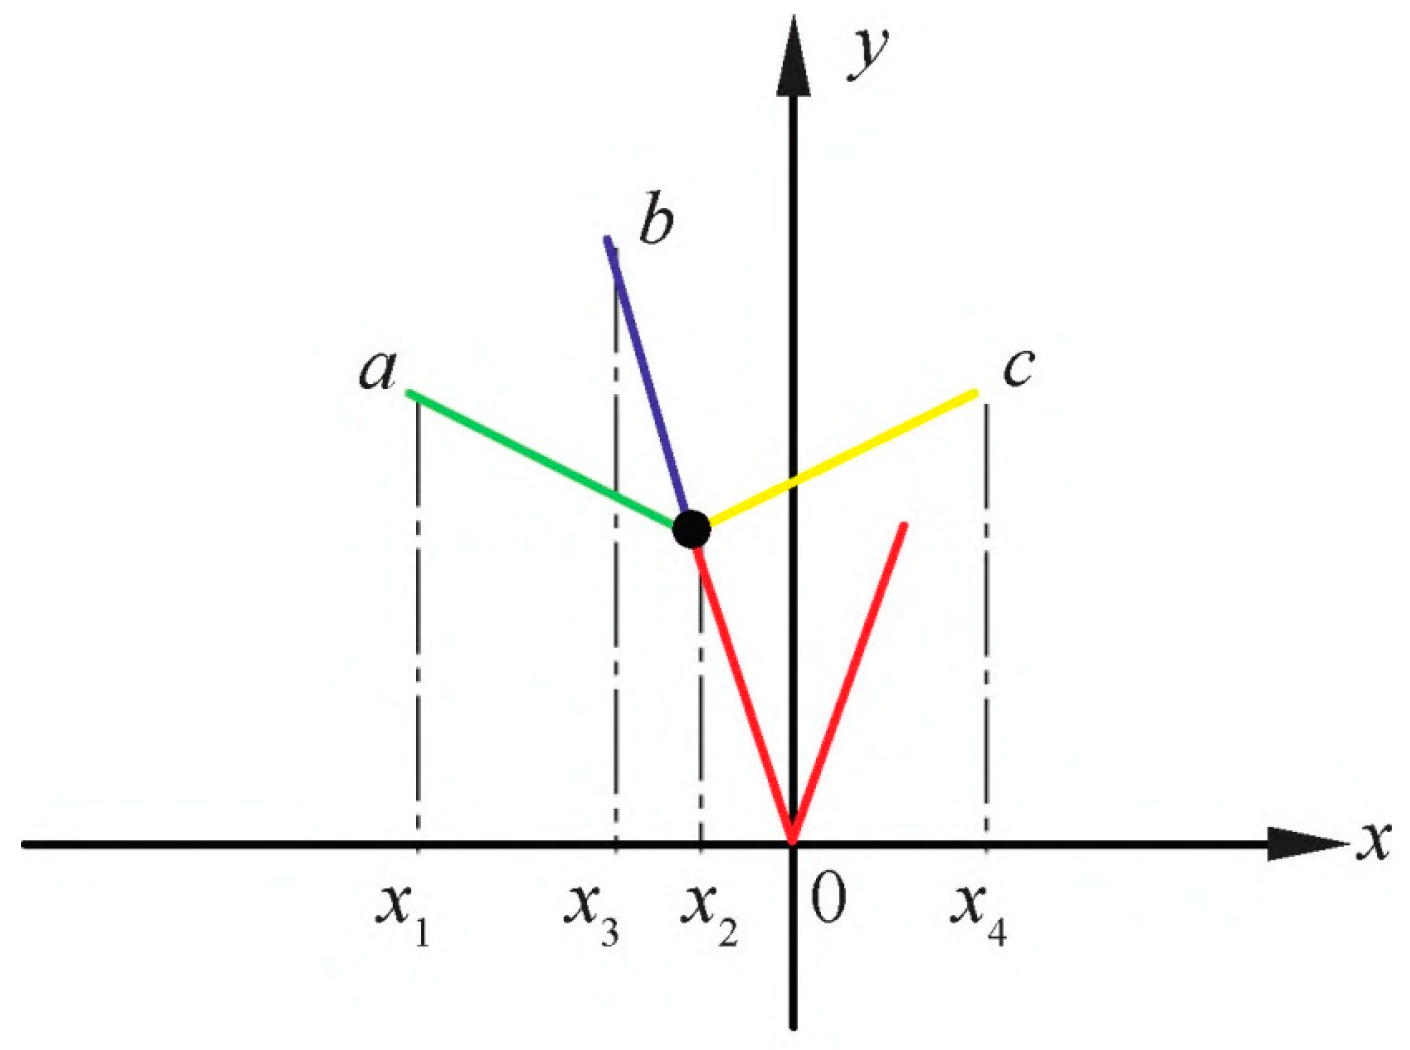
2.2.2. Control Point Analysis

By analyzing V-shaped curve profiles extracted from existing wheel hubs, it was observed that the number of control points on these curves ranges from a maximum of 3 to a minimum of 0. V-shaped curves with 2 or 3 control points are relatively rare. Additionally, V-shaped curves with two or more control points tend to approximate a straight line rather than maintaining a distinct curve. Therefore, this study mainly focuses on the classification and variation of V-shaped curves with 0 or 1 control point. Further studies on V-shaped curves with 2 control points are planned for future research.
When a VDMC is axially symmetric and has no control points (i.e., with 0 control points), it is referred to as the basic shape. By adding one control point to the basic shape, the V-shaped curve can be transformed into either an inward curved or outward curved shape. The morphological changes of the curve upon the addition of a single control point are illustrated in Figure 3. Because the curves studied are axially symmetrical, the curves exhibit symmetry along the y-axis, meaning that the variations on both sides of the axis are identical. Therefore, only one side is selected for the transformation demonstration in this study.
The morphology of the curve with control points changes in the range of ac. When the curve reaches position b, it represents the basic shape with 0 control points. In the ab area, the curve takes the outwardly curved shape, and in the bc area it changes to the inwardly curved shape.
The values on the x-axis (e.g., “x1”, “x2”, “x3”) in Figure 3 represent the x-coordinates of control points or key points of the V-shaped curve. These values define the geometric positions that govern the shape and segmentation of the curve. x1, x2, x3, etc., denote critical points along the x-axis where the curve’s behavior or properties change. These points are used to specify the domains of the piecewise-defined curve functions. The line “l” represents the functional expression of the V-shaped curve within the range from a to c. By adjusting the parameter k, the shape of V-shaped curve can be altered.
l a : y   =   k 1 x + b 1 ,   x 1 x x 2             k 0 x ,   x 2 x 0
l b : y   =   k 0 x ,   x 3 x 0
l c : y 1 = k 2 x + b 2 ,   x 2 x x 4             y 2 = k 0 x ,   x 2 x 0
In the equations, x represents the independent variable, determining the horizontal position along the curve, while y is the dependent variable, representing the corresponding vertical position. The parameter k denotes the slope of the curve, controlling its steepness and direction, and b is the constant intercept, which shifts the curve vertically. Together, these parameters define the geometric and functional characteristics of the V-shaped memory curve.
In summary, the x-axis values are critical for describing the mathematical characteristics and spatial definition of the V-shaped curve.
When the non-axially symmetric VDMC has 0 control points, it is considered the basic shape. By adding one control point on each of the two sides of the basic shape, the VDMC can be transformed into three different shapes: double broken line inward curved, outward curved, and contraction–expansion shapes. Furthermore, by adding a control point to only one side of the basic shape, the VDMC can be transformed into two variations: broken straight line inwardly curved and outwardly curved shapes.
Figure 4 illustrates the transformation of the non-axially symmetric VDMC with the addition of a control point. In this context, the VDMC transitions reflect the geometric and dynamic variations of the curve structure.
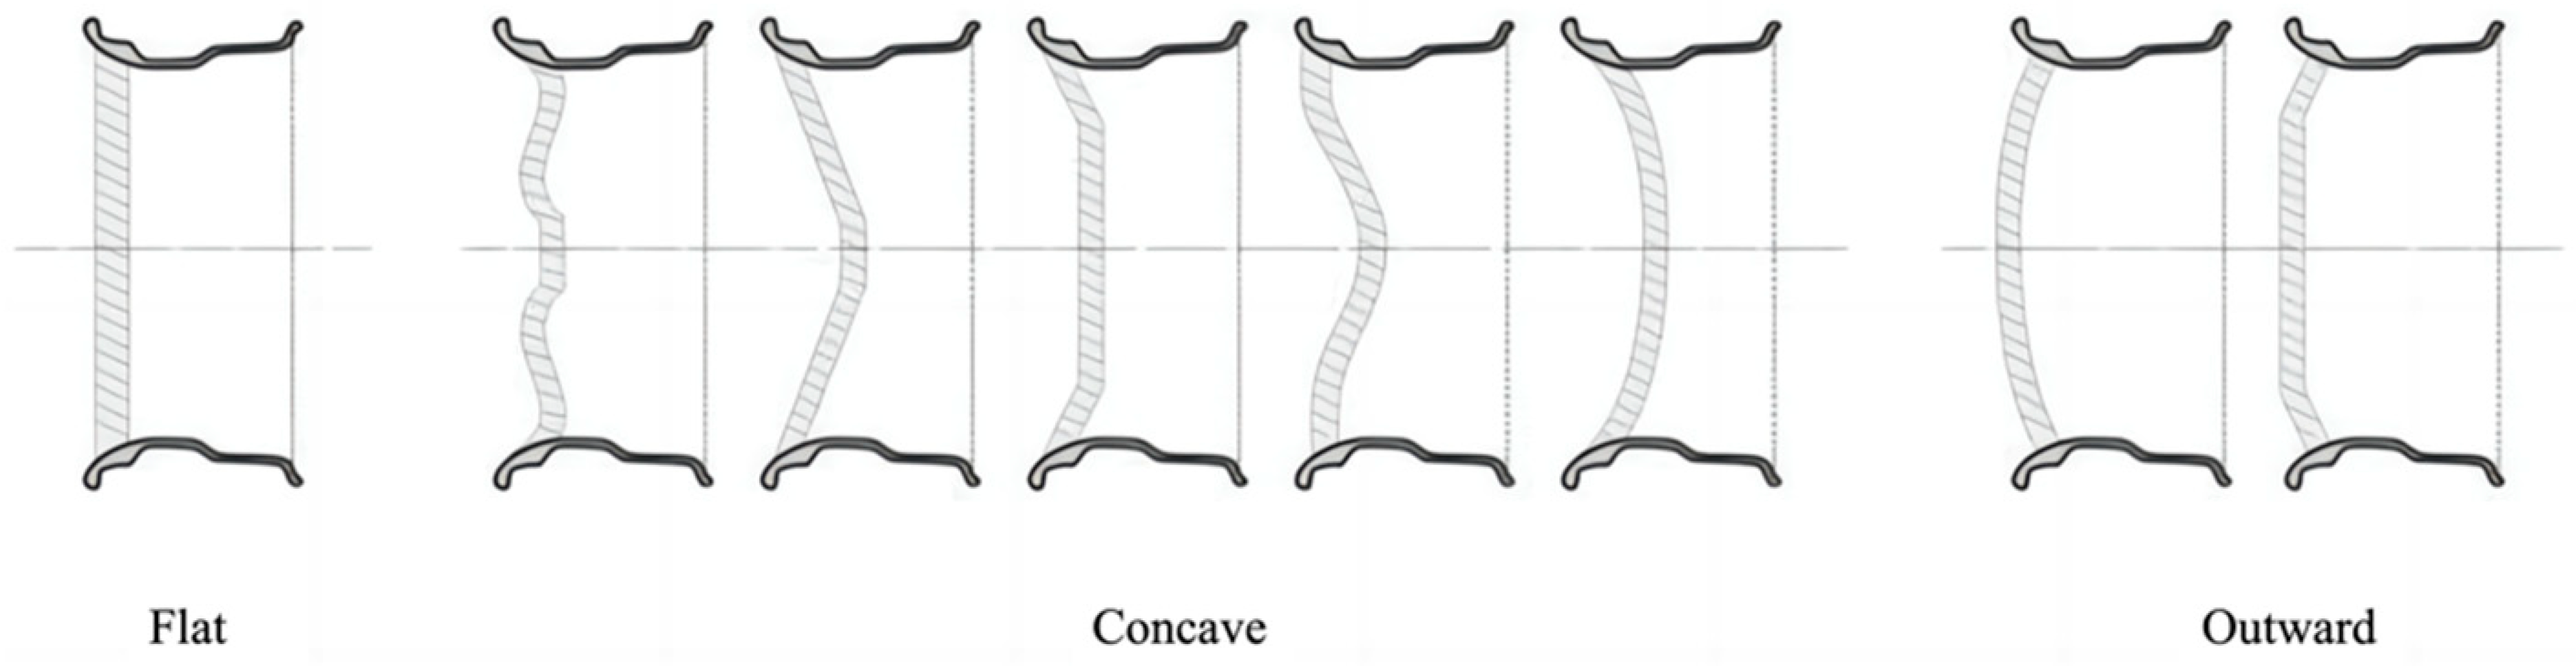
  • Category 1—Bb combination (double straight line basic form): In this category, the VDMC is in its basic form with 0 control points, representing a foundational shape for further transformations.
  • Category 2—Ba combination (broken straight line inward curved form): For this configuration, the VDMC transforms into an inwardly curved broken straight line shape with 1 control point. This shape represents a transition from the basic shape to a more complex inward curvature, introducing a controlled, dynamic transformation.
  • Category 3—Bc combination (broken straight line outward curved form): This category involves the VDMC transforming into an outwardly curved broken straight line shape, again with 1 control point. The outward curve represents a shift from the basic shape to a more expansive geometry, broadening the curve’s appearance and structure.
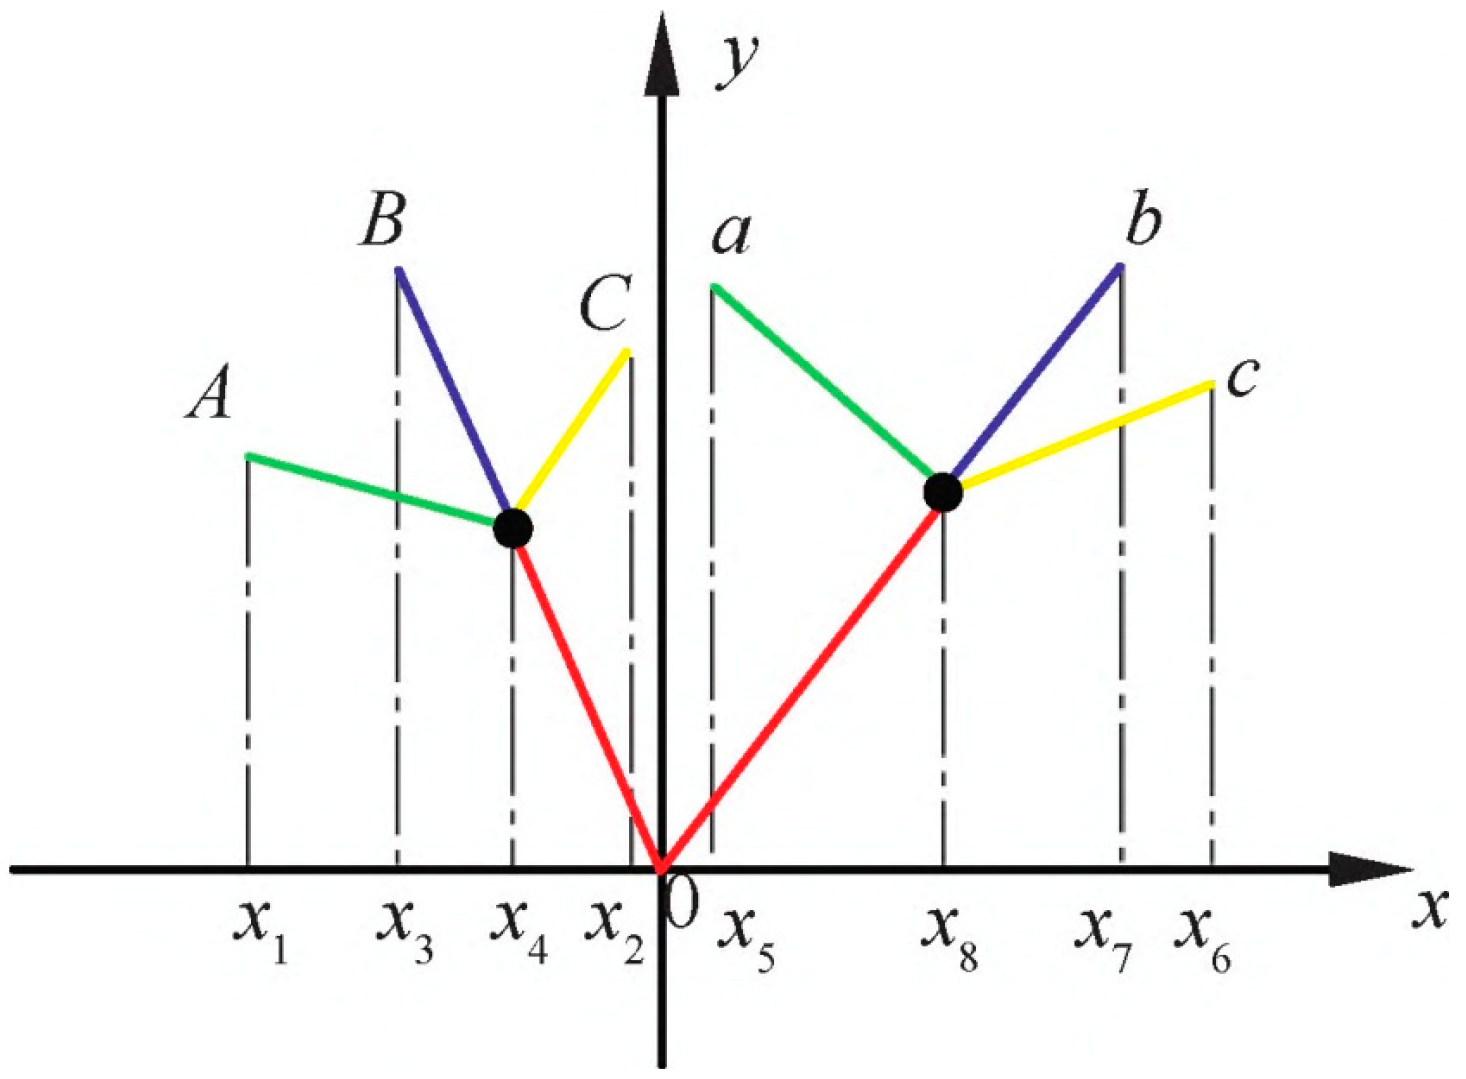
  • Category 4—Cc combination (double broken line contraction–expansion form): In this transformation, the VDMC becomes a double broken line with contraction–expansion features, using 1 control point. The curve demonstrates a more intricate shape, where both inward and outward transitions occur within the same structure, contributing to a more dynamic and adaptable shape.
  • Category 5—Ac combination (double broken line outward curved form): The VDMC in this category evolves into a double broken line with outward expansion characteristics, utilizing 1 control point. This shape maintains a more extended, outward-facing curve, providing a visually prominent and expansive shape while keeping the underlying symmetry intact.
  • Category 6—Ca combination (double broken line contraction–expansion form): This configuration results in a double broken line inwardly curved shape, again with 1 control point. It represents the opposite of outward expansion, focusing on creating a more contained and inwardly bent structure, contributing to the overall compactness of the design.
In Categories 2 and 3 (Ba and Bc combinations), the control point is applied to one side of the basic shape, introducing either an inward or an outward curvature. This single control point, while applied to one side, influences the overall geometry of the curve, breaking the symmetry of the basic shape and creating a dynamic transformation. In Categories 4, 5, and 6 (Cc, Ac, and Ca combinations), the control point is applied in a manner that affects both sides of the curve simultaneously even though only one control point is used. This is because the control point is strategically positioned to guide the global shape of the curve, ensuring that the resulting transformations—such as double broken lines with inward or outward curvature or contraction–expansion features—are achieved with a single control point.
The use of a single control point in these categories is intentional, as it maintains design simplicity while allowing for complex geometric transformations. Adding additional control points could lead to unnecessary complexity and reduce the predictability of the curve’s behavior. Thus, the control point in Categories 4, 5, and 6 is not limited to one side but rather serves as a global influence on the curve’s shape, enabling symmetric or asymmetric transformations as required.
The asymmetric VDMCs allow for independently adjustable morphologies on the left and right sides, with the left side controllable within ranges AC and the right side within range ac, with a wide range of combinations. These variations allow for a diverse range of transformations when a single control point is added. The free combination of these shapes results in a vast array of possible configurations, representing the dynamic nature of VDMC in automotive rim design. This flexibility in shape allows for innovation in the design process, contributing to the diversity and uniqueness of the wheel’s overall appearance.
The design of a wheel hub includes several key elements, including structural composition, pitch circle diameter (PCD) holes, central foramina, rim, number of spokes, forward shape, and side profile characteristics. The front and side curves of the spokes are crucial features in the design of a wheel hub, while the remaining elements help refine finer details and local features. The V-shaped Dynamic Morphological Curve (VDMC) serves as a structural framework for the front design of the wheel and plays a crucial role in the brand identity. Therefore, the wheel design process can be viewed as a continuous modification and adaptation of this framework, with VDMC acting as a guiding principle for these changes. It represents an innovative approach to establishing and preserving a company’s unique design language, ensuring consistency and recognition across the product line.
Therefore, it is essential to further classify and characterize the V-shaped skeletal features of the hub based on the VDMC. Furthermore, the development of corresponding operational rules governing the relationships between these skeletal features is crucial for establishing a novel hub design methodology based on VDMC.

2.3. VDMC-Based Structural Skeleton for Wheel Hub Design

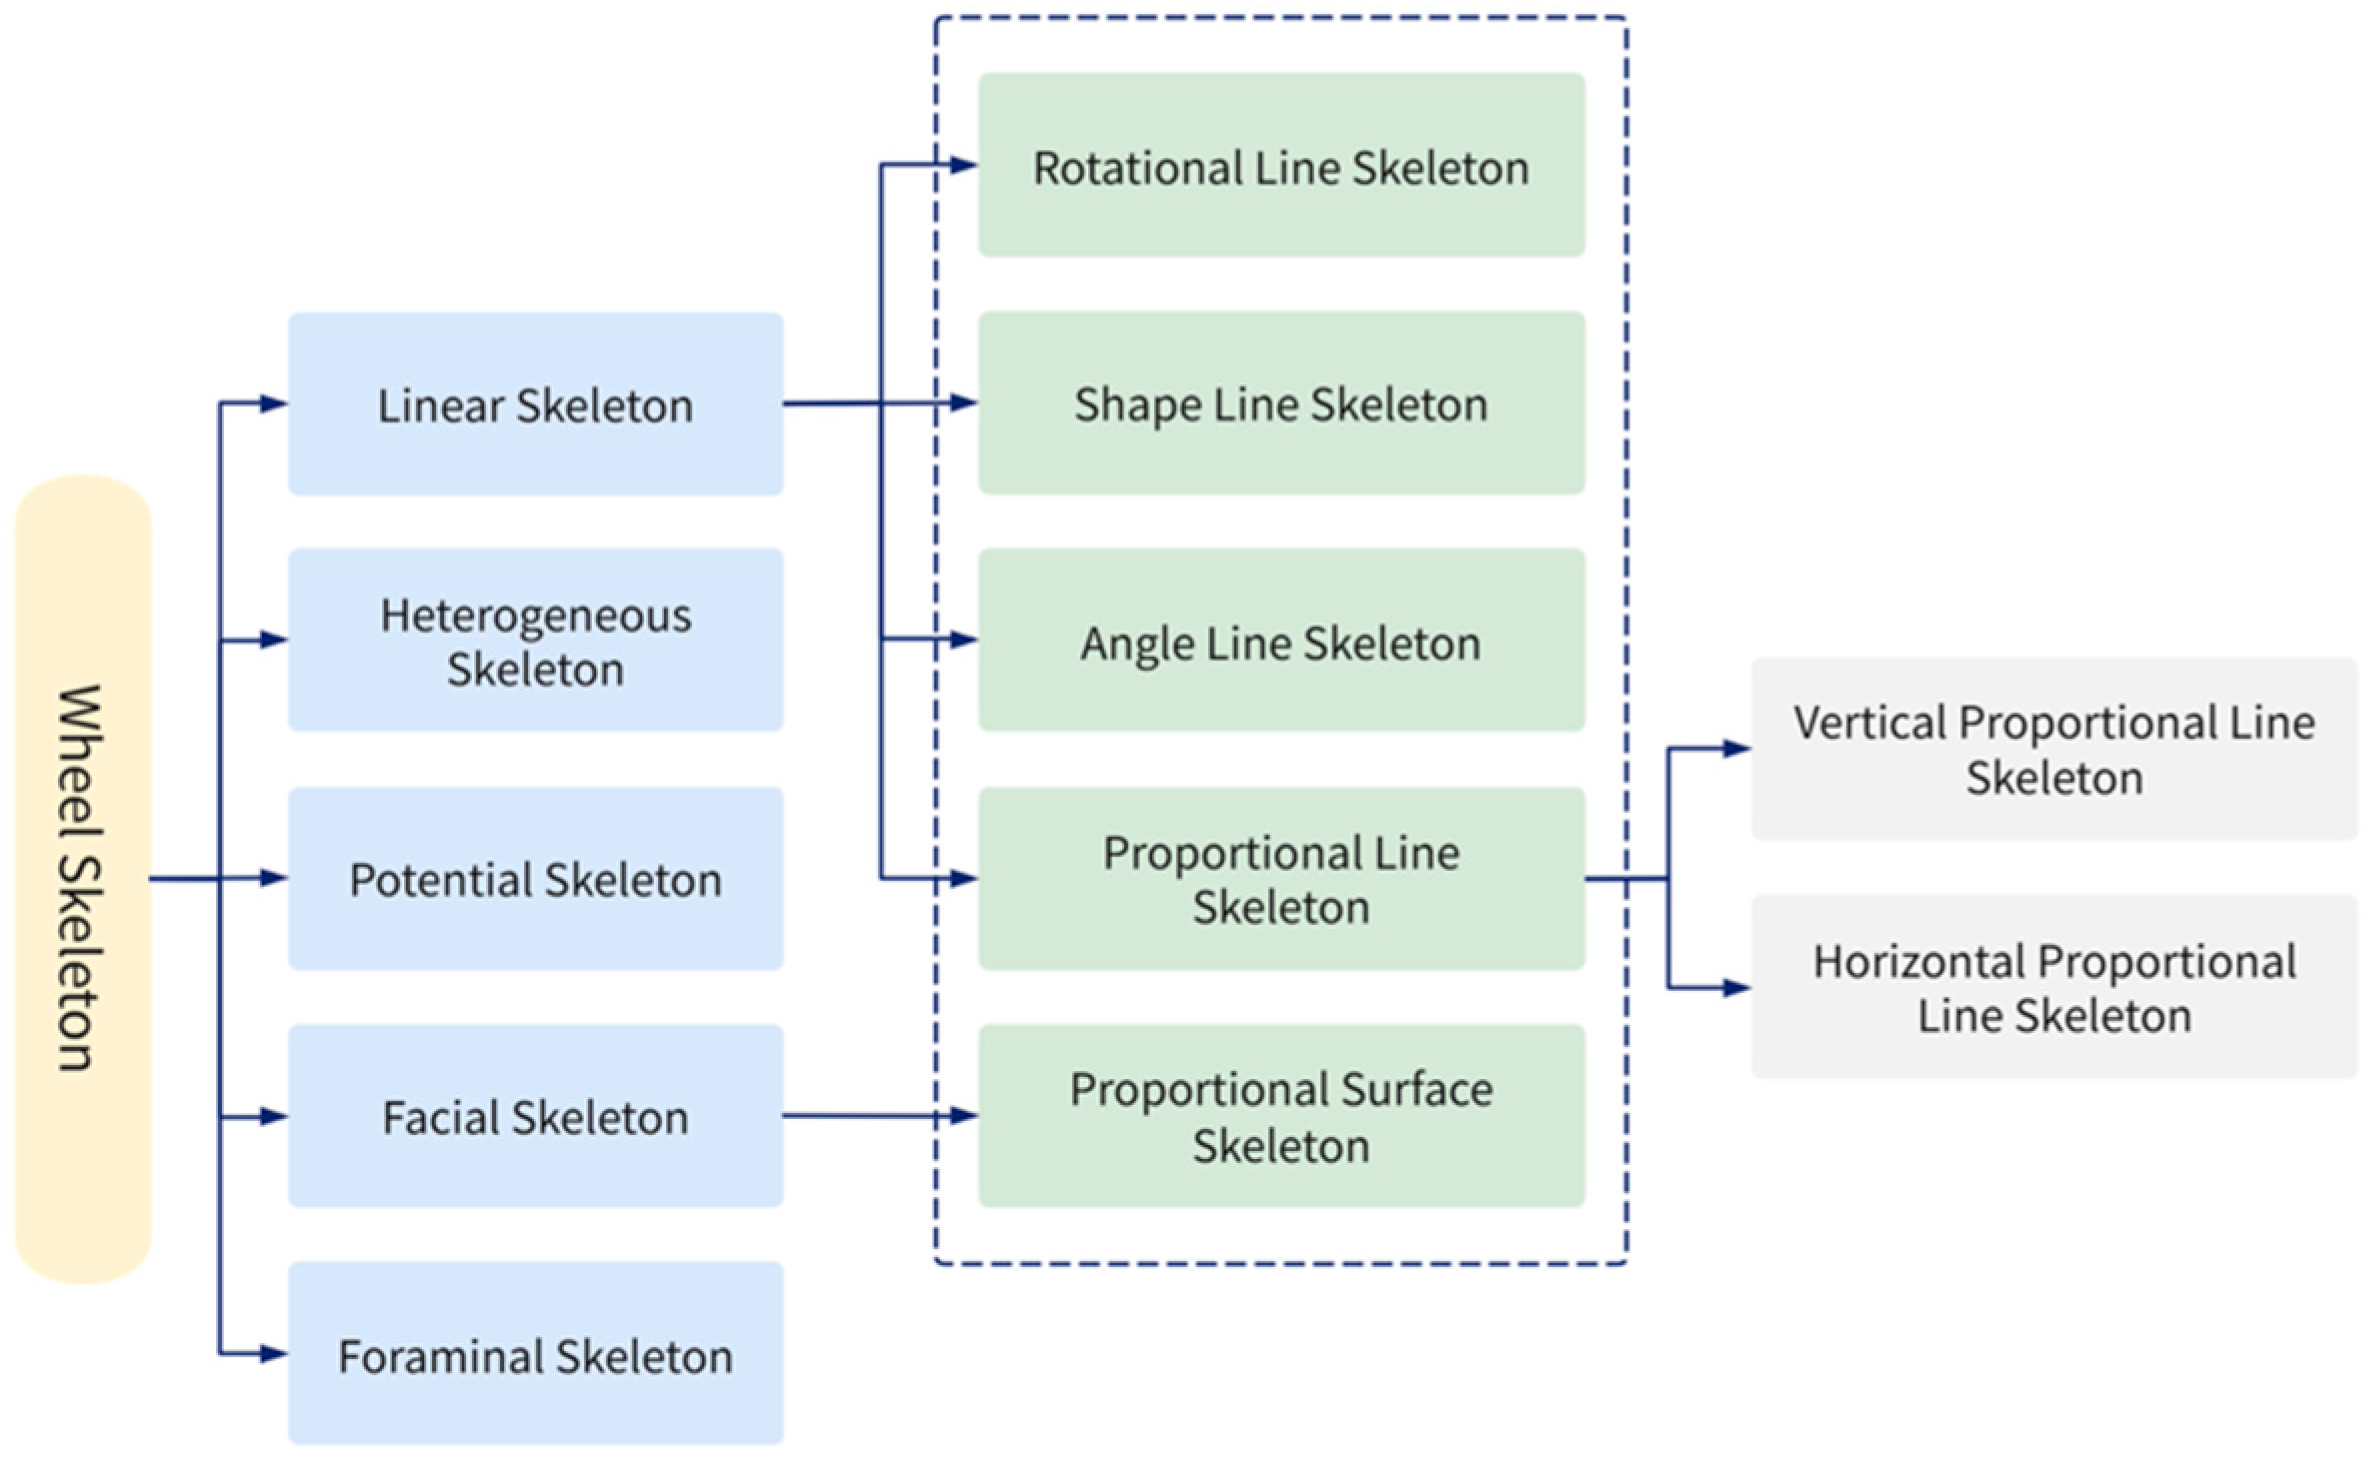
2.3.1. Definition and Types of Structural Skeletons

The term “structural skeleton” refers to the underlying skeletal structure that supports and defines the shape of an object. In the context of wheel hub design, the skeleton dictates the arrangement and presentation of the components in three-dimensional space, ensuring a coherent and orderly configuration. Within a wheel hub’s morphology, the spokes, bolt holes, and center disc serve as its core structural elements, while the skeleton is assembled in a specific sequence to form the overall shape of the hub. It is important to note that a single wheel hub design can consist of various types and quantities of skeletons.
To categorize the wheel hub skeleton systematically, we can identify five primary types of structural skeletons, each defined by specific characteristics:
  • Linear skeleton: This represents the basic structural characteristics of the spokes, including the form line skeleton (geometric layout of the spokes), angle line skeleton (angular positioning), proportional line skeleton (spoke proportions, further divided into horizontal and vertical), and rotational line skeleton (rotation dynamics of the spokes);
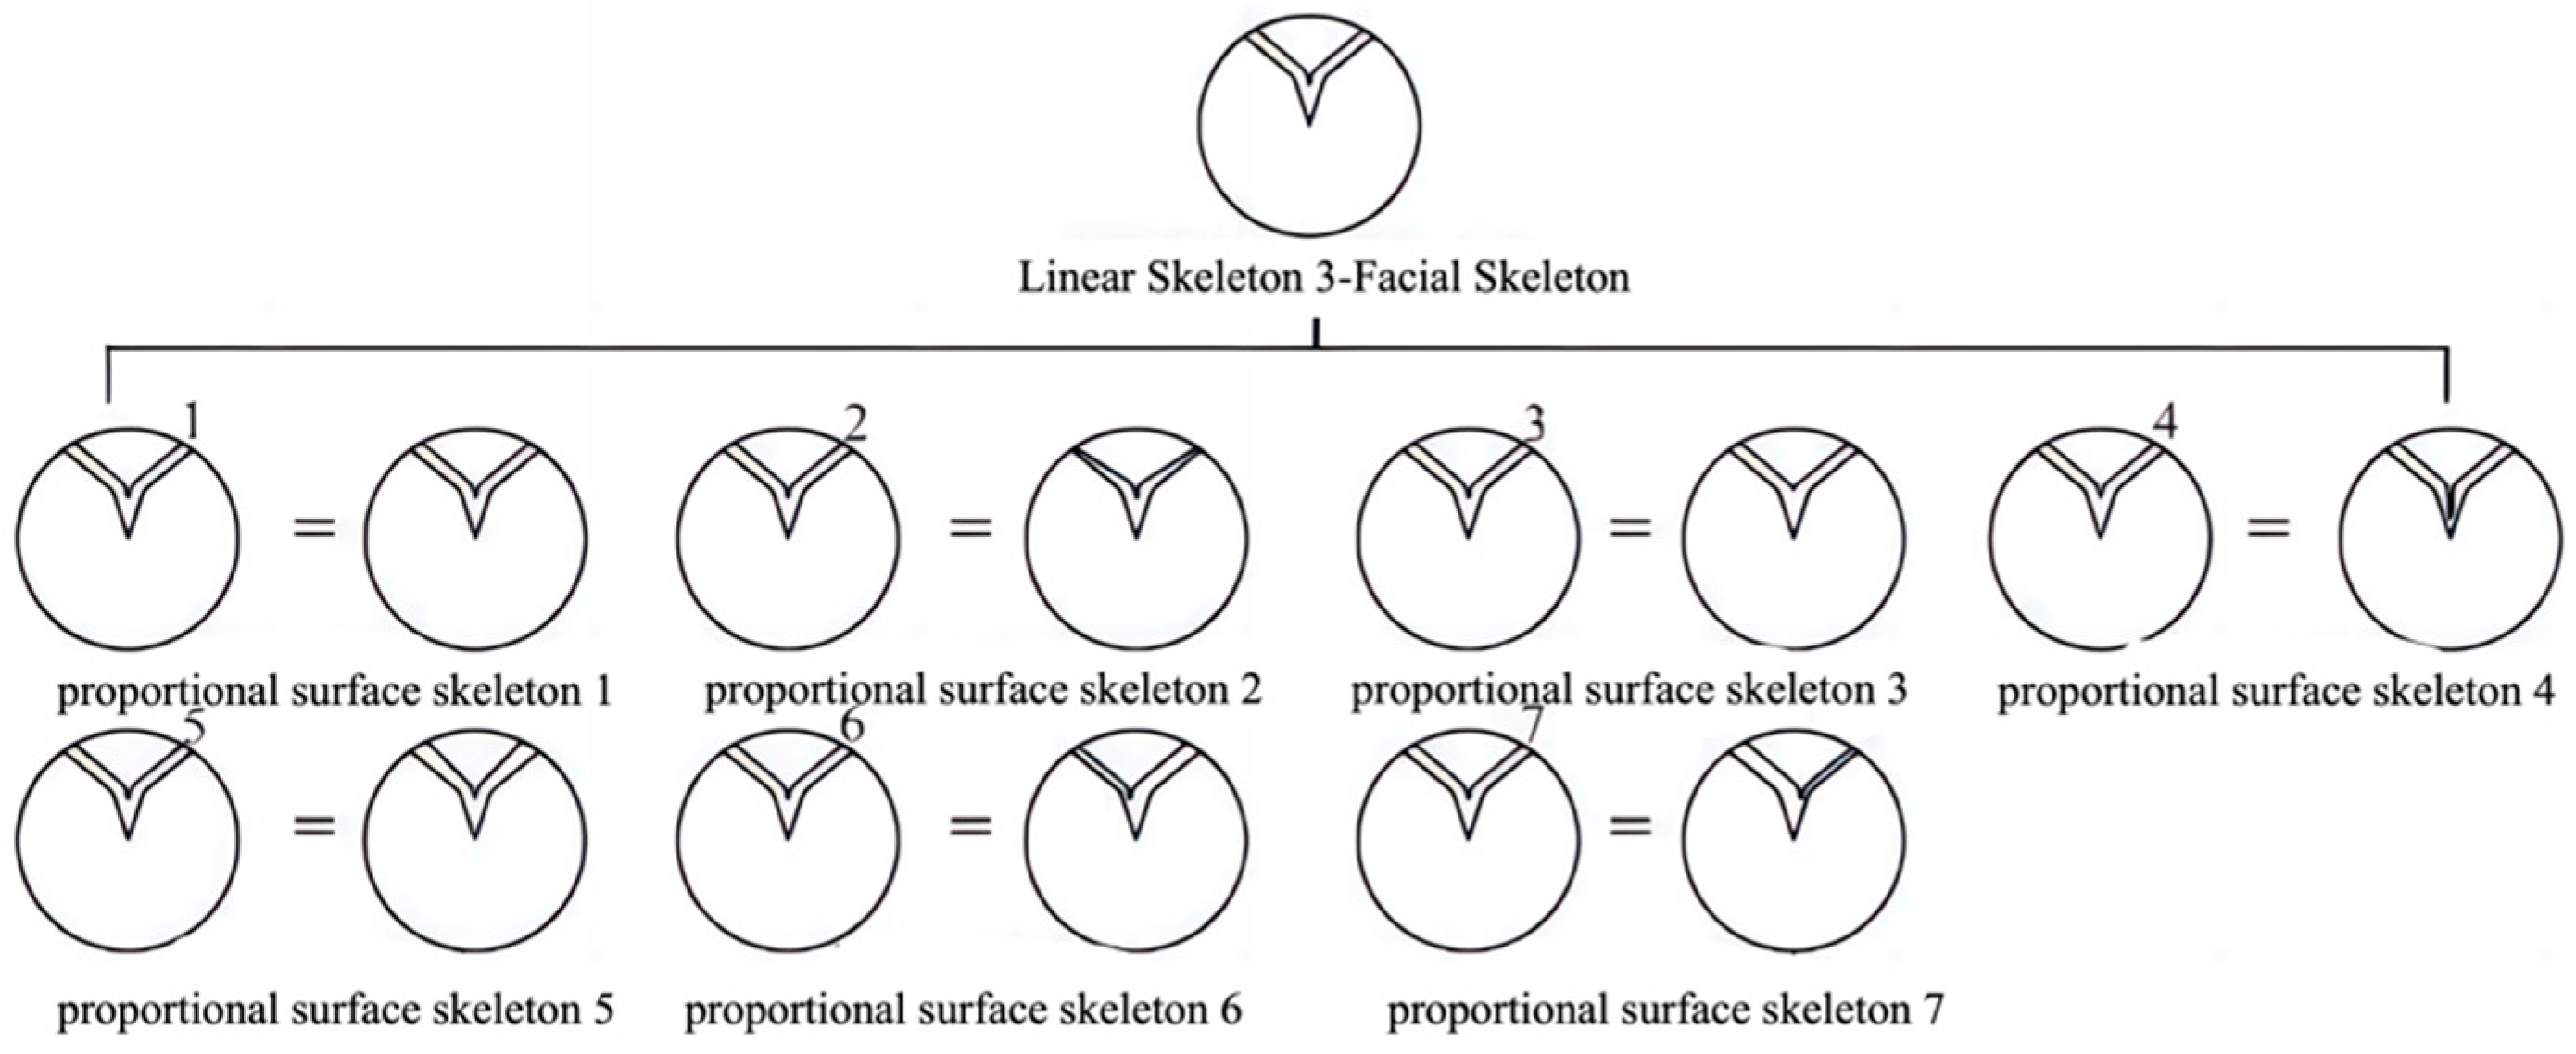
  • Facial skeleton: This refers to the area-based features of the hub’s design, which includes the proportional facial skeleton;
  • Foraminal skeleton: This denotes the skeletal features related to the bolt holes and central disc face in the hub’s structure;
  • Potential skeleton: This represents the curve characteristics of the spokes when viewed from the side;
  • Heterogeneous skeleton: This describes the skeletal features that correspond to local, detailed characteristics of the hub.
As shown in Figure 5, these five primary categories of skeletons and their respective subtypes are illustrated to depict the hierarchical relationships and interconnections between various components. The specific skeleton configurations and the number of structural symbols within each category may vary depending on the wheel hub type and design.

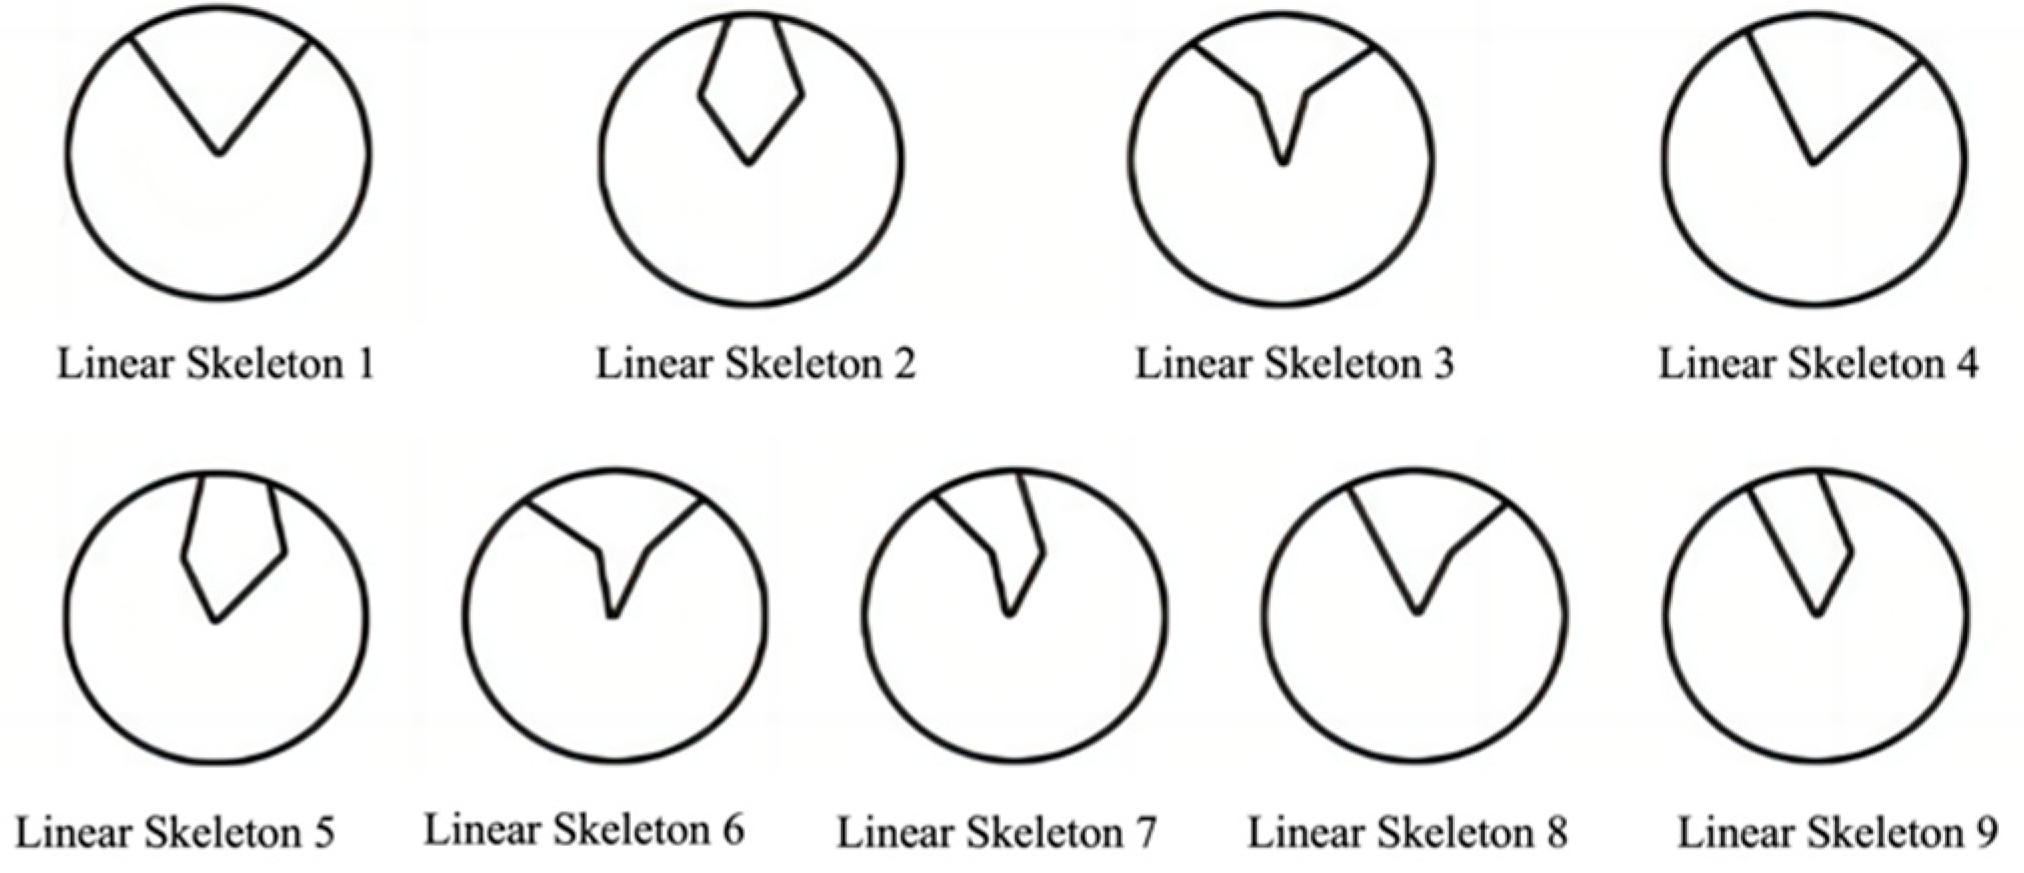
2.3.2. Linear Skeleton

The linear skeleton captures the fundamental morphological characteristics of the spokes. Different wheel hub designs feature varying linear skeletons. By analyzing a collection of existing wheel hub designs, we can categorize them into nine distinct types of basic linear skeletons, as shown in Figure 6. These skeletons share a common V-shaped structure, but their variations arise from differences in the rotational centers, which result in distinct spoke shapes (refer to the rotational line skeleton for further details).
Each linear skeletal structure corresponds to multiple shape skeletal lines and angular skeletal lines, which define the variations in the included angle of the V-shaped curve. Each type of linear skeletal structure or shape skeletal structure is associated with seven angular skeletal lines, representing seven different spoke angles within the same skeletal framework. Additionally, proportional skeletal lines are classified into horizontal proportional skeletal lines and vertical proportional skeletal lines, which regulate the contour lines by controlling horizontal and vertical transformations. The eight categorical variations of linear skeletal structures are detailed in Table 3:
  • Shape line skeleton: Through a comprehensive analysis of wheel hub images combined with shape theory, the nine types of linear skeletons can be subdivided into different shape line skeletons. Each linear skeleton corresponds to multiple shape variants. The shape line skeleton modifies the VDMC by adjusting the slopes of the control points’ connecting lines, resulting in variations in the shape. The shape line skeleton is classified into six or nine types, depending on the symmetry of the linear skeleton. Asymmetrical skeletons (such as linear skeletons five, six, and seven) introduce complex variations, leading to more diverse results.
  • Angular line skeleton: The angular line skeleton expresses the variation in the angle formed by the VDMC. By adjusting the angle of the VDMC, the overall shape of the wheel hub undergoes morphological changes. Each linear skeleton or morphological line skeleton corresponds to seven angular line skeletons, representing different spoke angles within the same structural type.
  • Proportional line skeleton: The proportional line skeleton can be divided into vertical and horizontal types, with each guiding the movement of control points along the vertical or horizontal axes. This skeleton controls spoke profile variations through proportional adjustments. The vertical proportional skeleton is further categorized into seven or thirteen variations to represent the influence of vertical control point movements on the shape. In contrast, the horizontal proportional skeleton focuses on lateral control point adjustments, influencing the shape in the horizontal direction.
  • Rotational line skeleton: The rotational line skeleton is based on the wheel’s rotation center and its associated rotational features. By rotating the VDMC clockwise or counterclockwise, the hub’s morphology is altered. There are several rotational line skeletons that describe different types of rotational behavior, including clockwise, counterclockwise, and mirrored rotational transformations along the centerline. For example, in Figure 7, the rotational line skeleton corresponding to linear skeleton eight is shown, where the spoke’s morphology changes due to rotational adjustments.
The first rotational skeletal line represents rotation around a central point, occurring in both clockwise and counterclockwise directions. The second rotational skeletal line defines the rotation of the V-shaped curve at a specific included angle relative to the centerline, also in both clockwise and counterclockwise directions. The third rotational skeletal line characterizes the mirrored transformation of the V-shaped curve along the centerline. In the diagram, apart from the numerical value at the central point, which indicates the number of spokes, all other numbers exclusively correspond to a specific type of rotational skeletal line. For instance, “1” represents the first rotational skeletal line, while “2” denotes the second rotational skeletal line.
In the graphical representation of skeletal lines, including morphological skeletal lines, angular skeletal lines, vertical proportion skeletal lines, horizontal proportion skeletal lines, and rotational skeletal lines, the position of serial numbers corresponds to specific types of skeletal lines, while changes in these numbers indicate transformations in skeletal line morphology. By altering the position and values of the serial numbers, the skeletal lines and their shapes can be modified. Under the combined influence of multiple skeletal lines, these modifications ultimately affect the overall deformation of the V-shaped curve.
As illustrated in Figure 8, the serial numbers at different positions within the skeletal structure correspond to distinct functions:
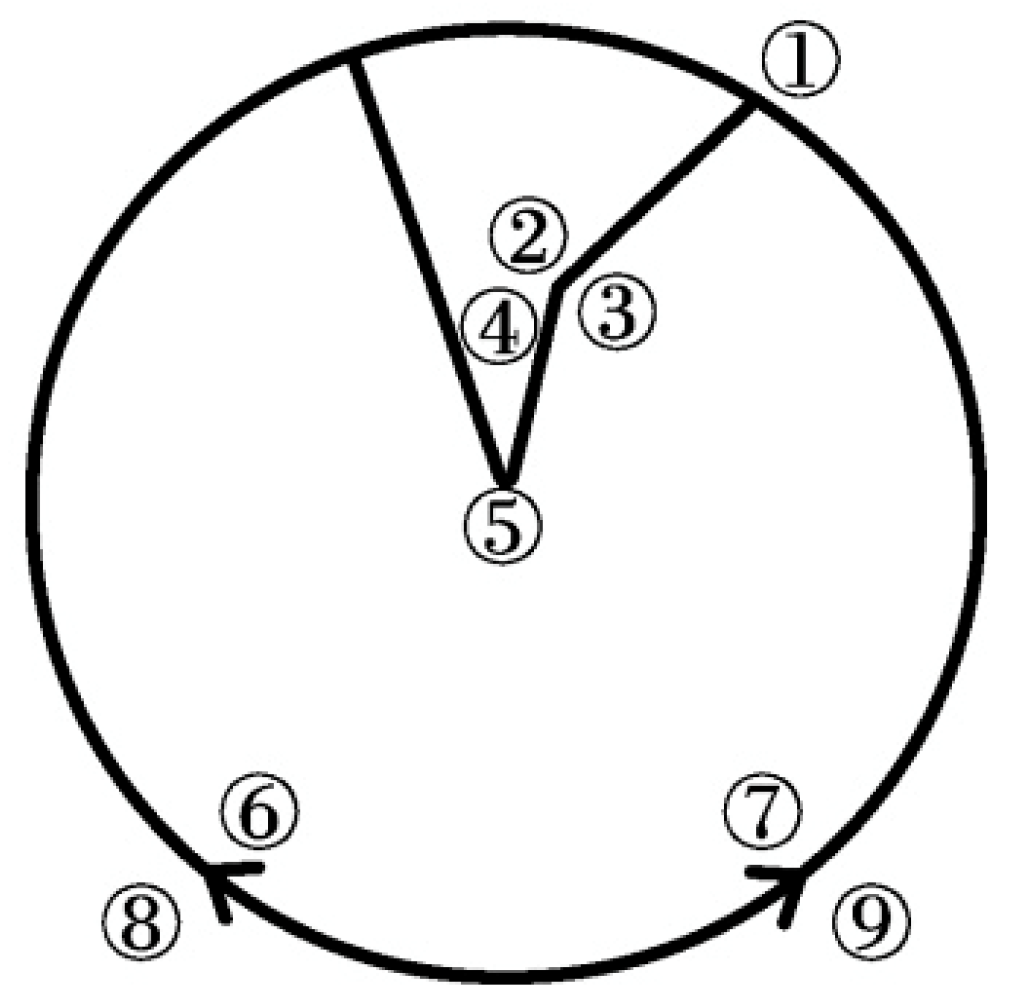
  • Serial Number 1 (morphological skeletal line): This controls the slope of the polyline segments. Different serial numbers correspond to different variations in polyline shape.
  • Serial Number 2 (vertical proportion skeletal line): This governs the vertical displacement of control points. Changes in the serial number directly influence the vertical positioning of these points.
  • Serial Number 3 (horizontal proportion skeletal line): This governs the horizontal displacement of control points. Variations in the serial number adjust the horizontal position of these points.
  • Serial Number 4 (angular skeletal line): This determines the included angle of the V-shaped curve. Different serial numbers correspond to different angle variations.
  • Serial Number 5 (number of spokes): This defines the number of spokes in the structure, with the minimum number being three spokes.
  • Serial Numbers 6 and 7 (first and second rotational skeletal lines): These represent the rotation centers of the spokes, determining their pivot points.
  • Serial Numbers 8 and 9 (third rotational skeletal line): These define the mirrored rotational direction of the V-shaped curve along the centerline. A left arrow (←) indicates a clockwise rotation, whereas a right arrow (→) signifies a counterclockwise rotation.
By adjusting the aforementioned serial number features, the V-shaped curve can achieve coordinated transformations in shape, angle, proportion, and rotational direction. The combination of 1 (slope control) with 2 and 3 (control point displacement) allows for modifications to the V-shaped contour, creating either a sharp or smooth appearance. Meanwhile, 4 (angle variation) in conjunction with 6 and 7 (rotation centers) refines both the mechanical performance and visual style of the spokes. Proportion can be controlled by utilizing 2 and 3 (control point displacement) alongside 5 (number of spokes) to achieve precise vertical and horizontal scaling. Additionally, adjusting 8 and 9 (aperture orientation) together with the directional arrows that indicate rotation ensures an optimized spatial distribution and dynamic balance of the spokes. This integrated approach facilitates systematic modifications to the V-shaped curve, allowing for structural adaptability and aesthetic coherence through coordinated skeletal adjustments.

2.3.3. Facial Skeleton

The facial skeleton refers to the surface features of the spokes. Each linear skeleton can be associated with several facial skeletons, which do not change with the linear skeleton variations but only reflect changes in the spoke’s area. These skeletons focus on defining the width and area of the spokes. The planar skeletons are further categorized into six degrees to represent common spoke area variations. Figure 9 provides a graphical representation of the planar skeleton.
The proportional surface skeleton is concerned with the changes in the proportional distribution of spoke areas, which result in morphological variations. This skeleton is classified into five or seven types, each corresponding to different area proportion modifications, such as uniform width, narrowing, widening, and asymmetrical variations. Figure 10 illustrates the symbolic and graphical expressions for the proportional surface skeleton.
In Figure 11, m represents the characteristic of the spoke area in terms of width variation, with a value of 6 degrees, indicating six common spoke area sizes. n denotes the area characteristic along the radial direction of a single spoke, with a value of either 5 or 7, representing multiple proportional area variations within the same planar skeleton. The parameter t refers to the number of solutions obtained from the superposition operation between the planar skeleton and the proportional skeletal surface. As the sequence number varies, the area of the planar skeleton and the proportional characteristics of the spokes change accordingly.

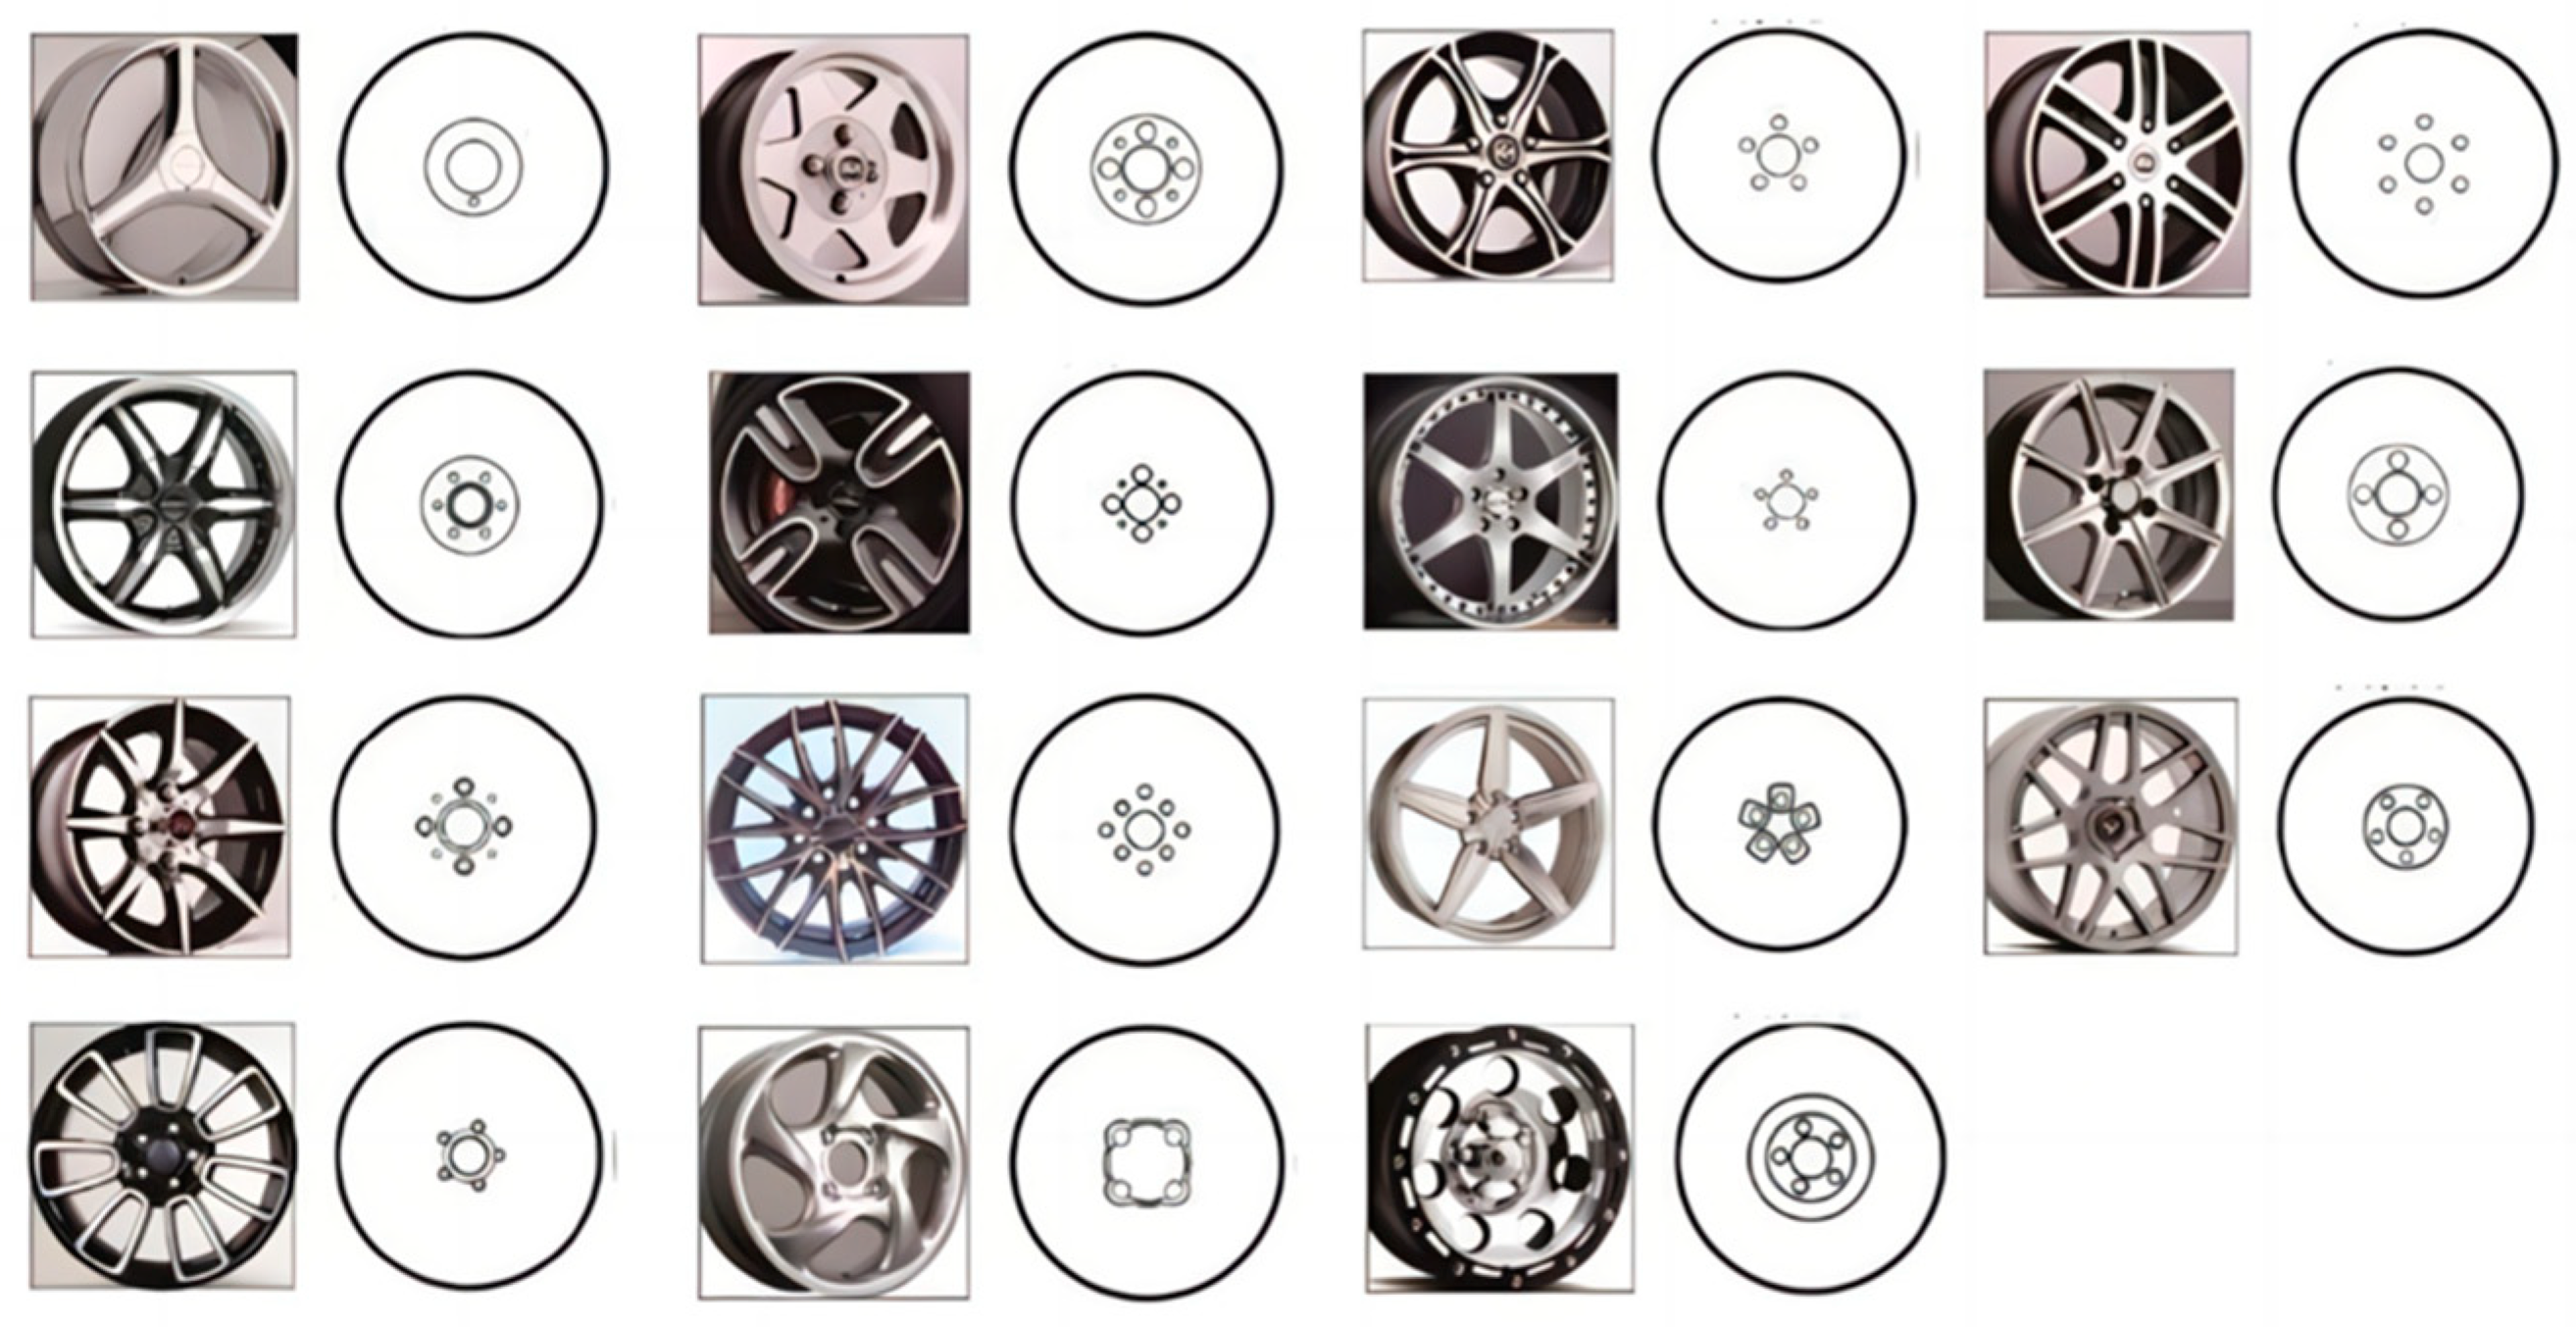
2.3.4. Foraminal Skeleton

The foraminal skeleton extracts and defines the shape, position, and size of the screw holes and center disc features in the wheel hub. While most bolt holes are typically arranged in standard configurations (e.g., five or four bolts), there will be variations in the hole skeleton depending on the brand and type of wheel hub. Figure 12 shows examples of foraminal skeletons that vary depending on wheel design.

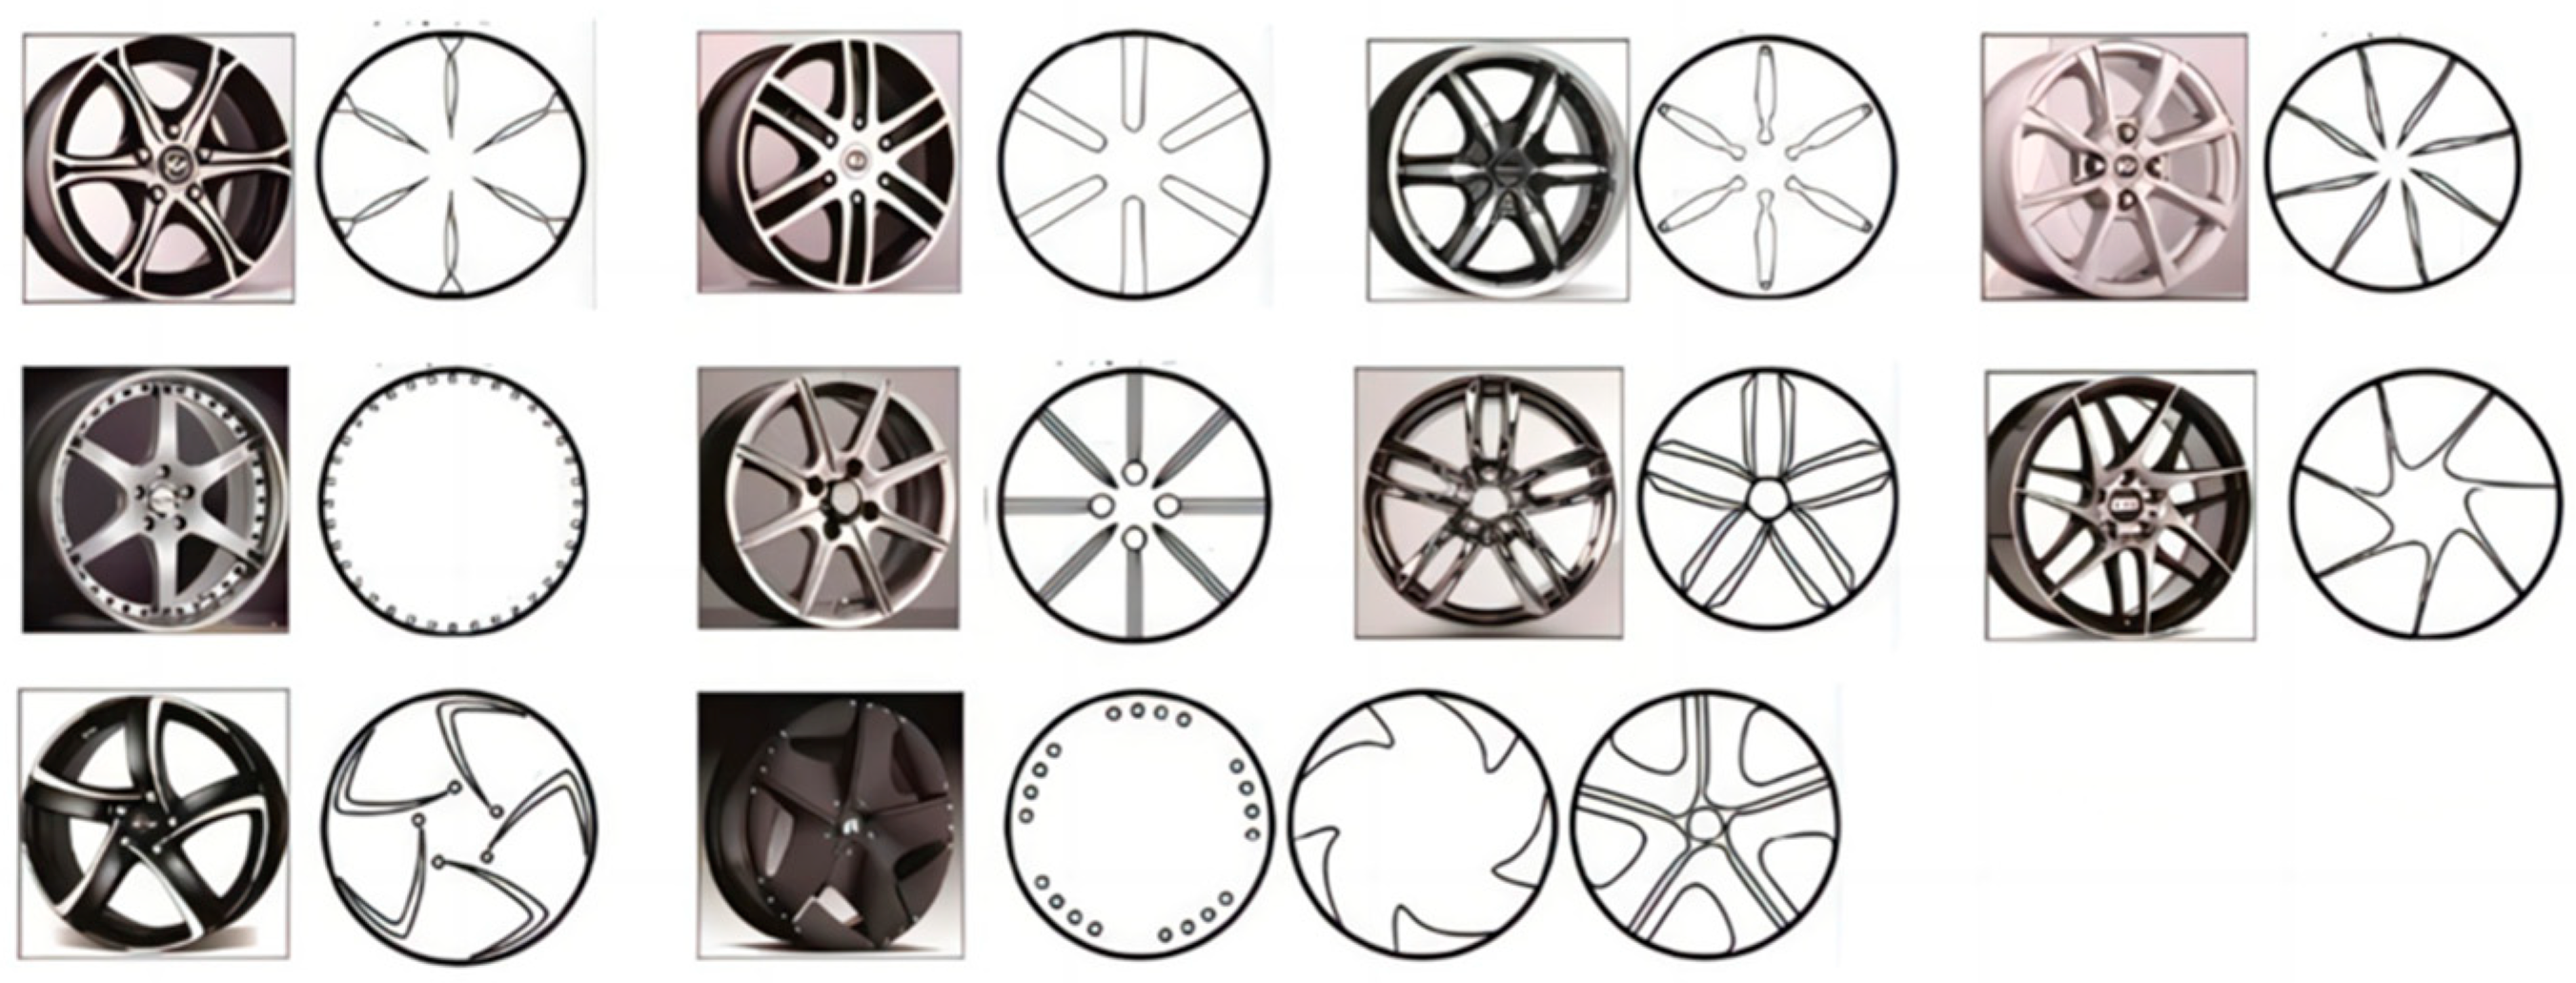
2.3.5. Potential Skeleton

The potential skeleton represents the side profile of the wheel hub, capturing its curvature and form. It is divided into three primary types: flat, concave, and convex. Concave shapes are often more aesthetically appealing and structurally efficient than flat profiles. The concave shape can further be classified into linear, arc, and curve forms, whereas the convex shape is usually represented by arcs and less frequently by straight lines. Figure 13 illustrates these types.

2.3.6. Heterogeneous Skeleton

The heterogeneous skeleton focuses on capturing the specific, localized details of the wheel hub, including the unique profiles and shapes of the spokes and other components. The complexity and number of heterogeneous skeletons vary depending on the design and type of wheel hub. These skeletons add unique characteristics to the hub’s overall appearance. Figure 14 showcases several examples of heterogeneous skeletons for different wheel hubs.

2.4. Wheel Skeleton Calculation Algorithm Based on VDMC

2.4.1. Skeleton Computation

Skeletons are interrelated through various connections, and the nature of these relationships determines the transitions and transformations between skeletons, as well as the corresponding changes in three-dimensional forms. The process of establishing these interrelationships and the corresponding rules is known as skeleton computation. If different types of skeletons are considered as distinct sets, skeleton computation can be described as the process of defining the mapping relationships between these sets. It serves as both the foundation and prerequisite for skeleton transformations and is a key component of the VDMC-based morphological design approach.
Skeleton computation is categorized into three primary operations: progressive computation, superposition computation, and combination computation. Each type of computation follows distinct operational rules that are designed to achieve different transformation outcomes.

2.4.2. VDMC-Based Progressive Computation and Operational Rules

The progressive computation of skeletal structures describes the transition and selection relationships between various skeletal configurations. This computation includes linear skeletal structures, angular skeletal structures, and proportional skeletal structures, facilitating transformations among them. Although the computation process may involve multiple intermediate skeletal structures, it ensures uniqueness in the final output by selecting the last skeletal configuration in the sequence as the result. The recursive transition formula for skeletal structures can be expressed as follows:
Skeleton Ai > Skeleton An = Skeleton An
where Skeleton Ai represents the initial skeletal configuration and Skeleton An represents the final skeletal configuration in the progression. By induction, the relationship can be generalized as
Skeleton Ai > Skeleton Ai+1 >⋯> Skeleton Ai+n = Skeleton Ai+n
These equations ensure that the progressive computation method is consistent and reliable, uniquely determining the final skeletal configuration as the output. As shown in Figure 15, the diagram illustrates the progressive computation process of skeletal structures.
Figure 15 illustrates the progression of skeletal structures through various stages of transformation. The diagram visually demonstrates how each skeletal configuration evolves step by step, with each stage building on the previous one. It serves as a clear representation of the gradual transition from one skeletal form to another, ultimately resulting in a finalized, optimized structure.
The diagram emphasizes that through each transition, the skeletal form is refined and optimized, adhering to principles similar to those found in engineering and design. This ensures that the final skeletal configuration is the most efficient and effective representation of the system, encapsulating all improvements from previous stages. The final skeletal structure, therefore, contains all the critical features developed throughout the progression process, making it the optimal and most advanced version.

2.4.3. VDMC-Based Superposition Computation and Operational Rules

VDMC-based superposition computation involves the merging of different types of skeletal structures—namely, linear, facial, foraminal-shaped, and heterogeneous skeletons—to form a merged skeleton set. The result of this operation depends on the combination rules and the degree of variation introduced in the merging process. The number of merged solutions typically ranges from 3 to 5, influenced by the magnitude of the adjustments made to each skeleton during the superposition.
The superposition computation works by incrementally combining different skeletal types, each with specific characteristics, resulting in new forms. When facial skeletons are superimposed with others, they can generate multiple configurations. The interaction between facial skeletons and other types (such as foraminal or linear) introduces multiple possible solutions (typically between 3 to 5). The exact number depends on how much angular, proportional, and curvature variation is introduced during the merging. When two or more different types of skeletons (e.g., facial + linear, facial + foraminal) are merged, the result can vary depending on how the skeletons interact. The merging process creates a new merged structure with distinct features derived from each of the original skeletons.
For the superposition of two types of skeletal structures, the formula is as follows:
Skeleton Ai + Skeleton Bi = Merged Skeleton Ci
The process and results of two-type skeletal structure superposition are illustrated in Figure 16.
For the superposition of three types of skeletal structures, the formula is given as
Skeleton Ai + Skeleton Bi + Skeleton Ci = Merged Skeleton Di
The process of three-type skeletal structure superposition is shown in Figure 17.
For the superposition of four types of skeletal structures, the formula is expressed as
Skeleton Ai + Skeleton Bi + Skeleton Ci + Skeleton Di = Merged Skeleton Ei
The process is shown in Figure 18.
Three solutions arise when there are smaller variations in rotational angles, proportional relationships, or joint alignments. These smaller changes limit the number of possible configurations and lead to only 3 distinct solutions.
Five solutions occur when there are larger variations in the degrees of freedom—such as wider rotational adjustments, larger changes in proportions, or more complex interactions between skeletons. These changes enable the system to explore 5 possible configurations.
The superposition of skeletons can lead to 3 to 5 distinct merged solutions depending on the complexity of the interaction between the skeleton types involved. Facial skeletons result in a unique solution when merged with similar types, but when they are combined with heterogeneous types, the solution space increases. The process from one solution to another involves gradual changes in proportions, angles, and structural adjustments. These transitions ensure a logical and smooth progression from one skeletal form to another. The intermediate skeletal forms represent the gradual changes between the initial and final configurations. These forms are not random but are determined by structural optimization and alignment adjustments.
Three solutions are obtained when the variations applied to the skeletal merging process are small, meaning minor changes in angles (e.g., 10°), proportions (e.g., 5%), or curvatures (e.g., 2–5°). These smaller variations result in a few distinct, valid outcomes. Five solutions arise when the variations are larger, allowing for broader adjustments in angles (e.g., 30°), proportions (e.g., 10%), and curvatures. These larger changes generate a wider range of distinct merged skeletons, producing more possible configurations while remaining within engineering and aesthetic limits. Exceeding five solutions or resulting in fewer generating fewer than three would either overcomplicate the design (leading to impractical configurations) or fail to provide enough functional and aesthetic diversity.

2.4.4. VDMC-Based Combination Computation and Operational Rules

Combination computation refers to the process where skeletons from the four main categories undergo two types of operations. The outcome of this operation is referred to as the combined skeleton. As shown in Figure 19, the combination computation for a five-spoke wheel hub begins with the progressive computation of linear skeletons, where a linear skeleton progresses to an angular linear skeleton. After the progression concludes, the next step is superposition between planar skeletons and proportional planar skeletons. If multiple solutions emerge during this step, the target solution must be selected, which is denoted by the symbol “▲”. Once the target solution is identified, the four categories of skeletons—linear, planar, heterogeneous, and foraminal-shaped skeletons—are sequentially superimposed to obtain the final result: the combined skeleton.
This section establishes a comprehensive theoretical foundation for the VDMC methodology in wheel hub design. It begins by detailing the extraction and classification of skeletal structures. These classifications are illustrated through visual representations and sequential characteristic diagrams, systematically summarizing the composition of wheel hub skeletons. The section further introduces progressive computation, superposition, and combination operations, highlighting their role in enabling innovative skeletal transformations and interactions across different categories. These mathematical operations and dynamic control parameters allow the VDMC method to overcome traditional design limitations, enabling the creation of diverse, brand-consistent designs that meet specific market needs while maintaining aesthetic and functional principles.

3. The Practice of Deriving Hub Wheel Shapes Based on VDMC

The Grasshopper plugin, based on the Rhino platform, serves as a crucial tool for dynamic derivative design, enabling variable adjustments through a series of component modules to generate diverse product forms. This study focuses on the renowned Breyton wheel hub brand, extracting and analyzing the skeleton lines in its wheel hub designs. Utilizing the VDMC approach, a design derivation analysis is conducted to explore the transformation patterns of the wheel hub shape. Subsequently, by manipulating the VDMC control points within the Grasshopper plugin, it becomes possible to rapidly generate multiple wheel hub designs that maintain consistent brand characteristics.
The analysis of the Breyton brand wheel hub morphology aims to summarize the key features of its design. Initially, the Breyton brand’s official website was accessed to collect images of all available wheel hubs. The front-view images of the wheels were selected as the primary perspective for identifying the brand’s morphological features. These images were then processed using Photoshop software. The cropping tool and pen tool were employed to standardize the size of the images and refine the contour lines of the wheel edges. Backgrounds, shadows, and other distractions were removed, resulting in clean images with a uniform background. Figure 20 illustrates the processed wheel hub images of the 14 models from the Breyton collection.
Figure 21 presents the extraction and organization of the structural lines for the front face of the Breyton wheel hub.
From Figure 21, it is clear that by drawing the V-shaped feature lines and analyzing the proportional area characteristics of the V-shapes, we can identify several consistent design elements across the Breyton wheel hubs. All 14 wheels feature basic V-shaped curves, with varying degrees of symmetry. These are categorized into axis-symmetric and non-axis-symmetric types, with the “Topas” series featuring a non-axis-symmetric V-shape, while the remaining 13 models follow an axis-symmetric pattern. Regarding the V-shaped area characteristics, the spokes generally exhibit a “slim-to-thick” or “thick-to-slim” progression. These distinctive features constitute the unique morphological DNA of the Breyton brand, shared across all models.
The information presented in Figure 21 also reveals that the 14 wheel hubs can be grouped into five distinct series. The “GTSR-PF,” “Race GTP,” “Race GTS,” “Race GTS2,” and “Race GTSR” models belong to the same series. These wheels share similar V-shaped line characteristics, with comparable angles and area proportions, following the “slim-to-thick” progression and featuring seven spokes. The “Race LS” and “Race LS2” models form another series, both featuring 10 spokes, though their V-shaped area progression differs. In the “Race LS” model, the V-shape has equal upper and lower widths, while the “Race LS2” follows a “thick-to-slim” progression. The “Spirit II,” “Spirit II 23,” “Spirit R,” and “Spirit RS” models also belong to the same series, with similar V-shape angles and proportions, exhibiting a “slim-to-thick” progression and 10 spokes. The “Fascinate,” “Topas,” and “Magic CW” models stand as individual series, with each displaying distinct characteristics. Notably, the “Fascinate” model features a five-spoke design, the “Topas” has a non-symmetric basic V-shape, and the “Magic CW” model’s V-shape is more subtly integrated compared to the other 13. The “Magic CW” model is also distinguished by its 15 spokes.
Within the Breyton brand, the “Race GTS” and “Race GTS2” wheels are two variations of the same series, both characterized by a symmetric V-shaped curve, a “slim-to-thick” spoke area progression, and seven spokes. Taking the “Race GTS” model as an example, its design elements correspond to linear skeletons, angular line skeletons, facial skeletons, facial proportional skeletons, as well as unique foraminal and heterogeneous skeletons extracted from the Race GTS series. By combining these four types of skeletons through computational operations, the Race GTS wheel hub design is achieved, as illustrated in Figure 22.
The application of the VDMC theory to wheel hub design enables efficient and rapid derivation of new wheel shapes that retain the core brand characteristics. By adjusting the V-shaped curve features and making localized modifications, different wheel forms with identical brand features can be rapidly designed. Figure 23 demonstrates the derivation process and outcomes for the “Fascinate” series within the Breyton brand.
The geometric decomposition and synthesis of the Breyton Fascinate 2 wheel hub follow a structured process involving four substructures. The first image in the first row presents a five-spoke wheel hub with spokes arranged in a clockwise direction, where the spoke openings are determined by the fifth type of angular skeletal framework. The second image in the first row illustrates a combination of the second type of surface skeletal framework and the third type of proportional skeletal framework, collectively yielding three distinct solutions. Subsequent images depict the step-by-step disassembly and recombination of these four substructures, demonstrating how the wheel hub's final design emerges through a systematic assembly of individual geometric components. Throughout this process, the transformation and arrangement of skeletal frameworks, including angular control, proportional adjustments, and rotational symmetry, play a crucial role in shaping the overall structural and aesthetic characteristics of the final design.
The “Fascinate2” wheel is a derived design based on the original “Fascinate” model. While retaining the core features, the angle of the V-shaped curve was slightly adjusted, and the V-shaped area progression was changed from “slim-to-thick” to “thick-to-slim.” Additionally, the heterogeneous skeleton from the original “Fascinate” model was preserved, with its area progression adjusted from “thick-to-slim” vertically. The “Fascinate2” model, however, alters the heterogeneous skeleton area to be uniformly proportioned while maintaining the original foraminal skeleton.
By combining the computational results from the Breyton wheel hub brand, parametric modeling is constructed using the Grasshopper plugin. The software’s lattice graphic function is employed to ensure the VDMC’s editability. Additionally, modifications in the hub thickness and side curvature are achieved through methods such as vertex offsetting, duplication, and multilevel fractals. Figure 24 illustrates ten lattice graphics of the wheel hubs and their corresponding models.
Furthermore, by adjusting the angle, slope, and control point movements of the VDMC, derivative design solutions for the GTS model wheel hubs are rapidly generated. Table 4 presents a selection of design schemes generated through parameter adjustments.

4. Evaluation and Analysis of VDMC in Wheel Design

Building upon the initial understanding of the V-shaped Dynamic Morphology Curve (VDMC) and its theoretical foundations, this chapter shifts focus to an empirical investigation. Specifically, it aims to assess the application of VDMC in real-world automotive wheel design, focusing on design efficiency, quality, and sustainability outcomes. This empirical study investigates the impact of VDMC on design time, design consistency, and resource optimization, which are critical for sustainability in the automotive industry. This study seeks to validate VDMC’s theoretical benefits and its role in fostering sustainable design practices while maintaining brand identity across various design variants.

4.1. Participants Selection and Experimental Design

A total of 24 designers participated in this empirical study, divided equally into two groups: the experimental group (n = 12) and the control group (n = 12). All participants had a minimum of 3 years of professional experience in automotive design. The designers from both groups were tasked with developing multiple wheel designs for a given brand, ensuring that the final designs adhered to the specified brand identity characteristics.
To ensure that the two groups were comparable in terms of skill level and experience, a pre-experiment proficiency test was conducted. Participants were required to complete a standardized design task using both Rhino 7.0 with Grasshopper and AutoCAD 2023. Their performance was evaluated based on task completion time and design quality. The results of the proficiency test confirmed that there were no significant differences in software proficiency between the two groups (t = 0.45, p = 0.66). Additionally, the groups were matched in terms of professional background (e.g., mechanical engineering vs. industrial design) and years of experience to minimize potential confounding factors.
The following provides an overview of the experimental group and the control group:
  • Experimental group: Participants used the VDMC-based design approach, which was integrated into Rhinoceros 7.0 with the Grasshopper plugin. This parametric modeling tool allowed designers to generate multiple wheel design variants through parametric adjustments. Key parameters such as curvature, symmetry, and facial detailing were manipulated, enabling rapid iteration while ensuring brand consistency.
  • Control group: Participants in the control group employed traditional CAD-based design methods, using AutoCAD 2023 and Rhinoceros 7.0. Designers manually created wheel variants by adjusting parameters through these CAD modeling platforms, requiring several iterations to refine the designs and maintain adherence to the brand’s visual identity standards.

4.2. Experimental Procedure

The experiment proceeded in four key phases: Task Assignment, Design Process Execution, Data Collection, and Data Analysis.
Participants were tasked with designing five wheel variants for a premium automotive brand, with the constraint of ensuring all designs remained consistent with the brand’s core visual identity. The experimental group used VDMC software to generate parametric variations, while the control group employed traditional CAD tools.
Designers in the experimental group applied VDMC to iteratively explore design variations. VDMC tools allowed them to adjust key parameters like curvature, symmetry, and facial detailing, generating five design proposals. Each design was evaluated for brand alignment and visual appeal.
Designers in the control group followed a traditional approach, manually creating different design variants through trial and error. They had to manually tweak the design to achieve brand consistency, which often led to multiple iterations.
After completing the design tasks, data were collected on the following parameters:
  • Design time: This encompassed total time spent on the creation of all five wheel variants. To ensure the accuracy of design time measurement, screen-monitoring software (ManicTime) was used to track the active working time of each participant. The timer started when the designer opened the design file and stopped when the final design was saved. Non-active periods, such as breaks or software loading times, were automatically excluded from the recorded time. This approach ensured that the recorded design time reflected only the actual time spent on the task.
  • Brand consistency: This evaluated how closely each design adhered to the brand’s visual identity, rated by a panel of experts. To evaluate brand consistency, a detailed scoring rubric was developed based on the brand’s core design guidelines, including the following key design indicators weighted according to their significance. Symmetry was assigned the highest weight at 20%, followed by the V-shaped curve angle range (±5°) and the spoke area gradient pattern (e.g., “thin-to-thick” or “thick-to-thin”), each contributing 15%. The central hole and bolt hole arrangement accounted for 10%, as did the heterogeneous skeleton features. The remaining 30% was allocated to other local details, such as edge chamfering and surface texture, which play a crucial role in overall design refinement. Each indicator was assessed on a 0–1 scale, with the total score calculated as a weighted sum and converted to a 10-point scale to ensure a standardized evaluation of design consistency.
  • Resource utilization: This was measured by tracking design process efficiency (e.g., the number of iterations or design modifications) and the computational resources consumed during the design process (e.g., time spent on design software or hardware usage).
  • Design modification: This was measured by the number of design iterations made by each designer.
The collected data were subjected to statistical analysis (e.g., paired t-tests) to assess the differences between the experimental and control groups in terms of design efficiency, consistency, and sustainability outcomes.

4.3. Experimental Results and Analysis

This empirical study aimed to evaluate the effectiveness of the VDMC method in improving design efficiency, ensuring brand consistency, and optimizing sustainability outcomes. Below is a detailed analysis of the results based on the data collected from both the experimental and control groups.

4.3.1. Design Efficiency

  • Experimental group: On average, the experimental group completed the five-wheel design task in 18.3 h.
  • Control group: The control group took an average of 26.7 h to complete the same task.
The experimental group demonstrated a significant improvement in design efficiency, completing the task in 8.4 h less than the control group, equating to a 31.5% reduction in time. The standard deviation of the completion time was ±1.2 h for the experimental group and ±2.1 h for the control group, indicating a more consistent performance in the experimental group. An independent samples t-test confirmed that the difference in design time between the two groups was statistically significant (t = 4.83, df = 22, p < 0.001). To further validate the results, an analysis of covariance (ANCOVA) was conducted, controlling for the participants’ software proficiency scores from the pre-experiment test. The results showed that the VDMC method still significantly reduced design time (F = 18.7, p < 0.001) independent of individual differences in software proficiency.

4.3.2. Brand Consistency

Three independent experts, including the brand’s chief designer, a professor of automotive engineering, and a certified industrial design expert, were invited to evaluate the designs. The experts conducted blind reviews, meaning they were unaware of which group (experimental or control) produced each design. The interrater reliability was assessed using Cohen’s Kappa coefficient, which indicated a high level of agreement among the experts (Kappa = 0.78, p < 0.01). The final brand consistency score for each design was the average of the three experts’ scores:
  • Experimental group: The designs generated by the experimental group were rated with an average brand consistency score of 9.1/10.
  • Control group: The control group’s designs were rated with an average score of 7.8/10.
The experimental group’s use of the VDMC method led to designs that were significantly more consistent with the brand identity, with a difference in average score of 1.3 points. The experimental group’s design adhered closely to the brand’s V-shaped curve symmetry and spoke area gradient, while the control group’s design exhibited deviations in spoke angle (exceeding the ±5° range) and area proportion, resulting in a lower consistency score. The statistical analysis confirmed that the difference in brand consistency scores between the two groups was significant (t = 3.67, df = 22, p < 0.001).
The statistical analysis confirmed that the observed difference in brand consistency between the two groups was significant (p < 0.05), further reinforcing the advantage of VDMC in maintaining design integrity across iterations.

4.3.3. Sustainability Outcomes

The impact of the VDMC method on sustainability was assessed by examining both resource utilization (number of design iterations) and the number of design modifications required during the design process:
  • Experimental group: The average number of design iterations per variant was 4.2 iterations. The average number of modifications required to finalize a design was 2.6 modifications per design.
  • Control group: The control group required an average of 7.9 iterations per variant. The control group required an average of 5.3 modifications per design.
A key metric for sustainability in design is minimizing unnecessary iterations, as these consume both time and computational resources. The experimental group’s use of VDMC reduced the average number of iterations by 3.7 iterations per design variant, or 53.2%. This reduction is indicative of a more efficient design process, where the parametric model in VDMC allows designers to converge on optimal solutions more quickly, without the need for extensive trial and error, as seen in traditional methods.
This finding suggests that VDMC contributes to sustainability by reducing the computational resources required to generate a design variant, as well as the time and energy spent by designers in iterative modifications. The difference in the number of iterations was statistically significant (p < 0.01), emphasizing the role of VDMC in improving both time efficiency and resource sustainability.
The experimental group also demonstrated a significant reduction in the number of design modifications needed to finalize the designs. On average, the experimental group required 2.7 fewer modifications per design, a 50.9% decrease. This finding further supports the idea that the VDMC method accelerates the design process by enabling designers to reach a final, brand-consistent design more quickly, without the need for frequent adjustments.
By reducing the number of modifications, VDMC not only saves time but also minimizes the environmental impact associated with energy consumption during repeated design refinements. Fewer modifications imply a more streamlined design process, where the parametric model efficiently guides the design towards the desired outcome from the outset. The difference in the number of modifications was statistically significant (p < 0.01), confirming the greater design stability and reduced resource consumption in the experimental group.

5. Conclusions

This study has demonstrated the effectiveness of the V-shaped Dynamic Morphology Curve (VDMC) as an innovative approach to automotive wheel design, offering significant improvements in design efficiency, brand consistency, and sustainability. By integrating parametric modeling into the design workflow, VDMC allows designers to rapidly generate multiple design variations while maintaining the core characteristics of brand identity. The empirical results highlight VDMC’s potential to streamline the design process, reduce resource consumption, and ensure greater alignment with brand aesthetics.
The comparative analysis between the VDMC-based design process and traditional CAD-based methods underscores its efficiency advantages. The experimental group utilizing VDMC completed design tasks 31.5% faster than the control group, demonstrating a marked improvement in the speed of generating high-quality, brand-consistent designs. This efficiency gain is primarily attributed to VDMC’s parametric nature, which enables designers to modify key design parameters without the need for extensive manual adjustments. Additionally, the parametric model facilitates a structured exploration of design variations, significantly reducing redundant iterations and design modifications. However, it is important to acknowledge that individual creativity and problem-solving skills may still play a role in design efficiency. To address this, future studies could include larger sample sizes and more diverse design tasks to further validate the generalizability of the VDMC method.
Brand consistency was another critical factor evaluated in this study, with the VDMC-generated designs achieving significantly higher ratings in adherence to brand identity compared to traditional methods. The ability of VDMC to enforce systematic design rules ensures that all generated designs retain essential brand characteristics, thereby addressing a longstanding challenge in maintaining visual identity across different product iterations. This feature is particularly valuable in the competitive automotive industry, where brand differentiation plays a crucial role in market positioning.
From a sustainability perspective, VDMC contributes to a more resource-efficient design process. The reduction in the number of design iterations by 53.2% and design modifications by 50.9% signifies a substantial decrease in time and computational resources required for achieving final design solutions. This not only minimizes environmental impact but also aligns with the broader objectives of sustainable manufacturing by reducing material waste and energy consumption during the design and production phases.
Despite these advantages, some limitations must be acknowledged. This study focused on a specific application within automotive wheel design, and further research is needed to assess the scalability of VDMC across other product categories within the automotive industry and beyond. Additionally, while VDMC enhances efficiency and brand consistency, future investigations could explore its integration with AI-driven generative design methods to further optimize creativity and automation in the design process. Moreover, assessing the long-term impact of VDMC on product performance, manufacturability, and life-cycle sustainability would provide a more holistic understanding of its implications.
VDMC represents a transformative advancement in automotive design methodologies, bridging the gap between efficiency, creativity, and sustainability. Its structured yet flexible approach enables rapid design iterations while preserving brand identity, making it a promising tool for industries seeking to enhance their design workflows. As consumer preferences continue to evolve towards personalized and aesthetically distinct products, the adoption of VDMC could pave the way for more innovative and sustainable design solutions in the future.

Author Contributions

Conceptualization, L.S.; methodology, Y.C. and W.A.; validation, Z.Q.; formal analysis, Y.C.; resources, J.W.; writing—original draft preparation, Y.C.; writing—review and editing, H.S. and Q.W.; visualization, C.J.; supervision, H.Y. and J.L.; project administration, J.W.; funding acquisition, L.S. All authors have read and agreed to the published version of the manuscript.

Funding

This research was funded by the National Social Science Fund of China, grant number 22BG125.

Institutional Review Board Statement

This research was approved by the authors’ college of the university.

Informed Consent Statement

Informed consent was obtained from all participants involved in this study.

Data Availability Statement

The data used to support the findings of this study are available from the corresponding author upon request.

Acknowledgments

We would like to thank the anonymous reviewers for their time and effort devoted to improving the quality of this research.

Conflicts of Interest

The authors declare no conflicts of interest.

References

  1. Norman, D.A. Emotional Design: Why We Love (or Hate) Everyday Things; Basic Books: New York, NY, USA, 2004. [Google Scholar]
  2. Schmitt, B.H. Experiential Marketing: How to Get Customers to Sense, Feel, Think, Act, and Relate to Your Company and Brands; Simon and Schuster: New York, NY, USA, 1999. [Google Scholar]
  3. Keller, K.L. Strategic Brand Management: Building, Measuring, and Managing Brand Equity; Pearson Education India: Tamil Nadu, India, 2013. [Google Scholar]
  4. Kotler, P.; Armstrong, G. Principles of Marketing; Pearson Education: London, UK, 2018. [Google Scholar]
  5. Singh, J.; Sarkar, P. Understand and quantify the consumers’ cognitive behavior for the appropriateness features of product aesthetics through the eye-tracking technique. Int. J. Interact. Des. Manuf. 2023, 19, 1–34. [Google Scholar]
  6. Hekkert, P.; van Dijk, M. Vision in Design: A Guidebook for Innovators; BIS Publishers: Amsterdam, The Netherlands, 2011. [Google Scholar]
  7. Lundgren, B. Customer-perceived value in residential developments: The case of Hornsberg Strand, Sweden. Int. Real Estate Rev. 2013, 16, 1–27. [Google Scholar] [CrossRef] [PubMed]
  8. Reichelt, F.; Holder, D.; Maier, T. The vehicle development process where engineering meets industrial design. IEEE Eng. Manag. Rev. 2023, 51, 102–123. [Google Scholar] [CrossRef]
  9. Bocken, N.M.; De Pauw, I.; Bakker, C.; Van Der Grinten, B. Product design and business model strategies for a circular economy. J. Ind. Prod. Eng. 2016, 33, 308–320. [Google Scholar] [CrossRef]
  10. Zheng, Q.; Ding, G.; Xie, J.; Li, Z.; Qin, S.; Wang, S.; Zhang, K. Multi-stage cyber-physical fusion methods for supporting equipment’s digital twin applications. Int. J. Adv. Manuf. Technol. 2024, 132, 5783–5802. [Google Scholar] [CrossRef]
  11. Belhocine, A.; Abdullah, O.I. Finite element analysis (FEA) of frictional contact phenomenon on vehicle braking system. Mech. Based Des. Struct. Mach. 2022, 50, 2961–2996. [Google Scholar] [CrossRef]
  12. Lawson, B. How Designers Think: The Design Process Demystified; Routledge: London, UK, 2006. [Google Scholar]
  13. Charter, M.; Tischner, U. (Eds.) Sustainable Solutions: Developing Products and Services for the Future; Routledge: London, UK, 2017. [Google Scholar]
  14. Füller, J.; Matzler, K.; Hoppe, M. Brand community members as a source of innovation. J. Prod. Innov. Manag. 2008, 25, 608–619. [Google Scholar] [CrossRef]
  15. Li, Z.; Hamidi, A.S.; Yan, Z.; Sattar, A.; Hazra, S.; Soulard, J.; Tailor, F. A circular economy approach for recycling Electric Motors in the end-of-life Vehicles: A literature review. Resour. Conserv. Recycl. 2024, 205, 107582. [Google Scholar] [CrossRef]
  16. Okoth, G.H.; Ndeda, R.; Raghupatruni, P.; Olakanmi, E.O. Trends in Lightweighting for Automotive Applications: A Case Study. J. Sustain. Res. Eng. 2024, 8, 50–67. [Google Scholar]
  17. McDonough, W.; Braungart, M. Cradle to Cradle: Remaking the Way We Make Things; North Point Press: Berkeley, CA, USA, 2002. [Google Scholar]
  18. Wang, G.G.; Shan, S. Review of metamodeling techniques in support of engineering design optimization. In Proceedings of the International Design Engineering Technical Conferences and Computers and Information in Engineering Conference, Philadelphia, PA, USA, 10–13 September 2006; Volume 4255, pp. 116–123. [Google Scholar]
  19. Wu, J.T.; Mao, Q.; Sun, L. Intelligent Customization Design of Wheel Hub Based on Meta Symbol and Extenics. Boletín Técnico 2017, 55, 116–123. [Google Scholar]
  20. Sun, L.; Wu, J.T.; Lv, Q.H. Method of Recommending Wheel Hub Based on User Preferences. Boletín Técnico 2017, 55, 64–73. [Google Scholar]
  21. Sun, L.; Wu, J.T.; Li, T. Product Family Shape Based on Similar Characteristics. J. Comput. 2014, 3, 758–765. [Google Scholar] [CrossRef]
  22. Liu, X.; Yang, S. Study on product form design via Kansei engineering and virtual reality. J. Eng. Des. 2022, 33, 412–440. [Google Scholar] [CrossRef]
  23. Yuan, C. Deep Neural Network Architectures for User-Centered Design Concept Generation and Evaluation. Ph.D. Thesis, Northeastern University, Boston, MA, USA, 2022. [Google Scholar]
  24. Elkafafy, M.; Csurcsia, P.; Cornelis, B.; Risaliti, E.; Janssens, K. Machine learning and system identification for the estimation of data-driven models: An experimental case study illustrated on a tire-suspension system. In Proceedings of the ISMA 2020, International Conference on Noise and Vibration Engineering, CD-ROM, Online, 7–9 September 2020. [Google Scholar]
  25. Tovey, M.; Porter, S.; Newman, R. Sketching, concept development and automotive design. Des. Stud. 2003, 24, 135–153. [Google Scholar] [CrossRef]
  26. Sharma, A.; Yadav, R.; Sharma, K. Optimization and investigation of automotive wheel rim for efficient performance of vehicle. Mater. Today Proc. 2021, 45, 3601–3604. [Google Scholar] [CrossRef]
  27. Liu, N.; Liu, X.; Jiang, Y.; Liu, P.; Gao, Y.; Ding, H.; Zhao, Y. Bionic Optimization Design and Fatigue Life Prediction of a Honeycomb-Structured Wheel Hub. Biomimetics 2024, 9, 611. [Google Scholar] [CrossRef] [PubMed]
  28. Dong, X.; Yao, L.; Liu, H.; Ding, Y. Research on topology optimization method of surface support structure based on leaf vein growth process. AIP Adv. 2023, 13, 095001. [Google Scholar] [CrossRef]
  29. Xu, P.F.; Duan, S.Y.; Wang, F. Reverse modeling and topological optimization for lightweight design of automobile wheel hubs with hollow ribs. Int. J. Comput. Methods 2020, 17, 1950064. [Google Scholar] [CrossRef]
  30. Hirz, M.; Dietrich, W.; Gfrerrer, A.; Lang, J. Integrated Computer-Aided Design in Automotive Development; Springer: Berlin/Heidelberg, Germany, 2013. [Google Scholar] [CrossRef]
  31. Gao, J.; Chen, C.; Fang, X.; Zhou, X.; Gao, L.; Nguyen, V.P.; Rabczuk, T. Multi-objective topology optimization for solid-porous infill designs in regions-divided structures using multi-patch isogeometric analysis. Comput. Methods Appl. Mech. Eng. 2024, 428, 117095. [Google Scholar] [CrossRef]
  32. Koronis, G.; Silva, A.; Fontul, M. Green composites: A review of adequate materials for automotive applications. Compos. Part B Eng. 2013, 44, 120–127. [Google Scholar] [CrossRef]
  33. Llopis-Albert, C.; Rubio, F.; Valero, F. Impact of digital transformation on the automotive industry. Technol. Forecast. Soc. Change 2021, 162, 120343. [Google Scholar] [CrossRef] [PubMed]
  34. Tofail, S.A.; Koumoulos, E.P.; Bandyopadhyay, A.; Bose, S.; O’Donoghue, L.; Charitidis, C. Additive manufacturing: Scientific and technological challenges, market uptake and opportunities. Mater. Today 2018, 21, 22–37. [Google Scholar] [CrossRef]
  35. Goel, R.; Gupta, P. Robotics and Industry 4.0. In A Roadmap to Industry 4.0: Smart Production, Sharp Business and Sustainable Development; Springer: Berlin, Heidelberg, Germany, 2020; pp. 157–169. [Google Scholar]
  36. Wegst, U.G.K. Natural materials for making things. Mater. Today 2010, 13, 40–44. [Google Scholar]
  37. Ashby, M.F.; Johnson, K. Materials and design: The Art and Science of Material Selection in Product Design; Butterworth-Heinemann: Oxford, UK, 2019. [Google Scholar]
  38. Akande, T.O.; Alabi, O.O.; Oyinloye, J.B. A Review of Generative Models for 3D Vehicle Wheel Generation and Synthesis. J. Comput. Theor. Appl. 2024, 1, 368–385. [Google Scholar] [CrossRef]
  39. Akande, T.O.; Alabi, O.O.; Rizwan, A.; Ajagbe, S.A.; Olaleye, A.O.; Adigun, M.O. AI-assisted Design of Lightweight and Strong 3D-Printed Wheels for Electric Vehicles. PLoS ONE 2024, 19, e0308004. [Google Scholar] [CrossRef]
  40. Sun, L.; Wu, J.T.; Liang, X.X. Computerized Automatic Generation Method of Categorized Hub Spectrum According to Its Form. Adv. Mater. Res. 2014, 933, 521–526. [Google Scholar] [CrossRef]
  41. Bo, W.; Qiu, Y.R.; Jin, H. Research on Parametric Generation of Automobile Styling Based on Grasshopper. In Proceedings of the 2024 IEEE 24th International Conference on Software Quality, Reliability, and Security Companion (QRS-C), Cambridge, UK, 1–5 July 2024; pp. 998–1003. [Google Scholar]
  42. Puangchaum, W.; Rooppakhun, S.; Phunpeng, V. Parametric Design and Optimization of Alloy Wheel Based on Dynamic Cornering Fatigue Test. In Proceedings of the 5th IIAE International Conference on Industrial Application Engineering, Kitakyushu, Japan, 27–31 March 2017. [Google Scholar]
Figure 1. Classification of wheel rim designs.
Sustainability 17 02463 g001
Figure 2. Classification of V-shaped Dynamic Morphological Curves.
Sustainability 17 02463 g002
Figure 3. Axially symmetric V-shaped coordinate plot with one control point.
Sustainability 17 02463 g003
Figure 4. Non-axially symmetric V-shaped coordinate plot with one control point.
Sustainability 17 02463 g004
Figure 5. Composition of wheel skeleton categories.
Sustainability 17 02463 g005
Figure 6. Linear skeleton classification.
Sustainability 17 02463 g006
Figure 7. Linear skeleton eight’s corresponding shape linear skeleton one, its angle line skeleton three, and the corresponding rotational line skeleton.
Sustainability 17 02463 g007
Figure 8. Characteristics of serial numbers at different positions of linear skeleton.
Sustainability 17 02463 g008
Figure 9. Linear skeleton three’s corresponding facial skeleton.
Sustainability 17 02463 g009
Figure 10. Linear skeleton three’s facial skeleton and its corresponding proportional surface skeleton.
Sustainability 17 02463 g010
Figure 11. Sequential characteristics of the facial skeleton.
Sustainability 17 02463 g011
Figure 12. Foraminal skeletons.
Sustainability 17 02463 g012
Figure 13. Potential skeletons.
Sustainability 17 02463 g013
Figure 14. Heterogeneous skeletons.
Sustainability 17 02463 g014
Figure 15. Skeleton progression operation diagram.
Sustainability 17 02463 g015
Figure 16. Superimposition operation of two types of skeletons.
Sustainability 17 02463 g016
Figure 17. Process of superimposition operation of three types of skeletons.
Sustainability 17 02463 g017
Figure 18. Process of superimposition operation of four types of skeletons.
Sustainability 17 02463 g018
Figure 19. Process of obtaining wheel rim skeleton combination through operation.
Sustainability 17 02463 g019
Figure 20. Processed image of Breyton brand wheel rim.
Sustainability 17 02463 g020
Figure 21. Summary of feature set information for Breyton wheels.
Sustainability 17 02463 g021
Figure 22. Process of obtaining Breyton Race GTS wheel rim.
Sustainability 17 02463 g022
Figure 23. Process and results of deriving the Breyton Fascinate2 wheel rim design.
Sustainability 17 02463 g023
Figure 24. Ten wheel rim raster images and their modeling.
Sustainability 17 02463 g024
Table 1. Axially symmetric VDMC classification.
TypeBasic ShapeInward-Retracted ShapeOutward-Retracted Shape
V-shaped diagramSustainability 17 02463 i001Sustainability 17 02463 i002Sustainability 17 02463 i003
Wheel hub diagramSustainability 17 02463 i004Sustainability 17 02463 i005Sustainability 17 02463 i006
Table 2. Classification of non-axially symmetric VDMCs.
TypeDouble Straight Line Basic FormDouble
Broken Line Contraction–
Expansion Form
Double Broken Line
Inward Curved Form
Double Broken Line Outward Curved FormBroken Straight Line Inward Curved FormBroken Straight Line Outward Curved Form
V-shaped
diagram
Sustainability 17 02463 i007Sustainability 17 02463 i008Sustainability 17 02463 i009Sustainability 17 02463 i010Sustainability 17 02463 i011Sustainability 17 02463 i012
Wheel hub diagramSustainability 17 02463 i013Sustainability 17 02463 i014Sustainability 17 02463 i015Sustainability 17 02463 i016Sustainability 17 02463 i017Sustainability 17 02463 i018
Table 3. Variations in the Classification of Specific Linear Skeletons.
TypeLinear Skeleton Eight’s
Corresponding Shape Linear Skeleton
Linear Skeleton Eight’s
Corresponding Angular Line
Skeleton
Linear Skeleton Eight’s
Corresponding
Vertical
Proportional
Skeleton
Linear Skeleton Eight’s
Corresponding Horizontal
Proportional
Skeleton
Sustainability 17 02463 i031Sustainability 17 02463 i032Sustainability 17 02463 i033Sustainability 17 02463 i034
Table 4. Wheel rim design variants generated through VDMC variation.
Hub DiagramVariation 1Variation 2Variation 3
Control slopeSustainability 17 02463 i019Sustainability 17 02463 i020Sustainability 17 02463 i021
Control point movementSustainability 17 02463 i022Sustainability 17 02463 i023Sustainability 17 02463 i024
Angle variationSustainability 17 02463 i025Sustainability 17 02463 i026Sustainability 17 02463 i027
Rotation variationSustainability 17 02463 i028Sustainability 17 02463 i029Sustainability 17 02463 i030
Disclaimer/Publisher’s Note: The statements, opinions and data contained in all publications are solely those of the individual author(s) and contributor(s) and not of MDPI and/or the editor(s). MDPI and/or the editor(s) disclaim responsibility for any injury to people or property resulting from any ideas, methods, instructions or products referred to in the content.

