Article

Can the Development of Digital Inclusive Finance Curb Carbon Emissions?: A Spatial Panel Analysis for China Under the PVAR Approach

School of Business, Hangzhou City University, Hangzhou 310015, China
*
Author to whom correspondence should be addressed.
Sustainability 2025, 17(6), 2461; https://doi.org/10.3390/su17062461
Submission received: 22 December 2024 / Revised: 28 February 2025 / Accepted: 9 March 2025 / Published: 11 March 2025
(This article belongs to the Section Economic and Business Aspects of Sustainability)

Abstract

:
Achieving the goals of carbon peak and carbon neutrality is crucial for the balance of global economic development with carbon emissions reduction and ecological environment protection, which are essential for the sustainability of human development. Digital inclusive finance (DIF), as an emerging force capable of promoting economic growth and technological innovation, plays a significant role in curbing carbon emissions. By using the panel data of 30 provinces in China from 2011 to 2021 and employing the panel vector autoregression (PVAR) model, this study empirically investigates the impact of DIF on total carbon emissions (TCE) and carbon emission intensity (CEI) from the perspective of technological innovation. The results show that DIF significantly reduces TCE and CEI and can further decrease TCE and CEI by promoting the level of technological innovation. The results of the impulse response function (IRF) reveal that technological innovation has a more significant and volatile impact on CEI compared to its effect on TCE. Moreover, heterogeneity analysis suggests that the impact of DIF on the reduction in carbon emissions is characterized by regional heterogeneity, with the impact of DIF on TCE in the central regions being the most pronounced, significantly influenced by the spillover effects from the eastern regions. Further research finds that the western regions exhibit a more significant impact of technological innovation levels on CEI compared to the eastern regions, with a discernible trend towards the convergence of inter-provincial disparities in CEI in the process of development.

1. Introduction

In recent years, excessive emissions of greenhouse gas carbon dioxide (CO2) have led to global warming, and extreme weather events have severely affected human health and normal human production and life; thus, realizing a green transition and reducing CO2 emissions are of great significance to the sustainable development of human beings. In response to these challenges, many countries across the globe have made low-carbon development an important goal [1]. In 2020, China announced to the international community its ambition to achieve a peak in carbon emissions before 2030 and to strive for carbon neutrality by 2060 [2]. Nowadays, a new round of technological revolution and industrial change driven by technologies such as artificial intelligence, cloud computing, and big data is reshaping the pattern of world economic development, which is accelerating into the era of digital economy. The development of digital inclusive finance (DIF), defined as the utilization of digital technology to provide financial services to populations traditionally excluded from the formal financial system [3], takes full advantage of its low-cost and low-threshold features by utilizing its inclusive nature to break the time and space limitations of traditional financial services [4]. It has been shown that the development of DIF can promote technological innovation (TE) and promote the optimization of industrial structure, while the development of scientific and technological innovation can accelerate the inclusive development of DIF and, at the same, time effectively improve the efficiency of energy use, reduce energy consumption per unit of GDP, and further curb carbon emissions, which helping to promote the greening transition.
At the present stage of rapid economic development, the contradiction between economic development and the ecological environment in China remains prominent [
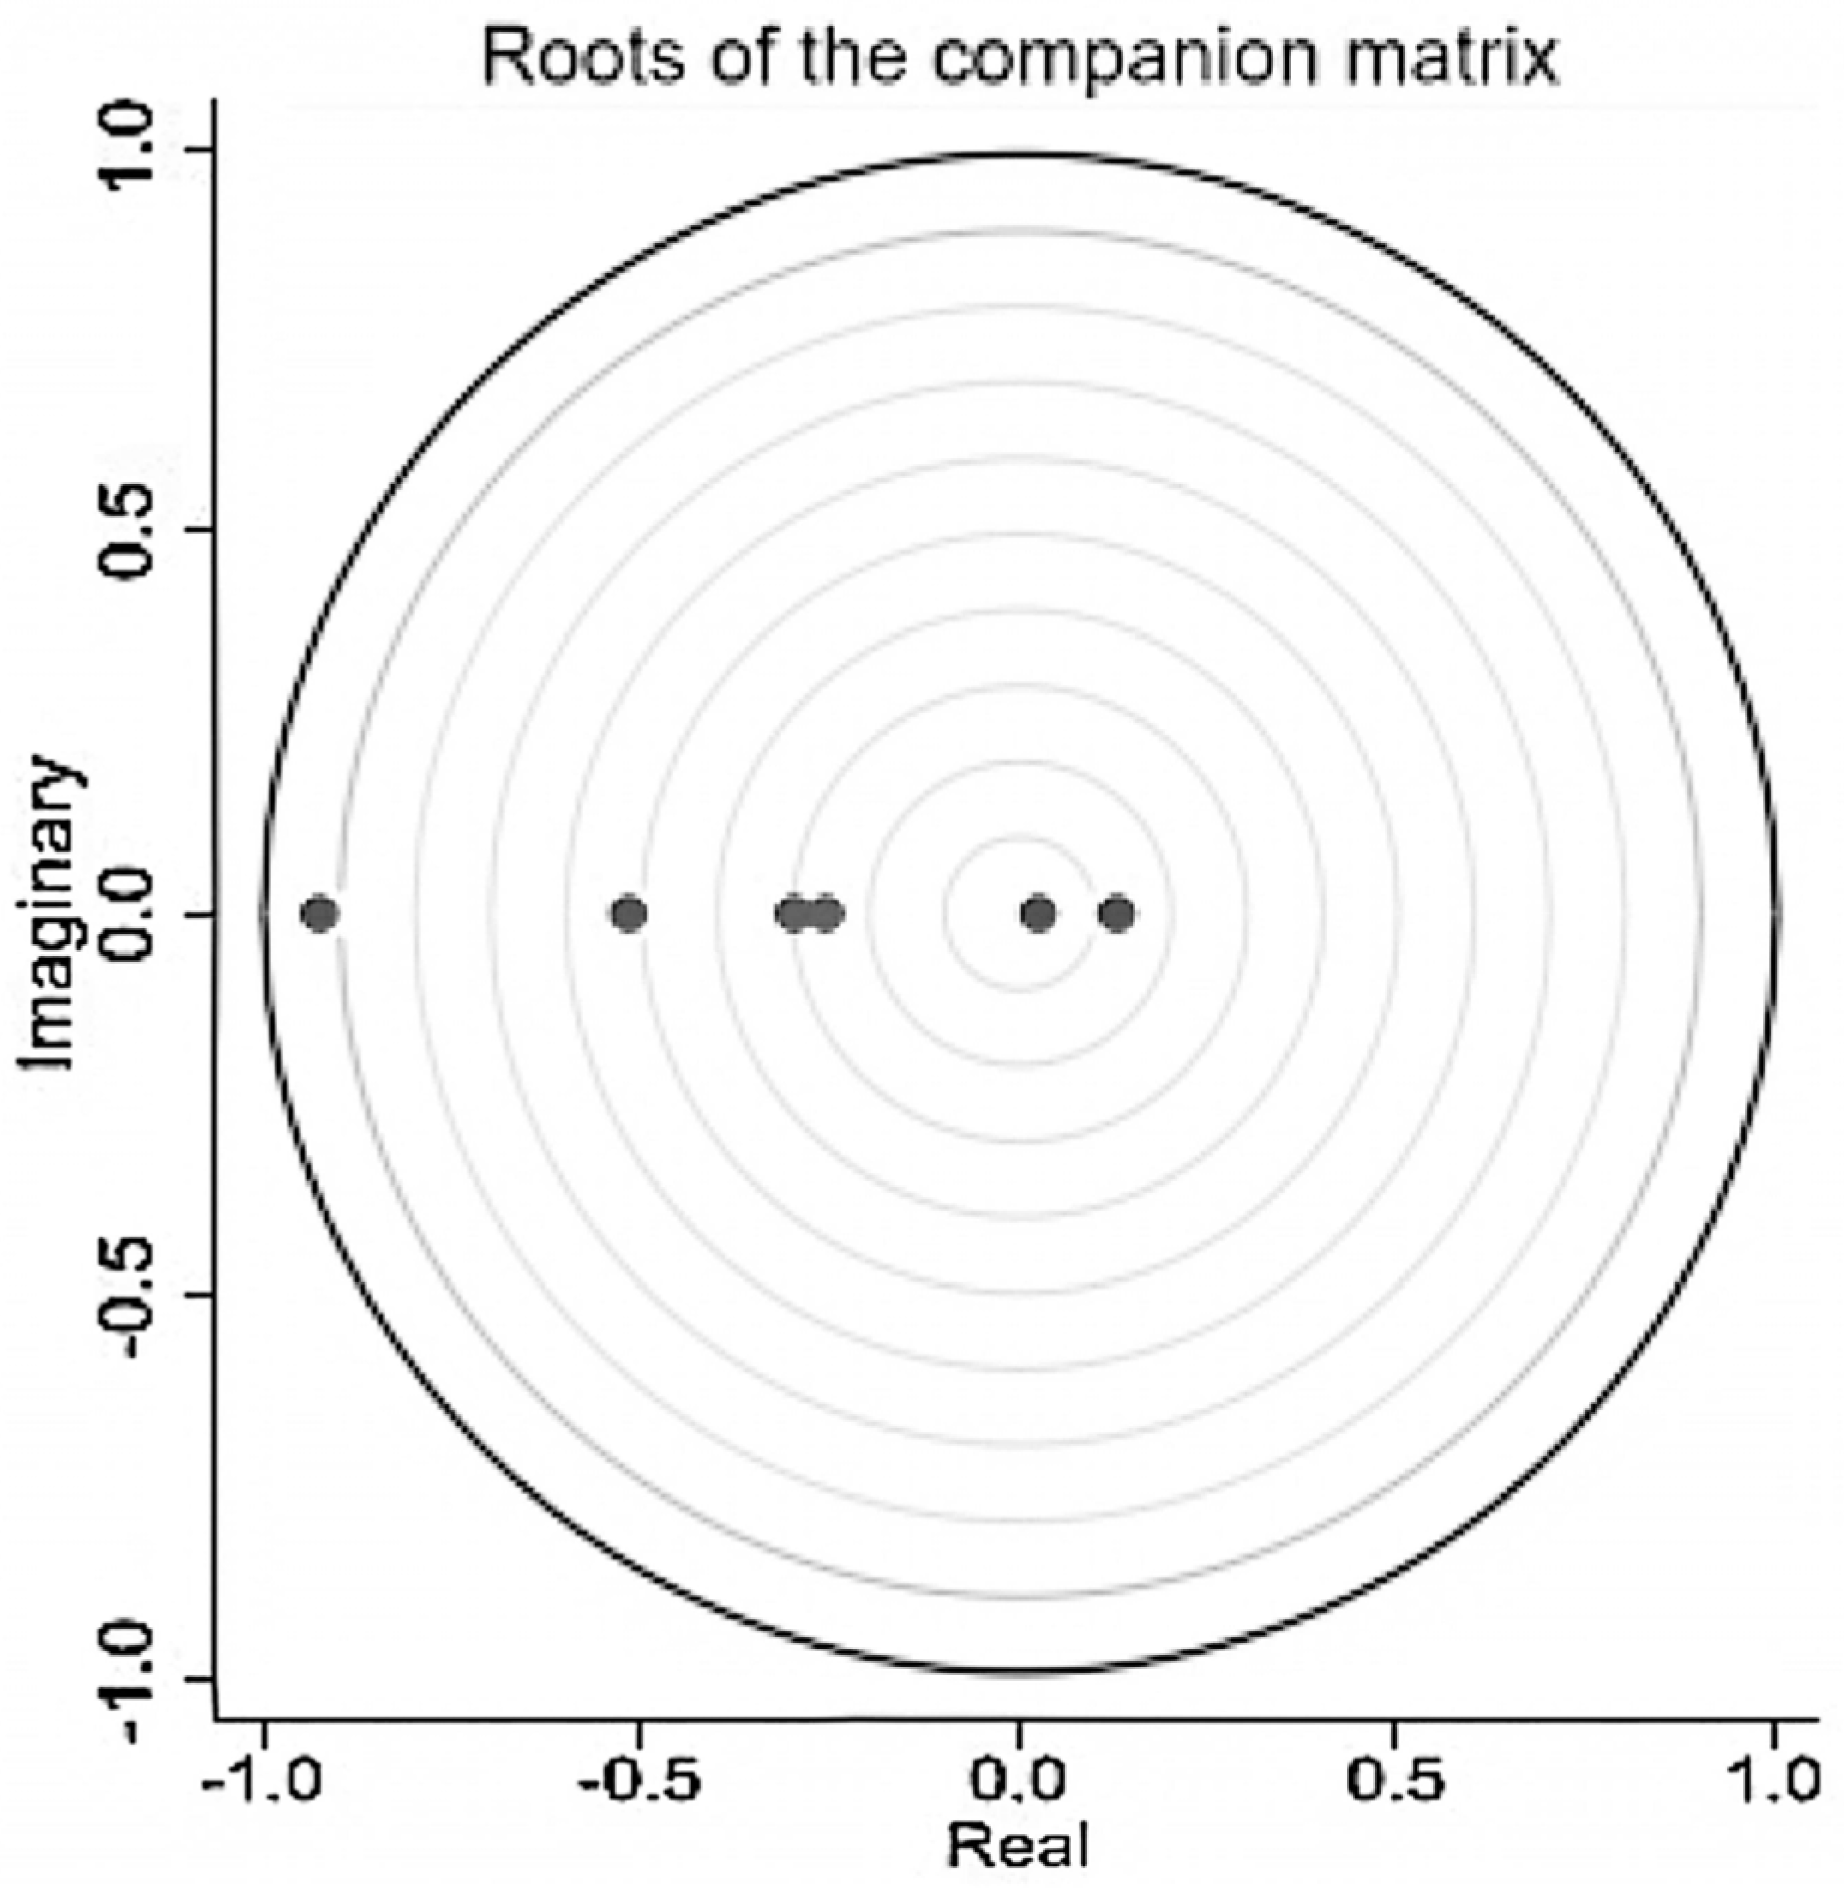
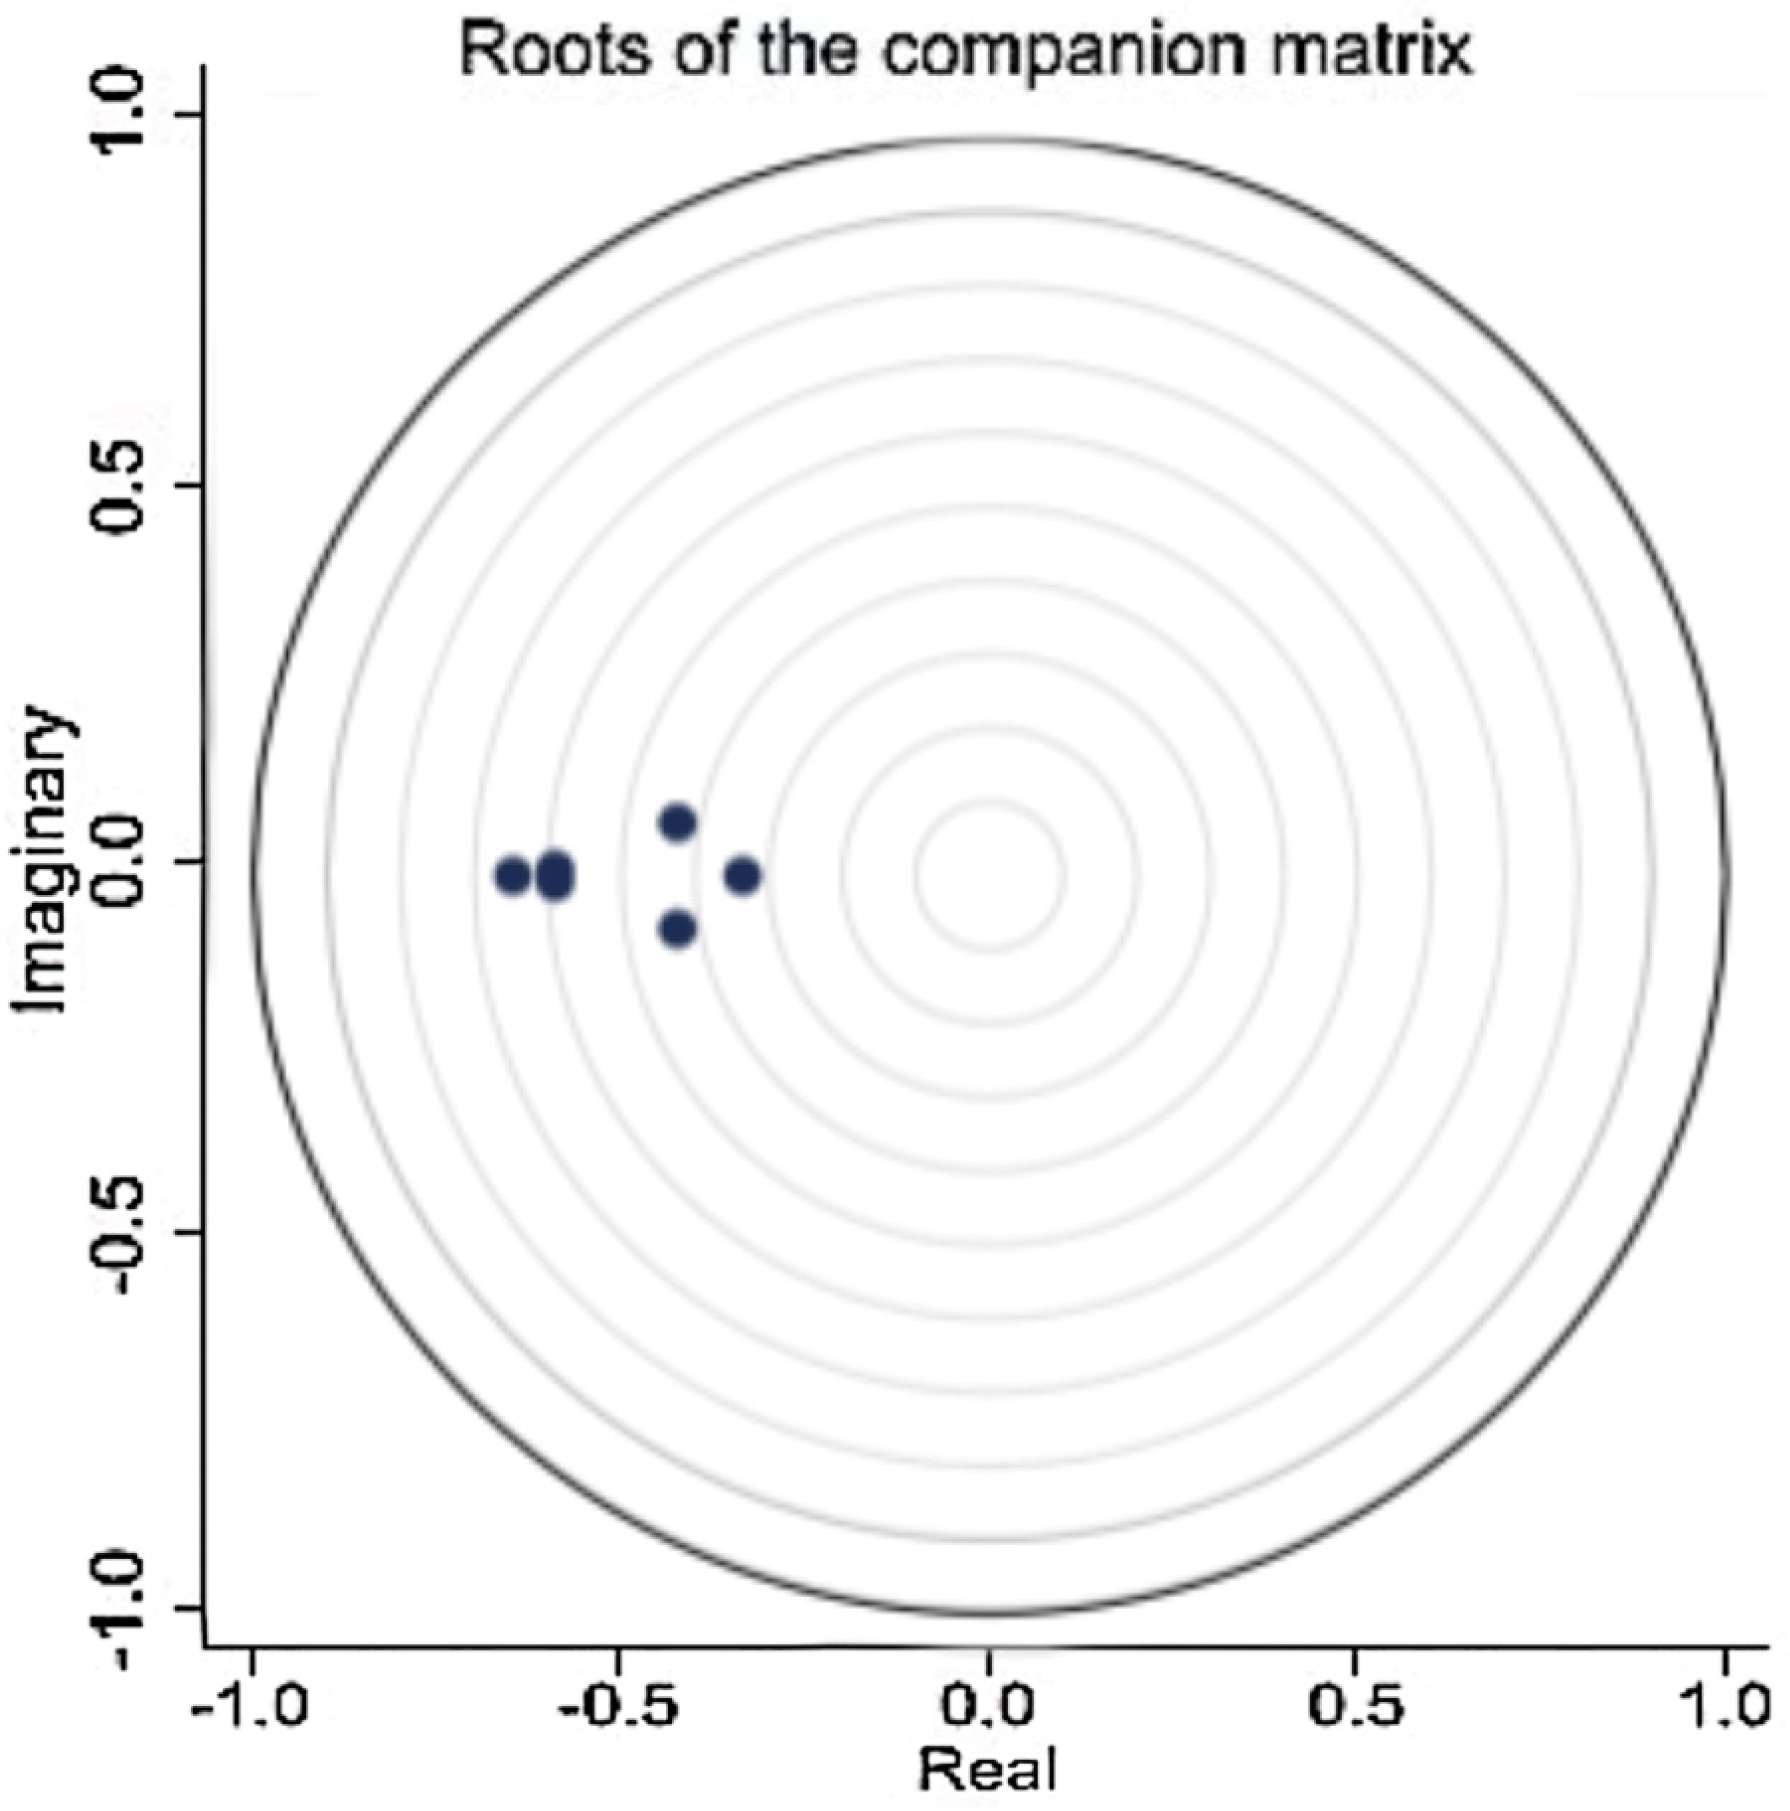
5]. Balancing the relationship between economic development and the reduction in carbon emissions and the protection of the ecological environment is one of the major concerns of government and society. To achieve the goal of carbon peaking and carbon neutrality, DIF, with its convenience and inclusiveness, is an important lever to promote low-carbon economic development, but the challenges are still arduous. In order to deeply understand and analyze the relationship between DIF, TE, and carbon emissions, this study empirically analyzes the impact mechanism of DIF on carbon emissions by using the Panel Vector Autoregression (PVAR) model and the panel data of 30 provinces in China from 2011 to 2021. In addition, the study examines carbon emissions in the eastern, central, and western regions of China from the perspective of regional heterogeneity. The findings and conclusions provide both theoretical insights and empirical evidence to support the advancement of dual carbon control policies and the achievement of the dual carbon objective.

2. Literature Review

2.1. The Impact of DIF on Carbon Emissions Reduction

The introduction of the dual carbon goals, aiming to achieve carbon neutrality and peak carbon emissions, coupled with the swift expansion of DIF, has prompted extensive scholarly interest in how DIF contributes to carbon emissions reduction. Some researchers argue that there is a significant correlation between the financial sector and carbon emissions [6]. Some studies have demonstrated that DIF has the potential to restrain carbon emissions. For instance, advancements in financial development contribute to a reduction in energy-related carbon emission by fostering trade openness [7,8]. Financial mechanisms also enhance carbon emission outcomes, primarily by elevating regional innovation and entrepreneurial activities [9]. The literature has identified a non-linear relationship between DIF and carbon emissions. The relevance of the environmental Kuznets curve has been found to be valid, illustrating an inverted U-shaped correlation between economic growth and environmental degradation [10]. The impact of DIF on the environment can also be decomposed into scale effects and technology effects [11]. With the continuous development and improvement of DIF, scale effects tend to diminish, while technological effects experience an upward trajectory. When technological effects surpass scale effects, DIF ultimately leads to a reduction in environmental pollution.

2.2. Mechanism of the Impact of DIF on Carbon Emissions Reduction

The impact mechanism of DIF in promoting carbon emissions reduction can be mainly summarized according to two aspects: On the one hand, DIF can alleviate financing constraints of the digital economy, provide financial support, optimize the allocation of production factors, and promote industrial structure upgrading, promoting reductions in carbon emissions. On the other hand, DIF can alleviate the problem of information asymmetry, promote TE, and improve energy consumption efficiency. These changes, in turn, play a significant role in reducing carbon emissions. The nascent development of digital finance can eliminate temporal and spatial restrictions on factor flows [12]. However, as the financial system becomes more market-oriented and boosts investment and consumption, it may also lead to increased energy consumption and pollution in the form of emissions [13,14]. The growth of DIF enhances financial accessibility and addresses issues of misallocated financing [15]. It efficiently and swiftly provides financial support and other novel financial services to small and micro businesses and farmers at a low cost, ensuring a more equitable distribution of resources across industries, thereby reducing financing costs and optimizing resource allocation [16]. The upgrading of industrial structure can strengthen investment in energy-saving technologies and carbon emissions reduction. Furthermore, DIF notably enhances the capability of green TE in enterprises, reduces the issue of information asymmetry, and fosters the growth of green finance while decreasing the cost of financial services [17]. DIF can also indirectly affect coordinated reductions in pollution and carbon emissions through energy consumption and energy structure effects [18], and innovation in energy technology can promote the transformation of renewable energy technology [19], further optimize the structure of energy consumption, and empower emissions reduction [20,21]. While the synergistic effects of digital finance and green technology innovation significantly enhance local carbon emission efficiency, they may concurrently inhibit carbon emission efficiency in adjacent urban areas to some extent [22].

2.3. Impact of DIF on Carbon Emissions Reduction in Different Fields and Industries

In the digital era, DIF has alleviated the liquidity constraints faced by firms and effectively mitigated the barriers to green innovation, which has contributed to the expansion of green economic activities. The development of industrialization increases carbon emissions [23], and the ecological impact of industrialization is affected by economic growth and energy consumption [24]. DIF helps to improve industrial structure and resource efficiency and encourages green technologies to influence carbon emissions [25]. In agriculture, DIF can promote agricultural capital deepening, improve capital utilization, and further promote carbon emissions reduction. A previous study revealed that while DIF promotes an increase in rural capital, it also correlates with heightened electricity consumption, resulting in increased carbon emissions [26]. In the tourism sector, the extent and depth of digital finance usage significantly inhibit the carbon emission intensity (CEI) of industry, although the degree of digitization may have a contrasting promotional effect on CEI [27]. Lastly, DIF has a positive driving effect on new-quality productivity, encouraging enterprises to develop in the direction of digitalization, informatization, intelligence, and green and low-carbon technology [28].
The existing literature mainly focuses on the unilateral relationship between DIF and total carbon emissions (TCE) or CEI, while there is a lack of research on dual carbon control. Furthermore, the impact mechanism of DIF on carbon emissions from the perspective of TE and whether the level of TE can optimize the role of DIF in carbon reduction require further investigation. This paper analyzes data from 30 provinces in China from 2011 to 2021. Employing a PVAR model and regression analysis, the research aims to elucidate the impact mechanisms of DIF on carbon emissions through the lens of TE. Additionally, this study examines the effects of carbon emissions across the eastern, central, and western regions of China, taking into account regional heterogeneity. The findings facilitate a comparative analysis of the effectiveness of various pathways for carbon emissions reduction. Ultimately, this research aspires to provide both theoretical insights and empirical evidence to support the advancement of dual carbon control policies and the achievement of the dual carbon objective.

3. Theoretical Analysis and Hypotheses

DIF provides innovative, convenient, and efficient financial services, simplifying transaction processes, boosting public engagement in environmental conservation, and helping reduce carbon dioxide emissions. First, at the individual consumer level, DIF enables financial institutions to utilize online digital service platforms, employing models like Internet banking to assist users in conducting online financial transactions and managing investments and payments. This approach helps decrease energy consumption associated with travel and reduces the resource usage of traditional offline services, ultimately leading to a reduction in direct carbon emissions [29]. Alipay’s Ant Forest initiative motivates citizens to earn virtual credits by engaging in environmentally friendly actions like using public transport and making online payments. These credits are then transformed into real-world tree planting and reforestation projects, fostering green habits among citizens and contributing to environmental protection efforts [30]. Additionally, Cainiao’s box recycling program and second-hand platforms like Xianyu improve resource efficiency through recycling and reuse, actively involving citizens in environmental conservation [5]. At the enterprise level, DIF utilizes the capability of digital technology to transcend spatial boundaries, facilitating the cross-regional flow of financial capital and broadening the scope of capital supply and demand in the financial market [31]. This development not only alleviates corporate financing constraints and addresses information asymmetry but also improves the efficiency of corporate investment and resource allocation. As a result, it incentivizes companies to engage in research and development related to green production technologies, integrating cleaner renewable energy sources such as solar and biomass energy into their manufacturing processes, thereby directly reducing total carbon emissions at the source [21]. Consequently, this study proposes the following hypothesis:
H1. 
DIF can reduce TCE.
It is essential to progress from the current dual control system for energy consumption to a new dual control framework focusing on both TCE and CEI with the aim of more effectively regulating and reducing carbon emissions while promoting the use of sustainable energy sources. Carbon trading is a market-based strategy for reducing CEI. It encourages companies to innovate technologically to lower their carbon emissions, promoting corporate transformation and innovation [32]. The advancement of carbon trading depends on factors such as carbon finance parameters, indicator systems, and measurement methodologies. DIF can provide solutions for the carbon trading market, especially in areas like information disclosure and transaction pricing, which can improve transaction efficiency and effectively reduce CEI. Inclusive finance platforms gather carbon trading information and offer real-time data and analytical tools, enabling market participants to have a clearer understanding of market trends and fostering the disclosure and sharing of information. Moreover, these platforms deepen participants’ comprehension of the carbon trading mechanism and boost their enthusiasm for involvement through educational and training initiatives. DIF also alleviates funding pressures on small and medium-sized enterprises (SMEs), optimizes capital allocation, and draws more companies into the carbon trading market via crowdfunding and microcredit. This increases the number of market participants, enhances trading efficiency, and improves market liquidity and transparency, thereby effectively reducing carbon emission intensity [33]. Therefore, this study proposes the following hypothesis:
H2. 
DIF has a negative inhibitory effect on CEI.
DIF provides convenient financial services to low-income groups, reducing the phenomenon of being unable to receive education due to economic reasons and directing funds towards the education sector, thereby providing a solid talent base for TE. DIF significantly boosts the appeal of regions known for their TE by enhancing the accessibility and efficiency of financial services. In these regions, it plays a crucial role in retaining local innovative talent, as well as attracting external funds. However, differences in the initial levels of TE across regions result in varying patterns of talent and capital movement. This diversity further contributes to the distinct heterogeneity in total carbon emissions among different regions [34]. On the other hand, due to the high risks and cycles associated with TE, SMEs find it difficult to obtain sufficient R&D funds in traditional financial markets. DIF overcomes the conventional financial market’s preference for stable returns, thereby expanding the financing options for these enterprises. By addressing the issue of insufficient R&D funds and nurturing innovative talent, TE is consistently enhanced. This includes refining of existing production technologies and pioneering innovations in low-carbon technologies, which significantly contribute reductions in CO2 emissions [35]. It can be seen that DIF has a positive indirect impact on TCE by effectively promoting the improvement of the level of TE and effectively reducing TCE. Consequently, this study proposes the following hypothesis:
H3. 
DIF can reduce TCE by funding the improvement of TE.
Due to the negative correlation between GDP growth and CEI, CEI tends to decrease as an economy grows. DIF can fund the improvement of TE, which can effectively reduce this intensity. Additionally, DIF effectively addresses the imbalance in the distribution of financial capital, enabling it to flow smoothly into high-quality, low-energy-consuming enterprises, as well as SMEs. This allows these companies to allocate more resources to R&D, increasing their R&D spending and integrating internal innovation capabilities, thereby strongly supporting the enhancement of green and low-carbon technological innovation within the enterprise [36], which leads to an effective reduction in carbon emission intensity. China’s vast territory, coupled with its complex and diverse ecological and climatic factors, results in significant regional variations in innovation levels and carbon emission patterns [37]. In the western regions, the impact of TE on CEI is notably greater than in the eastern regions, while the gap in CEI among provinces in the central region is gradually narrowing. Therefore, this paper proposes the following hypothesis:
H4. 
DIF can diminish CEI through the mediating pathway of enhancing TE levels.

4. Methodology

4.1. Model Setting

The PVAR model operates on panel data based on the traditional VAR model. It characterizes the dynamic impact relationships of multiple variables while allowing for endogenous variables, effectively avoiding endogeneity issues in parameter estimation. Furthermore, it predicts the nonlinear impacts of external shocks by using orthogonal impulse response functions [38]. By employing the PVR model construction method proposed by Charfeddine [39], this study investigates the interactions among DIF, TE, and TCE, as well as CEI. The model is constructed as follows:
TCE it = α 10 + j = 1 n α 1 j TCE i , t j + j = 1 n b 1 j DIF i , t j + j = 1 n c 1 j TE i , t j + j = 1 n d 1 j ULB i , t j + j = 1 n e 1 j ERS i , t j + j = 1 n f 1 j EC i , t j + β 1 i + γ 1 t + ε 1 it
CEI it = α 20 + j = 1 n α 2 j CEI i , t j + j = 1 n b 2 j DIF i , t j + j = 1 n c 2 j TE i , t j + j = 1 n d 2 j ULB i , t j + j = 1 n e 2 j ERS i , t j + j = 1 n f 2 j EC i , t j + β 2 i + γ 2 t + ε 2 it
where subscripts i and t represent provinces and time, respectively. DIF, TE, ULB, ERS, EC, CEI, and TCE represent digital inclusive finance, TE, the level of urbanization, the level of environmental regulation, the level of economic development, CEI, and TCE, respectively. α10 and α20 are the intercept terms. j is the number of lagged orders. αj, bj, cj, dj, ej, and fj represent the parameter matrix of lagged order j [40]; β1i and β2i are individual fixed effects, reflecting the individual differences of each province. γt is the individual point-in-time effect, reflecting the impact of different times on each province. ε1,t and ε2,t are random perturbation terms.

4.2. Variables and Data Recourse

This study employs data from 30 provinces from 2011 to 2021 in China. The DIF Index (DIF) is obtained from the DIF Index developed by Peking University. TE, measured by the quantity of patents granted, is sourced from the CSMAR database. Population statistics and per capita GDP are collected from the China Energy Statistical Yearbook, while TCE values are collected from the Carbon Accounting Database.
The descriptive statistics results are detailed in Table 1, which reports definitions, variable measurement, data processing, basic data characteristics, and units of variables. As shown in Table 1, the range of values for DFI spans from a minimum of 16.22 to a maximum of 460.6909. In terms of TCE, the values range from 41.31844 to 2099.792. For CEI, the minimum and maximum values are recorded at 0.0127 and 0.243, respectively. The descriptive statistics results reflect significant variations in both DIF and carbon emission levels among the various provinces.

5. Empirical Test and Results

5.1. Stationarity Test

5.1.1. Panel Unit Root Test

The stationarity of endogenous variables is a prerequisite for constructing a PVAR model. To avoid the occurrence of spurious regression, this study conducted stationarity tests using Augmented Dickey–Fuller (ADF), LLC tests and IPS tests [42]. Table 2 shows the results of the ADF test, and the results of LLC and IPS tests are shown in Table 3. As the original data were non-stationary, this study employed first-order differencing for the ADF test and second-order differencing for the LLC and IPS tests to process the data. As can be seen from Table 2 and Table 3, the p-values of all variables are less than 0.05, which means that at the significance level of α = 0.05, the null hypothesis of non-stationary variables can be rejected. The ADF test, LLC test, and IPS test were passed, which indicates all variables are stationary.

5.1.2. Optimal Lag Order

Before establishing the PVAR model for estimation, this paper determines the optimal lag order using the Minimum Akaike Information Criterion (MAIC), Minimum Bayesian Information Criterion (MBIC), and Multivariate Quasi-Akaike Information Criterion (MQIC) [43]. As demonstrated in Table 4 and Table 5, the lag period is systematically increased. The selection of the lag period is contingent upon the significance level; specifically, the lag period for TCE is determined to be of the third order, whereas the lag period for CEI is classified as second-order. Furthermore, according to the results of the BIC, MAIC, and MQIC tests, the optimal lag order is determined by selecting the one that minimizes the AIC, BIC, or QIC value. As seen in Table 4 and Table 5, the order with the highest frequency of the minimum value of the information criterion for all three tests is the first order. Consequently, the first order is established as the optimal lag for the model in this study.

5.1.3. Robustness Test

In order to validate the model and the subsequent Granger causality test and impulse response analysis, this study performs an AR root analysis to evaluate the model’s stability. The results are illustrated in Figure 1 and Figure 2. The results reveals that, after adding control variables such as economic development, environmental regulatory frameworks, and levels of urbanization, both the eigenvalues associated with TCE and those related to CEI fall within the unit circle. These results indicate that the PVAR model constructed in this paper is robust [44].

5.2. Granger Causality Test

The Granger causality test is a statistical method used to determine whether one time series can predict another, providing evidence of a causal relationship between economic or financial variables. The variables investigated in this paper become stable after they pass the ADF test after first-order differencing and the IPS and LLC tests after second-order differencing and are used for the following Granger causality analysis. The results of Granger causality testing of TCE and CEI are illustrated in Table 6 and Table 7, respectively, and the results of testing between DIF and TE are demonstrated in Table 8.
The results presented in Table 6, Table 7 and Table 8 indicate that DIF is a Granger cause of TCE at a significance level of α = 0.05; therefore, Hypothesis 1 (H1) is verified. Additionally, the level of TE is identified as a Granger cause of TCE and also influences DIF. Conversely, DIF is recognized as a Granger cause of the level of TE. At a significance level of α = 0.1, DIF is determined to be a Granger cause of CEI; thus, Hypothesis 2 (H2) is verified. Furthermore, at a significance level of α = 0.05, the level of TE is acknowledged as a Granger cause of DIF, and at a significance level of α = 0.5, it is also identified as a Granger cause of CEI.
The results of the Granger causality test suggest that both DIF and the level of TE play significant roles in explaining future variations in the TCE, as well as elucidating future changes in CEI. Moreover, a clear causal relationship is revealed between DIF and the level of TE. This finding lays the groundwork for further investigation into the direct and indirect mechanisms through which DIF impacts carbon emissions.

5.3. Impulse Response

The impulse response plots for DIF, TE, TCE, and CEI shown in Figure 3, Figure 4, Figure 5 and Figure 6 were generated through a Monte Carlo simulation conducted 10,000 times. The horizontal axis represents the number of lag periods per year for the shocks, extending over a duration of 10 years, while the vertical axis reflects the magnitude of the responses of the other variables. The solid line delineates the curve of the response function.
Figure 3 shows the impulse response of DIF to DIF, TE, TCE, and CEI. Initially, the influence of DIF on its own trajectory is markedly positive, then gradually turns negative, followed by a brief fluctuation around zero. The response value eventually stabilizes and approaches zero. This result suggests that the advancement of DIF exhibits a degree of inertia, which is consistent with economic theory. Specifically, the growth of DIF fosters technological advancement; however, in the short term, the progression of DIF may hinder improvements in TE levels due to certain resource allocation challenges. This could be related to the cyclical nature of technological diffusion, as DIF might prioritize support for technologies that can yield returns quickly, potentially overlooking long-term innovation. Additionally, the shift from a negative to a positive impact of DIF on carbon dioxide emissions may be related to the early stages of economic development, with environmental pressure increasing with economic growth, as indicated by the environmental Kuznets curve [45]. As seen in Figure 3, the initial impact of DIF on CEI is negative, suggesting that, in its early stages, DIF can promote the flow of resources to low-carbon areas. However, the impact later fluctuates upwards, indicating that the negative impact of DIF on CEI is not stable and requires further optimization of its operational mechanisms.
Figure 4 illustrates that in the initial stage, TE has a negative impact on TCE, but the effect is not significant and quickly approaches zero. The suppression of carbon dioxide emissions by TE may be related to the theory of technological diffusion cycles. TE contributes to reductions in carbon dioxide emissions by improving energy efficiency and promoting the use of clean energy technologies. The impact of TE on itself is a continuous self-reinforcement. While initial scientific and technological advancements can enhance TE, there exists a lag period during which new technologies require time to be assimilated and adapted, thereby affecting the trajectory of TE. This may be related to the technology lock-in effect. Furthermore, the impact of TE on DIF fluctuates around zero, but it is positive in the initial stage. This indicates that TE promotes the development of DIF by improving the efficiency and accessibility of financial services, which is consistent with the theory of technology diffusion cycles. Although the introduction of advanced technologies may initially hinder the progress of DIF, as these technologies mature, they are likely to evolve into a driving force for the advancement of DIF. The initial impact of TE leads to a positive response in CEI, indicating that in the early stages of TE, investment in new technologies may incur costs associated with research and development, as well as equipment updates, which do not significantly reduce CEI in the short term. Subsequently, the response fluctuates, showing that the impact of TE on CEI is not stable and continuous. As TE advances, technologies mature and may bring about energy-saving and emissions reduction effects, leading to a decrease in CEI.
Figure 5 shows that the impact of TCE on itself is significantly positive in the initial period, after which the impact decays to zero and lasts for a long time. This may be related to the energy rebound effect [46], whereby an increase in energy efficiency may lead to an increase in energy consumption, thereby offsetting some of the emission reduction effects. The impact of TCE on TE is negative at the initial stage, then fluctuates and approaches zero. In contrast, the impact of TCE on DIF initially shifts from positive to negative, experiences slight fluctuations, then stabilizes at zero.
As shown in Figure 6, after the initial impact, CEI tends to self-reinforce in the early stages, but as policy constraints gradually take effect, it adjusts in the opposite direction, eventually reaching a relatively stable state. CEI has a negative and unstable impact on TE, suggesting that the increase in CEI initially suppresses TE, while subsequent fluctuations indicate that, over time, the environmental pressure caused by high CEI drives the development of green technology. In the short term, CEI has a significant positive impact on DIF, which may mean that traditional industries with high CEI occupy a relatively large proportion in the economy. To meet market needs, DIF provides financial services to high-carbon enterprises, leading to an increase in DIF as CEI increases. However, in the long run, the impact decreases and eventually stabilizes.

6. Further Analysis and Discussion

6.1. Model Construction

To further investigate the impact of digital inclusive finance on reductions in carbon emissions and the mediating role of TE, this study applies a baseline regression model after PVAR model analysis. The models are constructed as follows:
T C E i t = α 30 + β 11 D I F i t + β 12 T E i t + j j β j control i t j + λ i + ε i t
C E I i t = α 40 + δ 21 D I F i t + δ 22 T E i t + j j β j control i t j + μ i + ϵ i t
In model (3) and model (4), i and t denote region and year, respectively, and c o n t r o l i t j represents a series of control variables. β represents the regression coefficients for the set of control variables; λ and μ are individual fixed effects; and ε and ϵ are random error terms.

6.2. Baseline Regression Results

Based on the above empirical results, this study further constructs a benchmark regression model to examine how DIF and TE levels impact reductions in both TCE and CEI. The regression results in Table 9 show that at the 5% significance level, regardless of the introduction of control variables, the regression coefficients of DIF and TE are negative, and the impact of TE on TCE is notably pronounced, which suggests that DIF plays a crucial role in mitigating TCE. Furthermore, advancements in TE can lead to an additional reduction in these emissions. This phenomenon can be attributed to the ability of DIF to ease the financial burden of research and development (R&D) investments for enterprises, expand financing avenues, and foster technological advancement. Concurrently, it contributes to reductions in offline service expenses and heightens public awareness regarding environmental issues, thereby further decreasing overall carbon emissions. Thus, H1 and H3 are verified.
The regression results presented in Table 10 show that the regression coefficient of TE is negative at the 5% level of significance, regardless of the introduction of control variables, which indicates that DIF can inhibit the intensity of carbon emission through the transmission path of increasing the TE. The reason is that DIF promotes economic development by improving the TE, and GDP growth is negatively correlated with CEI, so CEI declines. Additionally, DIF provides access to high-quality economic resources for SMEs, alleviating the financial constraints associated with R&D, and promotes the development of green and low-carbon technology, which can improve energy utilization efficiency and lead to reduced CEI. Thus, H4 is verified.

6.3. Spatial Heterogeneity Analysis

There are significant differences in economic development and levels of TE among Chinese provinces, which is largely due to their distinct geographical settings and the uneven spread of resources; as a result, the carbon emission profiles of these provinces also show notable differences. This paper divides the 30 sample provinces into eastern, central, and western regions and uses kernel density distribution curves to more intuitively describe the evolution of regional carbon emissions reduction [47], as shown in Figure 7, Figure 8 and Figure 9.
CEI analysis reveals notable trends based on the spatial distribution of data aggregation regions. The kernel density curves for the eastern and central regions exhibit a pattern characterized by a movement towards lower values, indicating a persistent decline in CEI in these areas. The eastern and central regions have made considerable progress in reducing carbon intensity. Furthermore, the morphology of the wave peaks is transitioning from a unimodal to a bimodal distribution, suggesting an increasing polarization effect among the provinces. This indicates an imbalance in carbon reduction efforts across different provinces. In contrast, the western region demonstrates relatively minor fluctuations in CEI, with a discernible widening of the disparities among the provinces. This suggests a need for the western region to enhance its energy structure, TE, and other methods of energy saving and carbon reduction, promoting more coordinated development.
The analysis of the positional shifts within the data aggregation area of TCE reveals minimal changes in the kernel density curves across the three major regions, indicating that TCE has remained relatively stable in recent years. This suggests potential imbalances and inadequacies in policy implementation in the central region. It is important for provinces to coordinate the movement of resources and allocation to promote green and low-carbon development. Notably, the shape of the kernel density curve for the central region is evolving from a unimodal distribution to a bimodal distribution, which indicates an increasing polarization among the provinces. Conversely, the kernel density curves for the eastern and western regions exhibit a transition from higher to lower peaks with an expansion in bandwidth, which signifies that the difference in TCE among provinces is increasing and there are varying levels of effectiveness in carbon emissions reduction efforts among provinces.
Furthermore, this paper regresses the inhibitory effects of DIF and TE on TCE and CEI to explore the impact of DIF and TE on regional carbon emissions reduction. The regression results are shown in Table 11.
As shown in Table 11, DIF in the central and western regions and the level of TE in the eastern and western regions are significant at the 1% level for TCE, while TE in the eastern region is significant at the 5% level for TCE. The development of DIF in the central and western regions and TE in the eastern region significantly inhibit TCE, while the development of TE in the western region positively affects TCE. In the central region, which has a favorable geographic location and is influenced by the eastern region, the development of DIF is faster than that in the western region, and the inhibiting effect of DIF on TCE is relatively better. The western region lags behind in the development of technology and consumes large amounts of energy at the early stage of development, with increased carbon emissions. Furthermore, its DIF development is still immature, financial exclusion and financial inhibition concepts may reduce the incentive effect of innovation in DIF, and the inhibition effect of DIF on TCE is weaker. The eastern region, benefiting from superior policy frameworks and resource availability, is witnessing improvements in TE. The widespread promotion of green environmental protection concepts has also contributed to a reduction in TCE during its rapid development phase.
As shown in Table 12, DIF in the eastern and central regions, along with TE in the central and western regions, has a significant impact on CEI at the 1% significance level, and TE in the eastern region significantly affects CEI at the 5% level. Notably, the level of DIF in the eastern region, as well as TE in both the eastern and western regions, is positively correlated with CEI. Simultaneously, TE in the western region has a greater effect on CEI than that in the eastern region. This disparity can be attributed to the relatively underdeveloped economic and policy frameworks in the western region, where initial investments in TE tend to exacerbate CEI due to inefficient resource utilization and other factors. The eastern region has a higher level of economic development and openness, and the development of DIF, as well as scientific and technological innovation, is relatively mature, so the disparities in CEI among different provinces are gradually diminishing. In the central region, the recent transfer of numerous industries has spurred significant economic growth across provinces, and the differences in carbon emission intensity among provinces has gradually narrowed during the development process.

7. Conclusions

DIF plays a crucial role in carbon emissions reduction by fostering economic growth and advancing TE, which, in turn, optimizes the approach to carbon reduction. This study presents empirical evidence to support this notion. The analysis and findings not only aid in the realization of carbon peak and carbon neutrality objectives but also facilitate a balance between economic development and ecological conservation.
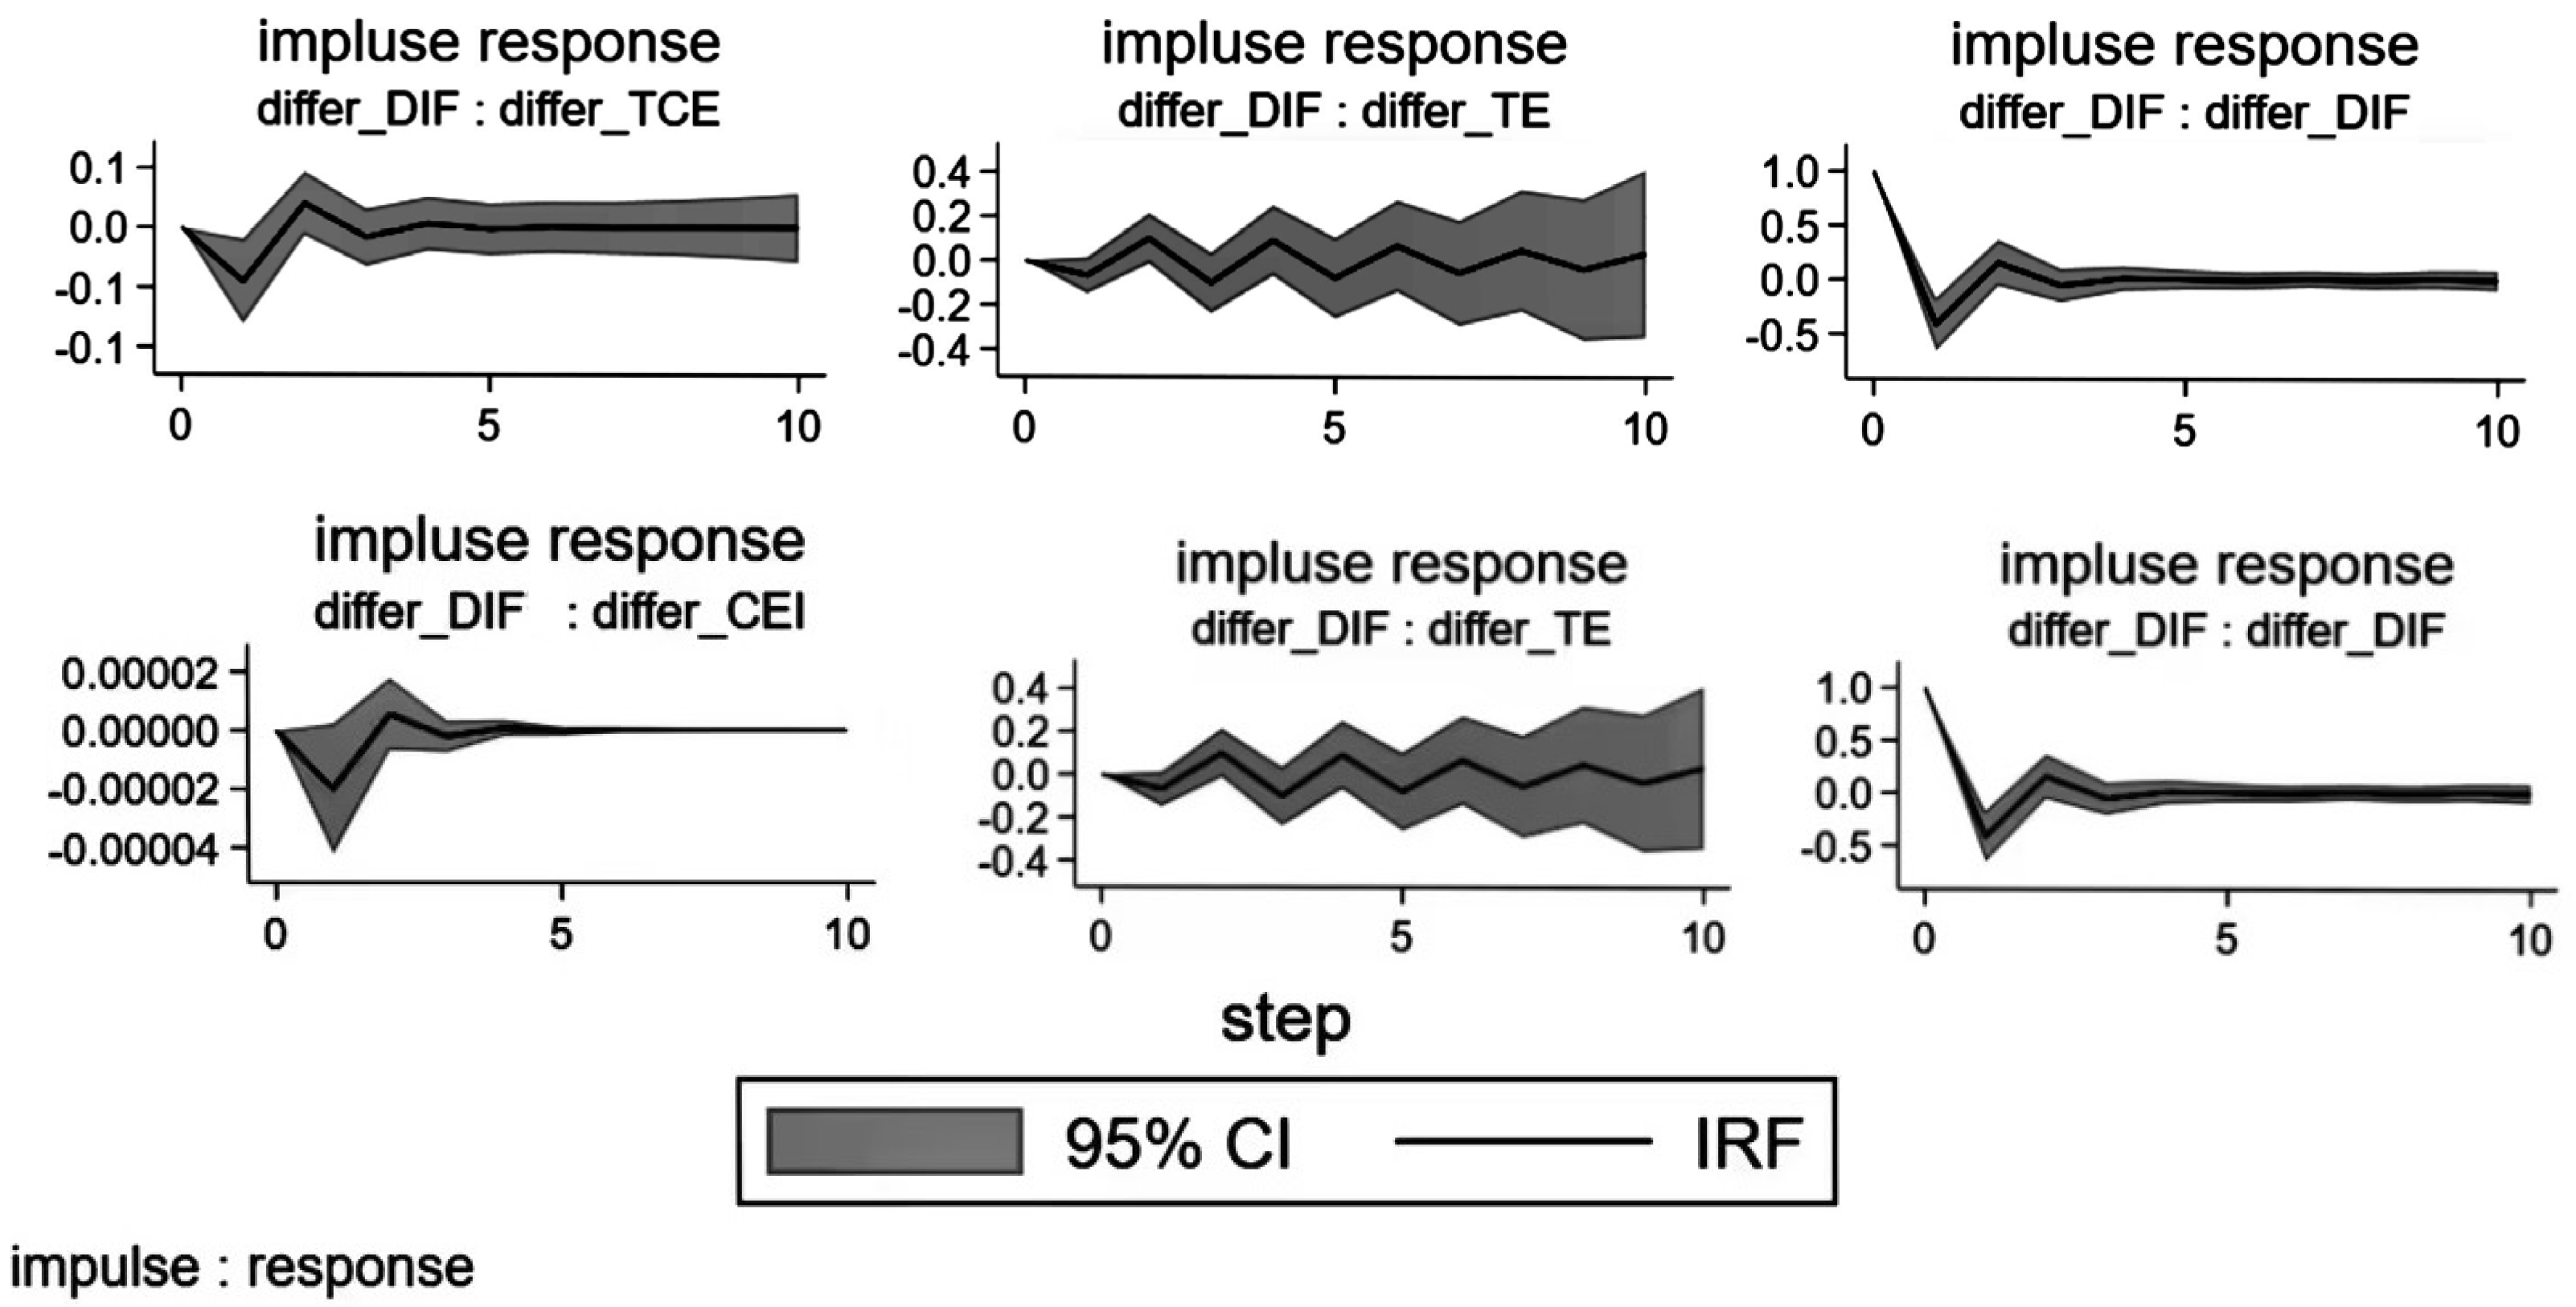
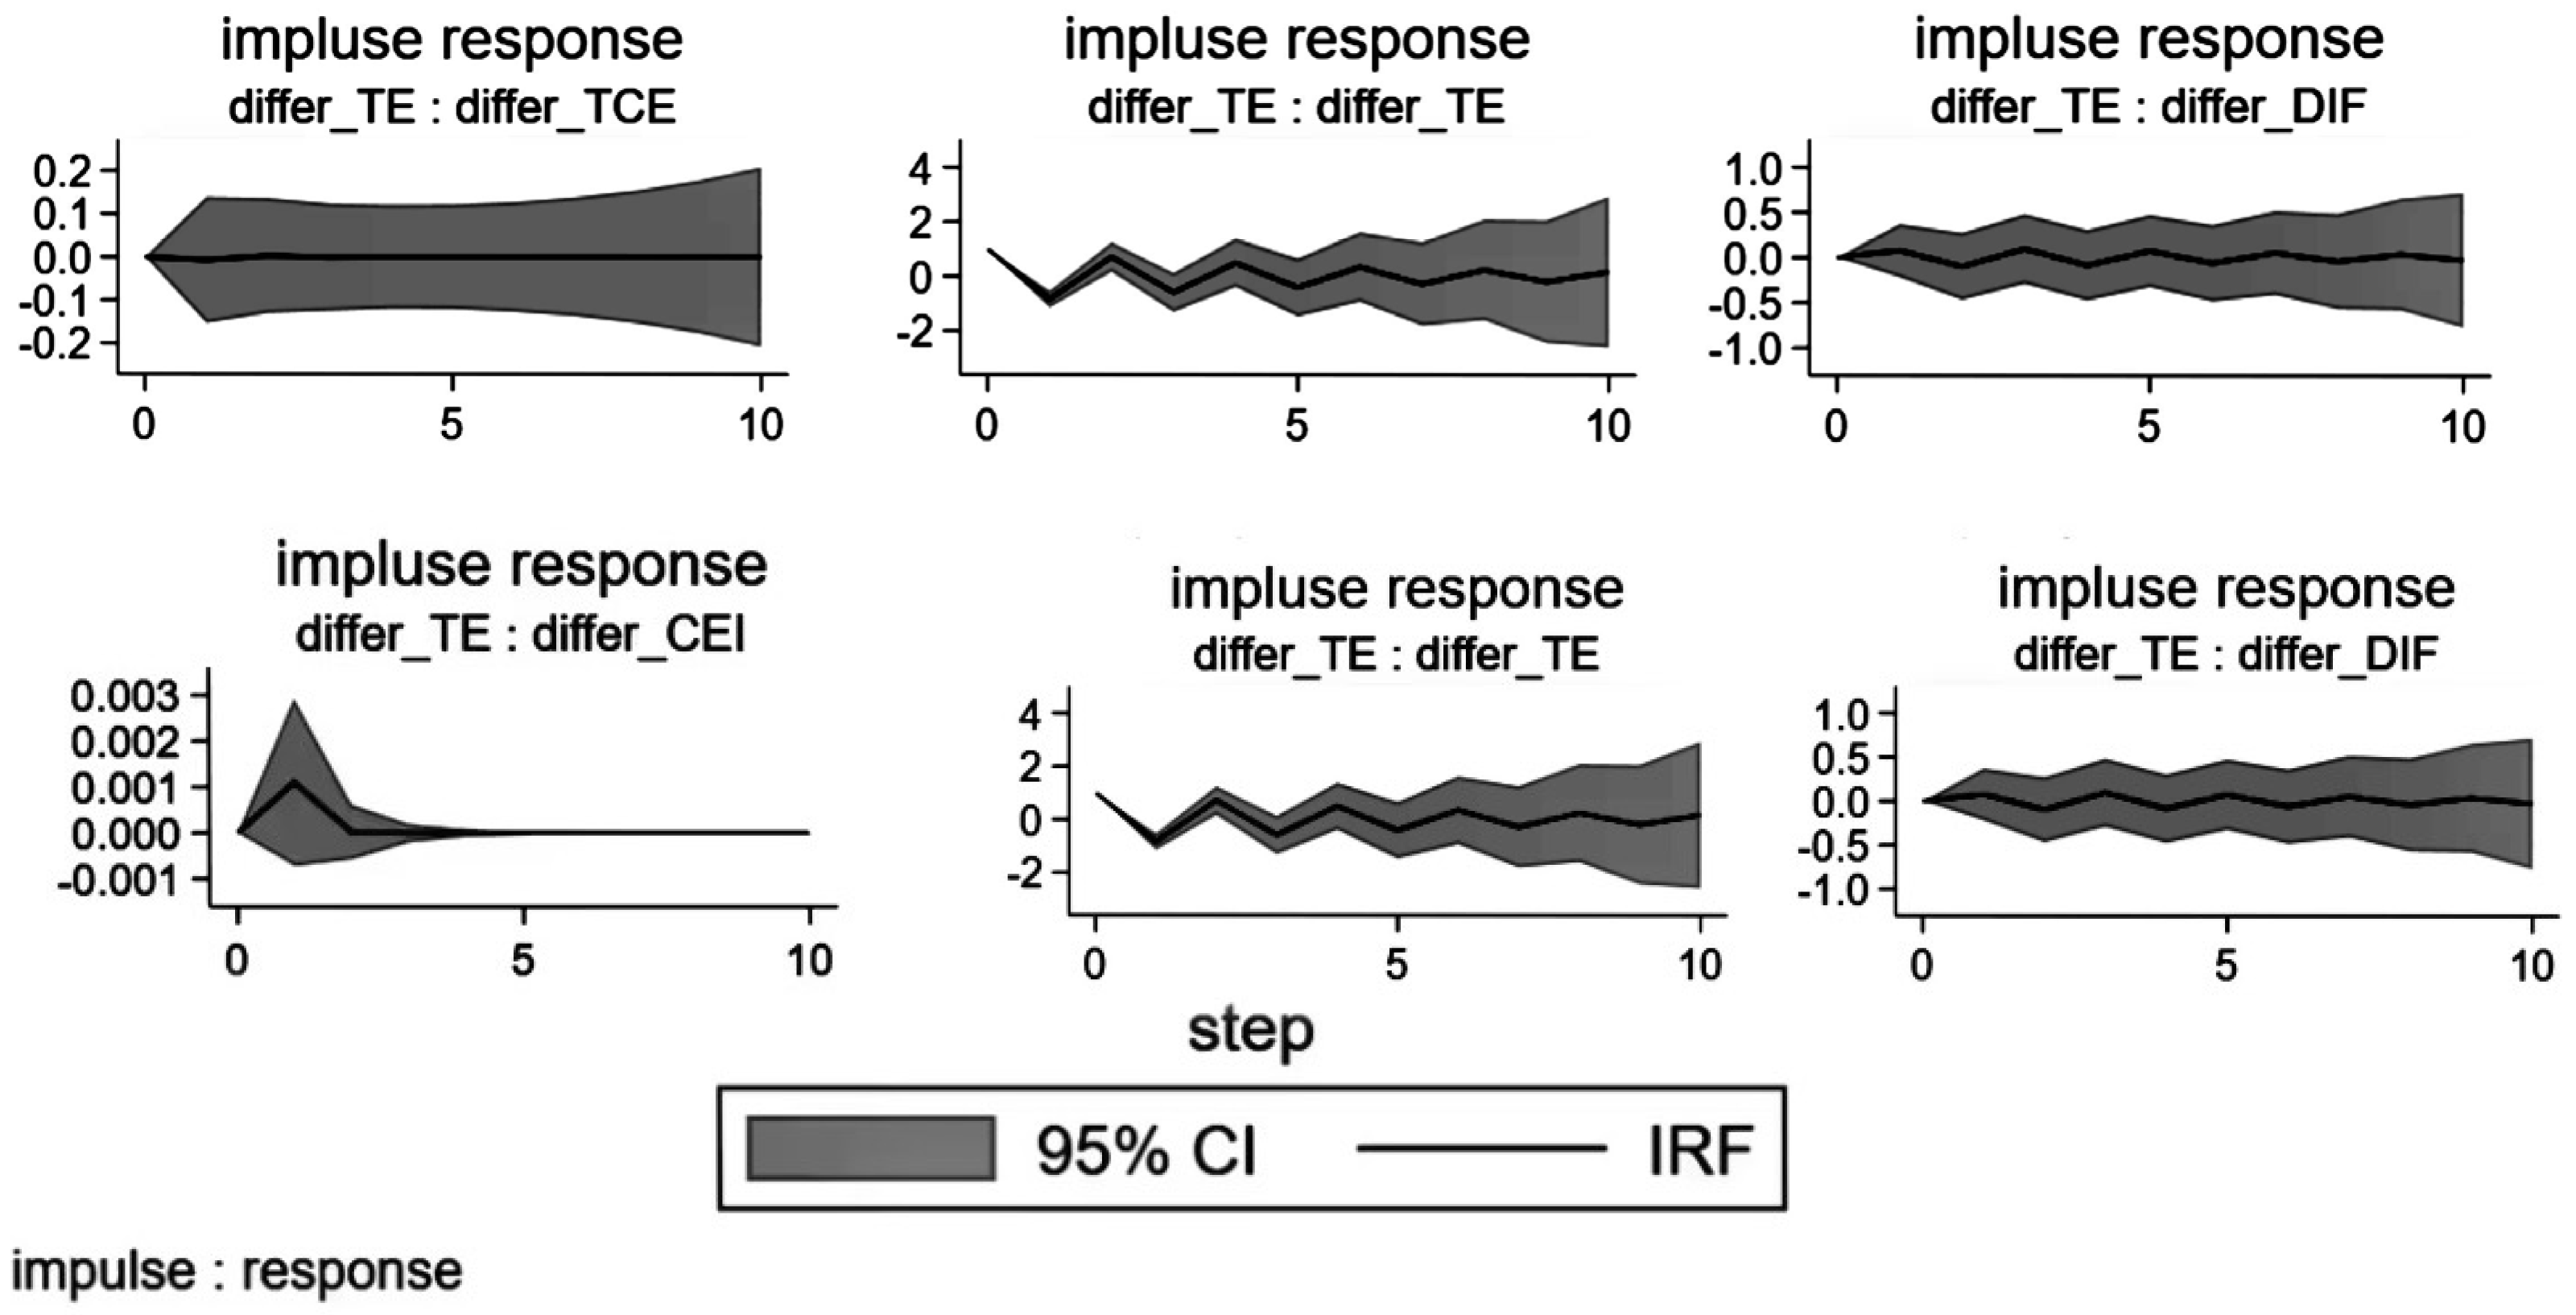
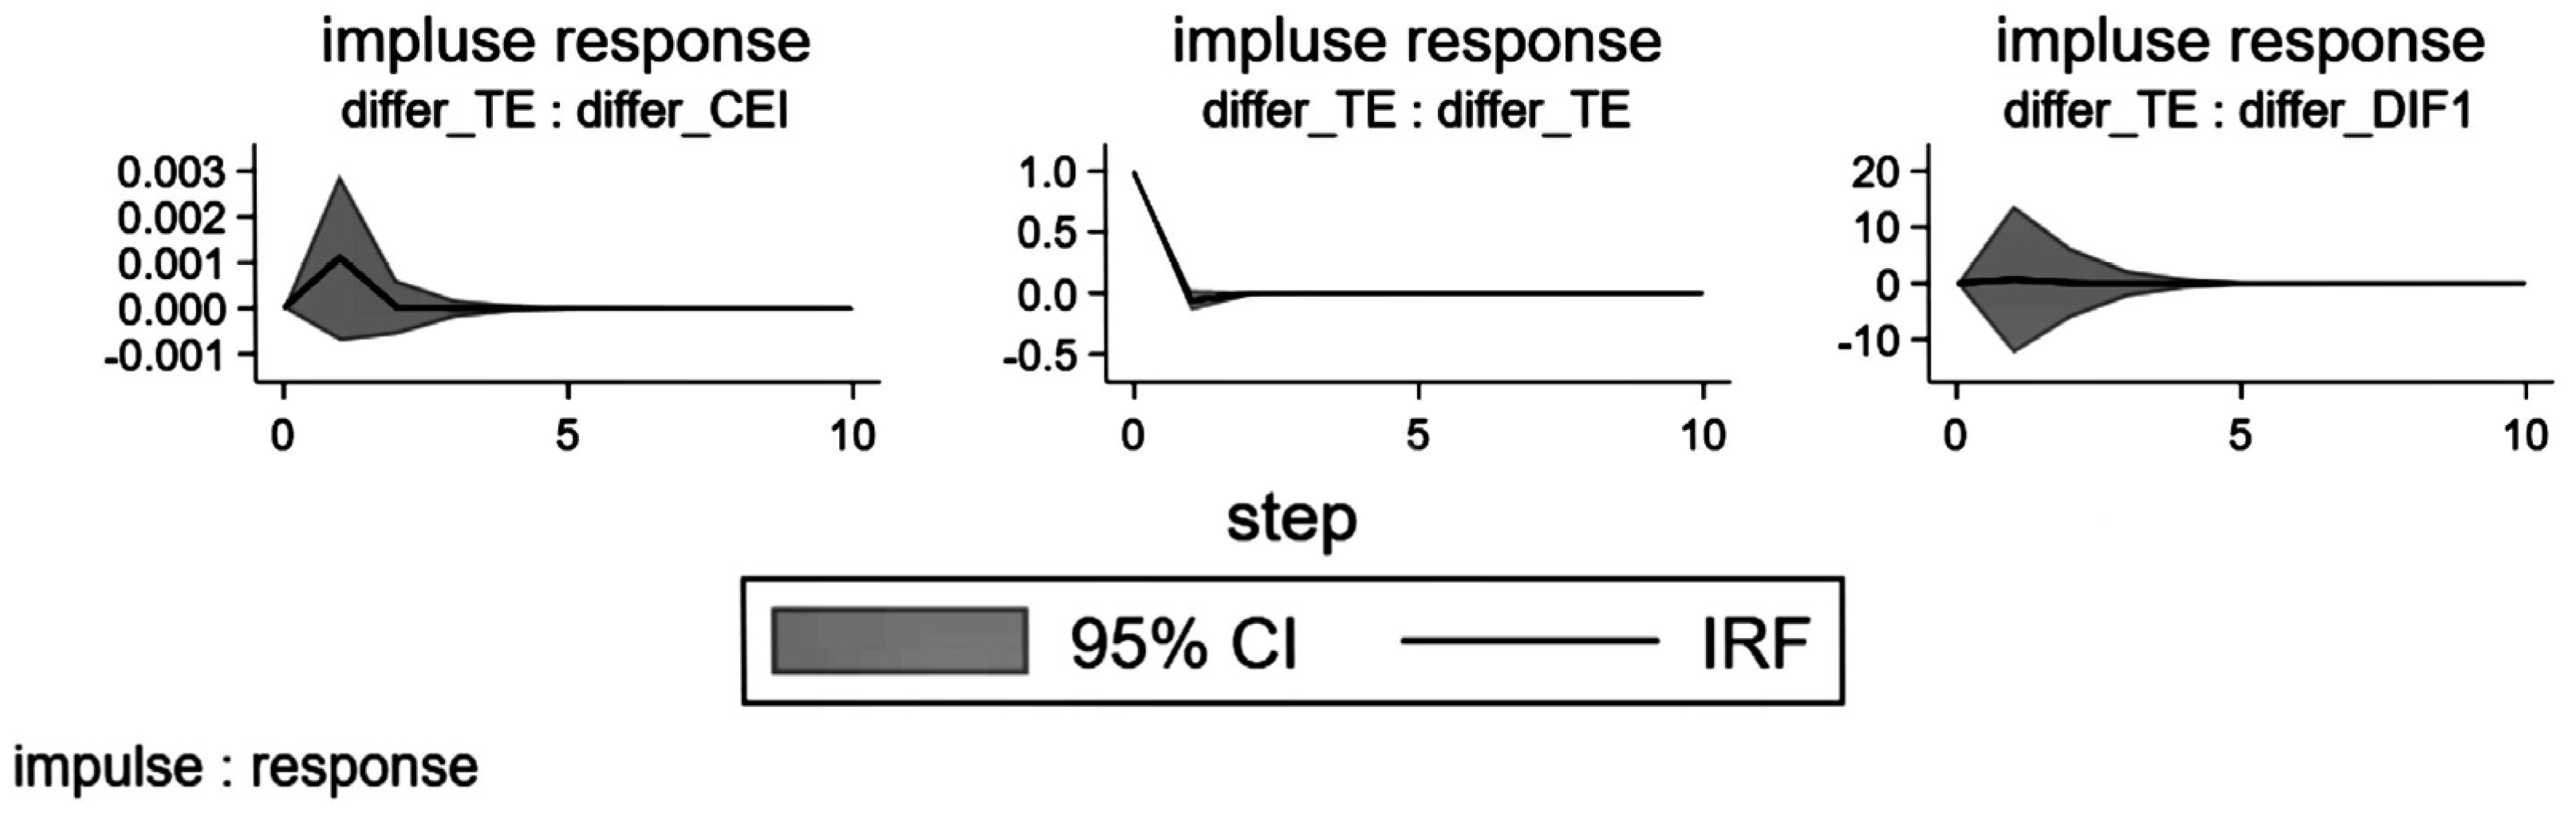
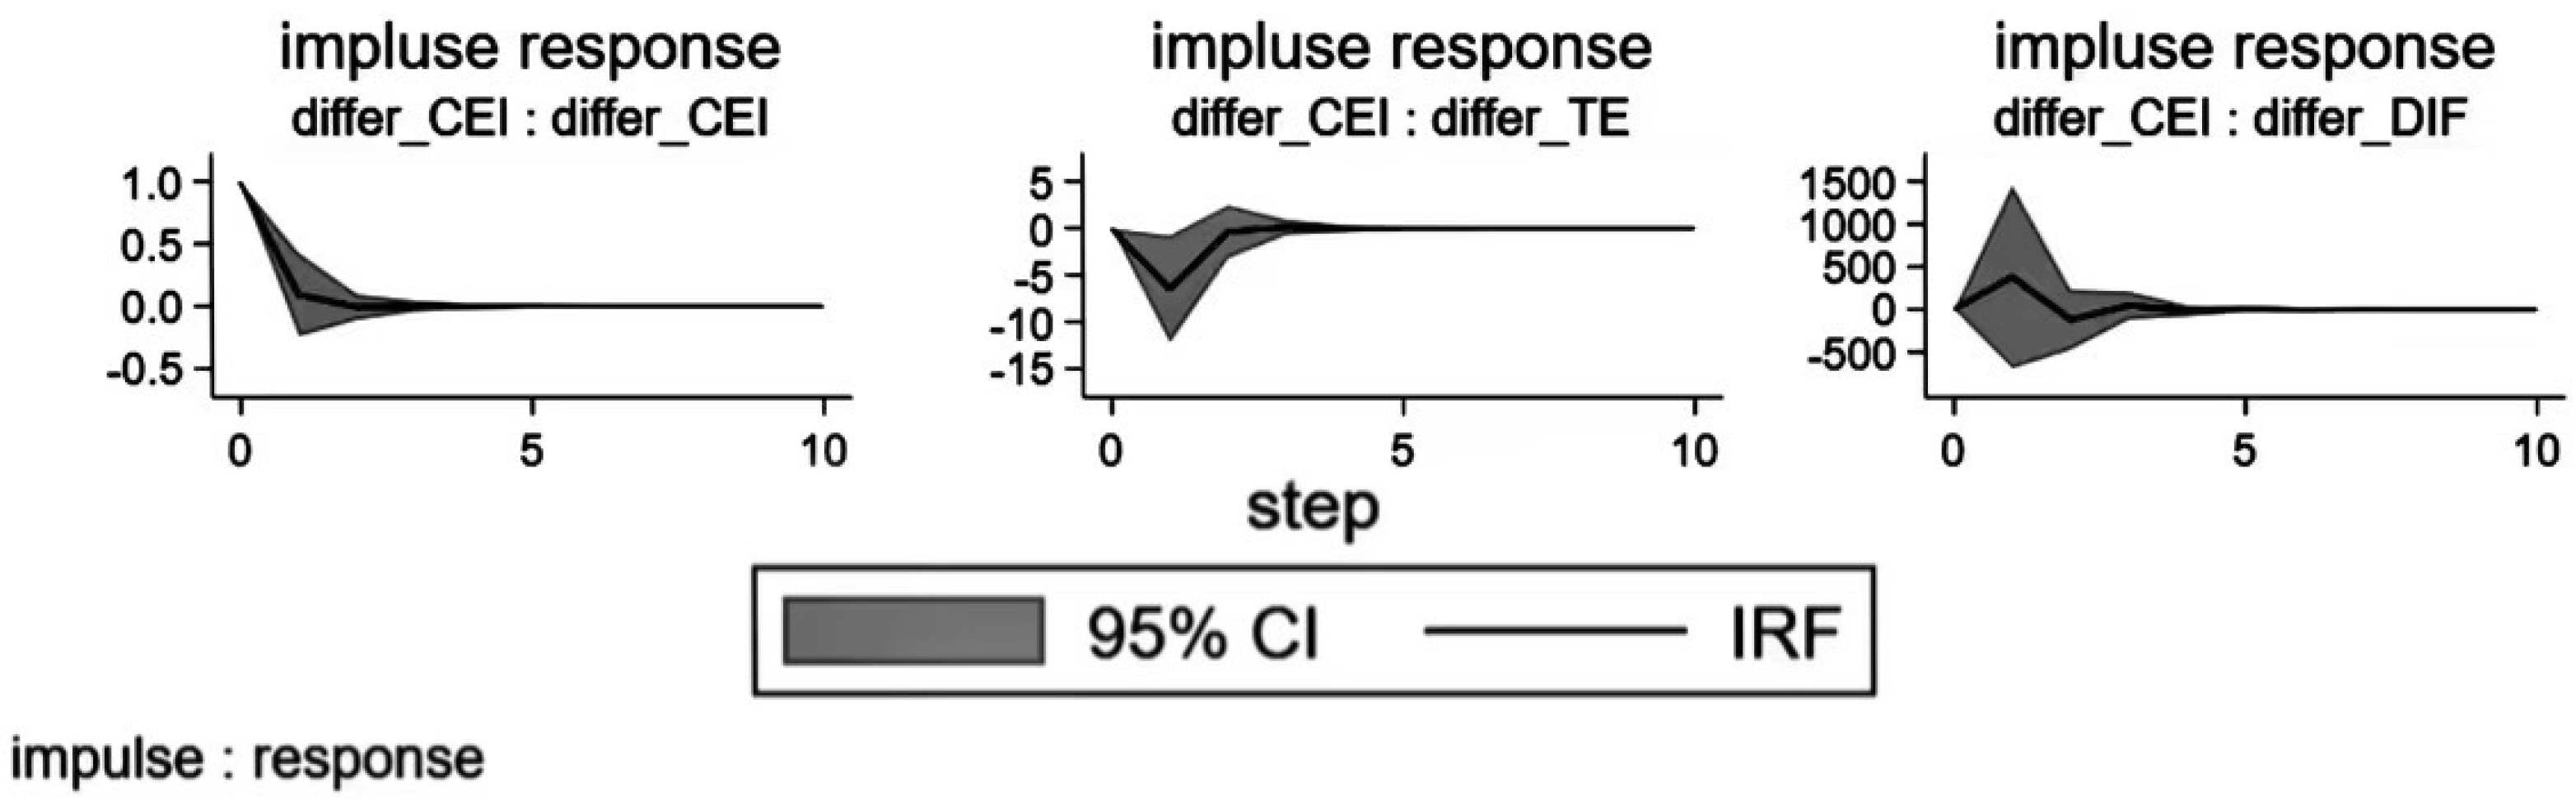
This study concludes that DIF has a direct inhibitory effect on both TCE and CEI, which is consistent with the research findings of Shahbaz et al. and Boutabba [7,8]. However, Awan et al. have shown that the influence of digital inclusive finance on carbon emissions follows an initial promotion, followed by inhibition, forming a U-shaped pattern [10]. This discrepancy might be attributed to variations in the time frames of the samples used in these studies. Secondly, the TE positively influences the dual control of carbon emissions, aligning closely with the research outcomes of Wu Ye et al. regarding the impact of TE on carbon emissions [
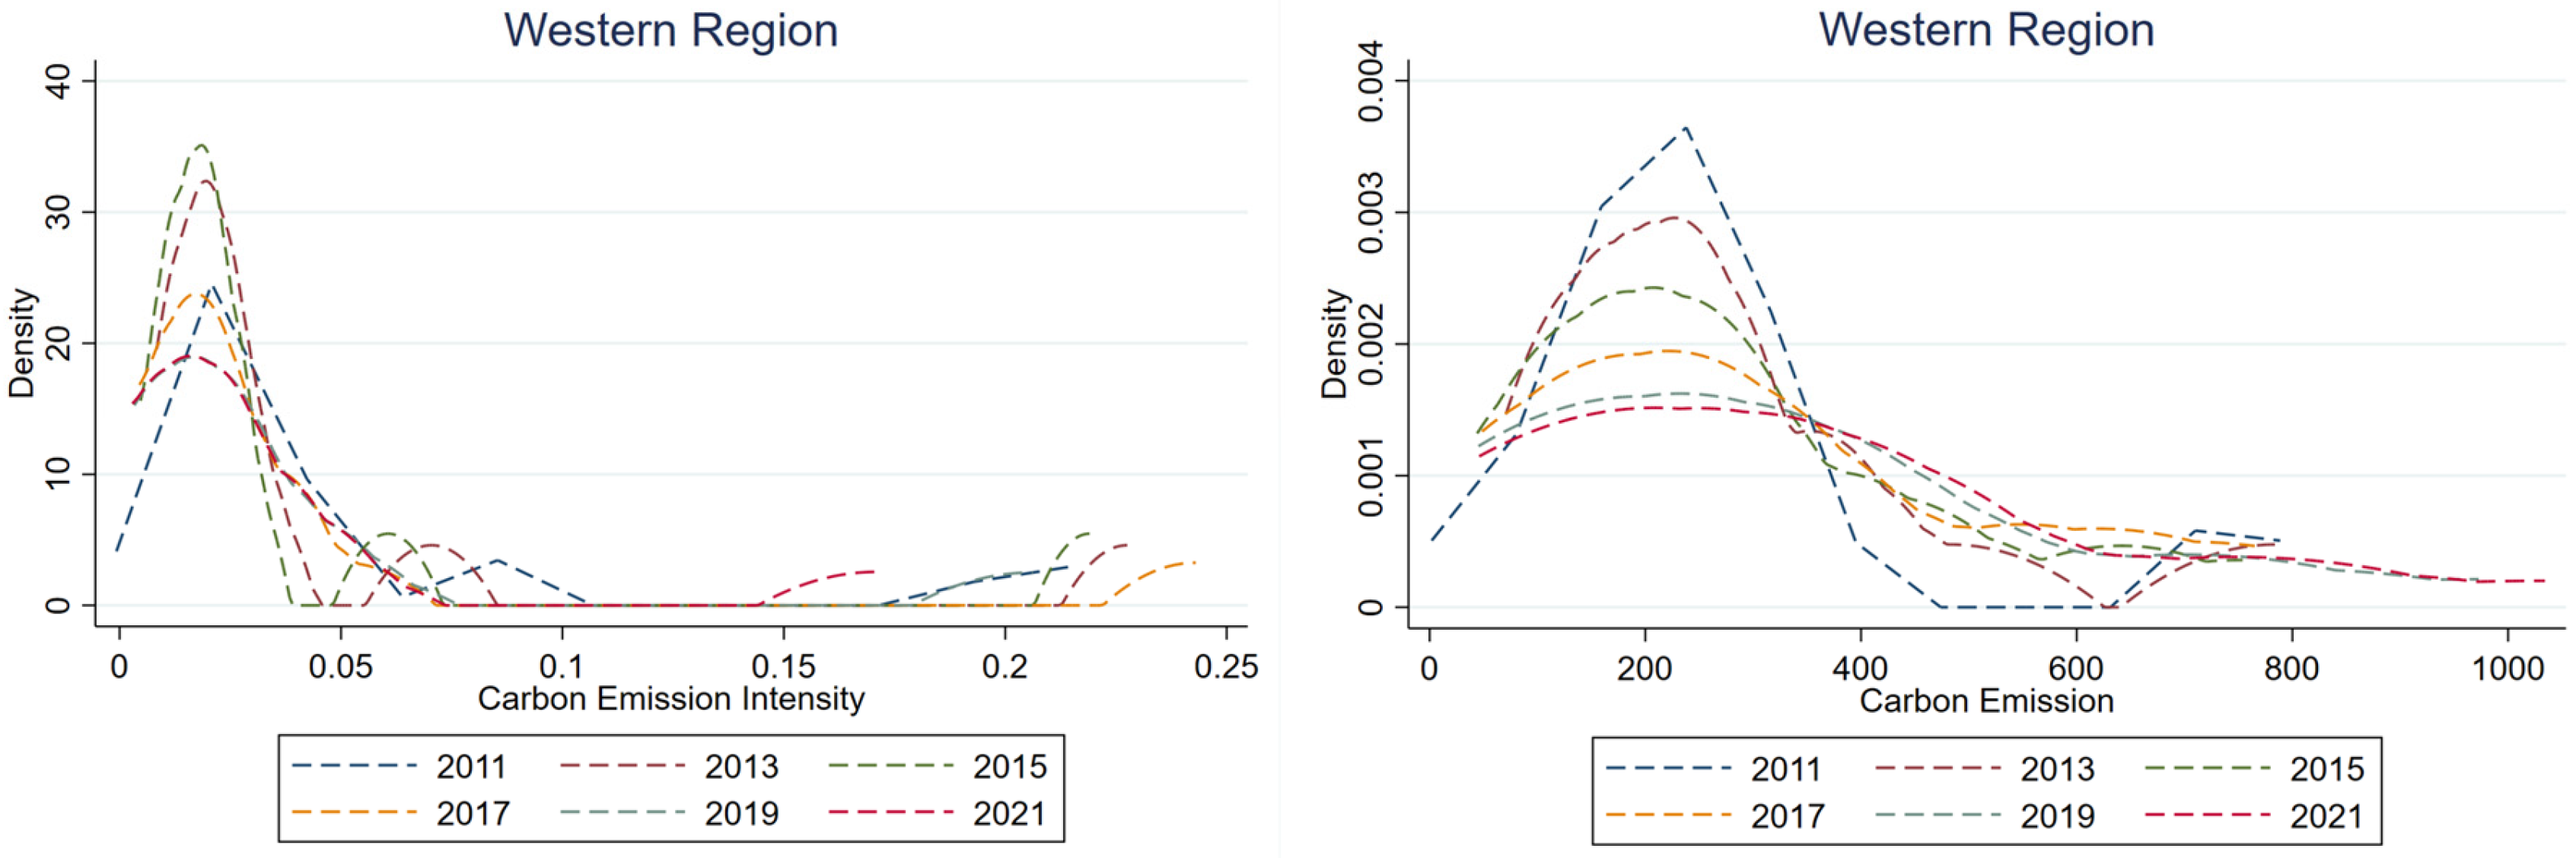
48]. Thirdly, analysis of Granger causality reveals that DIF promotes TE, suggesting that TE may be a critical factor in mediating the impact of DIF on TCE and CEI. The mechanism through which DIF affects TCE and CEI is mediated. The inhibitory effect of DIF on carbon emission operates through two primary channels: first, it directly reduces both TCE and CEI, and it enhances the TE, which, in turn, amplifies the inhibitory effect on carbon emissions. Consequently, DIF can optimize the pathway to carbon emissions reduction by fostering TE, thereby exerting a more substantial inhibitory effect on carbon emissions. Furthermore, a heterogeneity analysis conducted by categorizing the 30 provinces into three regions of east, central, and west reveals that the degree of inhibition varies according to the distinct economic development and TE levels in each region. The central region is affected by the spillover effect of the eastern region, and DIF has the greatest impact on TCE; TE in the western region has a greater impact on CEI than that in the eastern region, and the difference in CEI between provinces shows a trend of gradual reduction in the development process, which is basically consistent with the regional analysis results of Lu.Y et al. [
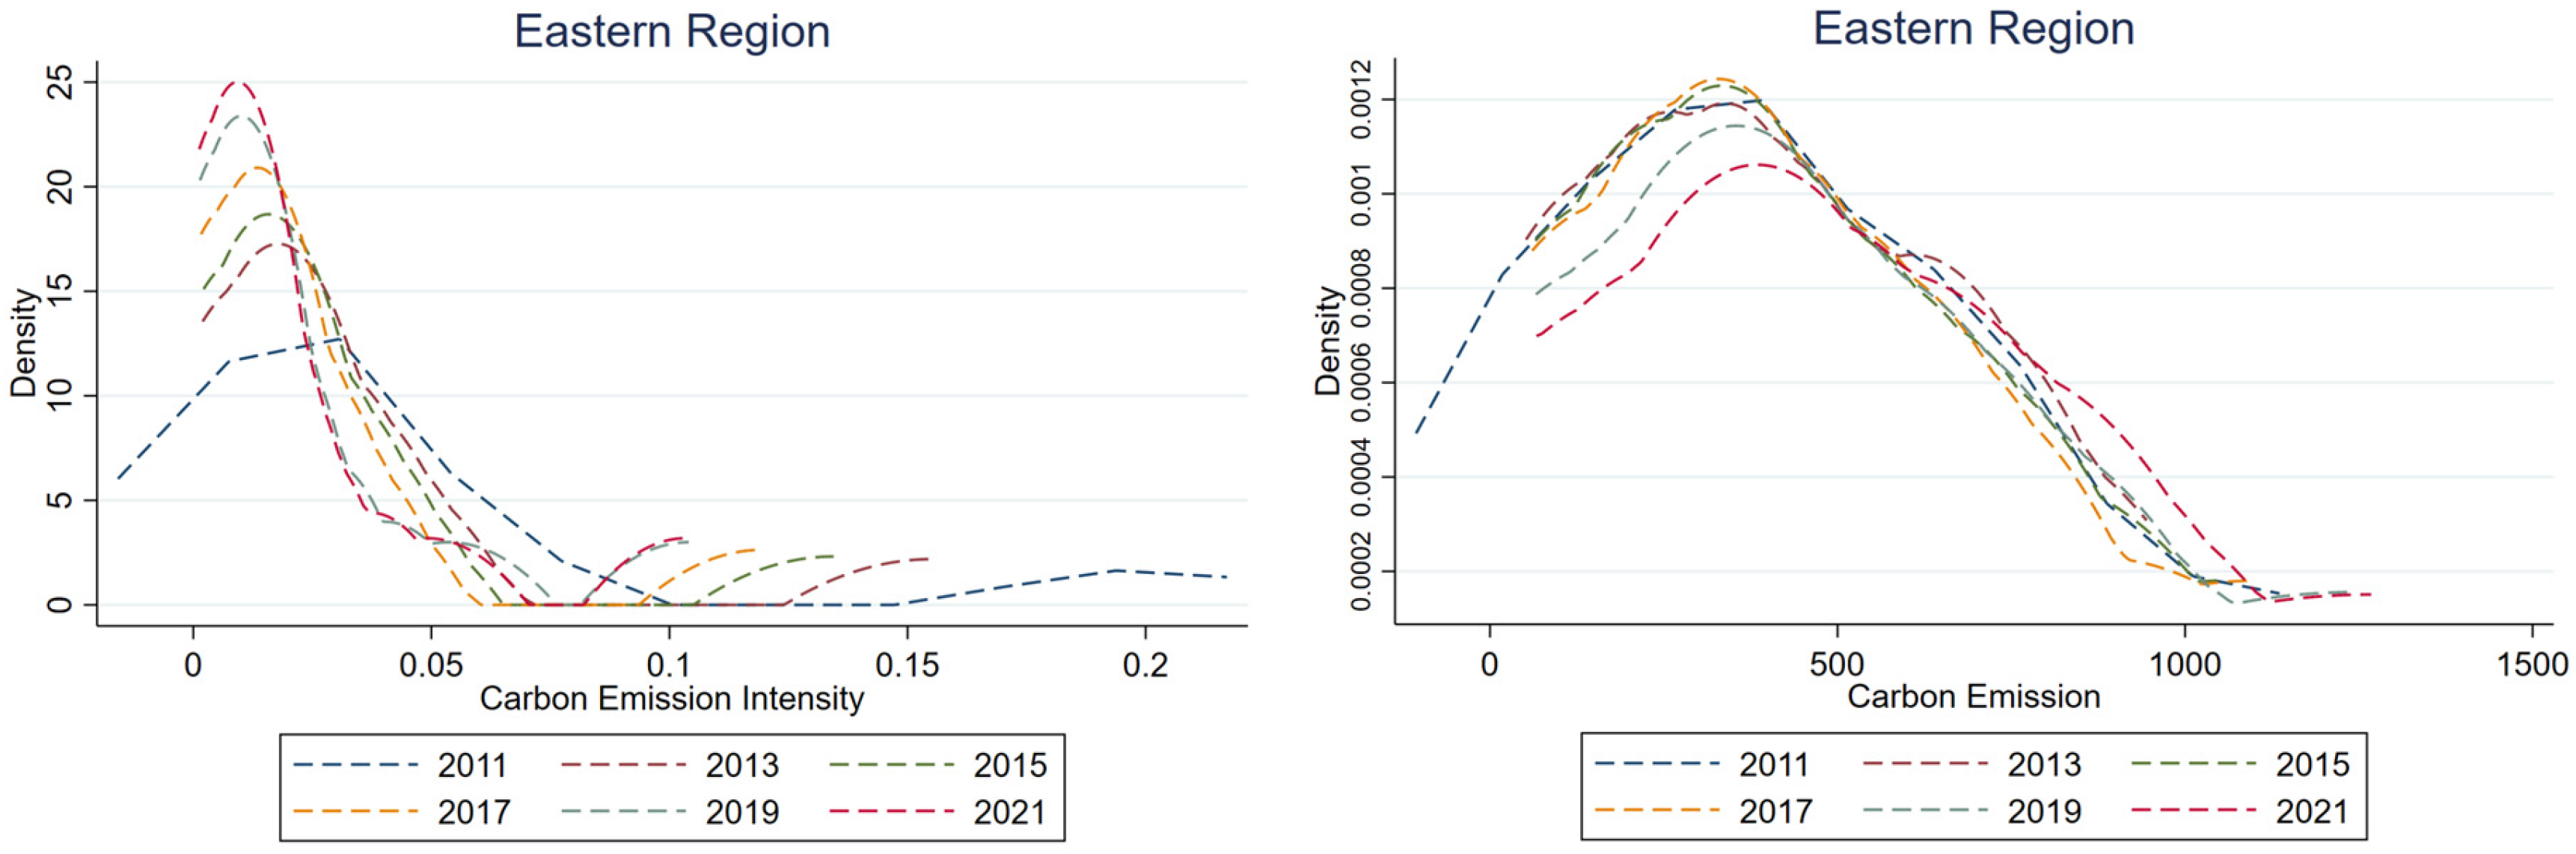
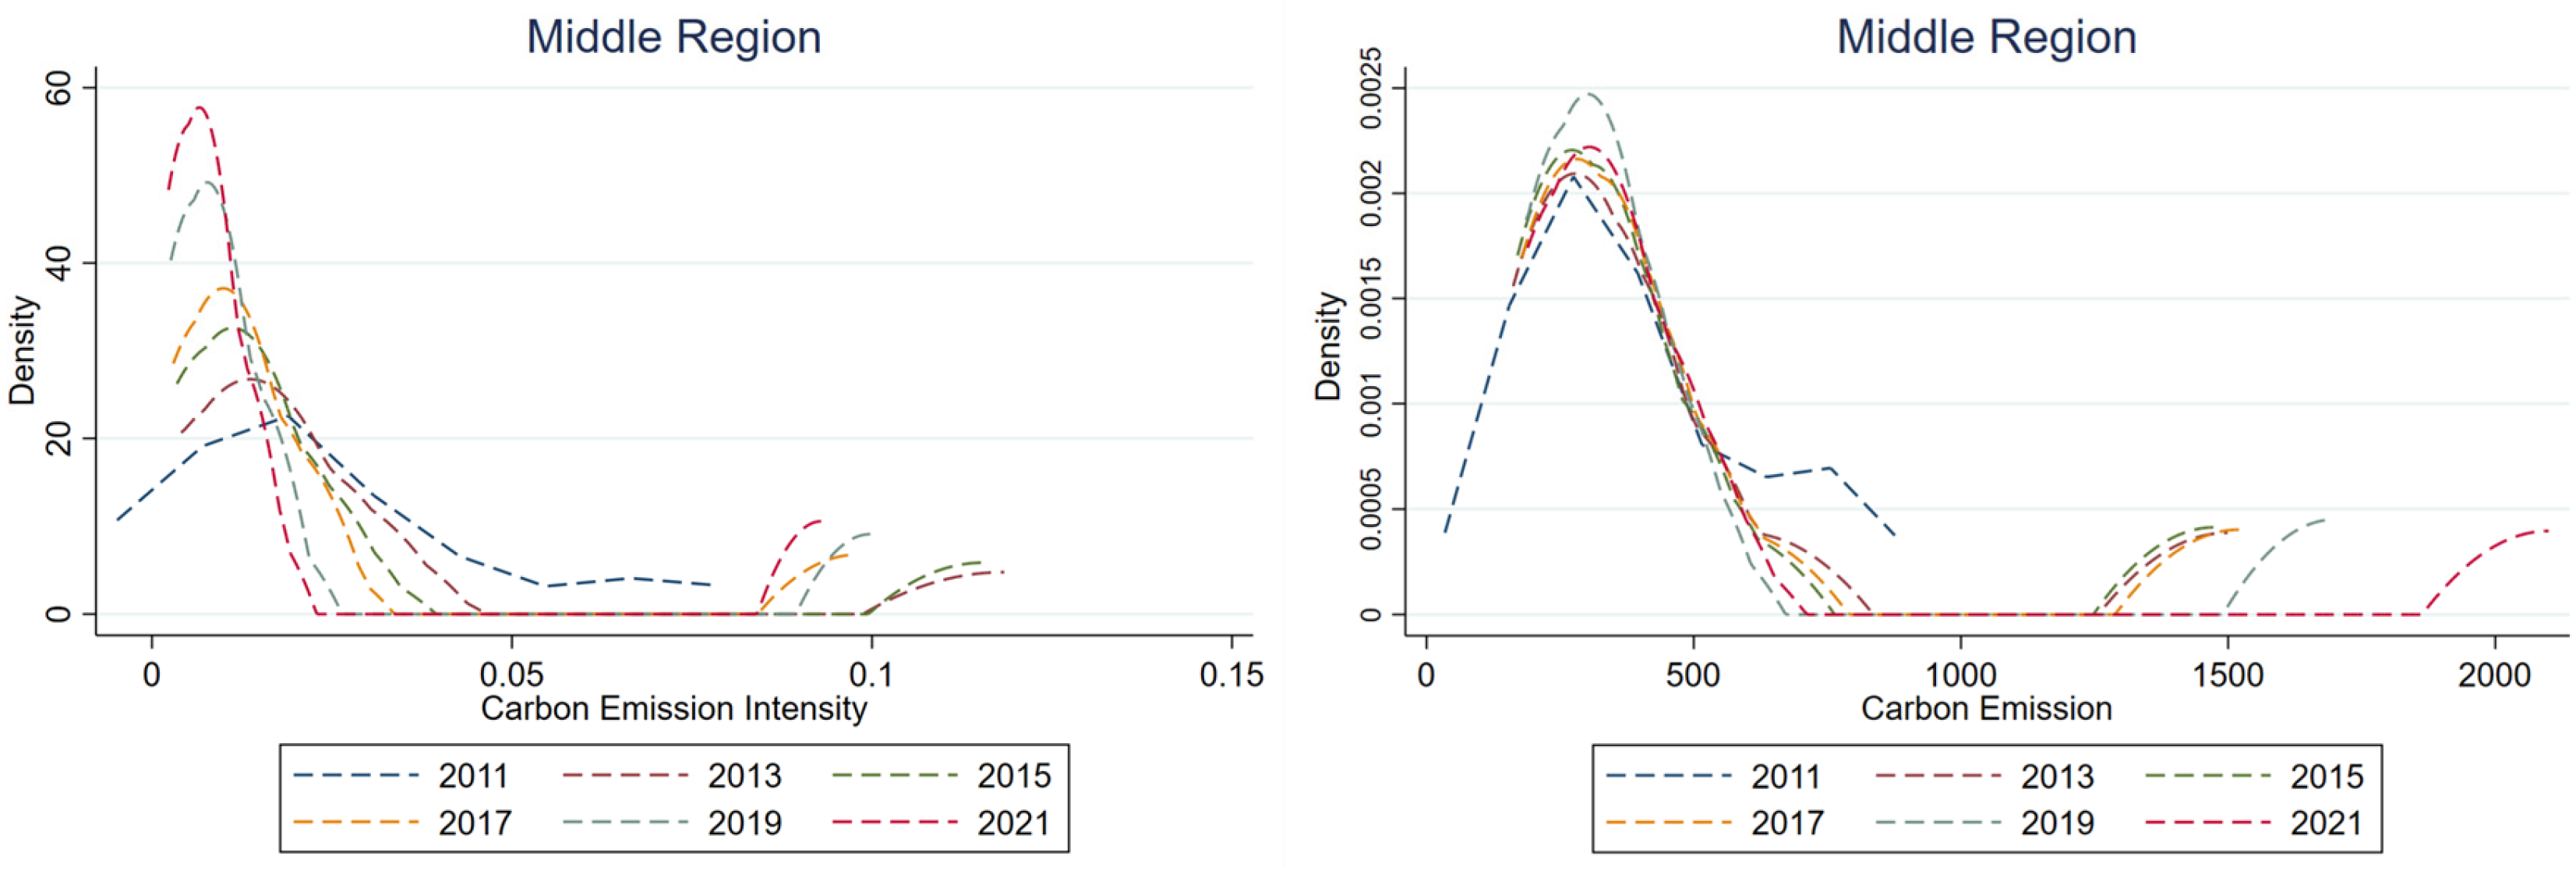
49].
This paper proposes three recommendations based on the conclusion. First, it is imperative to capitalize on advancements in DIF and expedite its development. On the one hand, financial institutions can leverage digital technology to lower the barriers for the general public to access financial services, thereby better serving SMEs and individuals. On the other hand, DIF contributes reductions in carbon emissions, which significantly impact industrial structure upgrading and industrial integration. Furthermore, the harmonious development of DIF and TE should be fostered. DIF can increase investment in green technological research and development and formulate corresponding financial policies to promote TE, thereby contributing to the optimization of the path of carbon emissions reduction. Additionally, establishing an information sharing mechanism between TE and financial services enables financial institutions to stay updated on the progress and needs of green technology projects, accurately allocate financial resources, and enhance the efficiency of financial support for green TE. Third, in the eastern region, where DIF is highly developed and CEI is low, it is essential to further leverage the advantages of digital technology to direct financial resources towards the research and application of low-carbon and zero-carbon technologies—for instance, by establishing specialized green finance funds and encouraging financial institutions to innovate in carbon finance. In the central and western regions, increasing investment in digital infrastructure is necessary to enhance the accessibility and coverage of financial services, thereby promoting local industrial development and structural transformation.
This paper focuses on DIF, TE, and regional carbon emissions within the same analytical framework against the backdrop of achieving the dual carbon goals. By establishing the PVAR model, it explores whether DIF and TE have the effects of improving the environment and promoting energy conservation from the perspective of the two dimensions of TCE and CEI, which broadens the understanding of the factors of carbon emissions reduction. Secondly, the Granger causality test reveals that the levels of DIF and TE not only predict future changes in TCE but also future changes in TCE. This finding establishes a basis for further research on how DIF directly and indirectly affects carbon emissions. Finally, through regression analysis, this study examines the inhibitory effect of DIF on carbon emissions and investigates the impact of regional variations in carbon emissions, offering a new theoretical perspective on the optimization of regional industrial structures and facilitating industrial transformation.
However, this paper still has limitations that provide valuable insights for future research. Firstly, variations in economic development and industrial structures across provinces in China can lead to missing or irregular data on the indicators. For instance, when calculating TCE, limitations in data collection may result in inconsistent statistical approaches across different provinces, which, to some extent, leads to the inaccuracy of the horizontal measurement results. Secondly, the study covers only 11 years from 2011 to 2021, which is a relatively small sample size and may introduce some bias in accurately assessing the impact on the dual carbon control targets. As more data are continuously added in the future, future analyses are expected to be more precise. Thirdly, this study finds that the inhibitory effect of DIF on carbon emissions exhibits regional heterogeneity. The analysis of spatial effects, either within a single country or across different countries, could be a potential necessity and direction for further research. Lastly, this paper indicates the need for further research on the impacts DIF and TE on carbon emissions under different time dimensions.

Author Contributions

J.L.: conceptualization, validation, and writing—review and editing; Y.S., X.W. and L.F: formal analysis, methodology, data curation, software, and writing—original draft preparation; X.W. and L.F.: investigation and visualization; J.L. and Y.S.: supervision and project administration. All authors have read and agreed to the published version of the manuscript.

Funding

This research was supported by Hangzhou City University (grant number X202401161).

Institutional Review Board Statement

Not applicable.

Informed Consent Statement

Not applicable.

Data Availability Statement

The authors confirm that the data supporting the findings of this study are available within the article.

Acknowledgments

The authors would like to thank Jiale Wang for her research ideas and enthusiastic assistance. The authors would like to thank the editors and anonymous reviewers for their thoughtful and constructive comments.

Conflicts of Interest

The authors declare no conflicts of interest.

References

  1. Wei, Y.G.; Li, Y.; Wu, M.Y.; Li, Y.B. The decomposition of total-factor CO2 emission efficiency of 97 contracting countries in Paris Agreement. Energy Econ. 2019, 78, 365–378. [Google Scholar] [CrossRef]
  2. Li, H.J.; Tian, H.; Liu, X.Y.; You, J.S. Transitioning to low-carbon agriculture: The non-linear role of digital inclusive finance in China’s agricultural carbon emissions. Hum. Soc. Sci. Commun. 2024, 11, 14. [Google Scholar] [CrossRef]
  3. Zhang, T.B. Which policy is more effective, carbon reduction in all industries or in high energy-consuming Industries?-From dual perspectives of welfare effects and economic effects. J. Clean. Prod. 2019, 216, 184–196. [Google Scholar] [CrossRef]
  4. Yao, F.G.; Tian, W.H.; Tan, L.P. The Impact of Digital Inclusive Finance on Urban Total Factor Carbon Emission Productivity. Commer. Res. 2022, 3, 112–121. [Google Scholar] [CrossRef]
  5. Hou, J. Research on the Impact of Digital Financial Inclusion on the Development of Low-Carbon Economy in China; Jiangxi University of Finance and Economics: Nanchang, China, 2023; Available online: https://link.cnki.net/doi/10.27175/d.cnki.gjxcu.2023.001098 (accessed on 28 February 2025).
  6. Ahmed, K.; Jahanzeb, A. Does financial development spur environmental and energy-related innovation in Brazil? Int. J. Financ. Econ. 2021, 26, 1706–1723. [Google Scholar] [CrossRef]
  7. Shahbaz, M.; Tiwari, A.K.; Nasir, M. The effects of financial development, economic growth, coal consumption and trade openness on CO2 emissions in South Africa. Energy Policy 2013, 61, 1452–1459. [Google Scholar] [CrossRef]
  8. Boutabba, M.A. The impact of financial development, income, energy and trade on carbon emissions: Evidence from the Indian economy. Econ. Model. 2014, 40, 33–41. [Google Scholar] [CrossRef]
  9. Dong, F.; Hu, M.Y.; Gao, Y.J.; Liu, Y.J.; Zhu, J.; Pan, Y.L. How does digital economy affect carbon emissions? Evidence from global 60 countries. Sci. Total Environ. 2022, 852, 14. [Google Scholar] [CrossRef]
  10. Awan, A.; Abbasi, K.R.; Rej, S.; Bandyopadhyay, A.; Lv, K.J. The impact of renewable energy, internet use and foreign direct investment on carbon dioxide emissions: A method of moments quantile analysis. Renew. Energy 2022, 189, 454–466. [Google Scholar] [CrossRef]
  11. Hu, Z.Y.; Li, Y. Dual Effects and Threshold Characteristics of Financial Development on Environmental Pollution. China Soft Sci. 2019, 7, 68–80. [Google Scholar] [CrossRef]
  12. Sun, H.P.; Chen, T.T.; Wang, C.N. Spatial impact of digital finance on carbon productivity. Geosci. Front. 2024, 15, 15. [Google Scholar] [CrossRef]
  13. Kim, D.H.; Wu, Y.C.; Lin, S.C. Carbon dioxide emissions and the finance curse. Energy Econ. 2020, 88, 16. [Google Scholar] [CrossRef]
  14. Li, J.; Wu, Y.; Xiao, J.J. The impact of digital finance on household consumption: Evidence from China. Econ. Model. 2020, 86, 317–326. [Google Scholar] [CrossRef]
  15. Wang, H.L.; Guo, J.G. Impacts of digital inclusive finance on CO2 emissions from a spatial perspective: Evidence from 272 cities in China. J. Clean. Prod. 2022, 355, 18. [Google Scholar] [CrossRef]
  16. Lee, C.C.; Wang, F.H. How does digital inclusive finance affect carbon intensity? Econ. Anal. Policy 2022, 75, 174–190. [Google Scholar] [CrossRef]
  17. Ma, K.L. Digital inclusive finance and corporate green technology innovation. Financ. Res. Lett. 2023, 55, 10. [Google Scholar] [CrossRef]
  18. Shahbaz, M.; Li, J.M.; Dong, X.C.; Dong, K.Y. How financial inclusion affects the collaborative reduction of pollutant and carbon emissions: The case of China. Energy Econ. 2022, 107, 16. [Google Scholar] [CrossRef]
  19. Altintas, H.; Kassouri, Y. The impact of energy technology innovations on cleaner energy supply and carbon footprints in Europe: A linear versus nonlinear approach. J. Clean. Prod. 2020, 276, 16. [Google Scholar] [CrossRef]
  20. Abbasi, K.R.; Adedoyin, F.F.; Abbas, J.; Hussain, K. The impact of energy depletion and renewable energy on CO2 emissions in Thailand: Fresh evidence from the novel dynamic ARDL simulation. Renew. Energy 2021, 180, 1439–1450. [Google Scholar] [CrossRef]
  21. Lin, B.Q.; Zhu, J.P. The role of renewable energy technological innovation on climate change: Empirical evidence from China. Sci. Total Environ. 2019, 659, 1505–1512. [Google Scholar] [CrossRef]
  22. Zhang, M.L.; Liu, Y. Influence of digital finance and green technology innovation on China’s carbon emission efficiency: Empirical analysis based on spatial metrology. Sci. Total Environ. 2022, 838, 15. [Google Scholar] [CrossRef] [PubMed]
  23. Aslam, B.; Hu, J.S.; Shahab, S.; Ahmad, A.; Saleem, M.; Shah, S.S.A.; Javed, M.S.; Aslam, M.K.; Hussain, S.; Hassan, M. The nexus of industrialization, GDP per capita and CO2 emission in China. Environ. Technol. Innov. 2021, 23, 14. [Google Scholar] [CrossRef]
  24. Yuelan, P.; Akbar, M.W.; Zia, Z.; Arshad, M.I. Exploring the nexus between tax revenues, government expenditures, and climate change: Empirical evidence from Belt and Road Initiative countries. Econ. Change Restruct. 2022, 55, 1365–1395. [Google Scholar] [CrossRef]
  25. Wang, W.W.; Gao, P.P.; Wang, J.H.R. Nexus among digital inclusive finance and carbon neutrality: Evidence from company-level panel data analysis. Resour. Policy 2023, 80, 5. [Google Scholar] [CrossRef]
  26. Hamdi, H.; Sbia, R.; Shahbaz, M. The nexus between electricity consumption and economic growth in Bahrain. Econ. Model. 2014, 38, 227–237. [Google Scholar] [CrossRef]
  27. Wang, K.; Zeng, Q.Q.; Gan, C.; Guan, Y. The impact of digital financial development on carbon emission intensity of tourism industry. J. Fujian Agric. For. Univ. (Philos. Soc. Sci.) 2023, 26, 68–76. [Google Scholar] [CrossRef]
  28. Cui, G.R. Research on the Influence of digital inclusive finance on new quality productive forces. Collect. Essays Financ. Econ. 2024, 1–16. [Google Scholar] [CrossRef]
  29. Zeng, L.E.; Xie, D.Y.; Chen, Z.Y.; Yuan, D.D.; Nie, Y.; Huang, Q.; Yang, L.; Liang, Z.Q. How Does Digital Inclusive Finance Affect Energy Carbon Emission Efficiency in China? Analysis Based on Mediation Effect Model. Acta Sci. Nat. Univ. Pekin. 2023, 1–15. [Google Scholar] [CrossRef]
  30. Ye, J.; Xu, W.; Hu, L. Digital inclusive finance, consumption structure upgrading and carbon emissions. Front. Environ. Sci. 2023, 11, 1282784. [Google Scholar] [CrossRef]
  31. Wu, H.Y.; Yin, Y.K.; Li, G.X.; Ye, X.X. Digital finance, capital-biased and labor-biased technical progress: Important grips for mitigating carbon emission inequality. J. Environ. Manag. 2024, 371, 123198. [Google Scholar] [CrossRef]
  32. Zhang, H.T.; Sun, X.M.; Ahmad, M.; Wang, X.Y. Heterogeneous impacts of carbon emission trading on green innovation: Firm-level in China. Energy Environ. 2024, 35, 3504–3529. [Google Scholar] [CrossRef]
  33. Sheng, C.G.; Sun, X.T.; Li, J.Y. Research on the Influence Effect of Coupling and Coordinating Green Credit and Carbon Trading to Promote Green Technology Innovation. Bus. Econ. 2025, 02, 150–154. [Google Scholar] [CrossRef]
  34. Bu, Y.; Gao, J.C.; Zhang, W.; Ai, M.Y. The impact of digital inclusive finance on the collaborative reduction of pollutant and carbon emissions: Spatial spillover and mechanism analysis. J. Environ. Manag. 2024, 365, 121550. [Google Scholar] [CrossRef] [PubMed]
  35. Wang, Y.F.; Zhao, Z.H.; Zhang, S.Q.; Su, Y. Research on the impact of digital inclusive finance on regional carbon emissions: Based on the sustainable green innovation of small and medium-sized enterprises. J. Clean. Prod. 2023, 428, 139513. [Google Scholar] [CrossRef]
  36. Wang, D.; Wang, Z.W.; Cai, W.H.; Wu, Q.X. Digital inclusive finance, higher education expansion and regional carbon emissions: Evidence from China. Int. Rev. Econ. Financ. 2024, 89, 1091–1101. [Google Scholar] [CrossRef]
  37. He, Z.X.; Xu, S.C.; Shen, W.X.; Long, R.Y.; Chen, H. Impact of urbanization on energy related CO2 emission at different development levels: Regional difference in China based on panel estimation. J. Clean. Prod. 2017, 140, 1719–1730. [Google Scholar] [CrossRef]
  38. Li, W.; Hao, N.; Lu, C. A PVAR dynamic correlation appraisal of China’s carbon emissions in conjunction with economic growth and clean energy use. Renew. Energy 2023, 219, 11. [Google Scholar] [CrossRef]
  39. Charfeddine, L.; Kahia, M. Impact of renewable energy consumption and financial development on CO2 emissions and economic growth in the MENA region: A panel vector autoregressive (PVAR) analysis. Renew. Energy 2019, 139, 198–213. [Google Scholar] [CrossRef]
  40. Chen, H.Y.; Yi, J.Z.; Chen, A.B.; Zhou, G.X. Application of PVAR model in the study of influencing factors of carbon emissions. Math. Biosci. Eng. 2022, 19, 13227–13251. [Google Scholar] [CrossRef]
  41. Yang, G.Y.; Tang, L. Exploring the Connotations of New-quality Productivity and its Relationships with Others in the Perspective of Digital Inclusive Finance. J. Yunnan Minzu Univ. (Philos. Soc. Sci. Ed.) 2024, 41, 84–94. [Google Scholar] [CrossRef]
  42. Lu, L.B.; Yang, S.X.; Li, Q.Y. The interaction of digital economy, artificial intelligence and sports industry development --based on China PVAR analysis of provincial panel data. Heliyon 2024, 10, 15. [Google Scholar] [CrossRef] [PubMed]
  43. He, H.; Tsui, K.W.H.; Wu, H.J.; Lin, L. Exploring the red tourism-aviation nexus through the PVAR model: The case of China during the COVID-19 pandemic. Case Stud. Transp. Policy 2024, 18, 6. [Google Scholar] [CrossRef]
  44. Kazemzadeh, E.; Fuinhas, J.A.; Koengkan, M.; Shadmehri, M.T.A. Relationship between the share of renewable electricity consumption, economic complexity, financial development, and oil prices: A two-step club convergence and PVAR model approach. Int. Econ. 2023, 173, 260–275. [Google Scholar] [CrossRef]
  45. Xu, L. Theory of Environmental Kuznets Curve. Adv. Mater. Res. 2012, 361–363, 1697–1702. [Google Scholar] [CrossRef]
  46. Tan, R.P.; Zhang, Z.X.; Du, K.R.; Lin, B.Q. Energy rebound effect in China: Measurement based on a variable coefficient production function. Ecol. Econ. 2025, 230, 108496. [Google Scholar] [CrossRef]
  47. Li, Y.Y.; Zhang, S. Spatio-temporal evolution of urban carbon emission intensity and spatiotemporal heterogeneity of influencing factors in China. China Environ. Sci. 2023, 43, 3244–3254. [Google Scholar] [CrossRef]
  48. Wu, Y.; Zhang, Z.H.; Zhao, Z.W.; Tang, F. Research on the Impact Mechanism of Energy Structure and Green Technology Innovation on Carbon Emission Reduction. China J. Commer. 2024, 33, 140–144. [Google Scholar] [CrossRef]
  49. Lu, Y.; Xia, Z.Y. Digital inclusive finance, green technological innovation, and carbon emissions from a spatial perspective. Sci. Rep. 2024, 14, 15. [Google Scholar] [CrossRef]
Figure 1. Model plot of TCE with eigenvalues in the unit circle.
Sustainability 17 02461 g001
Figure 2. Model plot of CEI for eigenvalues in the unit circle.
Sustainability 17 02461 g002
Figure 3. Plots of impulse response functions of DIF to DIF, TE, TCE, and CEI.
Sustainability 17 02461 g003
Figure 4. Plot of impulse response functions of TE to DIF, TE, TCE, and CEI.
Sustainability 17 02461 g004
Figure 5. Plots of impulse response functions of TCE to DIF, TE, and TCE.
Sustainability 17 02461 g005
Figure 6. Plot of impulse response function of CEI to CEI, TE, and DIF.
Sustainability 17 02461 g006
Figure 7. Nuclear density map of the eastern region: CEI and TCE. Note: Kernel = Epanechnikov; bandwidth = 0.0183. Note: Kernel = Epanechnikov; bandwidth = 159.3551.
Sustainability 17 02461 g007
Figure 8. Nuclear density map of the central region: CEI and TCE. Note: Kernel = Epanechnikov; bandwidth = 0.0102. Note: Kernel = Epanechnikov; bandwidth = 159.3551.
Sustainability 17 02461 g008
Figure 9. Nuclear density map of the western region: CEI and TCE. Note: Kernel = Epanechnikov; bandwidth = 0.0102. Note: Kernel = Epanechnikov; bandwidth = 159.3551.
Sustainability 17 02461 g009
Table 1. Descriptive statistics.
TypeVariableDefinitionMeasurementMeanStdMin.Max.Obs.
Explanatory variableTCETotal carbon emissionsChina Carbon Accounting Database386.382325.07941.3182099.792330
CEICarbon emission intensityTCE/GDP0.0301930.04500.001270.2430005330
Core explanatory variablesDIFDigital inclusive financeDIF Index compiled by the Digital Finance Research Center of Peking University239.507107.73916.22460.6909330
Intermediate variableTELevel of technological innovationSum of licensed patents/per capita GDP [41]13.89116.2470.872105.7349330
Control variableERSEnvironmental regulation systemRegional environmental pollution investment treatment/industrial value added8.2106.2792.57636.0529330
ECEconomic development levelPer capita GDP58,539.228,917.816,413183,980330
ULBUrbanization levelUrbanized population/total population59.03812.15734.9689.6330
Table 2. Panel unit root test: ADF test.
TestStatistic/
p-Value
∆DIF∆TE∆ERS∆ULB∆EC∆TCE∆CEI
ADFStatistic−16.655−12.420−12.629−19.1645213.79610.7357923.980
p-value0.00530.00000.0000.00000.00000.00000.0000
Table 3. Panel unit root test: LLC and IPS tests.
TestStatistic/
p-Value
2DIF2TE2ERS2ULB2EC2TCE2CEI
LLCStatistic−5.1585−14.0124−9.5883−21.8556−1.9345−5.0798−11.8758
p-value0.00000.00000.0000.00000.02650.00000.0000
IPSStatistic−34.4545−15.2322−13.4421−28.6974−17.1480−6.8447−19.4997
p-value0.00000.00000.00000.00000.00000.00000.0000
Table 4. Optimal lag-order results of TCE.
LagMBICMAICMQIC
1−422.989−97.8404−229.9379
2−287.2596−70.49381−158.5588
3−146.9783−38.5954−82.62791
Table 5. Optimal lag-order results of CEI.
LagMBICMAICMQIC
1−264.0885−47.3228−135.3878
2−142.8736−34.49075−78.52327
Table 6. Results of Granger causality testing of TCE.
Original HypothesisDegrees of Freedomp-ValueAccept/Reject
DIF is not a Granger cause of TCE10.018Reject
TE is not a Granger cause of TCE10.033Reject
TCE is not a Granger cause of TE10.637Accept
Carbon emissions are not the Granger cause of DIF10.097Accept
Table 7. Results of Granger causality testing of CEI.
Original HypothesisDegrees of Freedomp-ValueAccept/Reject
DIF is not a Granger cause of CEI10.073Reject
TE is not a Granger cause of CEI10.277Accept
CEI is not a Granger reason for DIF10.715Accept
CEI is not a Granger cause of TE10.037Reject
Table 8. Results of Granger causality testing of DIF and TE.
Original HypothesisDegrees of Freedomp-ValueAccept/Reject
DIF is not a Granger cause of TE10.000Reject
TE is not a Granger cause of DIF10.033Reject
Table 9. Regression results of TCE.
Variable(1) TCE(2) TCE
DIF−1.053 ***−1.492 ***
(−6.455)(−8.146)
TE−46.907 ***−26.582
(−2.884)(−1.125)
ERS −0.242
(−0.090)
EC 0.001
(0.632)
ULB −9.484 ***
(−4.932)
constant735.552 ***1321.530 ***
(12.151)(9.808)
N330330
Note: T statistics in parentheses. ***, **, and * indicate the significance level of the coefficients at 1%, 5%, and 10%, respectively.
Table 10. Regression results of CEI.
Variable(2) CEI(2) CEI
DIF0.001 **0.000
(2.125)(−0.622)
TE−0.111 *−0.209 **
(−1.801)(−2.322)
ERS −0.003
(−0.321)
EC 1.776 × 10⁻⁵ ***
(4.425)
ULB −0.005
(−0.645)
constant−4.295−2.894 ***
(−18.787)(−5.644)
N330330
Note: T statistics in parentheses. ***, **, and * indicate the significance level of the coefficients at 1%, 5%, and 10%, respectively.
Table 11. Regression results of regional heterogeneity: the impacts of DIF and TE on TCE.
VariableEastern RegionCentral RegionWestern Region
DIF0.4546−3.5057 ***−1.7830 ***
(1.5200)(−5.6695)(−10.0525)
TE−56.7277 **−86.356146.3161 ***
(−2.2410)(−1.5760)(2.8908)
Constant488.77371363.1650820.5429
(5.1024)(9.1008)(13.1979)
N12188121
Note: T statistics in parentheses. ***, **, and * indicate the significance level of the coefficients at 1%, 5%, and 10%, respectively.
Table 12. Regression results of regional heterogeneity: the impacts of DIF and TE on CEI .
VariableEastern RegionCentral RegionWestern Region
DIF0.0002 ***−0.0002 ***0.0001
(4.9727)(−5.1577)(1.3755)
TE0.0062 **−0.0132 ***0.0190 ***
(2.1462)(−3.4403)(3.5647)
Constant−0.01980.0943−0.0157
(−1.7981)(8.9916)(−0.7607)
N12188121
Note: T statistics in parentheses. ***, **, and * indicate the significance level of the coefficients at 1%, 5%, and 10%, respectively.
Disclaimer/Publisher’s Note: The statements, opinions and data contained in all publications are solely those of the individual author(s) and contributor(s) and not of MDPI and/or the editor(s). MDPI and/or the editor(s) disclaim responsibility for any injury to people or property resulting from any ideas, methods, instructions or products referred to in the content.

