Article

Assessment of Land Resource Utilization Efficiency, Spatiotemporal Pattern, and Network Characteristics in Resource-Based Regions: A Case Study of Shanxi Province

Department of Law and Political Science, North China Electric Power University, Baoding 071003, China
*
Author to whom correspondence should be addressed.
Sustainability 2025, 17(6), 2458; https://doi.org/10.3390/su17062458
Submission received: 27 January 2025 / Revised: 28 February 2025 / Accepted: 7 March 2025 / Published: 11 March 2025

Abstract

:
Resource-based regions face particular challenges in achieving sustainable land-use transformation due to their entrenched development patterns. Through an integrated approach (super-efficiency SBM, Global Moran’s I, synergistic modeling, and SNA), this study analyzes Shanxi Province’s land-use efficiency dynamics (2015–2021), revealing (1) an N-shaped efficiency trajectory with core-periphery polarization stable high-efficiency clusters (Taiyuan/Yangquan/Luliang, mean > 1.1) versus fragmented northern mining zones and stagnant southern regions; (2) deficient spatial coordination (Moran’s I < 0) and failed capital-city spillovers, with only 2/10 cities achieving positive synergy; and (3) network instability (density = 0.14–0.29) featuring paradoxical power shifts in the emerging mining hub Shuozhou (degree = 100) outperforming traditional cores. Based on these findings, this study proposes policy recommendations from the perspective of regional policymakers, focusing on establishing provincial-level land resource utilization planning, promoting coordination among cities in terms of land resource utilization at the municipal level, and improving land resource utilization efficiency through environmental regulations. This study offers a new perspective on regional coordination for sustainable development in resource-based regions by conducting research at the provincial level, advancing policy suggestions at the meso-policy level for the green transformation of resource-based cities, and providing theoretical support for promoting the intensive and efficient utilization of land across cities in specific regions.

1. Introduction

Resource-dependent regions, characterized by natural resource extraction as their dominant industry [1], have historically achieved economic growth while remaining constrained by path dependency in “high energy consumption, high emissions, and high pollution” industrial structures [2]. Global examples from the Ruhr region in Germany to mining areas in Chile show that when resource reserves decline to a certain extent, transformation is imperative. However, systematic solutions are still hard to find. The industrial transformation of resource-based cities can be roughly categorized into three models: the government-led model, represented by Germany and France in Western Europe; the market-led model, represented by the United States, Canada, and Australia; and the industrial-policy-guided model, represented by Japan. As a country that typically uses administrative power to lead reforms, China can provide more valuable experiences and feasible options for the transformation of resource-based regions around the world.
Continuous improvement in land resource utilization efficiency is an important means of changing existing land-use layouts [1]. Based on relevant research and policy suggestions for resource-based regions, one of the key steps in the sustainable development transformation of resource-based regions is to change the loose, inefficient, and unscientific land-use layout formed from the original resource endowment of resource-based regions [2]. Scholars have conducted extensive research on the driving factors of land resource utilization efficiency [3], spatiotemporal evolution characteristics [4], and coupling coordination levels [5] and provided policy suggestions focusing on establishing effective environmental monitoring systems [6], optimizing existing urban planning and industrial cluster planning [7], and extensively using digital and Internet technology [8].
Improving coordinated cooperation among cities is also a crucial mechanism to break resource curse dynamics. Traditional research uses the Environmental Kuznets Curve [9] and the extended STIRPAT model to examine the causal relationships between various factors, such as economic development [10], technological progress [9], environmental regulations [11], and specific areas of regional coordinated development. Studies have also analyzed the correlation between intercity coordination, technological progress, economic growth, and other factors from the perspective of urban clusters [12]. In addition to traditional research, studies focusing on spatiotemporal and network characteristics have examined topics related to urban coordination and cooperation, providing more analytical results. These studies mainly focus on the spatiotemporal characteristics of regional transformation and network characteristics. For example, in the case of carbon emission reduction within urban clusters, a spatiotemporal characteristics study described the spatial pattern of carbon emission reduction in specific types of cities using indicators, such as the Theil index [13], whereas a network characteristics study used social network analysis to explore the spatial network characteristics of carbon emissions within urban clusters [14]. The findings of the above research, which has explored the influencing factors underlying disparities in the development of cities within the same region, reveal significant regional development imbalances and serious issues of asynchronous and uncoordinated development among cities within the same area [15]. They have also highlighted barriers to urban transformation and latent risks to sustainable development during the urbanization process [16,17]. Scholars have explained developmental discrepancies within the same region from multiple perspectives, such as population [18], environment [19], and land use [20,21], establishing a consensus that the lack of coordination among cities within the same region largely stems from differences in political institutional backgrounds, political behaviors of officials, and regional public policy [22]. The primary controversies center on the role of public policies in regional coordinated development, including whether regional public policies have facilitated such development [23], whether administrative land planning is conducive to regional sustainable development [24], and whether administrative actions in land management align with the intended goals of public policy and government expectations of regional development outcomes [25].
Against this backdrop, this study brings a new perspective and empirical evidence from resource-based regions in China into the debate. With its strong tradition of administrative guidance, China closely links the development and decline of resource-based regions to regional public policies [26]. This administrative guidance tradition has been significantly manifested in Shanxi Province, a typical resource-based region in China. The formation and development of land-use patterns in Shanxi Province are characterized by the following three major features, which are more closely linked to the introduction and implementation of public policies than to the transformation of general resource-based regions. First, the establishment of administrative districts in Shanxi Province was considered due to its role as an energy base in China. Consequently, an industry structure dominated by resource industries was formed at the outset of planning. The regional division of labor tended to develop the mineral industry, leading to a more dispersed industrial layout owing to proximity to mining areas. Consequently, cities lack rational spatial structures and comprehensive infrastructure, resulting in inefficient land resource utilization [27]. Second, it is precisely due to Shanxi Province’s strategic position as “China’s energy base” that the province has developed a stable and difficult-to-change resource-based regional layout in its historical land resource utilization. This layout has resulted in single-function land use, which is detrimental to the development of a mixed, efficient, and multifunctional land-use structure [28]. Third, during its transition, Shanxi Province was constrained by overall national strategic planning, which tended to confine land resource utilization planning within existing development concepts, technological pathways, and institutional frameworks, thus hindering the sustainable development of resource-based regions [29].
Therefore, it is urgent and practical to conduct research on land resource utilization efficiency in resource-based regions and study their spatiotemporal differentiation and agglomeration development characteristics based on efficiency evaluations. First, the current situation of land use in resource-based regions exhibits a dispersed structure with mineral resources as the core rather than a “core-periphery” urban hierarchical structure in the general sense. Therefore, evaluating land resource utilization efficiency can fully reflect economic, sustainable, and transformative issues in the use of land resources in resource-based regions. Second, enhancing the land resource utilization efficiency of resource-based cities at the regional level is necessary for China to strengthen supply-side structural reforms and gradually promote high-quality transformation and development of resource-based cities. The land-use layout in resource-based regions has already formed a stable organic synergy network in many aspects, such as transportation and industrial distribution. Third, the example of Shanxi shows that administrative power can resolve the efficiency–stability paradox through centralized land-use planning for regional cohesion, leveraging environmental regulation for efficiency gains, and strengthening intercity collaboration networks. This provides a new paradigm for the transformation path selection of other resource-based regions around the world.

2. Study Area and Data

2.1. Study Area

Shanxi Province (34°34′–40°44′ N, 110°14′–114°33′ E), a pivotal energy hub in central China, exemplifies the challenges of resource-dependent development. Spanning 156,700 km2 of loess plateau terrain with 11 prefecture-level cities, its landscape is geologically partitioned into three zones: the northern coal basins, central urban corridors, and southern agricultural valleys where historic settlements, like Pingyao Ancient City, anchor cultural tourism. This spatial configuration underpins a socioeconomic divide: 10/11 cities remain locked in coal-dependent economies, collectively contributing 78.5% of provincial GDP through extraction activities, while the capital Taiyuan emerges as an outlier with 68.4% of GDP from service sectors.
The province’s resource cities exhibit divergent evolutionary paths under China’s sustainable development framework. Shuozhou represents the emerging mining frontiers with a relatively short mining history, while the other nine mature cities have an average intensive mining duration of over half a century, exemplified by Datong’s 37.6 billion tons of cumulative proven reserves and Yangquan’s 44.5% of energy–industrial GDP composition. Current transitional challenges manifest through severe ecological debt. The goaf area caused by coal mining in the whole province is nearly 5000 square kilometers, accounting for about 3% of the province’s total land area. The subsidence area is approximately 3000 square kilometers, accounting for about 60% of the goaf area, and there is polarized land-use efficiency, where the soil erosion area in Luliang City, northern Shanxi Province, amounts to as high as 14,700 square kilometers, against southern agro-tourism zones, like Jincheng, deriving 38.7% revenue from the tertiary industry, with tourism as its main component.
These conditions make Shanxi a crucial case study for researching resource transformation. Here, the resource distribution determines the economic structure, which, in turn, leads to various challenges during the transformation process. The mining-dominated northern regions starkly contrast with the southern areas that focus on cultural tourism. The traditional energy industry and the emerging cultural tourism industry compete for resources, jointly shaping the unique development status quo of Shanxi. This complex development pattern in Shanxi Province provides rich real-world materials for researching resource transformation. It is like a natural laboratory, facilitating in-depth exploration of the sustainable development paths for resource-based regions.

2.2. Data Sources

This study uses the urban construction land area to represent land resource input, total fixed asset investment to represent capital input, urban employment population to represent human resource input, regional gross domestic product to represent expected output, and industrial wastewater discharge and industrial dust emissions to represent unexpected outputs, as shown in Table 1. These data were sourced from the China City Statistical Yearbook published by the Urban Social and Economic Survey Department of the National Bureau of Statistics and the National Economic and Social Development Statistical Bulletin released by various city statistical bureaus. Missing data were supplemented using the moving average interpolation method. Based on the National Sustainable Development Plan for Resource-Based Regions (2013–2020) and the National Master Functional Zone Plan, this study reserved two years as the initial adaptation and development period for Shanxi Province after the publication of the plan and selected 2015 as the starting point for the study. Due to the impact of the COVID-19 pandemic, some data for Shanxi Province after 2021 have not been disclosed. Therefore, this study takes 2021 as the year of study termination.

3. Methodology

To systematically evaluate the land-use efficiency dynamics in Shanxi’s resource-dependent context, we developed an integrated analytical framework combining econometric modeling, spatial statistics, and network theory. The methodology progresses through four interlinked stages, each addressing specific dimensions of the efficiency–transition nexus.

3.1. Super-Efficiency SBM Model

Recognizing the dual imperative of economic output maximization and environmental impact minimization in resource regions, we employed the super-efficiency SBM model [30] with undesirable outputs. This non-radial DEA approach overcomes conventional models’ limitations in handling slack variables and cross-DMU comparability. The formula used is as follows:
m i n ρ = 1 / m i = 1 m ( x ¯ / x i k ) 1 / ( s 1 + s 2 ) ( p = 1 s 1 y d ¯ / y p k d + q = 1 s 2 y u ¯ / y q k u ) s . t . x j = 1 , k n x i j λ j i = 1 , , m y d ¯ j = 1 , k n y p j d λ j p = 1 , , r 1 y d ¯ j = 1 , k n y q j u λ j q = 1 , , r 2 λ j 0 j = 1 , , n ; j 0 x ¯ x k k = 1 , , m y d ¯ y k d q = 1 , , s 1 y u ¯ y k u u = 1 , , s 2
In the formula, ρ represents the land resource utilization efficiency; n is the number of decision-making units; m stands for input; S1 and S2 represent desirable and undesirable outputs, respectively; x denotes the elements in the input matrix; yd represents the elements in the desirable output matrix; and yu represents the elements in the undesirable output matrix.

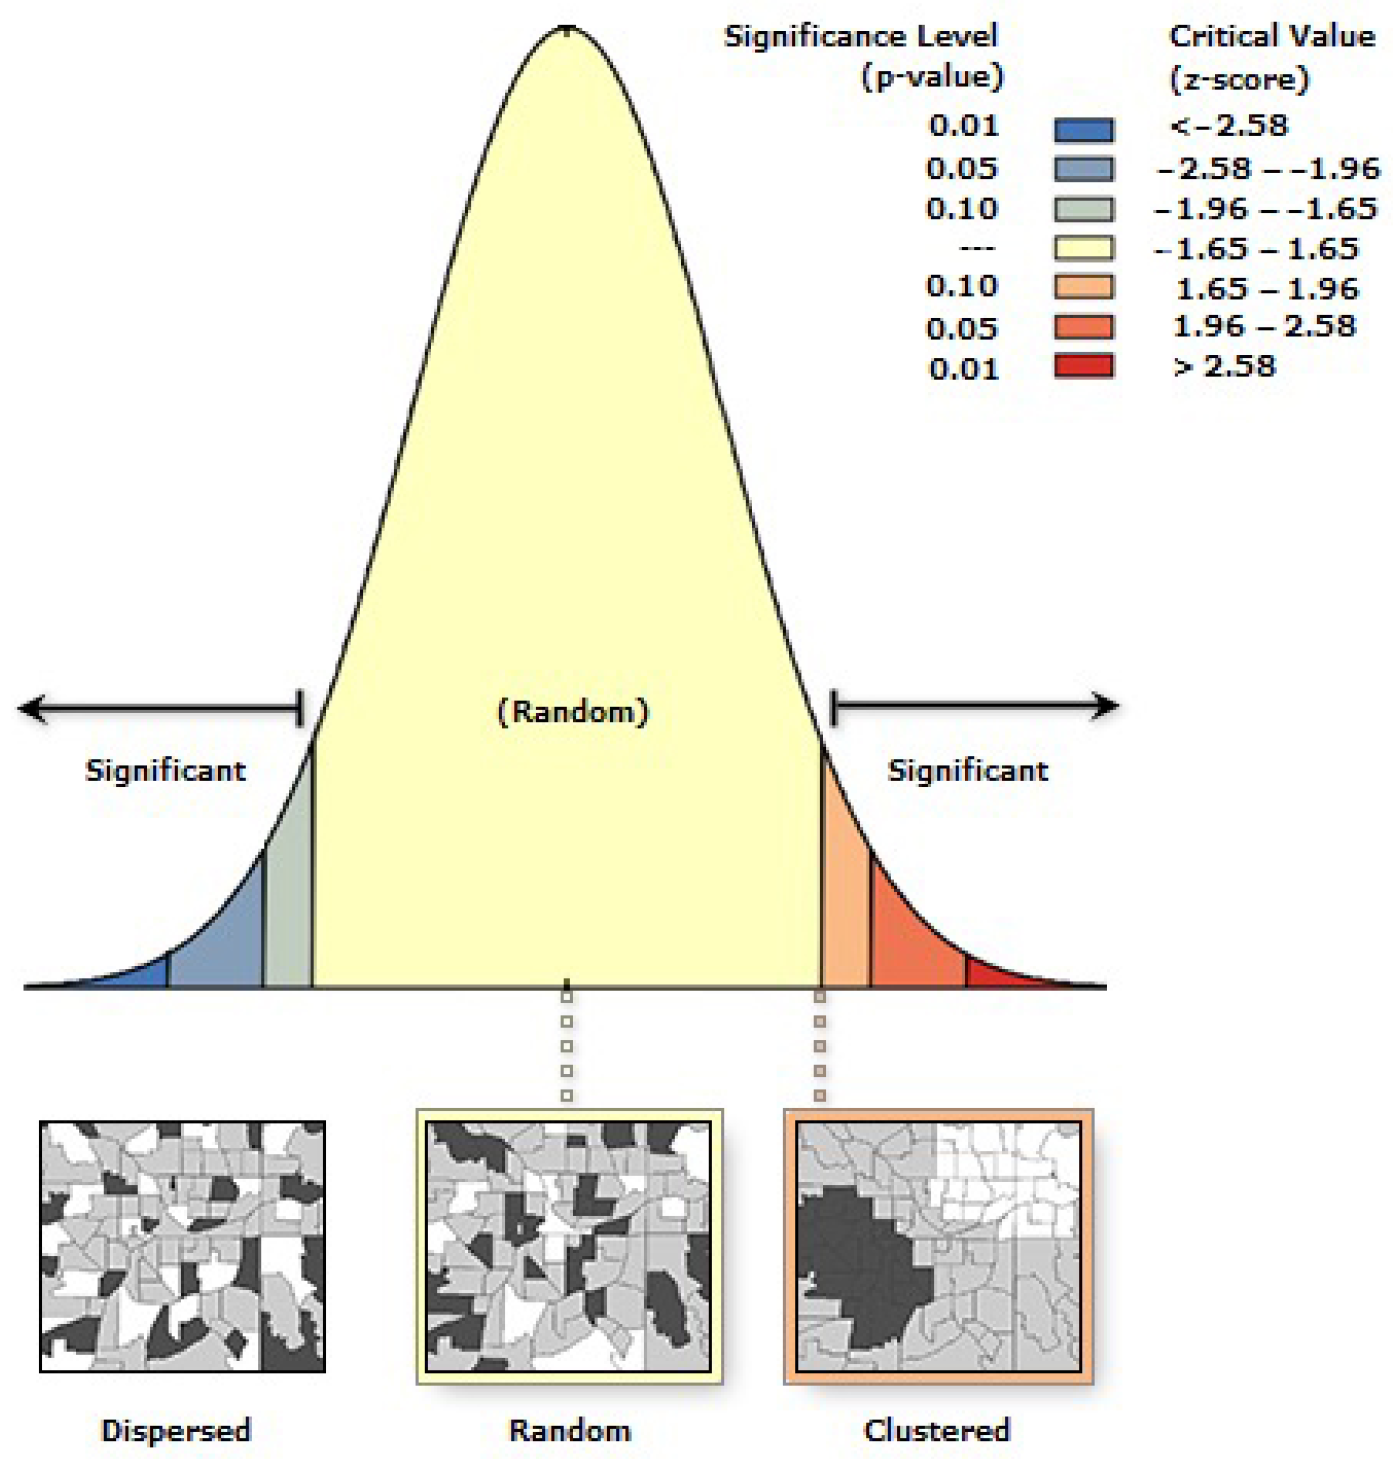
3.2. Global Moran’s I

Building on efficiency scores, we quantified spatial autocorrelation patterns using the global Moran’s I. The index quantifies spatial autocorrelation intensity through comparative analysis of attribute similarity and geographical proximity. Specifically applied to land resource efficiency in Shanxi, it evaluates whether high-efficiency cities cluster spatially (positive I) or disperse competitively (negative I), calculated as:
Global   Moran s   I = n i = 1 n ( x i x ¯ ) 2 i = 1 n j = 1 n W i j ( x i x ¯ ) ( x j x ¯ ) i = 1 n j = 1 n W i j
where Wij denotes the inverse-distance spatial weights between cities i and j, n represents the total number of spatial units, and xi represents normalized efficiency scores.

3.3. Synergistic Effect Model

As the capital city and only non-resource-based city in Shanxi Province, Taiyuan has demonstrated outstanding performance in various aspects [31]. To evaluate provincial coordination effectiveness, we measure cities’ synchronization with Taiyuan’s transformation trajectory using a synergistic effect model [32]. The formula used is as follows:
C o r r b i , t = 1 1 2 C b , t C b ¯ 1 t 1 t   C b , t C b ¯ 2 C i , t C i ¯ 1 t 1 t   C i , t C i 2 2
where Corrbi,t represents the synergistic effect of land resource utilization efficiency between city i in Shanxi Province in year t and Taiyuan, with a value closer to 1 indicating a more pronounced synergistic effect. Cb,t is the land resource utilization efficiency value of Taiyuan in year t, and C b represents the average land resource utilization efficiency of Taiyuan in year t. Ci,t represents the land resource utilization efficiency value of city i in year t, and C i represents the average land resource utilization efficiency of city i in year t.

3.4. Spatial Network Analysis

It is still necessary to further answer one of the research objective questions: whether the regional integration policy has helped Shanxi Province to jointly improve land resource utilization efficiency. Therefore, this study employed the social network analysis method and introduced an improved gravitational model to measure the interaction intensity between each node in Shanxi Province, aiming to study the connections among cities in Shanxi Province [33]. The formula is as follows:
G i j = C i C i + C j × P i C i E i P j C j E j 3 3 ( D i j e i e j ) 2
In Equation (4), i and j represent city i and city j in Shanxi Province; G represents the gravitational force between the land resource utilization efficiencies of the two cities; C represents the urban land resource utilization efficiency; P represents the total urban employed population; E represents the urban gross domestic product; e represents the per capita GDP of the urban employed population in this region; and Dij represents the geographical distance between city i and city j.
After constructing the gravity model for the utilization efficiency of land resources in Shanxi Province, in order to analyze the overall network characteristics of Shanxi Province, this study calculated four overall indicators of the network over the years, namely, network density, network correlation degree, network, and network efficiency. The formulas are shown as follows:
D n = M / [ N × ( N 1 ) ]
Equation (5) was used to calculate the overall density of the network. Dn represents the network density, N stands for the number of network nodes in Shanxi Province, and M is the number of actual existing connections. The larger the network density, the closer the cooperation among the cities in Shanxi Province. Conversely, the smaller the network density, the looser the cooperation among the cities.
C = 1 V / [ N × ( N 1 ) / 2 ]
Equation (6) was used to calculate the degree of network correlation. C refers to the degree of network correlation, N represents the number of network nodes in Shanxi Province, and V is the number of pairs of unreachable points in the network. The greater the degree of network correlation, the more it can indicate that there are mutual connections among the cities in Shanxi Province.
H = 1 K / m a x ( K )
Equation (7) was used to calculate the network hierarchy degree. H refers to the network hierarchy degree, and K is the number of asymmetrically reachable points among the cities in Shanxi Province. The higher the network hierarchy degree, the stricter the hierarchy among the cities in Shanxi Province, and the fewer cities will be able to occupy the dominant positions.
E = 1 M / m a x ( M )
Equation (8) was used to calculate the network efficiency. E represents the network efficiency, and M is the number of redundant lines in the network of Shanxi Province. The lower the network efficiency, the more stable the network.
Network density, network correlation degree, network hierarchy degree, and network efficiency reflect the overall characteristics of the collaborative network in Shanxi Province. On the basis of analyzing the overall characteristics, this study continued to explore the individual characteristics of the collaborative network in Shanxi Province in depth. This study selected the year 2021 as a time node and explored the degree centrality, betweenness centrality, and closeness centrality of each city in the collaborative network of Shanxi Province, respectively. The formulas are shown as follows:
C R D ( i ) = C A D ( i ) / ( n 1 )
C R B ( i ) = 2 j < k r j k ( i ) / r j k ( n 1 ) ( n 2 )
C R p ( i ) = ( n 1 ) / j = 1 n d i j
In Equations (9)–(11), CRD(i) represents the degree centrality of City i; CRB(i) represents the betweenness centrality of City i; CRP(i) represents the closeness centrality of City i; CAD(i) represents the number of other cities in Shanxi Province that are connected to City i; rjk represents the number of relationship paths existing between City j and City k; rjk(i) represents the number of paths that need to pass through City i; and dij represents the shortest distance between City i and City j.

4. Results

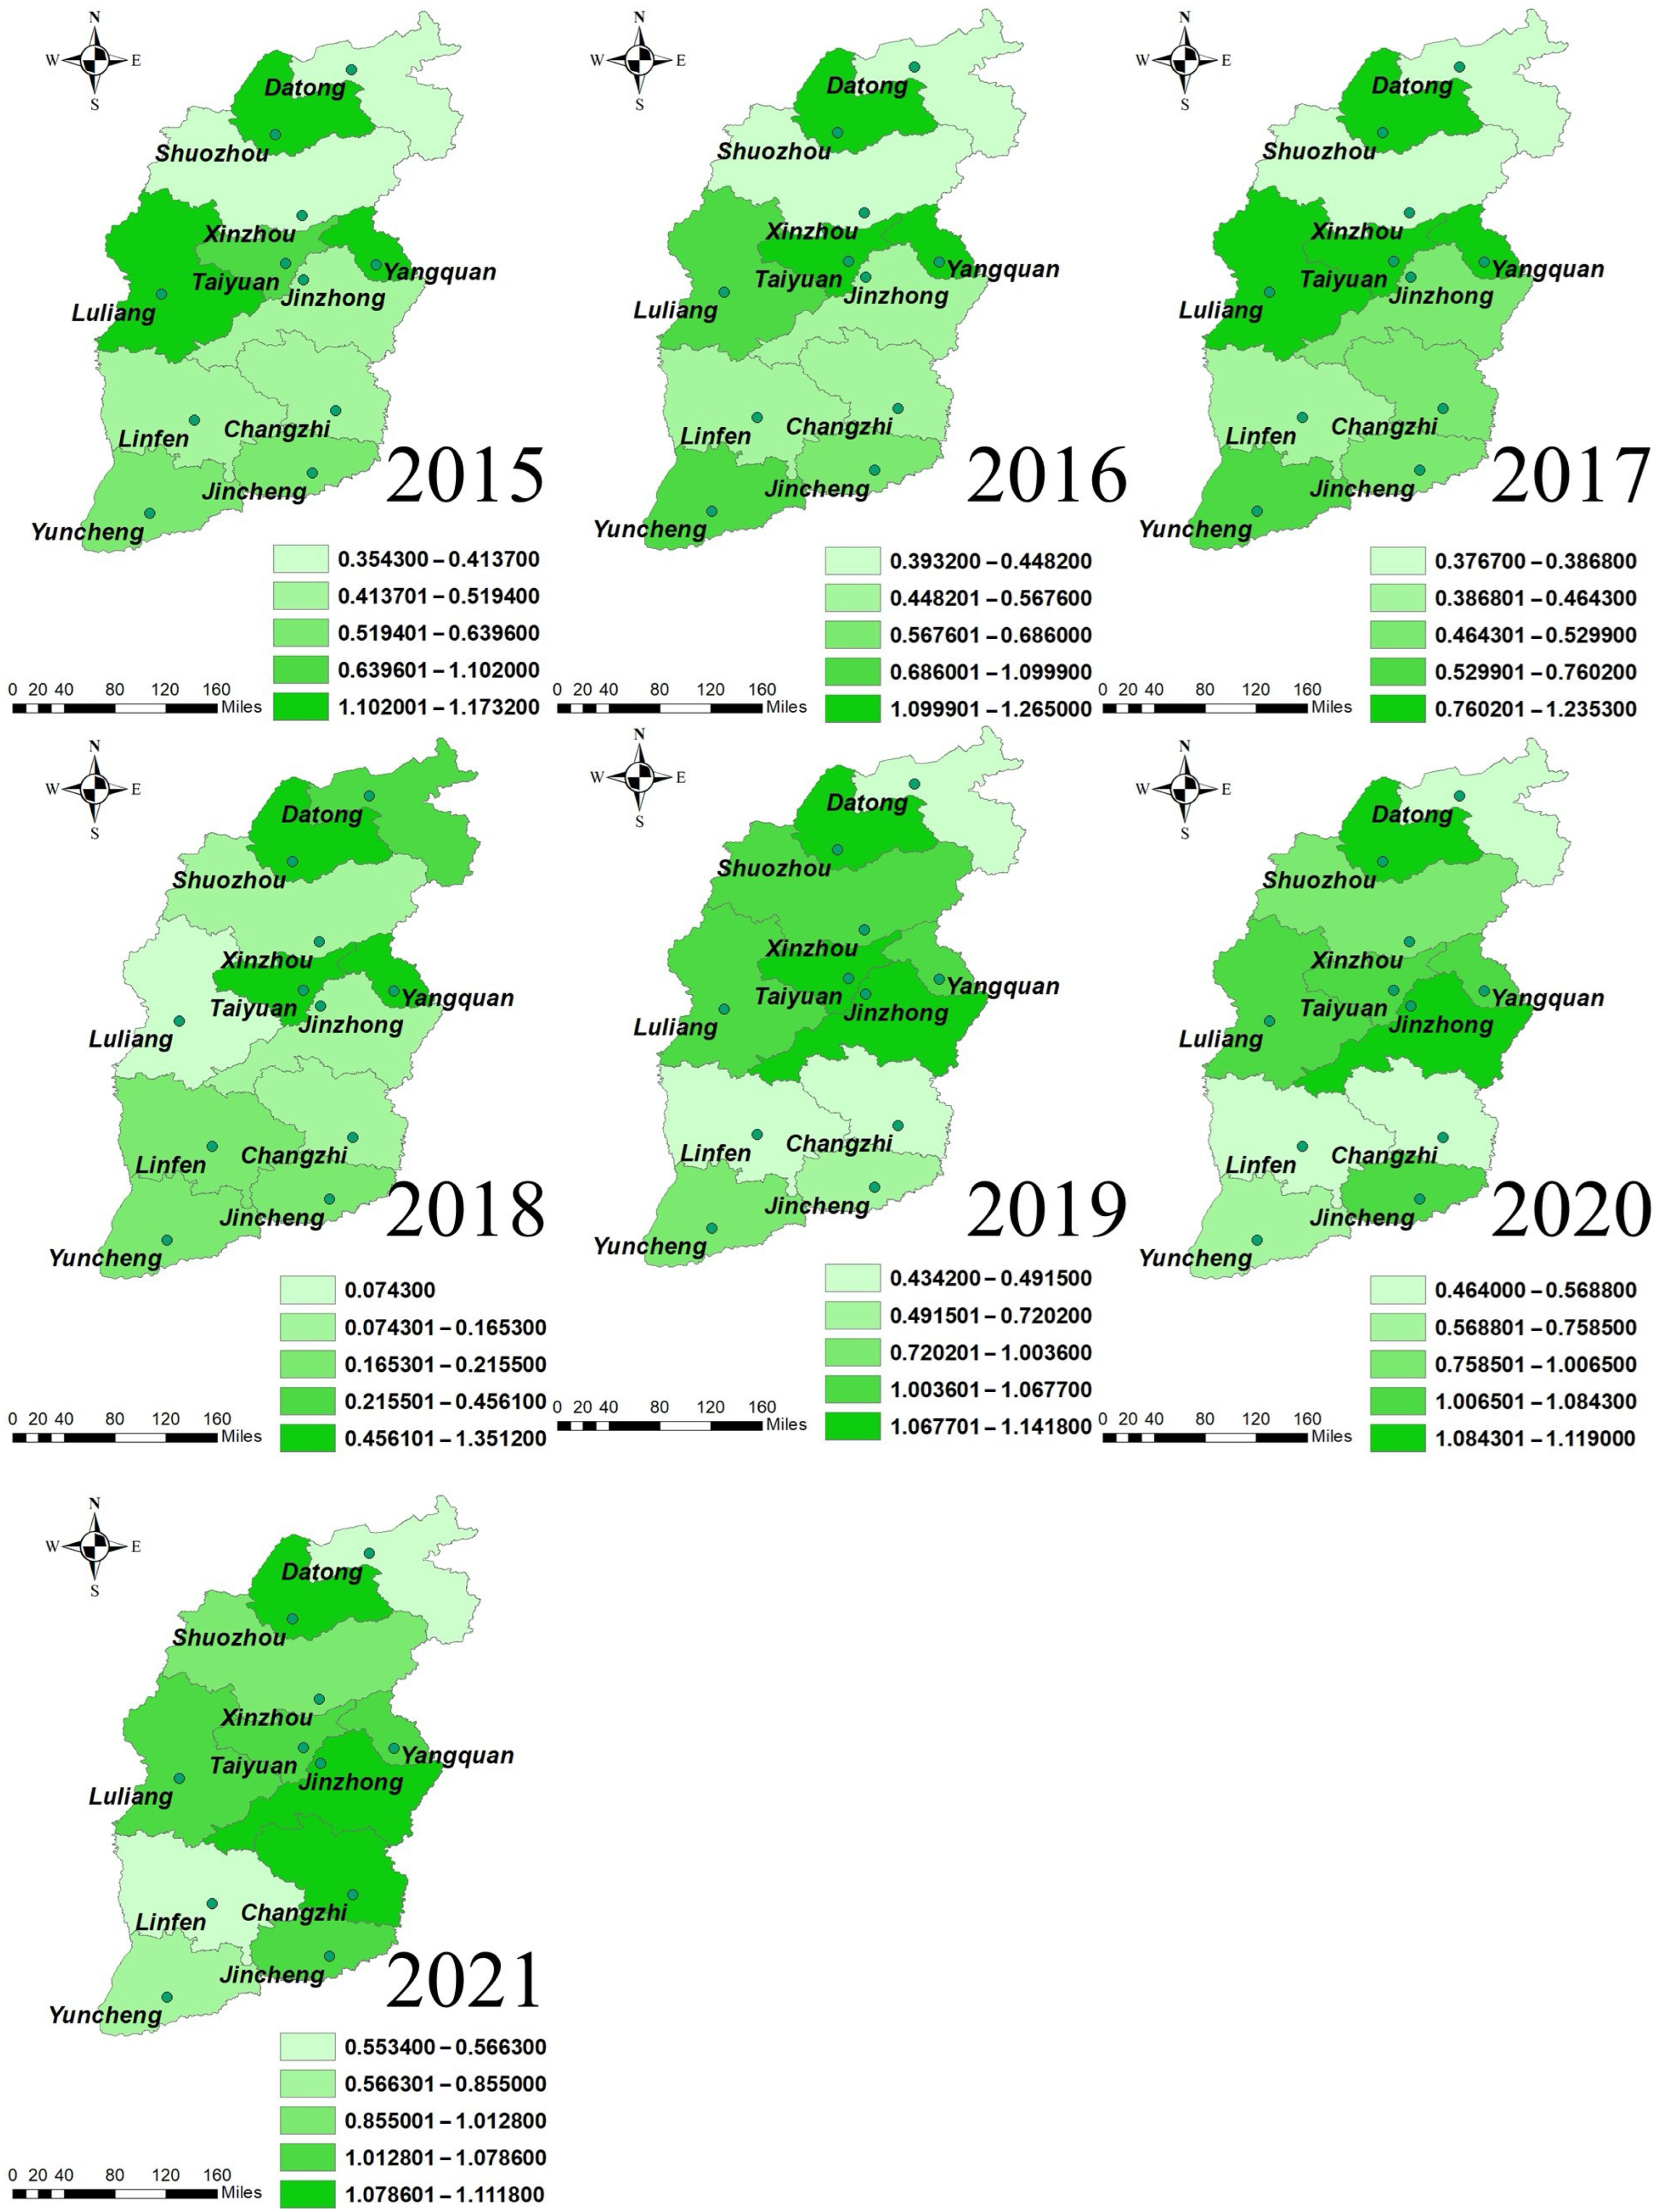
4.1. Temporal and Spatial Differentiation of Land Resource Utilization Efficiency

Considering unexpected outputs, the super-efficiency SBM model (Equation (1)) was utilized to calculate the land resource utilization efficiency in Shanxi Province via MATLAB R2023b software. The results are presented in Table 2.
Based on the overall trend in Table 2, the average land resource utilization efficiency in the province shows an N-shaped fluctuation from 2015 to 2021. From 2015 to 2016, the land resource utilization efficiency increased slightly from 0.7356 to 0.8018. However, it declined between 2017 and 2018, with a slight decrease to 0.7438 in 2017 and a sharp decline to 0.4708 in 2018. However, land resource utilization efficiency began to recover from 2019 to 2021, reaching its highest value in seven years (0.9604 in 2021). This N-shaped fluctuation aligns with the general transformation path in resource-based regions. In the early stages of transformation, most resource-based cities relied heavily on regional resource endowments owing to path dependence. They often faced multiple challenges, such as the collapse of old economic pillars, the absence of established new economic growth points, and difficulties in repairing environmental pollution and ecological damage caused by excessive mining [34]. In Shanxi Province, this was reflected in the overall decrease in land resource utilization efficiency from 2016 to 2017. However, these challenges are gradually mitigated in the mid- to late stages of the transformation of resource-based regions. Previous industrial patterns that relied on mineral resources have been upgraded to greener and more environmentally friendly industrial models. In Shanxi Province, this manifested as a gradual increase in land resource utilization efficiency from 2018 to 2021. The overall trend in land resource utilization efficiency in Shanxi Province reflects the weak position and path dependence of resource-based regions during the early transformation stages. In such cases, the government should provide more scientific and technological resources, talent, and funding at provincial and national levels through unified planning to support the transformation of resource-based regions, especially in the early stages. According to the National Spatial Plan (2021–2035), the current land planning system in Shanxi Province involves each prefecture-level city drafting a land planning proposal separately, which is then approved by the Shanxi Provincial Government to form planning documents. On the one hand, separate planning for each prefecture-level city helps tailor land policies to the specific conditions of each city and formulates land-use policies that are suitable for their respective circumstances. However, separate planning for each prefecture-level city reduces the overall coherence of Shanxi Province as a unified administrative region and hinders the possibility of coordinated planning and mutual improvement in land resource utilization efficiency between cities.
From the perspective of the average land resource utilization efficiency of various cities in Shanxi Province, there were significant differences between the 11 cities in Shanxi Province from 2015 to 2021. Among them, only three cities, Taiyuan, Yangquan, and Shuozhou, had average land resource utilization efficiencies exceeding 1. Taiyuan, the capital city of the Shanxi Province, is the only non-resource-based city in the province. In recent years, Yangquan, an important city in the eastern region of Shanxi and a key component of the national energy base, has achieved remarkable results in terms of energy transformation. Shuozhou relies on coal and electricity as its main pillar industries and faces the challenge of ecological restoration in the mining areas. The Shuozhou municipal government adheres to the principle of “tackling subsidence while simultaneously addressing governance” and continuously strengthens ecological restoration, embarking on a new path of green and sustainable development in coal and mineral resource-based areas. The average land resource utilization efficiency of eight cities, Datong, Changzhi, Jincheng, Jinzhong, Yuncheng, Xinzhou, Linfen, and Luliang, is less than 1, indicating that their land planning is still inadequate and that the full potential of land functions, such as agriculture, ecology, and urban areas, has not been realized. They have not been able to establish a hierarchical, rational, and coordinated urban spatial pattern [35,36]. Therefore, these eight resource-based cities, including Datong, should further participate in the coordination and cooperation of the central and southern urban clusters in Shanxi [37] and strictly adhere to the bottom line of national land and space security [38].
To further study the spatiotemporal differentiation characteristics of land resource utilization efficiency in Shanxi Province, this study utilized ArcGIS 10.2 software to create a spatiotemporal differentiation map and further analyze the spatiotemporal differentiation characteristics and evolutionary trends of land resource utilization efficiency. The method of plotting spatiotemporal differentiation maps is widely used in the visual analysis of relevant data across cities within the same region and can be applied to analyses at various administrative levels, including national and provincial [39,40]. The difference between the maximum and minimum values of land resource utilization efficiency for each year in Shanxi Province was used as an interval, and the “equal interval method” was employed to classify and rank the land resource utilization efficiency of the prefecture-level cities into three intervals based on the highest and lowest values of land resource utilization efficiency for each year. The results are shown in Figure 1.
According to Figure 1, the spatiotemporal differentiation characteristics of land resource utilization efficiency in Shanxi Province from 2015 to 2021 conform to an N-shaped trend of the annual average. Among the prefecture-level cities in Shanxi Province, Taiyuan, Yangquan, and Luliang were the most stable in terms of land resource utilization efficiency. The land resource utilization efficiencies of Taiyuan and Yangquan were relatively high, exceeding 1 in all the years from 2015 to 2021. In contrast, Luliang had a land resource utilization efficiency of less than 1 only in 2018, and in the other years, it was within the range of relatively high efficiencies. With Taiyuan, Yangquan, and Luliang as the core, they form a boundary line that runs east–west through Shanxi Province, dividing it into two parts. In the northern part of the boundary, Xinzhou, Shuozhou, and Datong maintained relatively stable land resource utilization efficiencies from 2015 to 2017. Xinzhou and Datong had the lowest efficiency ranges, whereas Shuozhou had the highest. Xinzhou remained in the lowest efficiency range in 2018 and then steadily increased to the second- and third-highest efficiency ranges from 2019 to 2021. Shuozhou remained stable in the highest efficiency range, whereas Datong only reached the second-highest efficiency range in 2018 and then fell back to the lowest efficiency range from 2019 to 2021. In the southern part of the boundary line, Linfen remained in the second and third lowest efficiency ranges from 2015 to 2018 and then fell to the lowest efficiency range from 2019 to 2021. Changzhi remained in the second- and third-lowest efficiency ranges from 2015 to 2018 and then fell to the lowest efficiency range from 2019 to 2020, reaching the second-highest efficiency range in 2021. Yuncheng remained in the second- and third-highest efficiency ranges from 2015 to 2019 and then fell to the second-lowest efficiency range from 2020 to 2021. Jincheng, except for 2019 when it was in the second-lowest range, remained in the second- and third-highest efficiency ranges in the remaining years.
Overall, the spatiotemporal differentiation of land resource utilization efficiency in Shanxi Province from 2015 to 2021 exhibited the following two characteristics: Overall, the spatiotemporal differentiation of carbon emission efficiency in the three cities in northern Shanxi Province and four cities in the south was disordered, showing no unified trend or regional coordination features. In contrast, the three central cities of Shanxi Province (Taiyuan, Yangquan, and Luliang) exhibited relatively stable changing trends, forming a boundary that divided the northern and southern regions of Shanxi Province. First, as the capital city and the only non-resource-based city in Shanxi Province, Taiyuan has consistently maintained a high level of land resource utilization efficiency. Taiyuan, along with the central cities of Yangquan and Luliang, form a stable boundary that divides Shanxi Province into two parts. Second, the spatiotemporal differentiation and trends of the eight cities located in the northern and southern regions of the boundary line showed distinct variations without displaying a unified regional change trend.
The policy implications of the spatiotemporal differentiation of land resource utilization efficiency in Shanxi Province can be summarized as follows: First, although Shanxi Province is a unified administrative unit, the spatiotemporal differentiation of land resource utilization efficiency among its subordinate municipalities does not exhibit a coordinated and orderly pattern. Shanxi Province should further promote coordinated land resource utilization among cities through policies such as technology sharing, project collaboration, and information exchange. Second, the land resource utilization efficiency of various cities in Shanxi Province was influenced by extremely low values in specific years. In this regard, Shanxi Province should strengthen environmental regulations, properly control mineral exploitation, industrial production, and other production activities, and minimize negative outputs, such as wastewater discharge and industrial dust emissions, by establishing emission and pollutant conversion rate standards. Third, the cities of Taiyuan, Yangquan, and Luliang, which form the boundary line, should establish effective cooperation mechanisms for emission reduction and disseminate their achievements of emission reduction. This further supports the improvement in land resource utilization efficiency in cities located north and south of the boundary.

4.2. Agglomeration Development and the Synergistic Effect of Land Resource Utilization Efficiency

Although Shanxi Province is a unified administrative unit, the spatiotemporal differentiation characteristics of land resource utilization efficiency in its subordinate cities do not show consistent or coordinated patterns. To further study its agglomeration development characteristics, this study used the global Moran’s coefficient to analyze the agglomeration characteristics of land resource utilization efficiency from 2015 to 2021, as shown in Table 3 and Figure 2.
According to Table 3 and Figure 2, land resource utilization efficiency in Shanxi Province from 2015 to 2021 exhibits negative spatial correlation characteristics, as indicated by the negative Moran’s index values in 2015, 2016, 2017, 2020, and 2021. In contrast, the Moran’s index values were positive in 2018 and 2019, demonstrating a positive spatial correlation. The absolute p-values for the seven-year period in Shanxi Province were all greater than 0.1, indicating that although there were spatial positive and negative correlation features, land resource utilization efficiency from 2015 to 2021 was still randomly distributed and did not exhibit significant spatial autocorrelation. In summary, except for a few cities such as Taiyuan, the land resource utilization efficiency in most prefecture-level cities in Shanxi Province showed frequent changes and large variations. There is a lack of coordination among prefecture-level cities in Shanxi Province in terms of improving land resource utilization efficiency, and there is no significant spatial autocorrelation. In this sense, as a unified administrative unit, Shanxi Province has not fully utilized the agglomeration effect and has failed to coordinate the improvement of land resource utilization efficiency among its prefecture-level cities. Therefore, Shanxi Province should adopt a comprehensive approach to promote the structural transformation of urban land use, industrial upgrading, ecological restoration, and other aspects. The administrative power of the provincial government should be fully utilized to strengthen environmental regulations to prevent extreme changes in land resource utilization efficiency in individual cities by affecting the overall strategy of improving land resource utilization efficiency in Shanxi Province. This will allow the province to realize the agglomeration effect.
In response to the insignificant agglomeration characteristics of land resource utilization efficiency in Shanxi Province, it is necessary to unify work deployment and resource allocation at the provincial level, rely on leading cities for targeted assistance, and fully leverage the radiating effects of advantaged cities to drive transformation and improvement. Therefore, this study took Taiyuan, the capital and the only non-resource-based city in Shanxi Province, as the benchmark city for improvements in land resource utilization efficiency and further explored the coordinated cooperation between each city and Taiyuan in this aspect. The results are summarized in Table 4. The variables “direction” and “distance” were used to describe the direction and straight-line distance of the target cities relative to the benchmark city, Taiyuan. The variable “rank” represents the ranking of the average coordinated effect of land resource utilization efficiency among various cities in Shanxi Province.
As shown in Table 4, the average coordinated effect of land resource utilization efficiency in Shanxi Province from 2016 to 2021 exhibits an overall downward trend. The average coordinated emission reduction effect decreases from 0.1273 in 2016 to 0.0179 in 2021, with negative values in 2018 and 2020. Overall, the average coordinated effect of land resource utilization efficiency in Shanxi Province from 2016 to 2021 is −0.5133, indicating that the overall coordinated effect of land resource utilization efficiency in Shanxi Province does not match that of Taiyuan. Taiyuan has not played a positive role, and there is an urgent need to improve the coordinated effect of land resource utilization efficiency in Shanxi Province. There were significant differences in the coordinated effects among the resource-based cities. Among the 10 resource-based cities in Shanxi Province, only Yangquan and Shuozhou showed positive coordinated effects, indicating close coordination with Taiyuan and positive synergistic effects, which aligns with the spatiotemporal differentiation of land resource utilization efficiency in Shanxi Province. The remaining eight resource-based cities showed negative coordinated effects with Taiyuan, indicating that there is no unified mechanism for improving land resource utilization efficiency within Shanxi Province. Each city operates independently without unified deployment and planning at the provincial level, which aligns with the agglomeration characteristics of land resource utilization efficiency in Shanxi Province. Among the cities within a 200 km radius of Taiyuan, only Yangquan ranked first in terms of the coordinated effect, whereas the other four cities ranked outside the top five. This indicated that the radiating effect of Taiyuan was relatively weak and could not effectively drive the surrounding cities. In contrast, among all the cities in Shanxi Province, only two exhibited positive coordinated effects with Taiyuan. This implies that Taiyuan, as a major urban center, has a relatively strong resource aggregation capacity. However, it does not necessarily mean that it has “absorbed too many resources” in a negative sense. The situation where the remaining eight cities showed negative coordinated effects might be due to complex factors, such as differences in regional industrial structures and development stages. It is inaccurate to simply claim that the improvement in land resource utilization efficiency in Taiyuan has directly led to a decrease in land resource utilization efficiency in other cities. Even so, as the provincial capital of Shanxi Province and a benchmark city for land resource utilization efficiency, Taiyuan still needs to play an exemplary and leading role to the best of its ability. Taiyuan should share the achievements of urban development and establish effective assistance and resource-sharing mechanisms, leveraging its advantages to drive the development of other cities in Shanxi Province.
The policy implications of agglomeration development and the synergistic effects of land resource utilization efficiency in Shanxi Province can be summarized as follows: First, Shanxi Province should fully leverage its role as a provincial administrative unit and coordinate the agglomeration and improvement of land resource utilization efficiency among its municipalities from a provincial perspective. This can be achieved through unified deployment by the provincial government; the establishment of autonomous and orderly channels for the flow of factors, such as land, talent, technology, and capital between regions; and the improvement of industrial supply chains. These measures will gradually enhance land resource utilization efficiency, promote the coordinated development of industrial structures in cities throughout Shanxi Province, and enhance the integration of resources and information flow between regions. Second, Taiyuan should strengthen its radiating and supporting capabilities and act fully as a benchmark city. Taiyuan can refer to existing policies and practices that have promoted high-level ecological environment protection and high-quality development in key industries in its subordinate counties and transform the assistance mechanisms between cities and their subordinate counties into assistance mechanisms between advanced and less developed cities. This will assist the resource-based cities in Shanxi Province in breaking away from path dependency and improving land resource utilization efficiency.

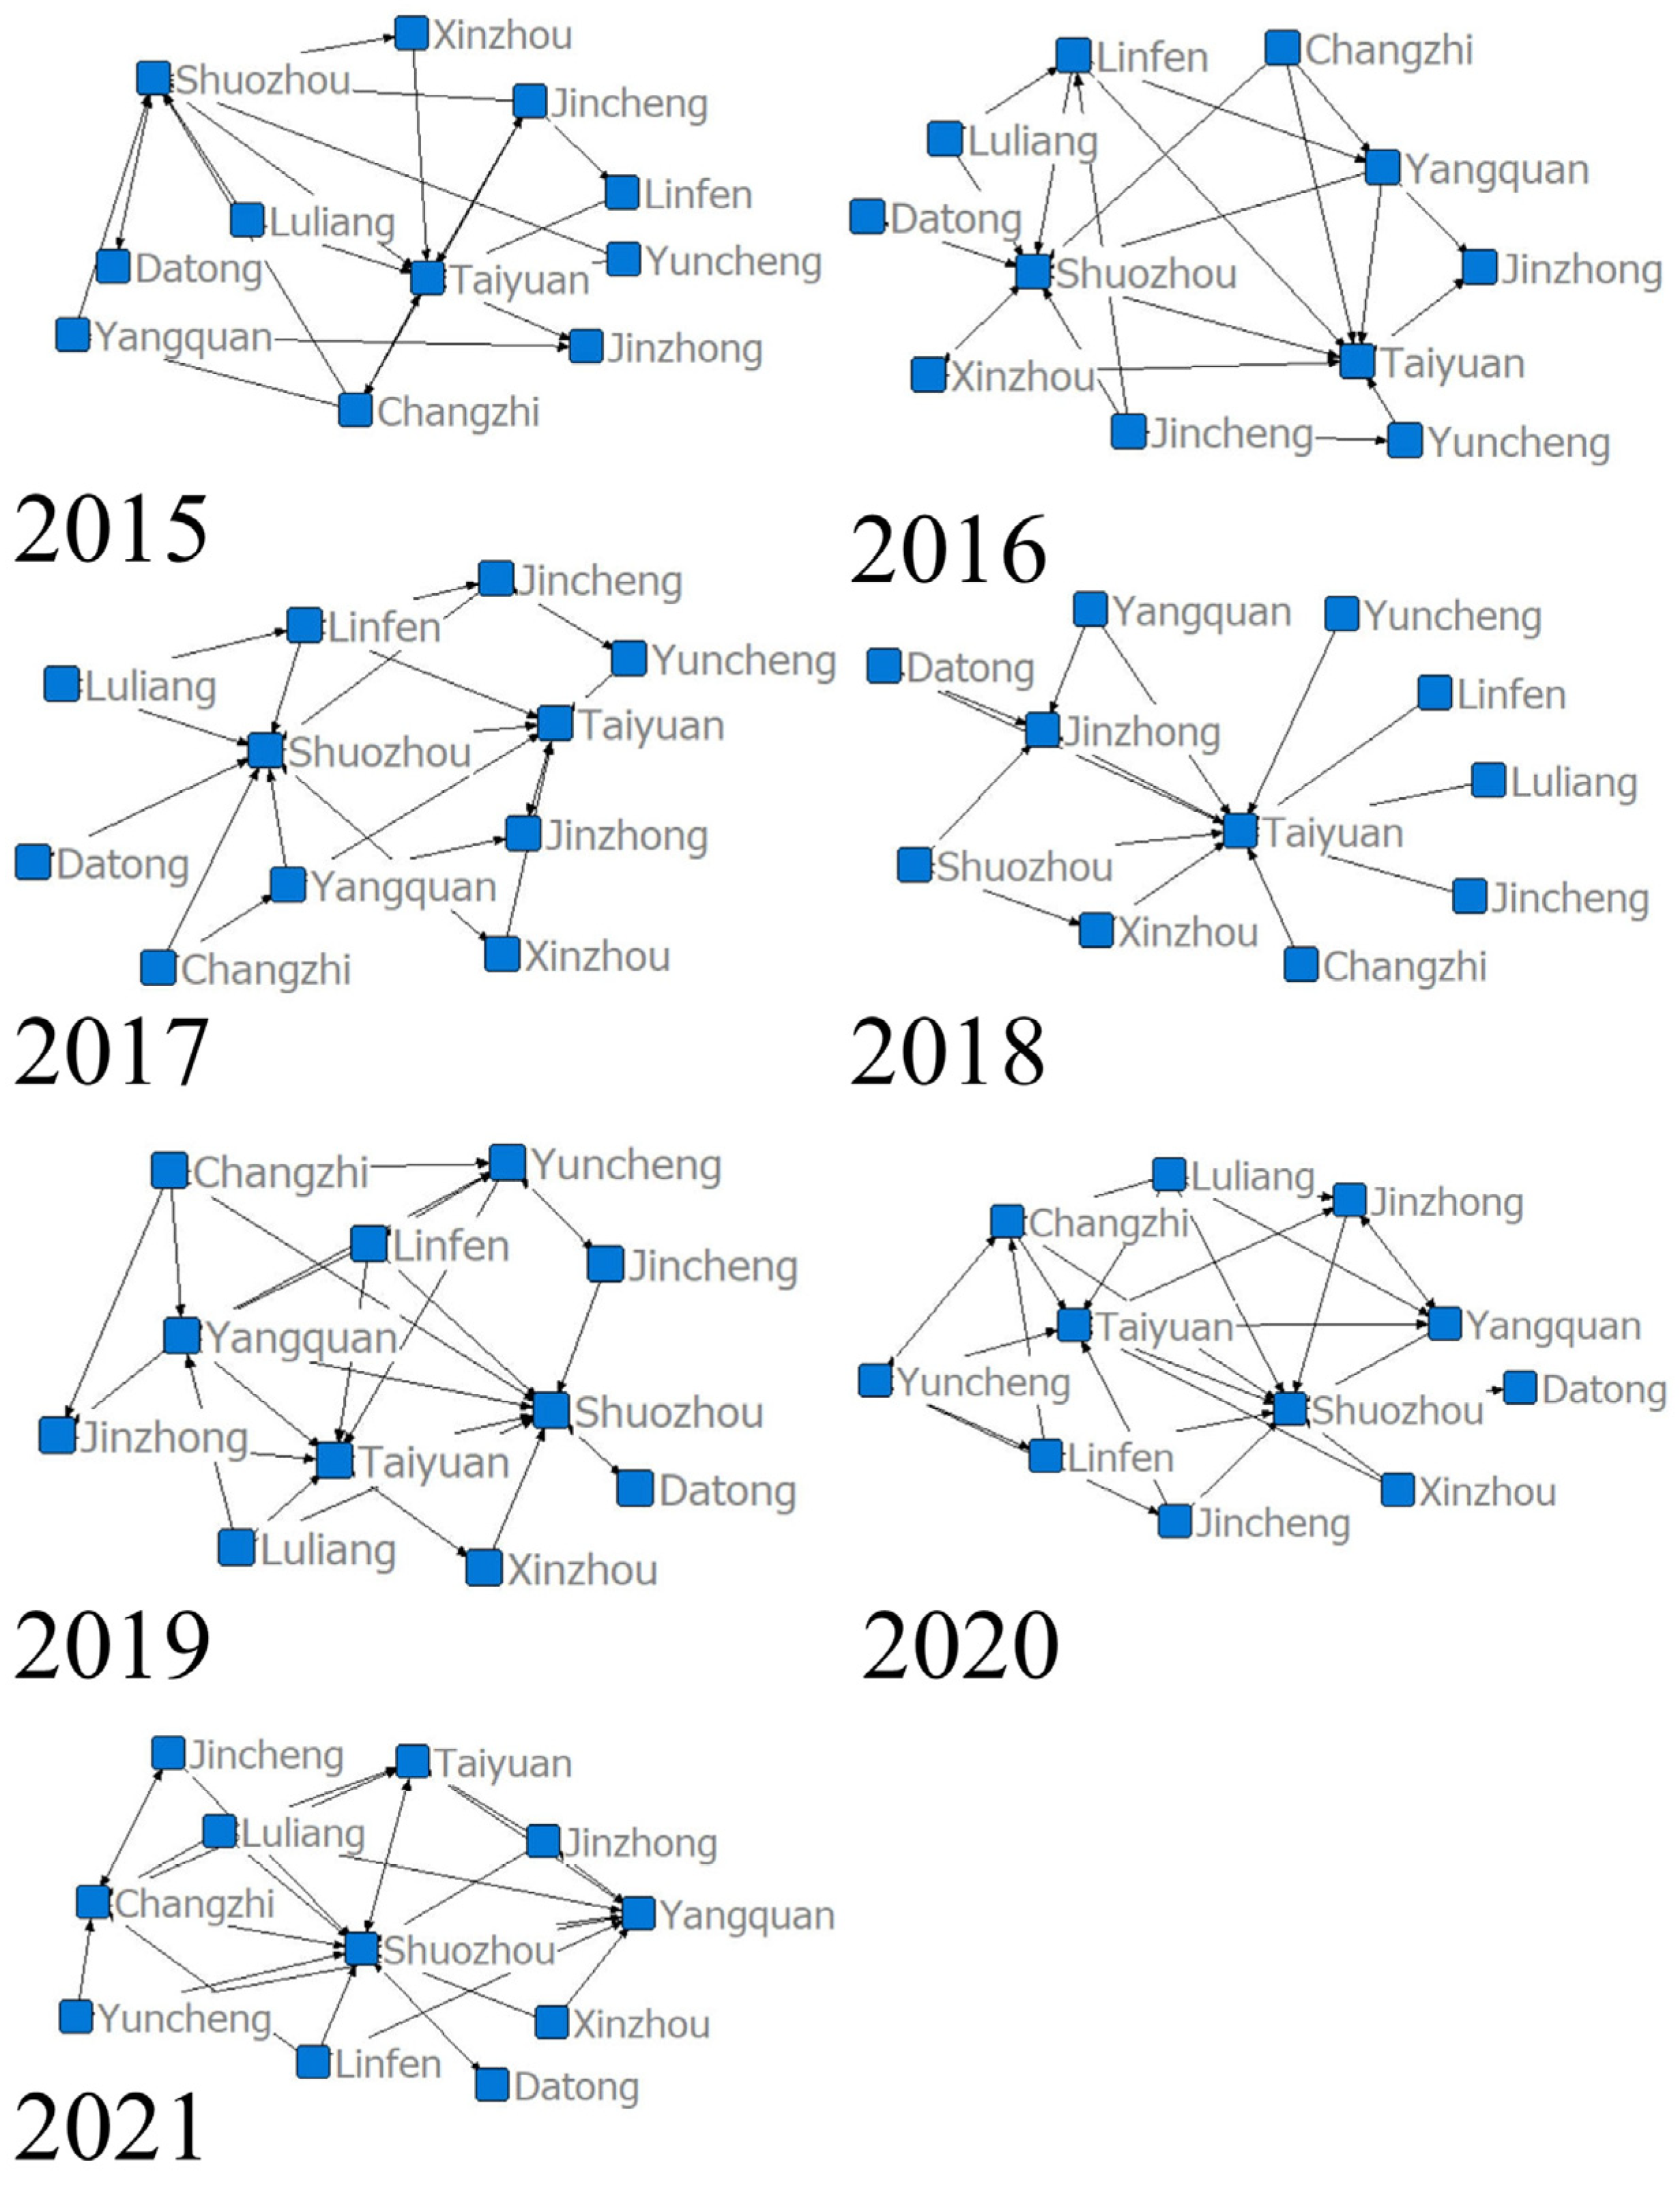
4.3. Network Characteristics of Land Resource Utilization Efficiency

On the basis of analyzing the spatiotemporal differentiation characteristics and agglomeration characteristics of land resource utilization efficiency in Shanxi Province, this study further analyzed its network characteristics. The purpose was to analyze this issue from the perspective of “relationship” characteristics rather than simply focusing on quantitative characteristics. According to the improved gravity model, this study created a structural diagram of land resource utilization efficiency in Shanxi Province from 2015 to 2021, as shown in Figure 3.
As shown in Figure 3, Taiyuan has always been the core of the network of land resource utilization efficiency in Shanxi Province, which is in line with the high-efficiency core in the spatiotemporal differentiation characteristics. Meanwhile, it also once again verifies the correctness of choosing Taiyuan as a model city in the process of analyzing the synergy effect. Except in 2018, Shuozhou also played an important role in the network. One of the reasons for this situation is that the utilization efficiency of land resources in Shuozhou has been relatively high over the years, and the efficiency values each year have exceeded 1. Another reason for Shuozhou occupying the core node of the network is that, as explained in the research area section, Shuozhou is a developing resource-based city with a relatively short history of resource exploitation and urban construction. In contrast, the other cities are all mature cities that have undergone relatively comprehensive resource exploitation and formed stable industrial layouts and economic structures. Therefore, compared with other cities, the transformation of Shuozhou is more rapid and efficient. Next, based on Equations (5)–(8), this study calculated four overall characteristic indicators of the network in Shanxi Province from 2015 to 2021, and the results are shown in Table 5.
As shown in Table 5, during the period from 2015 to 2021, the network density of land resource efficiency in Shanxi Province fluctuated from year to year, with values ranging from 0.1364 to 0.2909, indicating that the connection tightness among cities was relatively poor and that the interconnection situations among cities fluctuated in different years. The hierarchy also showed fluctuating changes, reaching the highest value of 0.9500 in 2018, which reflected that the hierarchical differences in the network structure of Shanxi Province were relatively significant in 2018. There were some core cities that had strong control and influence over other cities, and the relatively high values in other years also illustrated that such strong control was prevalent. In terms of efficiency, the values fluctuated between 0.6889 and 0.9111 each year. Despite the generally high values, it reflects the instability of the network, which was easily affected by various internal and external factors. Connectedness was 1 each year, indicating that the network of land resource utilization efficiency in Shanxi Province always remained in a fully connected state and had good network accessibility. Furthermore, in order to conduct an in-depth exploration of the individual characteristics of each city in the network of Shanxi Province, this study selected the year 2021 as the time node and used Equations (9)–(11) to calculate the three key indicators that reflect the individual network characteristics of each city in Shanxi Province. The results are shown in Table 6.
Table 6 shows some new results that are different from the previous research findings. Firstly, Taiyuan, as the provincial capital city, still occupies an important position in the network and plays a certain leading role in regional integration and coordination. However, it no longer holds an absolute dominant position in all indicators. Secondly, Shuozhou performs outstandingly in all indicators. Its degree and betweenness are as high as 100.000, indicating that it has the largest number of connections in the network and extensive associations with other cities, and it is in a core position in the communication paths among cities. Its closeness is 47.111, which is relatively high, reflecting that Shuozhou can conduct interactive exchanges with other cities in a relatively efficient manner. Thirdly, Datong, Jincheng, Xinzhou, Linfen, and Luliang are relatively low in terms of degree, betweenness, and closeness, indicating that their connectivity in the network, their ability to control resource flows, and their efficiency of interaction with other cities are relatively weak. They may be in more of a driven or auxiliary position in the collaborative system of land resource utilization efficiency in Shanxi Province.

5. Discussion

5.1. Research Findings and Comparative Analysis

This study investigates the interplay between land resource utilization efficiency and structural transformation in Shanxi Province, a resource-dependent region. The findings reveal critical spatial, agglomerative, and networked dynamics, which are contextualized below through thematic comparisons with broader literature.
Theme 1: Spatial-Temporal Disparities and Regional Fragmentation
The analysis highlights pronounced spatial disparities in land resource utilization efficiency across Shanxi’s cities (2015–2021), with only Taiyuan, Yangquan, and Shuozhou achieving average efficiency values > 1. The N-shaped temporal trend and unstable efficiency fluctuations in resource-based cities align with studies on resource-dependent regions, where path dependency and industrial inertia often hinder consistent land-use optimization [41,42]. Notably, the demarcation line between high- and low-efficiency cities (Taiyuan–Yangquan–Luliang) reflects a “core-periphery” divide, a phenomenon observed in other Chinese provinces, such as Heilongjiang and Inner Mongolia, where core cities dominate resource allocation [27]. However, unlike the coordinated regional clusters seen in the Yangtze River Delta [43], Shanxi’s northern and southern cities lack cohesive trends, underscoring fragmented governance and weak intercity linkages.
Theme 2: Weak Agglomeration and Coordination Deficits
The absence of significant land resource utilization efficiency agglomeration in Shanxi contrasts with studies emphasizing spatial autocorrelation in industrialized regions (e.g., Guangdong’s Pearl River Delta, where spillover effects drive efficiency convergence). This discrepancy suggests that Shanxi’s resource-based economy—reliant on decentralized mining and heavy industries—inhibits synergies. While Taiyuan holds a core network position, its declining influence mirrors challenges faced by traditional industrial hubs (e.g., Detroit’s waning dominance in the U.S. automotive sector), where failure to innovate erodes leadership [44,45,46]. The lack of a unified planning framework exacerbates this issue, diverging from successful cases like Germany’s Ruhr Valley, where centralized land-use policies enabled post-industrial cohesion [47].
Theme 3: Network Instability and Shifting Power Dynamics
The collaborative network of land resource utilization efficiency in Shanxi exhibits structural fragility (density = 0.14–0.29), diverging from the robust intercity linkages observed in advanced industrial clusters like the Yangtze River Delta. This instability mirrors transitional patterns in legacy industrial regions, similar to Detroit’s automotive network decline, where core cities lose influence as emerging hubs gain prominence [48]. Notably, Taiyuan’s waning network control (betweenness centrality = 66.7 vs. Shuozhou’s 100) contradicts traditional core–periphery models, echoing findings in Australia’s mining regions where resource-intensive nodes disrupt hierarchical structures [49]. While the province maintains full network accessibility, its loose connectivity aligns with challenges faced by Germany’s Ruhr Valley pre-restructuring, where fragmented coal-mining networks impeded coordinated land reuse [50]. Shanxi’s paradoxical node dominance—where emerging mining cities surpass administrative cores—highlights a unique “disruptive integration” phenomenon, contrasting with Zhejiang’s stable innovation networks anchored by Hangzhou’s sustained leadership [51,52,53]. This instability underscores the tension between path-dependent governance and emergent market forces in resource transitions.

5.2. Strategies for Enhancement

This study proposes policy recommendations based on the spatiotemporal differentiation characteristics, agglomeration, coordinated effects, and network characteristics of land resource utilization efficiency in Shanxi Province. The aim is to provide suggestions for improving land resource utilization efficiency in Shanxi Province and gradually achieve a sustainable development transition for resource-dependent regions.

5.2.1. Centralized Provincial Land Governance

The greatest obstacle to improving land resource utilization efficiency in Shanxi Province is the lack of a unified land resource utilization plan across the province. To address regional fragmentation and ensure coordinated land-use planning, Shanxi Province should establish a legally binding provincial planning framework supported by legislative and fiscal instruments. First, the Shanxi Spatial Planning Regulations should be amended to empower provincial land-use authorities with statutory authority to veto or revise municipal plans that conflict with provincial objectives. These authorities will convene regular intercity mayor meetings to negotiate industrial layouts, infrastructure projects, and land quota allocations. Second, a provincial digital governance platform should be developed to integrate real-time data on land-use efficiency, ecological conservation redlines, and resource flows, enabling dynamic adjustments to provincial planning. This platform will provide predictive analytics to preempt inefficiencies and spatial imbalances. Financially, a Regional Development Fund should be established, which can draw funds from resources such as the provincial budget, land sales revenue, and carbon emission tax. In order to incentivize compliance, cities that exceed their land-use efficiency targets will receive construction quota bonuses, while underperforming cities must purchase additional quotas from efficient peers at a higher premium.

5.2.2. Coordinated Land Resource Utilization

Shanxi Province should promote coordinated land resource utilization among its cities while focusing on improving low-performing cities in terms of land resource utilization efficiency. Firstly, the driving role of leveraged cities should be leveraged. Taiyuan, as the benchmark city for land resource utilization efficiency, should assist cities with lower land resource utilization efficiency in various aspects such as economy, talent, and technology. In terms of the economy, industrial adjustment assistance policies should be used to partially cover the costs of phasing out backward production capacity and introducing advanced production capacity in resource-based cities with low land resource utilization efficiency. Simultaneously, it is important to coordinate market mechanisms to address the weak self-regulatory capabilities of resource-based cities. In terms of talent, Taiyuan should assist resource-based cities by supporting the development of multidisciplinary technical professionals to address talent shortages and limited professional expertise. This should be accompanied by tailored talent cultivation and recruitment systems that expand talent sources and strengthen relationships. In terms of technology, Taiyuan should leverage its advantages in carbon reduction, capture, conversion, and sequestration to support carbon-reduction efforts in resource-based cities. Taiyuan can play a radiating role by leveraging technological advantages through technology sharing, project collaboration, and information exchange. Furthermore, policy tools should be used to promote land resource utilization transformation in lagging cities. At the micro level, the Shanxi Provincial Government should provide a favorable and sustainable external environment for land resource utilization transformation in resource-based cities through policies, financing, and credit support. Meanwhile, the implementation of the target responsibility system and other measures should be used to ensure that the local governments of resource-based cities bear the responsibility for energy saving and emissions reduction, industrial upgrading, and land resource utilization transformation to avoid inertia caused by path dependence. At the macro level, the Shanxi Provincial Government should strengthen the self-renewal and sustainable development capabilities of resource-based cities through measures such as establishing talent delivery mechanisms and reforming state-owned enterprises in the mining and industrial sectors. This will maximize the motivation for land resource utilization transformation in resource-based cities and provide the feasibility for transformation through policies, financing, and manpower, thereby maximizing the potential for land resource utilization transformation and improving the efficiency of land resource utilization in resource-based cities. Additionally, to reinforce cooperation, a part of annual mayor performance evaluations would hinge on achieving collaboration metrics (e.g., joint R&D projects, labor mobility). Cities resisting collaboration would face a cut in provincial fiscal transfers. These measures balance autonomy with collective gains, fostering trust and reducing redundant competition.

5.2.3. Strengthen Environmental Regulations

Shanxi Province should prioritize the role of environmental regulations by restricting mining production, rehabilitating subsidence mining areas [54], and limiting the emissions of waste materials, gases, wastewater, and other means to regulate environmental damage under existing land-use planning. This can help minimize unexpected outputs and improve land resource utilization efficiency, especially in resource-based cities where structural land-use transformation is challenging. Firstly, adhering to the principle of “polluter pays, restorer benefits”, ecological damage premiums should be levied on coking and coal-fired power enterprises [55]. A portion of these premiums would be injected into the mining area restoration fund, while another portion would be used to compensate polluted cities [56]. Additionally, a system for tracing ecological responsibility in watersheds should be implemented, requiring cities upstream of the Fen River to pay compensation to downstream cities for exceeding water quality standards. This compensation would be forcibly deducted by provincial finance. Secondly, we would link land approval with the low-carbon transformation. Enterprises applying for new land use must submit a “roadmap for reducing carbon intensity”, and high energy-consuming projects must purchase carbon sinks within the province in order to be approved. A “special bond for coal transformation” (partially subsidized by provincial finance) would be issued to raise funds for the retraining of workers from closed mines. Furthermore, we would implement a closed-loop supervision system for the entire supply chain. The Department of Natural Resources and the Department of Ecology and Environment would jointly carry out regular “land use-environmental protection” double inspections and enforce a “double penalty system” (fines and freezing of land-use permits) for non-compliant enterprises. Lastly, we would establish a blacklist of corporate environmental credit, which would prohibit companies from participating in land bidding, auction, and listing for three years.

6. Conclusions

This study identifies inadequate provincial-level coordination as the primary barrier to harmonizing land-use efficiency improvements across Shanxi’s cities, resulting in fragmented industrial transitions and stalled sustainable development in resource-dependent areas. To address this, three actionable pathways are proposed:
1. Centralized Provincial Land Governance: Amend the Shanxi Spatial Planning Regulations to empower a provincial authority with veto power over municipal plans, ensuring alignment with provincial goals; launch a real-time land-use efficiency monitoring platform integrating ecological redlines and resource flows; and establish a Regional Development Fund to finance cross-city mining rehabilitation and green infrastructure;
2. Coordinated land resource utilization: Fully leverage Taiyuan’s driving role in the economy, talent, technology, and other aspects; harness the positive role of policy tools in promoting the transformation of land resource utilization in underdeveloped cities; strengthen leadership responsibility; and link cooperation effectiveness to performance, rewards, and punishments;
3. Strengthen environmental regulations: Adhere to the principle “polluter pays, restorer benefits”; link land approval with the low-carbon transformation and issue “coal transformation special bonds”; implement a closed-loop supervision system for the entire supply chain and implement a “dual punishment system” for non-compliant enterprises; and establish a blacklist of corporate environmental credit.
Theoretical contributions reveal that Shanxi’s absence of “core-periphery” spatial dynamics—unlike typical urban clusters—demands tailored governance models rather than conventional agglomeration policies. Future research should quantify the efficacy of unified regional policies, particularly the elasticity of intercity efficiency convergence under varying fiscal incentives (e.g., tax-sharing ratios and quota pricing mechanisms).

Author Contributions

Conceptualization, M.L.; Data curation, M.L.; Formal analysis, M.L.; Funding acquisition, R.M.; Investigation, M.L.; Methodology, M.L.; Project administration, R.M.; Resources, M.L.; Software, M.L.; Supervision, M.L.; Validation, M.L.; Writing—original draft, M.L.; Writing—review and editing, R.M. All authors have read and agreed to the published version of the manuscript.

Funding

This research was supported by “the Fundamental Research Funds for the Central Universities (2023MS160)”.

Institutional Review Board Statement

Not applicable.

Informed Consent Statement

Not applicable.

Data Availability Statement

The original contributions presented in this study are included in the article. Further inquiries can be directed to the corresponding author.

Conflicts of Interest

The authors declare no conflicts of interest.

References

  1. Li, J.; Li, W.; Li, B.; Duan, L.; Zhang, T.; Jia, Q. Construction Land Expansion of Resource-Based Cities in China: Spatiotemporal Characteristics and Driving Factors. Int. J. Environ. Res. Public Health 2022, 19, 16109. [Google Scholar] [CrossRef] [PubMed]
  2. Dinga, G.D.; Mama, N.; Achuo, E.D. Resource abundance: Blessing or curse? Comparative analyses of point and diffuse resources. Heliyon 2024, 10, e25078. [Google Scholar] [CrossRef] [PubMed]
  3. Duan, P.; Du, P.; Ruan, Z. Spatio-temporal pattern evolution of green development efficiency in Northeastern China and its driving factors. Heliyon 2024, 10, e32119. [Google Scholar] [CrossRef] [PubMed]
  4. Li, H.; Zhu, M.; Wang, Z.; Hong, J.; Wang, Y. Synergy level of urban resilience and urban land use efficiency in the Yellow River Basin: Spatial-temporal evolution characteristics and driving factors. Heliyon 2024, 10, e31456. [Google Scholar] [CrossRef]
  5. Zhang, K.; Tian, Y. Research on the spatio-temporal coupling relationship between agricultural green development efficiency and food security system in China. Heliyon 2024, 10, e31893. [Google Scholar] [CrossRef]
  6. He, S.; Gong, X.; Ding, J.; Ma, L. Environmental regulation influences urban land green use efficiency: Incentive or disincentive effect? Evidence from China. Heliyon 2024, 10, e30122. [Google Scholar] [CrossRef]
  7. Tang, M.; Hu, F. Land urbanization and urban CO2 emissions: Empirical evidence from Chinese prefecture-level cities. Heliyon 2023, 9, e19834. [Google Scholar] [CrossRef]
  8. Wang, H.; Li, Z. Can the digitalization level of agriculture improve its ecological efficiency under carbon constraints: Evidence from China. Heliyon 2024, 10, e26750. [Google Scholar] [CrossRef]
  9. Wang, J.; Yu, Z. The Multiple Heterogeneity of Low Carbon Technology Progress Driving Carbon Reduction in Resource Based Cities. China Popul. Resour. Environ. 2022, 32, 156–170. [Google Scholar]
  10. Cen, Z.; Wang, Z. Interprovincial Differences in the Driving Factors of Carbon Reduction Pressure for Local Governments in China: Based on the STIRPAT Model. Resour. Sci. 2012, 34, 718–724. [Google Scholar]
  11. Wang, J.; Zhang, Y.; Du, X.; Lin, C. A Study on the Multiple Heterogeneity of Environmental Regulation Intensity in Resource Based Cities in China. Ecol. Econ. 2022, 38, 88–93+111. [Google Scholar]
  12. Ma, W.; Zhao, L.; Wang, N.; Zhang, L.; Li, H. A Study on the Driving Factors of Pollution Reduction and Carbon Reduction in the Yangtze River Delta Urban Agglomeration. J. Ecol. Rural. Environ. 2022, 38, 1273–1281. [Google Scholar]
  13. Xu, Y.; Cheng, Y.; Wang, J. The spatiotemporal evolution of carbon emission efficiency in resource-based cities in China and the impact of green technology innovation. Geogr. Res. 2023, 42, 878–894. [Google Scholar]
  14. Zheng, H.; Ye, A. The spatial correlation network structure and influencing factors of carbon emissions in urban agglomerations. Chin. Environ. Sci. 2022, 42, 2413–2422. [Google Scholar]
  15. Psycharis, Y.; Kallioras, D.; Pantazis, P. Economic crisis and regional resilience: Detecting the ‘geographical footprint’of economic crisis in Greece. Reg. Sci. Policy Pract. 2014, 6, 121–142. [Google Scholar] [CrossRef]
  16. Cobbinah, P.B.; Erdiaw-Kwasie, M.O.; Amoateng, P. Africa’s urbanisation: Implications for sustainable development. Cities 2015, 47, 62–72. [Google Scholar] [CrossRef]
  17. Cobbinah, P.B.; Finn, B.M. Planning and climate change in African cities: Informal urbanization and ‘Just’Urban transformations. J. Plan. Lit. 2023, 38, 361–379. [Google Scholar] [CrossRef]
  18. Florida, R.; Mellander, C.; Stolarick, K. Inside the black box of regional development—Human capital, the creative class and tolerance. J. Econ. Geogr. 2008, 8, 615–649. [Google Scholar] [CrossRef]
  19. Lu, Y.; Cao, B.; Hua, Y.; Ding, L. Efficiency measurement of green regional development and its influencing factors: An improved data envelopment analysis framework. Sustainability 2020, 12, 4361. [Google Scholar] [CrossRef]
  20. Cao, W.; Wu, D.; Huang, L.; Liu, L. Spatial and temporal variations and significance identification of ecosystem services in the Sanjiangyuan National Park, China. Sci. Rep. 2020, 10, 6151. [Google Scholar] [CrossRef]
  21. Chen, C.; He, X.; Liu, Z.; Sun, W.; Dong, H.; Chu, Y. Analysis of regional economic development based on land use and land cover change information derived from Landsat imagery. Sci. Rep. 2020, 10, 12721. [Google Scholar] [CrossRef]
  22. Hoekveld, J.J. Understanding Spatial Differentiation in Urban Decline Levels. Eur. Plan. Stud. 2014, 22, 362–382. [Google Scholar] [CrossRef]
  23. Döringer, S.; Uchiyama, Y.; Penker, M.; Kohsaka, R. A meta-analysis of shrinking cities in Europe and Japan. Towards an integrative research agenda. Eur. Plan. Stud. 2020, 28, 1693–1712. [Google Scholar] [CrossRef]
  24. Cobbinah, P.B.; Asibey, M.O.; Gyedu-Pensang, Y.A. Urban land use planning in Ghana: Navigating complex coalescence of land ownership and administration. Land Use Policy 2020, 99, 105054. [Google Scholar] [CrossRef]
  25. Cobbinah, P.B.; Aboagye, H.N. A Ghanaian twist to urban sprawl. Land Use Policy 2017, 61, 231–241. [Google Scholar] [CrossRef]
  26. Li, H.; Long, R.; Chen, H. Economic transition policies in Chinese resource-based cities: An overview of government efforts. Energy Policy 2013, 55, 251–260. [Google Scholar] [CrossRef]
  27. Chen, Y.; Chang, J.; Li, Z.; Ming, L.; Li, C.; Li, C. Coupling Coordination and Spatiotemporal Analysis of Urban Compactness and Land-Use Efficiency in Resource-Based Areas: A Case Study of Shanxi Province, China. Land 2023, 12, 1658. [Google Scholar] [CrossRef]
  28. Mouratidis, K. Compact city, urban sprawl, and subjective well-being. Cities 2019, 92, 261–272. [Google Scholar] [CrossRef]
  29. Yao, Z.; Jiang, C.; Shan-shan, F. Effects of urban growth boundaries on urban spatial structural and ecological functional optimization in the Jining Metropolitan Area, China. Land Use Policy 2022, 117, 106113. [Google Scholar] [CrossRef]
  30. Zhang, H.; Song, Y.; Zhang, M.; Duan, Y. Land use efficiency and energy transition in Chinese cities: A cluster-frontier super-efficiency SBM-based analytical approach. Energy 2024, 304, 132049. [Google Scholar] [CrossRef]
  31. Yang, X.; Bai, Y.; Che, L.; Qiao, F.; Xie, L. Incorporating ecological constraints into urban growth boundaries: A case study of ecologically fragile areas in the Upper Yellow River. Ecol. Indic. 2021, 124, 107436. [Google Scholar] [CrossRef]
  32. Cerqueira, P.A.; Martins, R. Measuring the determinants of business cycle synchronization using a panel approach. Econ. Lett. 2009, 102, 106–108. [Google Scholar] [CrossRef]
  33. Yu, K.; Li, Z. Coupling coordination and spatial network characteristics of carbon emission efficiency and urban green innovation in the Yellow River Basin, China. Sci. Rep. 2024, 14, 27690. [Google Scholar] [CrossRef] [PubMed]
  34. Nel, E.; Marais, L.; Mqotyana, Z. The regional implications of just transition in the world’s most coal-dependent economy: The case of Mpumalanga, South Africa. Front. Sustain. Cities 2023, 4, 1059312. [Google Scholar] [CrossRef]
  35. Chen, Y.; Chen, Z.; Xu, G.; Tian, Z. Built-up land efficiency in urban China: Insights from the General Land Use Plan (2006–2020). Habitat Int. 2016, 51, 31–38. [Google Scholar] [CrossRef]
  36. Gao, X.; Zhang, A.; Sun, Z. How regional economic integration influence on urban land use efficiency? A case study of Wuhan metropolitan area, China. Land Use Policy 2020, 90, 104329. [Google Scholar] [CrossRef]
  37. He, S.Y.; Lee, J.; Zhou, T.; Wu, D. Shrinking cities and resource-based economy: The economic restructuring in China’s mining cities. Cities 2017, 60, 75–83. [Google Scholar] [CrossRef]
  38. Sun, W.; Huang, C. How does urbanization affect carbon emission efficiency? Evidence from China. J. Clean. Prod. 2020, 272, 122828. [Google Scholar] [CrossRef]
  39. Cao, H.; Han, L.; Liu, M.; Li, L. Spatial differentiation of carbon emissions from energy consumption based on machine learning algorithm: A case study during 2015–2020 in Shaanxi, China. J. Environ. Sci. 2024, 149, 358–373. [Google Scholar] [CrossRef]
  40. Wang, W.; Yang, Y. Spatial-temporal differentiation characteristics and driving factors of China’s energy eco-efficiency based on geographical detector model. J. Clean. Prod. 2024, 434, 140153. [Google Scholar] [CrossRef]
  41. Ge, X.J.; Liu, X. Urban Land Use Efficiency under Resource-Based Economic Transformation—A Case Study of Shanxi Province. Land 2021, 10, 850. [Google Scholar] [CrossRef]
  42. Li, J.; Hu, J.; Kang, J.; Shu, W. Spatio-temporal variation and prediction of land use and carbon storage based on PLUS-InVEST model in Shanxi Province, China. Landsc. Ecol. Eng. 2025, 21, 107–119. [Google Scholar] [CrossRef]
  43. Ye, L.; Wang, G.; Meng, Y. Multidimensional Measurement and Regulation of Regional Coordinated and Balanced Development Levels: Using the Yangtze River Delta Region in China as an Example. Sustainability 2024, 16, 927. [Google Scholar] [CrossRef]
  44. Chen, X. The Dilemma of Economic Transformation behind Shanxi’s Coal Maximization. In Proceedings of the 2018 2nd International Conference on Education Science and Economic Management (ICESEM 2018), Xiamen, China, 25–26 August 2018. [Google Scholar]
  45. Srzentić, M. Strukturne promene u privredama SAD i EU prouzrokovane širenjem klastera. Међунарoднa Пoлитика 2021, 72, 65–86. [Google Scholar] [CrossRef]
  46. Xu, S.; Zhang, Y. Impact of Manufacturing Agglomeration on the Green Innovation Efficiency—Spatial Effect Based on China’s Provincial Panel Data. Int. J. Environ. Res. Public Health 2023, 20, 4238. [Google Scholar] [CrossRef]
  47. Deweerdt, T.; Fabre, A. The role of land use planning in urban Transport to Mitigate climate Change: A literature review. Adv. Environ. Eng. Res. 2022, 3, 1–22. [Google Scholar] [CrossRef]
  48. Zhang, R.; Lu, J. Spatial–temporal pattern and convergence characteristics of provincial urban land use efficiency under environmental constraints in China. Int. J. Environ. Res. Public Health 2022, 19, 10729. [Google Scholar] [CrossRef]
  49. Cheshire, L.; Everingham, J.-A.; Lawrence, G. Governing the impacts of mining and the impacts of mining governance: Challenges for rural and regional local governments in Australia. J. Rural. Stud. 2014, 36, 330–339. [Google Scholar] [CrossRef]
  50. Van Houtum, H.; Lagendijk, A. Contextualising regional identity and imagination in the construction of polycentric urban regions: The cases of the Ruhr area and the Basque country. Urban Stud. 2001, 38, 747–767. [Google Scholar] [CrossRef]
  51. Chen, T. Industry cluster’s innovation network structure and competitiveness in Zhejiang Province. In Proceedings of the 2008 4th IEEE International Conference on Management of Innovation and Technology, Bangkok, Thailand, 21–24 September 2008. [Google Scholar]
  52. Zhang, J.; Hao, Q.; Chen, X.; Zhu, C.; Zhang, L.; Hong, M.; Wu, J.; Gan, M. Exploring Spatial Network Structure of the Metropolitan Circle Based on Multi-Source Big Data: A Case Study of Hangzhou Metropolitan Circle. Remote Sens. 2022, 14, 5266. [Google Scholar] [CrossRef]
  53. Yao, J.; Li, H.; Shang, D.; Ding, L. Evolution of the Industrial Innovation Ecosystem of Resource-Based Cities (RBCs): A Case Study of Shanxi Province, China. Sustainability 2021, 13, 11350. [Google Scholar] [CrossRef]
  54. Liu, M.; Dong, X.; Wang, X.; Zhao, B.; Wei, H.; Fan, W.; Zhang, C. The Trade-Offs/Synergies and Their Spatial-Temporal Characteristics between Ecosystem Services and Human Well-Being Linked to Land-Use Change in the Capital Region of China. Land 2022, 11, 749. [Google Scholar] [CrossRef]
  55. Fan, W.; Chen, N.; Yao, W.; Meng, M.; Wang, X. Integrating Environmental Impact and Ecosystem Services in the Process of Land Resource Capitalization—A Case Study of Land Transfer in Fuping, Hebei. Sustainability 2021, 13, 2837. [Google Scholar] [CrossRef]
  56. Li, T.; Singh, R.K.; Cui, L.; Xu, Z.; Liu, H.; Fava, F.; Kumar, S.; Song, X.; Tang, L.; Wang, Y.; et al. Navigating the landscape of global sustainable livelihood research: Past insights and future trajectory. Environ. Sci. Pollut. Res. 2023, 30, 103291–103312. [Google Scholar] [CrossRef] [PubMed]
Figure 1. Temporal and spatial differentiation of Shanxi Province (2015–2021).
Sustainability 17 02458 g001
Figure 2. Global Moran’s I index map of land resource utilization efficiency in Shanxi Province (2015–2021).
Sustainability 17 02458 g002
Figure 3. Network structural diagram of land resource utilization efficiency in Shanxi Province (2015–2021).
Sustainability 17 02458 g003
Table 1. Input–output index system of land resource utilization efficiency.
IndicatorPrimary IndicatorSecondary IndicatorData Sources
InputLand resource inputUrban construction land areaChina City Statistical Yearbook
Capital inputTotal fixed asset investmentChina City Statistical Yearbook and National Economic and Social Development Statistical Bulletin
Human resource inputUrban employment populationChina City Statistical Yearbook and National Economic and Social Development Statistical Bulletin
OutputExpected outputRegional gross domestic productChina City Statistical Yearbook
Unexpected outputIndustrial wastewater dischargeChina City Statistical Yearbook and National Economic and Social Development Statistical Bulletin
Industrial dust emissionChina City Statistical Yearbook and National Economic and Social Development Statistical Bulletin
Table 2. Land resource utilization efficiency scores of Shanxi Province (2015–2021).
City2015201620172018201920202021Mean
Taiyuan1.10201.26501.23531.35121.11381.06171.07861.1725
Datong0.35430.39320.37670.45610.43420.46400.55340.4331
Yangquan1.14241.15681.13231.10741.05071.07521.07011.1050
Changzhi0.50730.51990.52930.16160.49150.56881.08880.5525
Jincheng0.57120.68600.50950.21550.72021.05451.06340.6886
Shuozhou1.17321.13741.14661.11281.09751.10341.11161.1261
Jinzhong0.51480.53690.52990.16531.14181.11901.11180.7314
Yuncheng0.63961.00840.76020.20151.00360.75850.8550.7467
Xinzhou0.41370.44820.38680.14311.04451.00651.01280.6365
Linfen0.51940.56760.46430.18990.48670.49380.56630.4697
Luliang1.15331.09991.11040.07431.06771.08431.05310.9490
Mean0.7356 0.8018 0.7438 0.4708 0.8775 0.8900 0.9604
Table 3. Agglomeration characteristics of land resource utilization efficiency in Shanxi Province.
YearGlobal Moran’s Ip-Valuez-Score
2015−0.2020.6218−0.4932
2016−0.21220.5897−0.5393
2017−0.1681−0.32910.7421
20180.01260.57210.5673
20190.02340.54420.6064
2020−0.10850.9666−0.0418
2021−0.17260.6945−0.3927
Table 4. Synergistic effect of land resource utilization efficiency in Shanxi Province (2016–2021).
CityDirectionDistance (km)201620172018201920202021MeanRank
DatongNortheast2810.62120.38080.9944−0.7979−3.14350.0040−0.07983
YangquanEast1150.81810.9771−0.82300.72130.95080.99270.73931
ChangzhiSouth2250.87990.6596−4.40090.0071−1.75390.5214−0.76977
JinchengSouth3040.68780.7845−4.4263−1.1186−4.6507−1.4753−1.48538
ShuozhouNorth2130.89640.9719−1.80110.95310.94930.99980.55692
JinzhongSouth270.07060.2380−4.9083−3.0539−3.2730−0.9788−1.506810
YunchengSouthwest390.70780.9963−4.1712−1.0068−0.22140.5391−0.35245
XinzhouNorth810.2102−0.3394−4.6199−3.2709−3.3054−0.9690−1.49049
LinfenSouthwest2630.81000.9970−4.20230.0653−0.66430.3787−0.34954
LuliangWest1840.96030.7936−4.4352−0.0642−0.81640.1662−0.39496
Mean 0.12730.0526−3.47810.4351−0.23430.0179−0.5133
Table 5. Overall network characteristic of land resource utilization efficiency in Shanxi Province (2015–2021).
DensityHierarchyEfficiencyConnectedness
20150.20910.88100.80001.0000
20160.22730.77550.77781.0000
20170.21820.72340.82221.0000
20180.13640.95000.91111.0000
20190.26360.74510.71111.0000
20200.29090.68000.68891.0000
20210.25450.76600.71111.0000
Table 6. Individual network characteristic of land resource utilization efficiency in Shanxi Province (2021).
CityDegreeBetweennessCloseness
Taiyuan50.00066.6672.296
Datong10.00052.6320.000
Yangquan70.00076.92312.222
Changzhi60.00071.4298.148
Jincheng20.00055.5560.000
Shuozhou100.000100.00047.111
Jinzhong30.00058.8240.000
Yuncheng30.00058.8240.444
Xinzhou20.00055.5560.000
Linfen30.00058.8240.444
Luliang40.00062.5000.444
Disclaimer/Publisher’s Note: The statements, opinions and data contained in all publications are solely those of the individual author(s) and contributor(s) and not of MDPI and/or the editor(s). MDPI and/or the editor(s) disclaim responsibility for any injury to people or property resulting from any ideas, methods, instructions or products referred to in the content.

