1. Introduction
Energy performance is a critical aspect of agricultural sustainability, posing substantial challenges to the long-term viability and sustainability of agricultural systems in the twenty-first century [
1]. Although industrialized agriculture has increased yields [
2,
3], it is not energetically balanced or sustainable [
4,
5]. A sixfold increase in food crop energy yield since 1900 has been accompanied by an 85-fold increase in energy inputs [
6]. This trend has disrupted global food and economic systems, marking a turning point in the relationship between energy and agriculture. Developing an Agricultural Energy Management Plan, which includes an on-farm energy audit and strategies for energy conservation, efficiency, and generation, is critical [
7]. The energy pyramid framework provides a useful method for energy management in farming systems. The first step of the energy pyramid involves an energy analysis, often an energy audit. This audit reviews current energy consumption and recommends approaches and strategies to lower energy-related costs, through more efficient practices and equipment use. The second step focuses on energy conservation through simple behavioral changes. The third step, energy efficiency, involves upgrading energy-efficient equipment. The fourth step is time-of-use management, which reduces grid load by using energy at specific times. At the top of the pyramid is renewable energy generated from naturally replenishing sources like solar and wind power [
8]. Using the energy pyramid allows for designing and implementing agricultural energy efficiency programs, providing energy audits, and calculating output–input ratios and energy use patterns [
9]. Energy analysis has been used to design, simulate, and operate more energy-efficient systems that rely on internal ecosystem control processes rather than external inputs.
In Iran, the agriculture sector plays a significant socio-economic role, contributing 11% to the GDP. However, it suffers from imbalanced energy flow, with about 87% of input energy from non-renewable sources [
10,
11]. This imbalance is particularly severe in horticulture [
12]. To mitigate these energy imbalances, this study aims to develop an energy management plan for grape production systems in Takestan County, Qazvin Province, Iran as the third-ranked largest producer nationwide [
13]. Relatively, we (1) investigate energy use patterns and forms of energy in grape production; (2) develop an econometric model revealing the relationship between energy input, yield, cost, and income; (3) calculate economic and energy indices for grape production; and (4) determine strategies for energy conservation, efficiency, and renewable energy use. GIS was applied to explore spatial data and understand energy use patterns geographically. This approach helps local managers consider diverse ways to address energy consumption in grape orchards, providing stronger support for quantitative analysis of spatial disparities [
14].
2. Materials and Methods
2.1. Research Area
Iran is a significant grape producer in the Middle East [
15]. According to FAO statistics from 2022, global grape production was 74,942,573 tons [
16]. In that year, Iran contributed 2,240,000 tons (3.24%) to the world’s grape production, with a total cultivation area of 227,000 hectares [
17]. Iran ranked ninth globally in grape production, following China (13.12%), Italy (10.30%), the USA (9.78%), France (9.54%), Spain (8.41%), Turkey (6.22%), Chile (4.56%), and Argentina (3.98%) [
15]. In terms of yield, Iran was 31st in the world, producing an average of 9.87 tons per hectare of fresh grapes, compared to the world average of 9.79 tons per hectare [
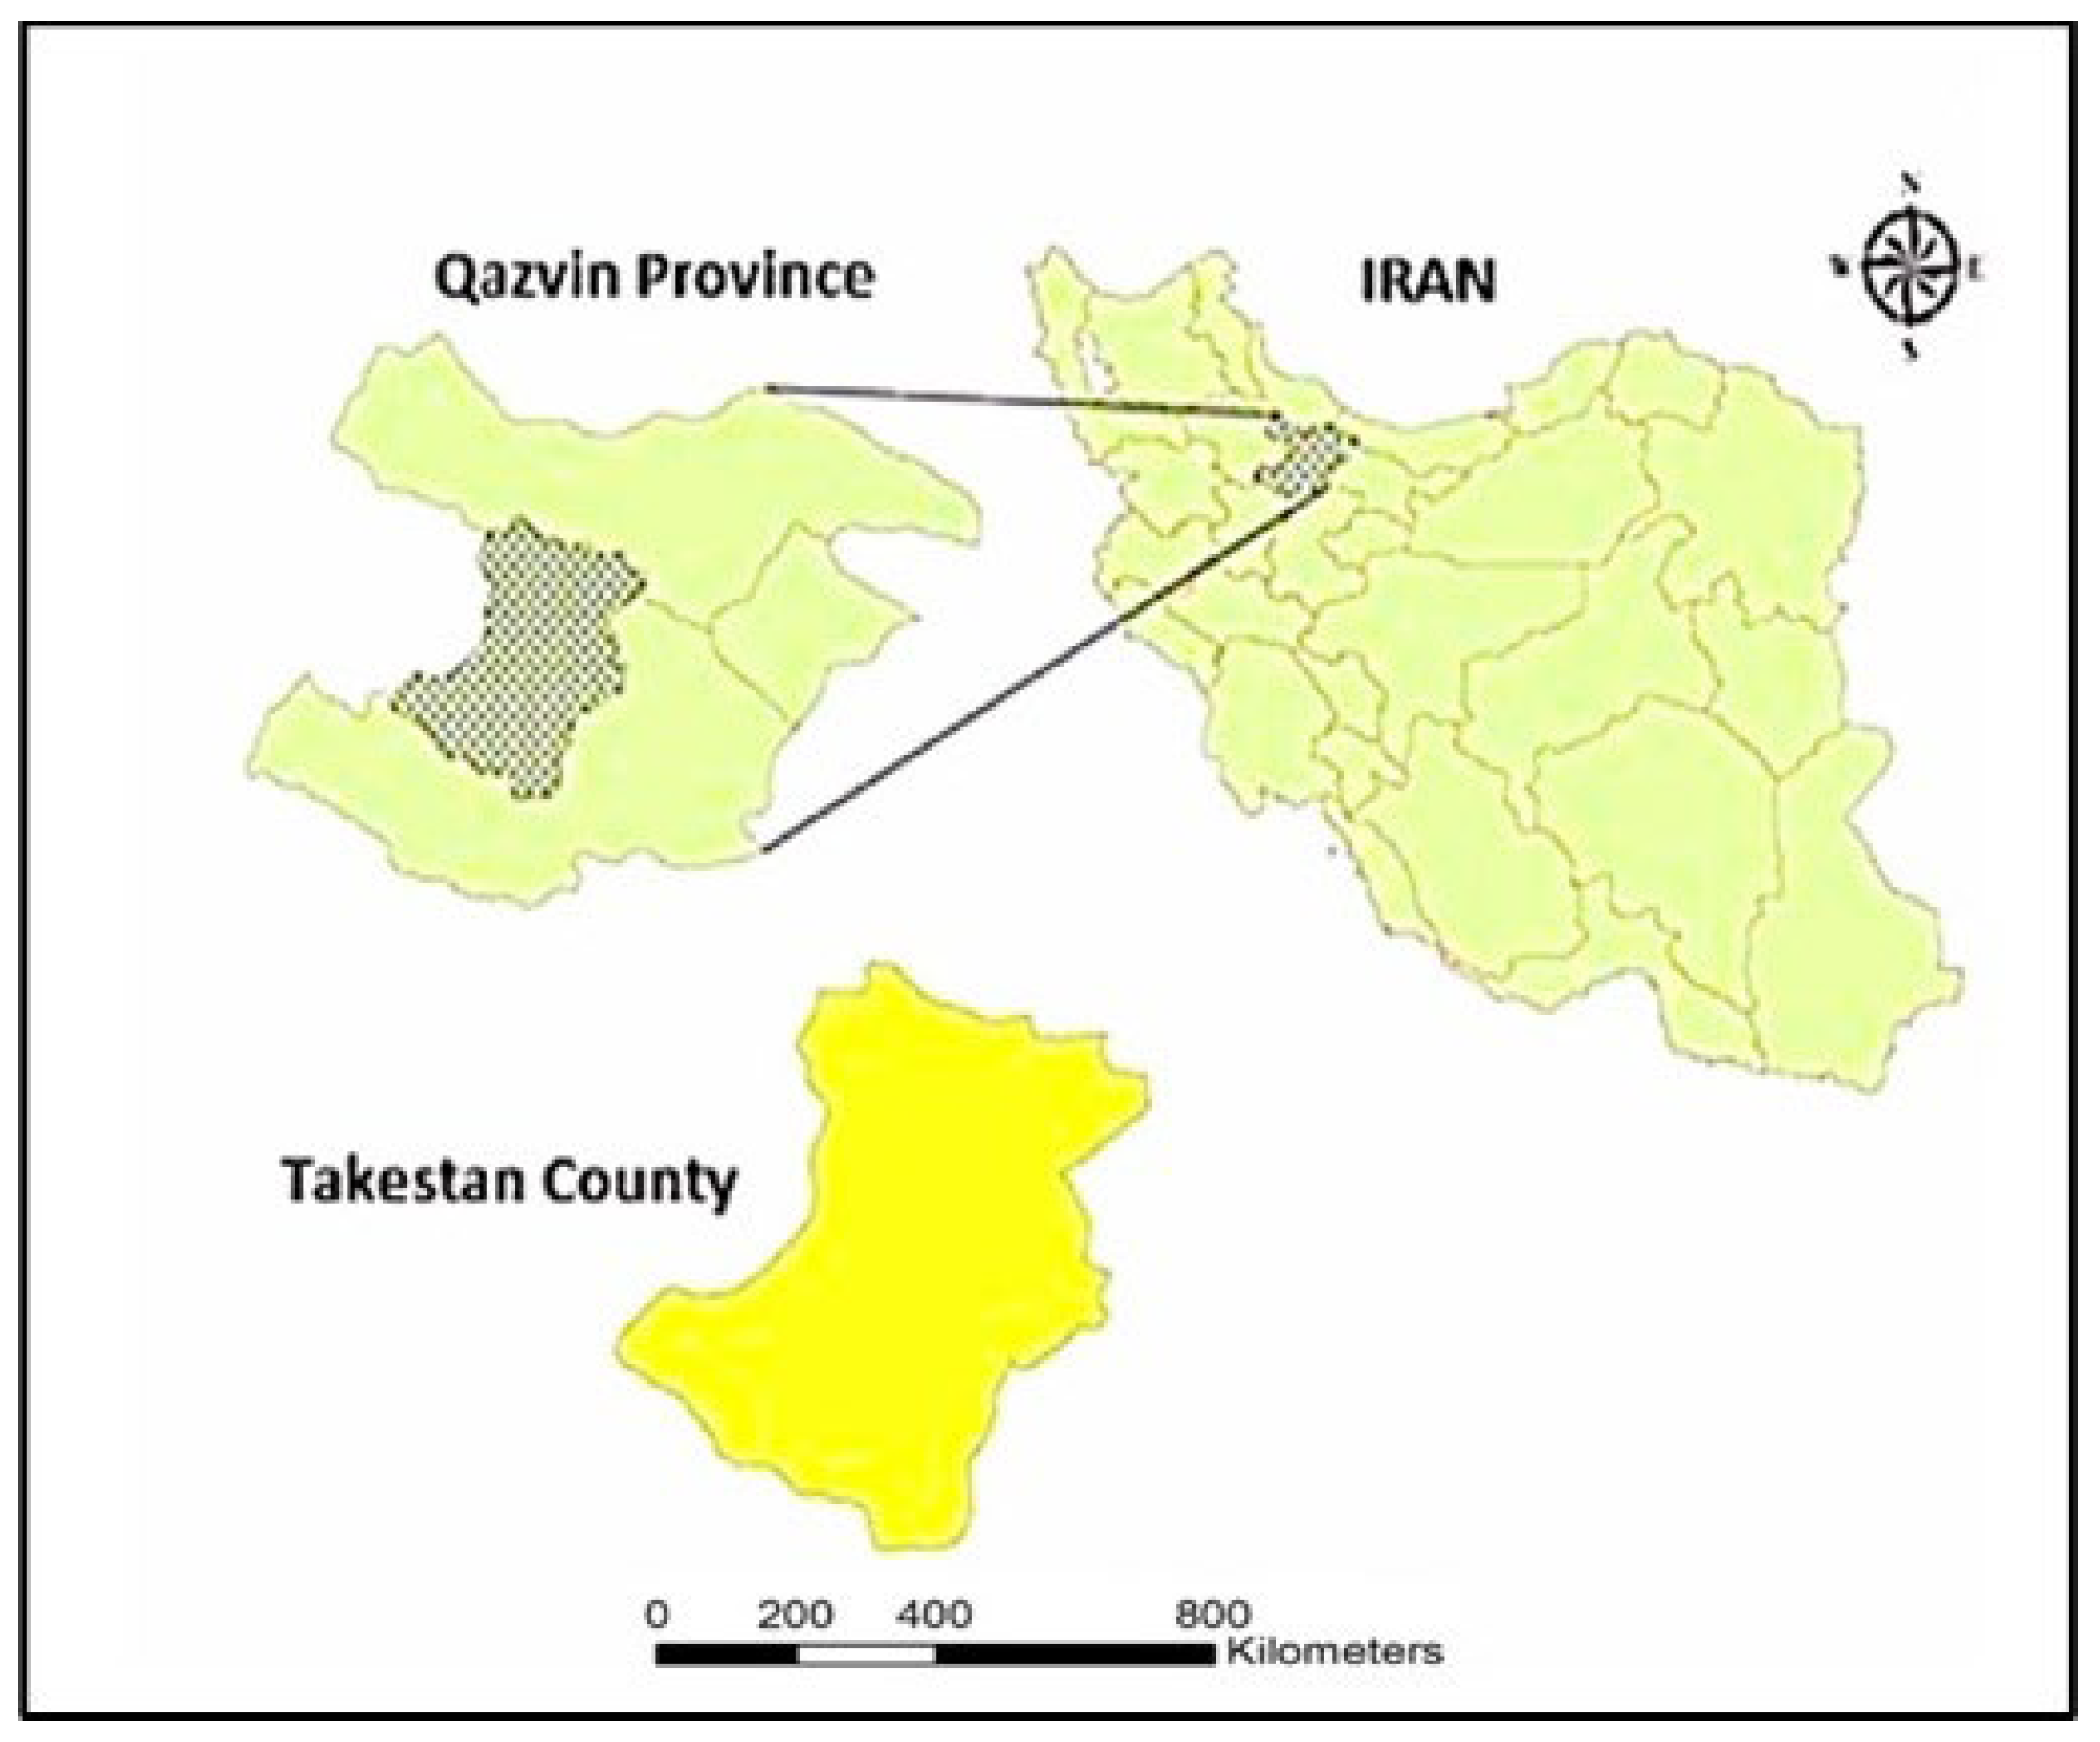
18]. Takestan in Qazvin Province, Iran is the primary grape production center in the region, covering 25,626 hectares (73.22%) of the province’s grape orchards and contributing 27,770 tons (85.5%) of its grape production (
Figure 1). Located at 1200 m elevation, in northwestern Iran at latitudes 35°24′ to 36°48′ N and longitudes 48°44′ to 50°51′ E, Takestan benefits from favorable climatic conditions for grape cultivation. Producing premium table and raisin grapes, it supports domestic and export markets, though climate change and water scarcity necessitate sustainable farming solutions. These factors position Takestan as the third-largest grape cultivation area in Iran, following the Fars and Khorasan-Razavi provinces, and the leading region in grape production in the country [
13].
2.2. Experimental and Sampling Procedure
We surveyed a sample of 220 grape-growers during the 2020–2021 growing season. Grape farmers were randomly selected from six villages in the study area to ensure a representative sample. The sample size was determined using Equation (1), derived from the Neyman technique [
19], as follows:
where:
n is the sample size;
N is the number of holdings in the population;
Nh is the population size;
is the variance of h;
= /;
D is the precision of ( − );
z is the reliability coefficient (1.96 for a 95% confidence level).
The permissible error in the sample size was 5% for the 95% confidence level, resulting in a sample size of 220 farms.
2.3. Methodology of Budgeting Energy
The input and energy requirements for grape production were collected and determined through questionnaires. The questionnaire included information on the output and input for grape production and economic characteristics. The inputs (human labor, machinery, fertilizers, chemicals, manure, fuel, electricity, irrigation water) and outputs (grape yield) were quantified per hectare. These values were then multiplied by the corresponding energy equivalent coefficients to determine the total energy input and output. Energy equivalents of the inputs and output were converted into energy per unit area (
Table 1). The energy equivalent for machinery was calculated using Equation (2) [
17,
20]:
where:
ME is the machinery energy (MJ h−1);
E is the equivalent energy for machinery production (e.g., 62.7 MJ kg−1 for tractor);
G is the weight of machine (kg);
T is the economic life of machine (h).
By following these methodologies, the study provided a comprehensive analysis of energy use and economic efficiency in grape production systems in Takestan County, Qazvin Province, Iran.
Based on the energy equivalents of the inputs and output (
Table 1), the energy ratio (energy use efficiency), energy productivity, specific energy, net energy, and energy intensiveness were calculated as follows [
21,
28,
29]:
2.4. Analysis of Energy Using Mathematical Models
We applied different mathematical functions to estimate the relationship between energy inputs and yield. The Cobb–Douglas production function provided more accurate estimates, demonstrating superior statistical significance compared to the linear, linear–logarithmic, logarithmic–linear, and second-degree polynomial functions. This function has been used by a number of authors to examine the relationship between energy inputs and yield [
24,
29]. The Cobb–Douglas production function is expressed as:
This function can be reformulated as follows:
where
denotes the yield of the ith farm,
is the vector of inputs used in the production process,
is a constant term,
represents coefficients of inputs which are estimated from the model, and
is the error term.
Assuming that yield is a function of energy inputs, Equation (9) can be expanded to Equation (10) as follows:
where
,
,
, and
are chemicals, fertilizer, human labor, and water for irrigation energies, respectively.
In addition to the influence of each energy input on grape yield, the Cobb–Douglas function evaluates the impact of direct, indirect, renewable, and non-renewable forms of energy on grape yield as [
21,
24,
29]:
where
is the
ith farm yield,
and
are coefficients of exogenous variables,
DE,
IDE,
RE, and
NRE are the direct, indirect, renewable, and non-renewable energy, respectively, used for grape production, and
is the error term.
In production economics, returns-to-scale (RTS) refer to variations in output following a proportional adjustment in all inputs, wherein all inputs increase by a constant factor. In the Cobb–Douglas production function, it is indicated by the sum of the elasticities derived in the form of regression coefficients. If the sum of the coefficients is greater than unity (), it can be concluded that there are increasing returns-to-scale (IRS) which means that an increase in inputs results in an increase in output in greater proportion than the increase in input. If the function is less than unity (1), it indicates a decreasing returns-to-scale (DRS) ratio, which means that an increase in output that is less than the increase in input. If the result is unity (1), it indicates a constant returns-to-scale ratio; this implies that the change in inputs results in constant output.
We evaluated the sensitivity of grape yield to energy input using marginal physical productivity (MPP), which is derived from the response coefficients of the inputs. MPP measures changes in output relative to changes in input, with other inputs held constant at their average values. A positive MPP indicates that increasing the input leads to higher output, while a negative MPP suggests that increasing the input reduces output [
30]. The MPP for inputs was computed using regression coefficients as described by [
30,
31,
32]:
where
is the marginal physical productivity of the
jth input,
is the regression coefficient of the
jth input, GM(Y) is the geometric mean of the yield, and GM(Xj) is the geometric mean of the
jth energy input.
The last part of this study was an economic analysis that calculated the gross return, net return, benefit-to-cost ratio, and productivity for grape production as [
21,
24,
29]:
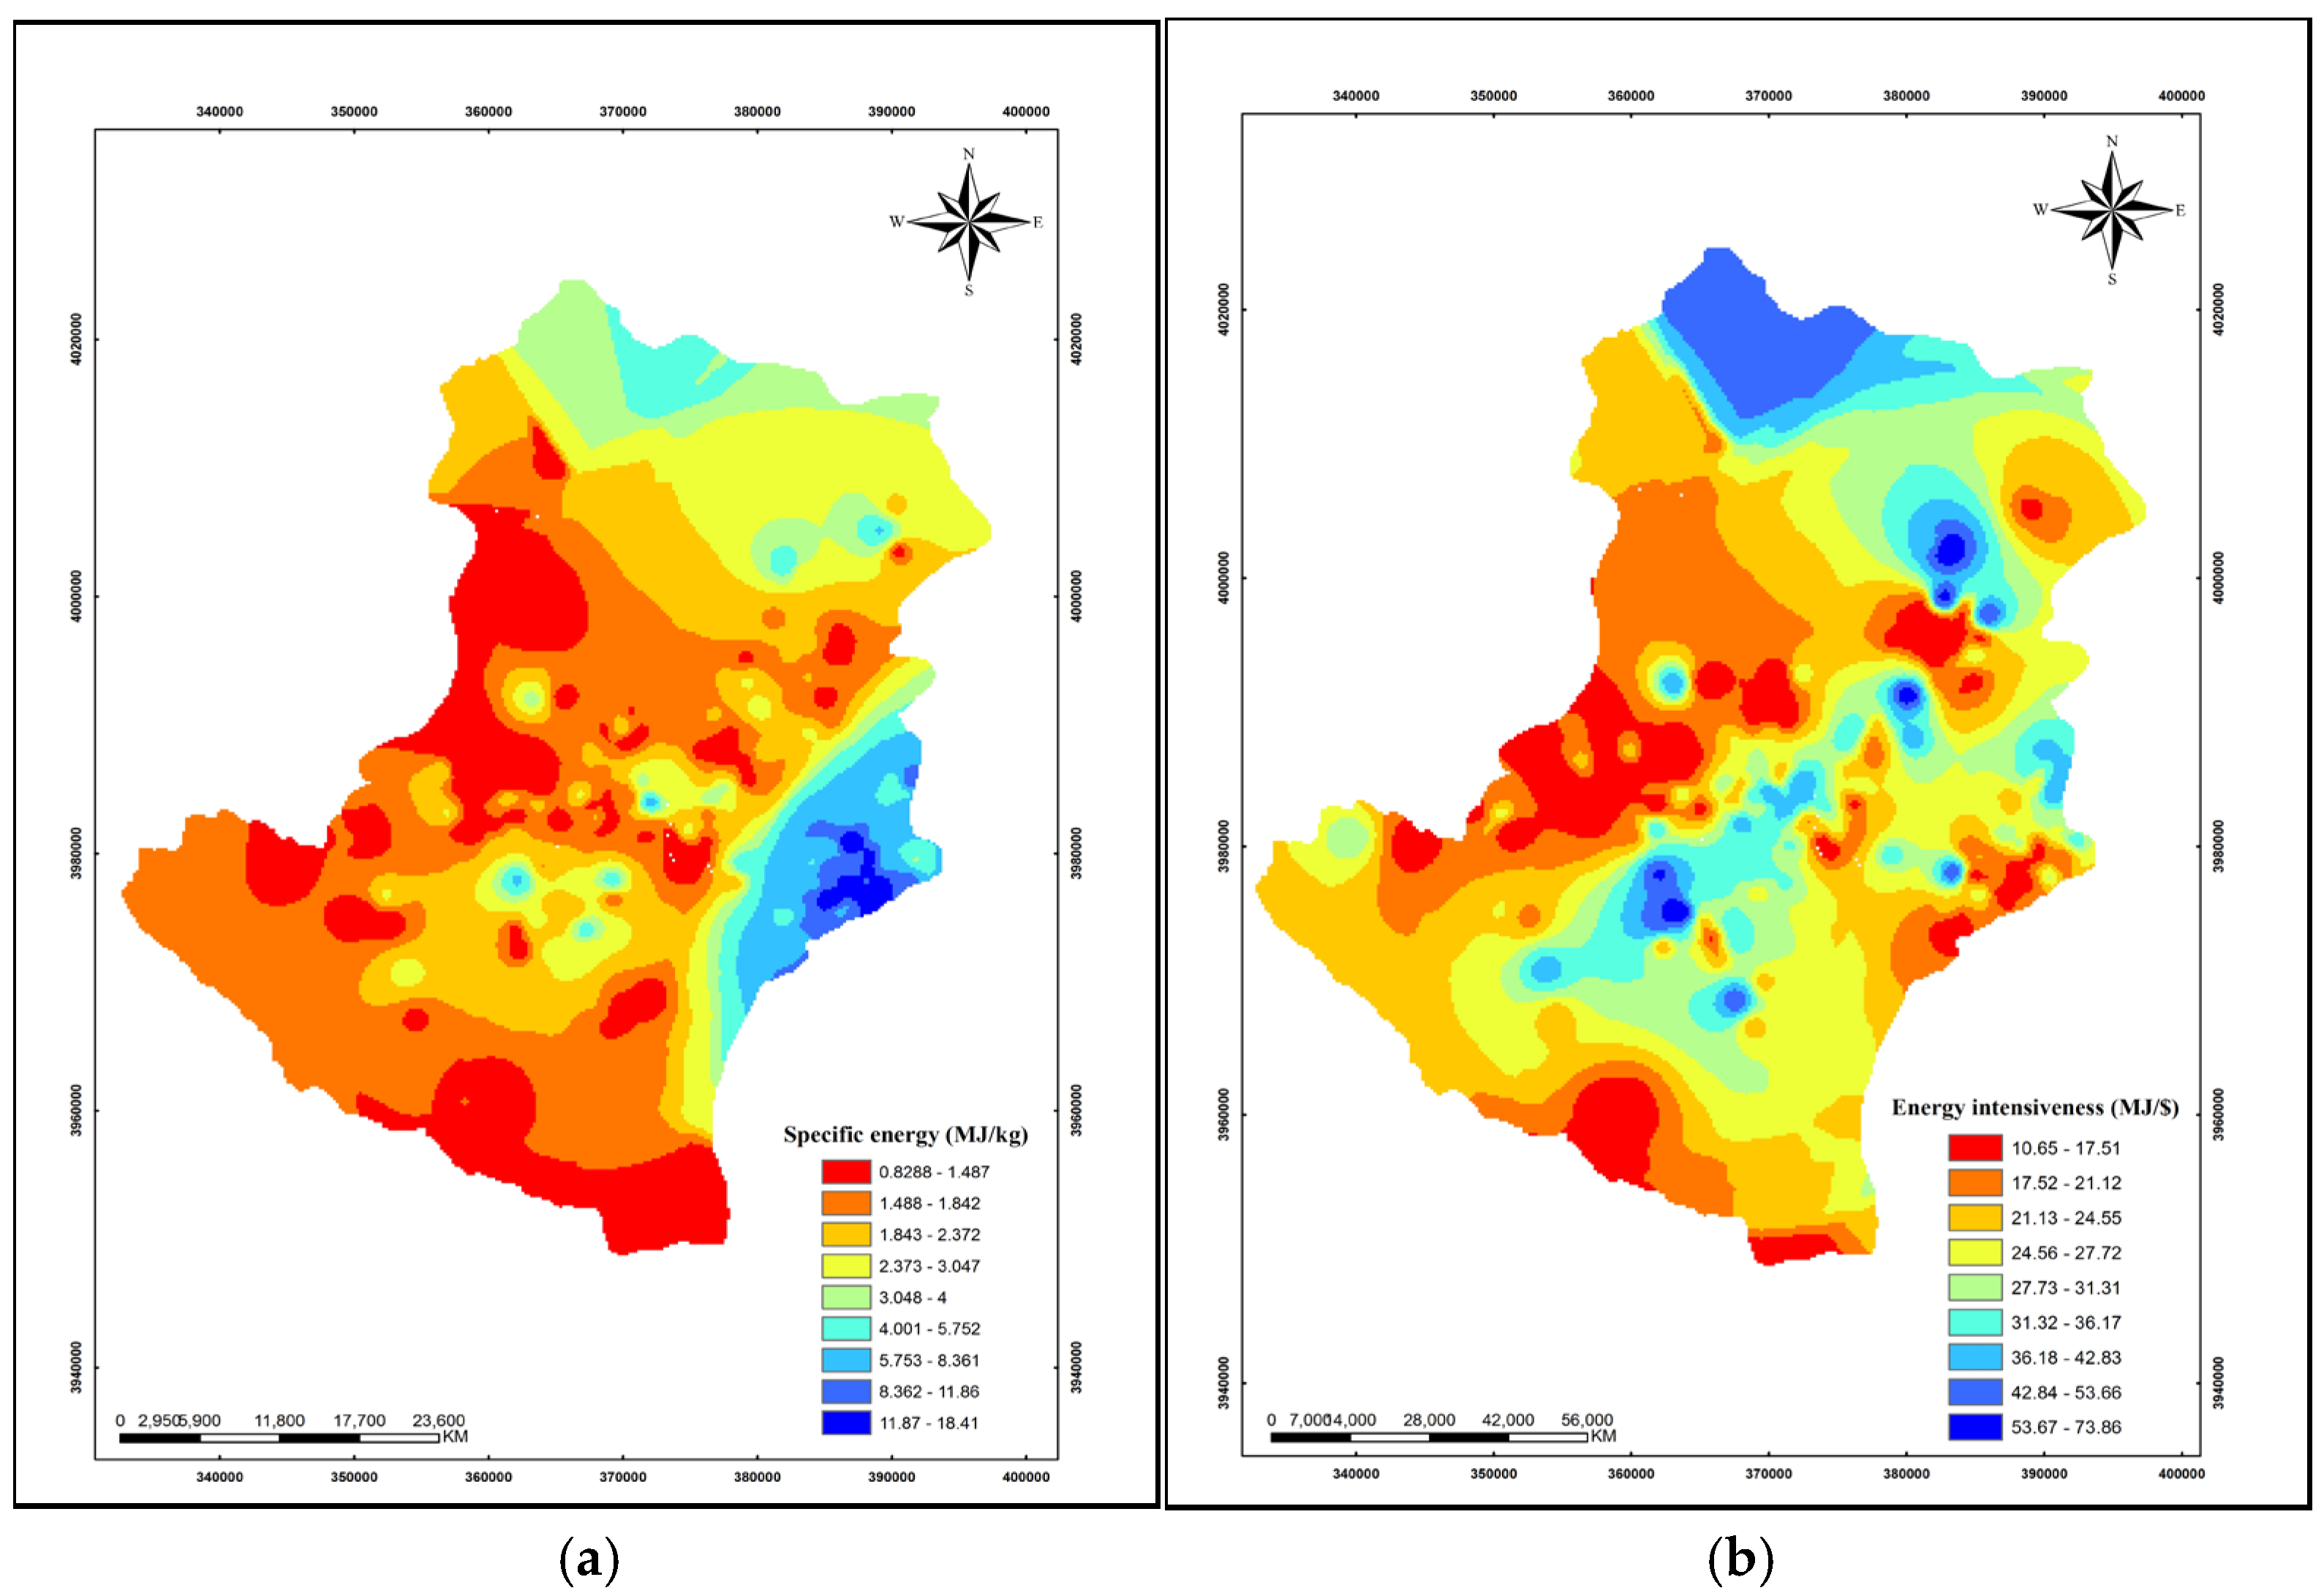
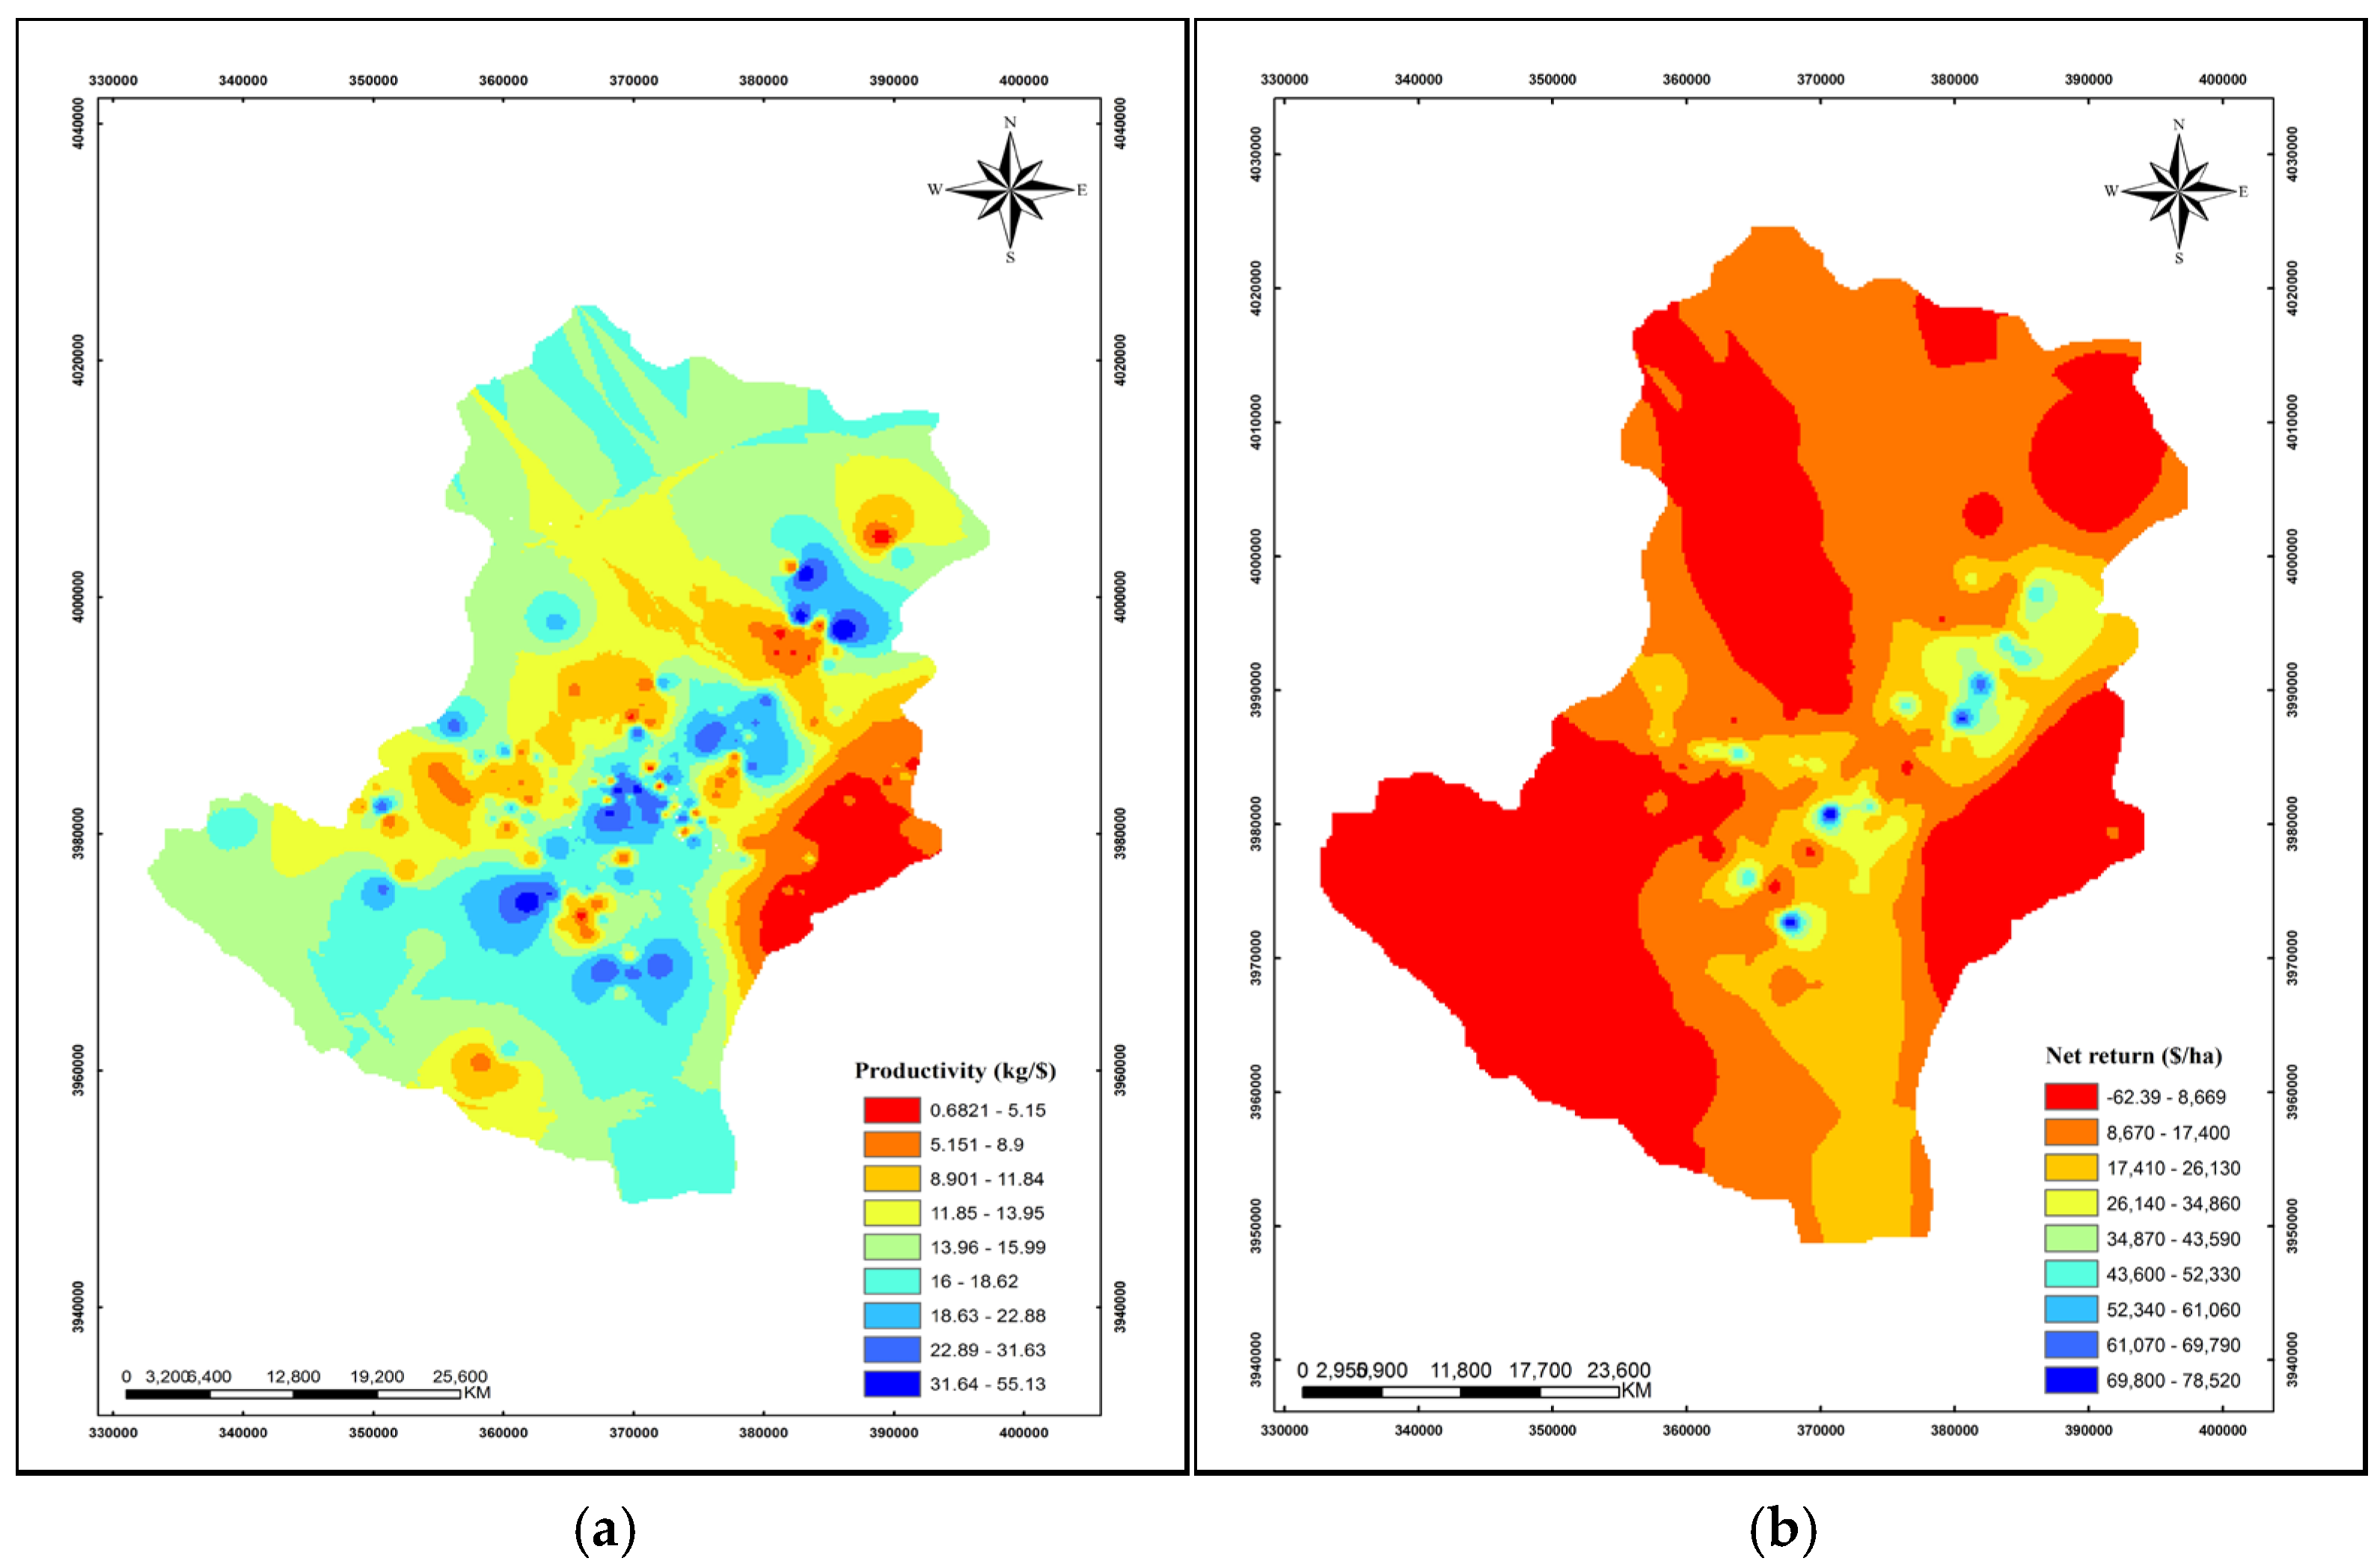
Basic information on energy and cost inputs, energy and economic indices, and grape yield were entered into Excel, Shazam 9.0, and SPSS 20 software programs. Additionally, the Geographic Information System (GIS) was utilized to map the energy flow indices in grape systems for the study area. The energy flow for each location was imputed into ArcGIS 10.3 software and assigned an identification number (ID) in the attribute table. Spatial interpolation using the Inverse Distance Weighted (IDW) method was employed to generate spatial distribution maps of the different energy indices.
IDW is an interpolation technique in which estimates are made based on values at nearby locations weighted by their distance from the interpolation point [
33]. The significance of known points can be adjusted by changing the values of two coefficients: (a) the power (exponent) and (b) the radius object. A larger power means that nearby data have a greater influence, resulting in a more detailed interpolated surface. A common value for power, which is a positive real number, is 2. The radius object can be variable or fixed, limiting the number of known points used in the interpolation [
34].
The equation used by IDW to estimate a value z(x) at an unknown point is given by:
where:
z(x) is the estimated value at point xxx;
zi is the known value at point iii;
di is the distance between point xxx and point iii;
p is the power parameter;
N is the number of known points.
By using these methodologies and tools, the study effectively analyzed and visualized the spatial distribution of energy use and economic efficiency in grape production systems in Takestan County, Qazvin Province, Iran.
4. Conclusions
Energy management is a prerequisite for the economic viability and success of vegetable growing and processing. Efficient energy use enables farmers to enhance productivity, reduce waste, and lower overall energy demand, directly contributing to cost savings and profitability [
41]. This study’s model integrates the energy pyramid framework and econometric analysis to assess energy flow and economic efficiency in grape production, distinguishing it from conventional models. It commences with an energy audit, followed by energy conservation, energy efficiency, and finally renewable energy [
42]. This approach aims to optimize resource use, lowers production costs, and offers a baseline for sustainable energy management in agriculture, particularly in resource-constrained regions like Takestan, Iran.
Relatively, the energy pyramid was used to develop an Agricultural Energy Management Plan for grape orchards, including strategies for energy conservation, efficiency, and economic viability. Field operations such as tractor and implement use, pesticide, herbicide, and fertilizer applications, and irrigation water management were assessed to gain energy indices. Based on the results, strategies to address on-farm energy problems and opportunities for energy conservation and efficiency were recommended.
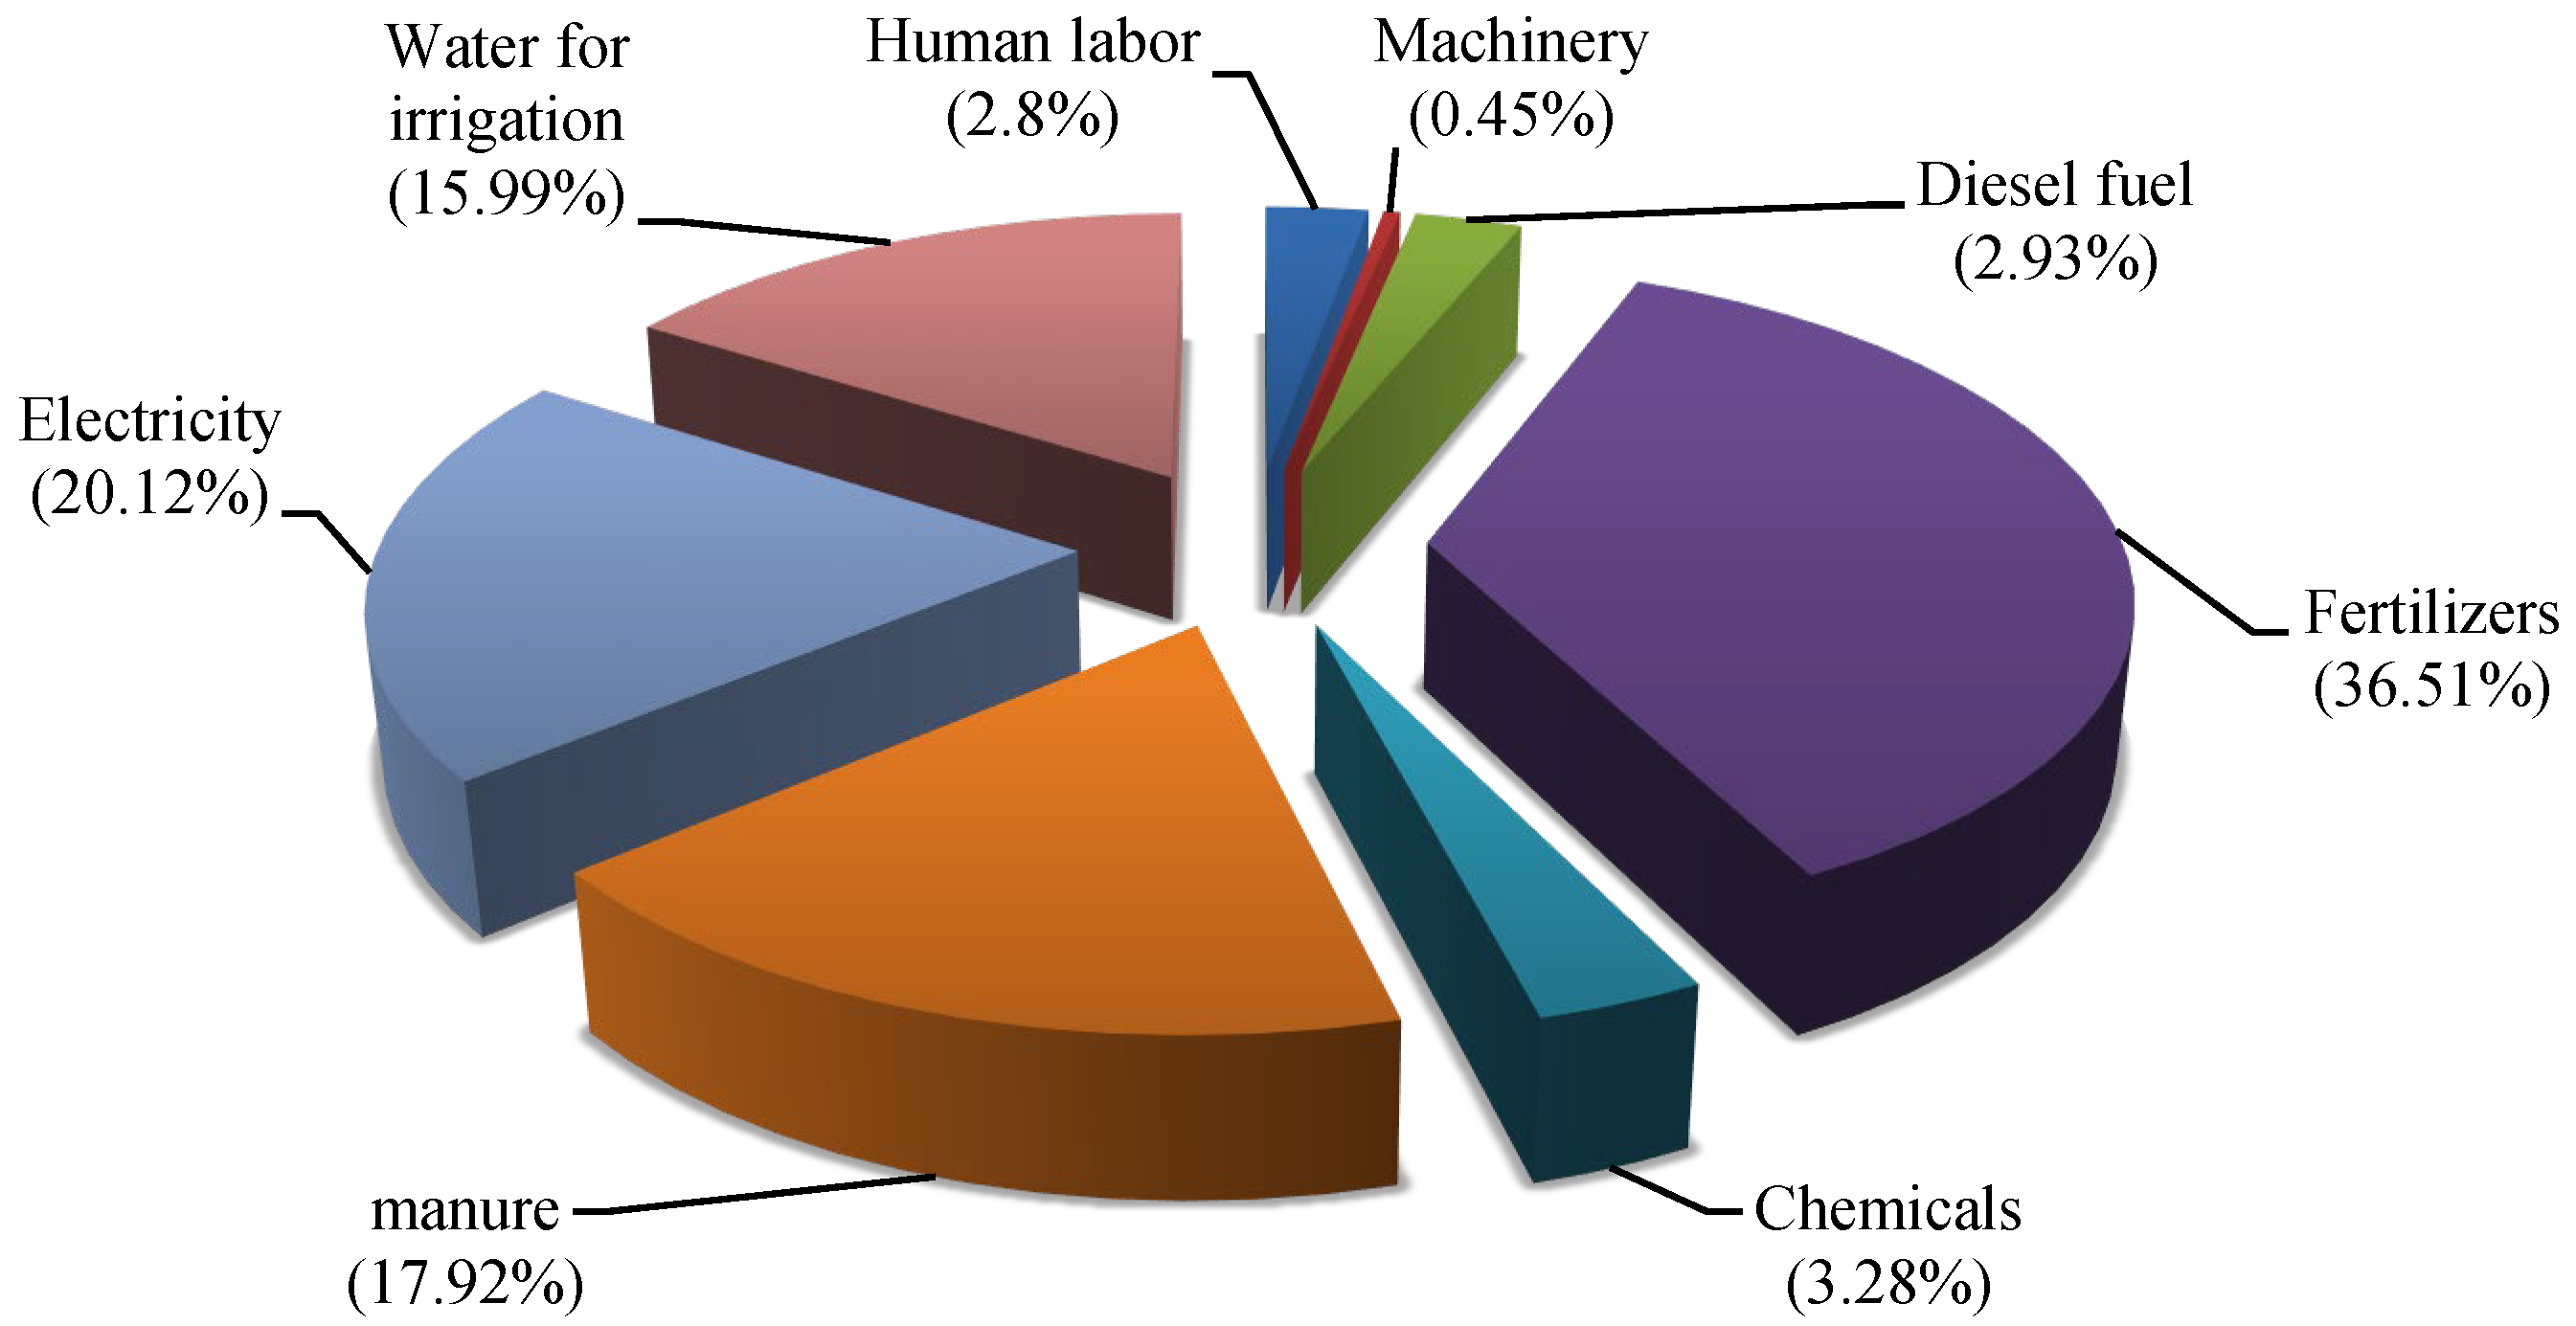
The results revealed that grape production systems consume a total energy of 40.6 GJ ha
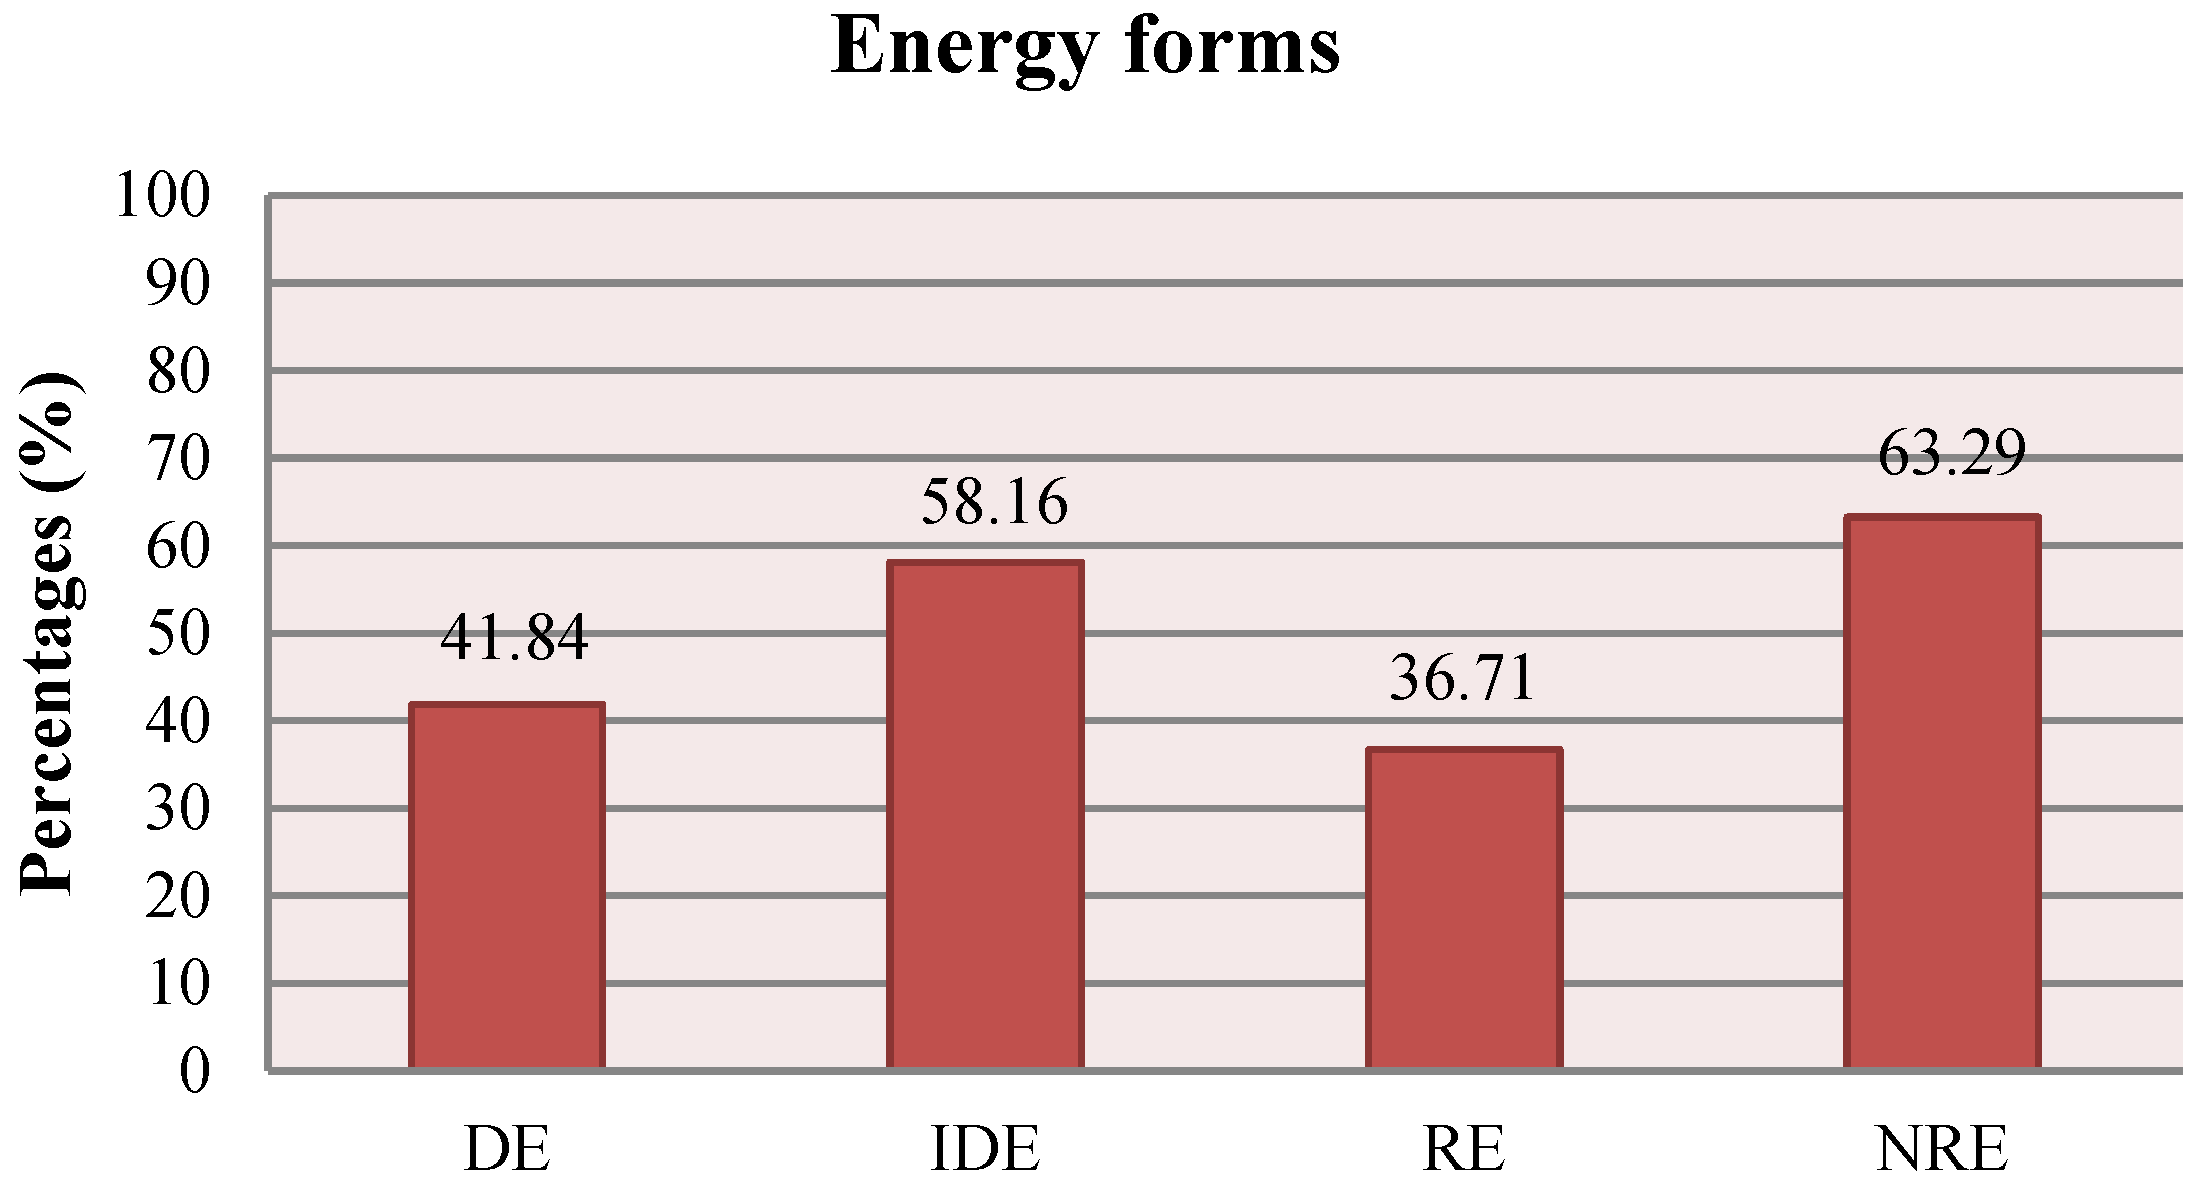
−1. Chemical fertilizers accounted for the highest energy consumption (36.51%), followed by electricity (20.1%). The average total energy input as direct, indirect, renewable, and non-renewable energy forms was calculated as 16.9, 23.6, 14.9, and 25.7 GJ ha
−1, respectively. Indirect and non-renewable energy usage was higher than direct and renewable energy usage, indicating a mismatch between inputs, equipment capacity, and user requirements. Optimization of resource use is necessary to achieve a positive energy balance [
41]. Optimizing these aspects is crucial not only for achieving a positive energy balance but also for improving the economic viability of grape production systems by reducing production costs and maximizing returns.
The total energy output of the grape production system was USD 236 ha−1. The energy ratio, energy productivity, specific energy, net energy, and energy intensiveness were 5.81, 0.49 kg MJ−1, 2.03 MJ kg−1, 195.4 kg MJ−1, and USD 24.71 MJ kg−1, respectively. Grape production appears efficient in terms of energy consumption on surveyed orchards, with a benefit-to-cost ratio of 9.61, mean net return of USD 14,159.67 ha−1, and productivity level of USD 12.17 kg−1. Grape production systems convert weight to energy more efficiently than other products like strawberries, greenhouse cucumbers, and apples. However, the southern and central parts of Takestan were less profitable, underscoring the labor-intensive nature of conventional grape production practices.
The results indicate that labor force energy was the dominant input in grape production [
43]. Other key inputs included water for irrigation (0.26 elasticity), chemicals (0.17 elasticity), and fertilizers (0.15 elasticity). The impacts of DE, IDE, RE, and NRE on yield were 0.55, 0.11, 0.56, and 0.24, respectively, indicating that grape production practices are labor-intensive with conventional approaches.
In conclusion, while grape production systems are economically viable, energy inefficiencies and conventional practices undermine their full potential. Implementing a comprehensive energy management plan—focusing on energy conservation, efficiency improvements, and the integration of renewable energy sources—can significantly enhance both economic viability and sustainability. However, this study had some limitations. Economic and energy factors were integrated due to difficulties in separating them caused by data constraints, and certain costs, such as labor-related care costs, were excluded due to overlap with other costs. Statistical analysis was limited, but a sensitivity analysis was conducted to ensure result reliability. Lastly, the sample size farmers in study area and may not be fully representative of Iranian farmers, and nd future studies could benefit from a broader sample and more detailed statistical analysis of economic and energy factors separately. Given these limitations, recommended strategies include those outlined below.
4.1. Matching Energy Usage to Requirements
Mismatch between equipment capacity and user requirements often leads to inefficiencies. Simple behavioral changes can significantly impact fuel and electricity usage. Measures include:
Aligning irrigation schedules with crop water requirements to minimize waste;
Matching tractor and implement combinations for optimal output;
Using new cultivars from selective breeding programs for standard grape production;
Reducing strain on the electric system by using efficient electrical motors for irrigation;
With farmers averaging 47 years old and labor being the dominant input in grape production, integrating education, mechanization, and efficient irrigation is essential for sustaining productivity in Iran’s resource-constrained agriculture.
4.2. Maximizing System Efficiency
Efficient operation of equipment through best practices and technology adoption promotes energy efficiency and reduces non-renewable energy footprints [
20]. Measures include:
Using biological and physical methods to reduce chemical fertilizer energy;
Adopting integrated nutrient management to decrease chemical fertilizer energy;
Using drip irrigation instead of flood irrigation;
Redesigning grape orchards with modern planting systems;
Regular maintenance of refrigeration equipment;
Using biomass energy sources and reduced tillage practices;
Reducing tractor idling time.


